using the google maps api for flow visualization it your own • generate info window popups •...
TRANSCRIPT

© 2007 Carnegie Mellon University 1
© 2007 Carnegie Mellon University
Using the Google Maps API for Flow VisualizationWhere on Earth is my Data?
Sid FaberNetwork Situational Awareness [email protected]
© 2007 Carnegie Mellon University 2
2© 2007 Carnegie Mellon University
Agenda• Step 1: Extracting Flow Data• Step 2: Geolocation• Step 3: Convert to XML• Aside: The Google Maps API• Step 4: The HTML Page

© 2007 Carnegie Mellon University 3
3© 2007 Carnegie Mellon University
Data Used for DemoSC06 Data Set
• November 14, 2006• Goal is to look at who talked to whom

© 2007 Carnegie Mellon University 4
4© 2007 Carnegie Mellon University
Step 1: Extracting Flow Data

© 2007 Carnegie Mellon University 5
5© 2007 Carnegie Mellon University
Extracting Flow DataWhat story do you want to tell with geolocation?
• Traffic source or destination— Data record = one value per address
• Relations between addresses— Data record = one value per source, destination address pair

© 2007 Carnegie Mellon University 6
6© 2007 Carnegie Mellon University
Extracting Flow Data: SiLK ExampleTraffic destination
$ rwfilter --start=2006/11/14--proto=0-255--class=all --pass=stdout| rwuniq--fields=dip --bytes > dst.txt
140.221.159.103 12568504471655
172.30.5.11 11381325217792
172.30.6.11 7397483692032
© 2007 Carnegie Mellon University 7
7© 2007 Carnegie Mellon University
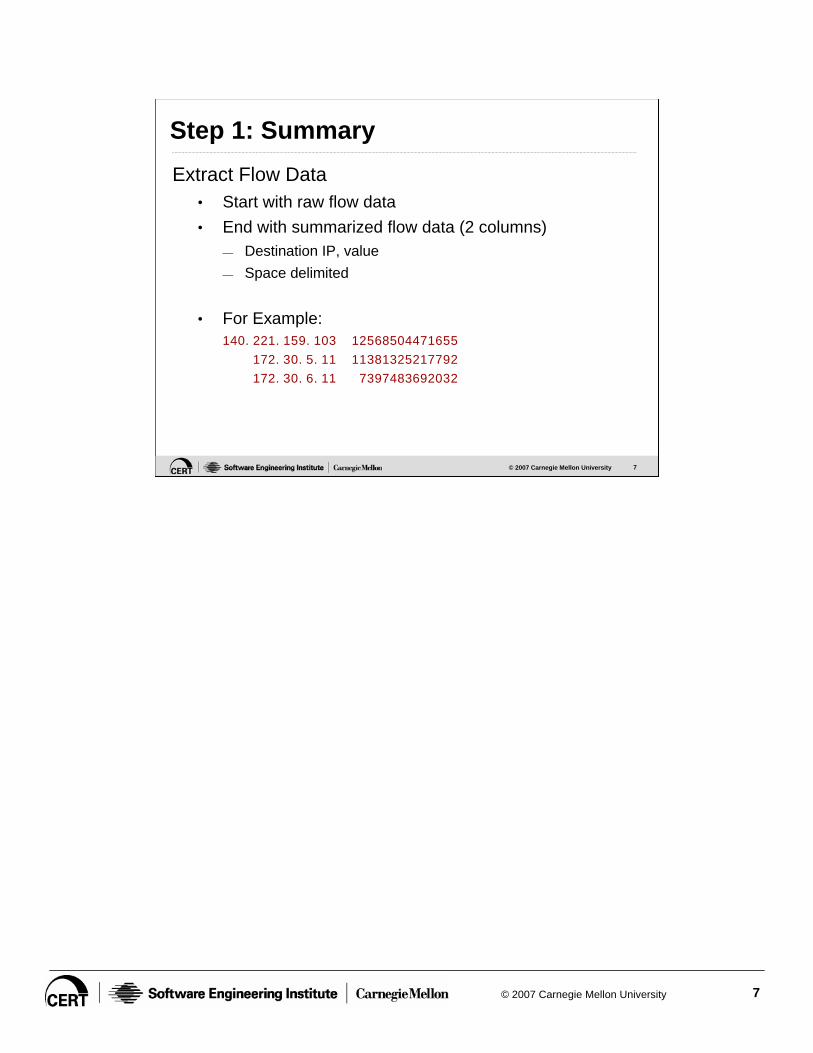
Step 1: SummaryExtract Flow Data
• Start with raw flow data• End with summarized flow data (2 columns)
— Destination IP, value— Space delimited
• For Example:140.221.159.103 12568504471655
172.30.5.11 11381325217792
172.30.6.11 7397483692032

© 2007 Carnegie Mellon University 8
8© 2007 Carnegie Mellon University
Step 2:Geolocating IP Addresses

© 2007 Carnegie Mellon University 9
9© 2007 Carnegie Mellon University
Geolocating by CountryMap IP to Country: IPligence, http://www.ipligence.com
"0000000000","0033554431","US","UNITED STATES","NA"...
"0033554432","0050331647","DE","GERMANY","EU","EUROPE"
Map Country to Lat/Long: MaxMind, http://www.maxmind.com/app/country_latlon
US,38.0000,-97.0000
DE,51.0000,9.0000
Combine IP-to-Lat/Long Mapping0000000000 0033554431 US 38.0000 -97.0000
0033554432 0050331647 DE 51.0000 9.0000
0050331648 0067108863 HK 22.2500 114.1667
Numeric IP

© 2007 Carnegie Mellon University 10
10© 2007 Carnegie Mellon University
Geolocating by AddressesDNS LOC
$ host -t LOC cmu.edu
cmu.edu LOC 40 26 39.000 N 79 56 36.200 W 283.00m ...
Caida Netgeo$ wget http://netgeo.caida.org/perl/netgeo.cgi \?target=128.2.10.162...TARGET: 128.2.10.162<br>NAME: CMU-NET<br>NUMBER: 128.2.0.0 - 128.2.255.255<br>LAT: 40.44<br>LONG: -79.95<br>...
Hostip.info, http://www.hostip.info/dl/index.html
© 2007 Carnegie Mellon University 11
11© 2007 Carnegie Mellon University
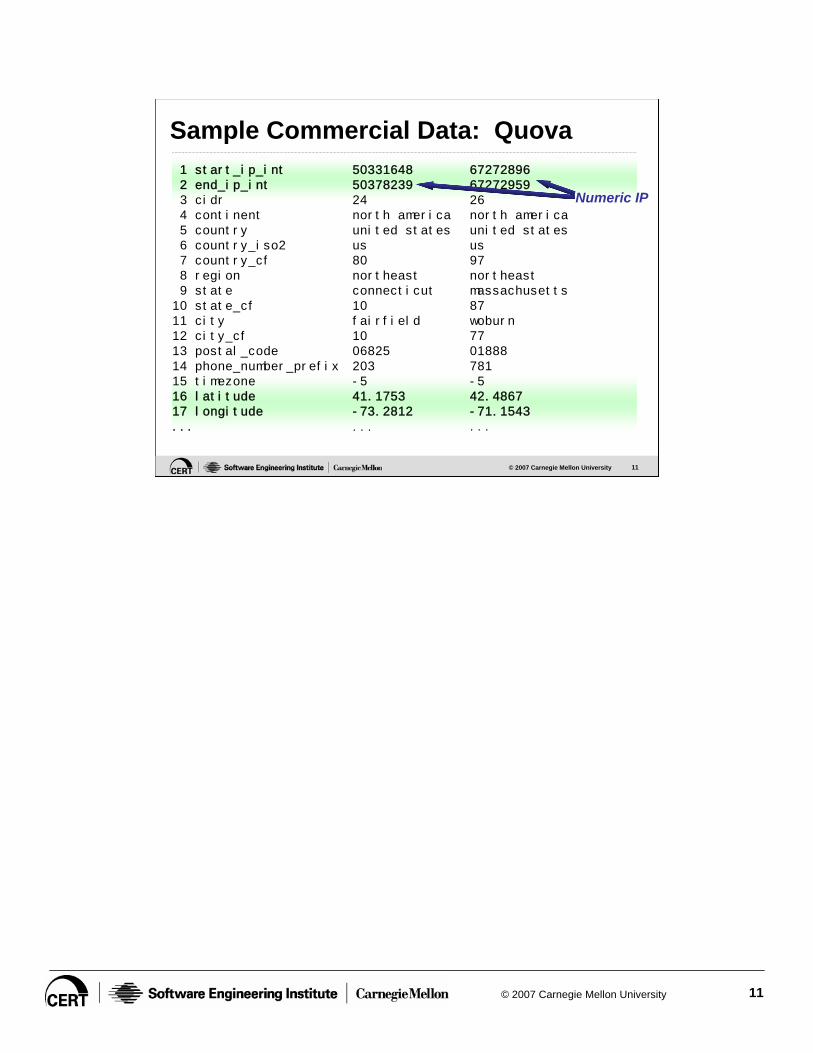
Sample Commercial Data: Quova1 start_ip_int2 end_ip_int3 cidr4 continent5 country6 country_iso27 country_cf8 region9 state10 state_cf11 city12 city_cf13 postal_code14 phone_number_prefix15 timezone16 latitude17 longitude...
503316485037823924north americaunited statesus80northeastconnecticut10fairfield1006825203-541.1753-73.2812...
672728966727295926north americaunited statesus97northeastmassachusetts87woburn7701888781-542.4867-71.1543...
Numeric IP

© 2007 Carnegie Mellon University 12
12© 2007 Carnegie Mellon University
2828
393955
2222
Add location to data and regroupPerl-fu pseudocode:
Read location data into a lookup table
For each line of data {
Extract IP and [value]
Find lat,long coordinates for IP
Create a bin for the coordinates and add [value]
}
Print out the bins
221717552626
22221212
12.4.8.12033.7.150.8
92.155.168.04.0.55.2
12.178.6.5524.168.15.130
Perl-fu

© 2007 Carnegie Mellon University 13
13© 2007 Carnegie Mellon University
Geolocating with SiLK pmapsPrefix maps associate a value with an IP address prefix
• Text based pmap:#Start-IP End-IP CC Lat Long
0033554432 0050331647 DE 51.0000 9.0000
0050331648 0067108863 HK 22.2500 114.1667
pmap value

© 2007 Carnegie Mellon University 14
14© 2007 Carnegie Mellon University
Building the Geolocation pmap
Some perl-fu:
read countrylatlng.txt into a hash
foreach line in the ipligence data set {
look up the countrylatlng.txt line for the code
print out the ip range, country code and coordinates
}
• See make-geo-cc-pmap.pl in the sample code

© 2007 Carnegie Mellon University 15
15© 2007 Carnegie Mellon University
Using the Geolocation pmapUse the pmap with rwuniq:
$ rwfilter \
--start=2006/11/14 \
--proto=0-255 \
--class=all --pass=stdout \
| rwuniq \
--pmap-file=geo-cc.pmap \
--fields=dval --bytes --delimited=" " --no-titles \
> geo-dst.txt
US 38.0000 -97.0000 102372319236580
JP 36.0000 138.0000 9965004709495
CA 60.0000 -95.0000 569989239278

© 2007 Carnegie Mellon University 16
16© 2007 Carnegie Mellon University
Step 2: SummaryGeolocate Flow Data
• Start with summarized flow data• End with location data (4 columns)
— Destination label, latitude, longitude, value— Space delimited— SiLK pmaps combine steps 1 and 2
• For example:
US 38.0000 -97.0000 102372319236580
JP 36.0000 138.0000 9965004709495
CA 60.0000 -95.0000 569989239278

© 2007 Carnegie Mellon University 17
17© 2007 Carnegie Mellon University
Step 3:Convert to XML
© 2007 Carnegie Mellon University 18
18© 2007 Carnegie Mellon University
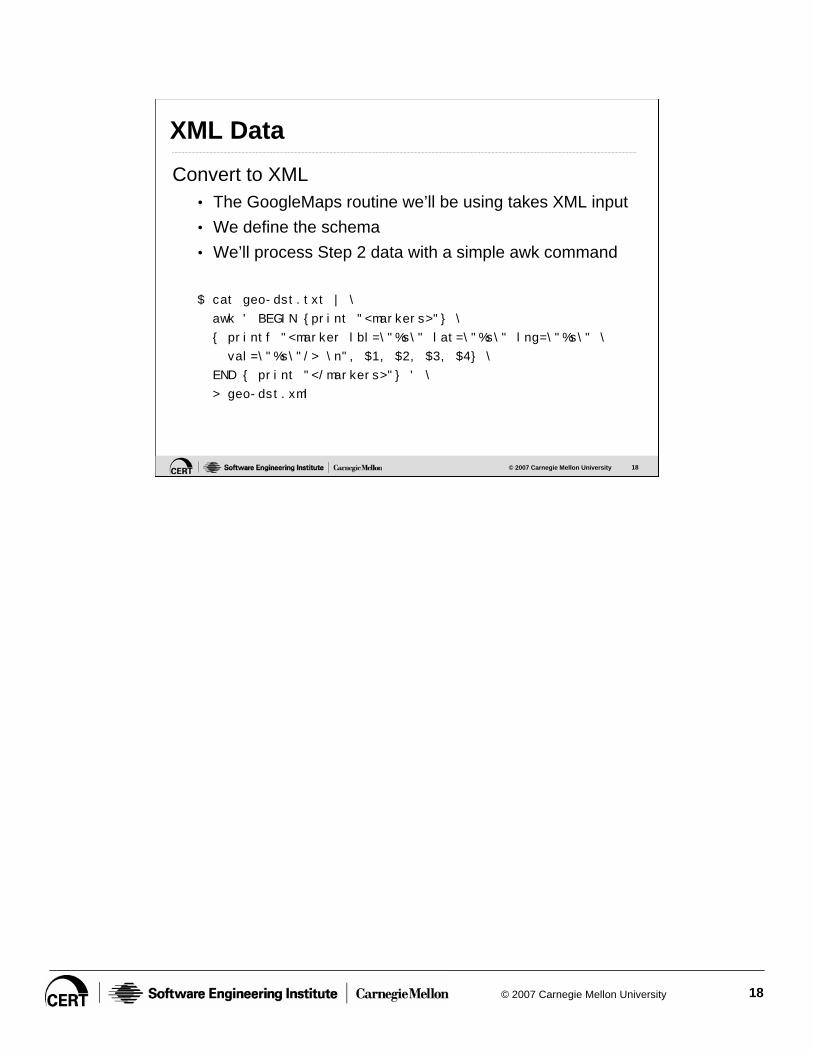
XML DataConvert to XML
• The GoogleMaps routine we’ll be using takes XML input• We define the schema• We’ll process Step 2 data with a simple awk command
$ cat geo-dst.txt | \
awk ' BEGIN {print "<markers>"} \
{ printf "<marker lbl=\"%s\" lat=\"%s\" lng=\"%s\" \
val=\"%s\"/> \n", $1, $2, $3, $4} \
END { print "</markers>"} ' \
> geo-dst.xml

© 2007 Carnegie Mellon University 19
19© 2007 Carnegie Mellon University
Step 3: SummaryConvert to XML
• Start with labels, coordinates and values• End with XML document with the same data
• For example:
<markers>
<marker lbl="CN" lat="35.0000" lng="105.0000“ val="704206"/>
<marker lbl="MR" lat="20.0000" lng="-12.0000" val="200"/>
<marker lbl="KN" lat="17.3333" lng="-62.7500" val="646"/>
</markers>

© 2007 Carnegie Mellon University 20
20© 2007 Carnegie Mellon University
Aside:The Google Maps API

© 2007 Carnegie Mellon University 21
21© 2007 Carnegie Mellon University
Map Control
Marker
Google Maps WidgetsInfo Window
Zoom Control
Type Control
Overview Map Control

© 2007 Carnegie Mellon University 22
22© 2007 Carnegie Mellon University
Google Maps API Fundamentalshttp://code.google.com/apis/maps/documentation/
• Very well documented, lots of examples• Start simple (like this demo)• Requires very basic javascript and HTML knowledge
General flow:• Include the source code• Create the map• Drop markers onto the map
© 2007 Carnegie Mellon University 23
23© 2007 Carnegie Mellon University
About keys and dataIn order to include the library source, you need a key
• The key uniquely identifies your URL• Not necessary when serving via a file:// URL
Doesn’t the data get posted up to Google?• No, Google only sees you requests for the underlying
map images• All marker placement and labeling is done local to the
client with overlays

© 2007 Carnegie Mellon University 24
24© 2007 Carnegie Mellon University
Step 4:The HTML Page

© 2007 Carnegie Mellon University 25
25© 2007 Carnegie Mellon University
geo-dst.html (part 1)<html><head><title>IP Geolocation Example</title>
<script src="http://maps.google.com/maps?file=api&v=2&key="
type="text/javascript"></script>
<script type="text/javascript">
// This is the file that contains the point data
var map;
var xmlFile = "geo-dst.xml";
// Called when the map is loaded. This function
// creates the map, adds controls to it, and then
// the points are laid on top of the map
function load() {
if (GBrowserIsCompatible()) {
map = new GMap2(document.getElementById("map"));
map.addControl(new GLargeMapControl());
map.addControl(new GOverviewMapControl());
map.addControl(new GMapTypeControl());
map.setCenter(new GLatLng(38, -97), 1);
loadpoints();
}
}

© 2007 Carnegie Mellon University 26
26© 2007 Carnegie Mellon University
geo-dst.html (part 2)// http://code.google.com/apis/maps/documentation/services.html#XML_Requests
function loadpoints() {
GDownloadUrl(xmlFile, function(data, responseCode) {
var xml = GXml.parse(data);
var markers = xml.documentElement.getElementsByTagName("marker");
for (var i = 0; i < markers.length; i++) {
var point = new GLatLng(parseFloat(markers[i].getAttribute("lat")),
parseFloat(markers[i].getAttribute("lng")));
descr = markers[i].getAttribute("lbl")+"; "+markers[i].getAttribute("val");
map.addOverlay(new GMarker(point, {title:descr, clickable:false }));
}
});
}
</script></head>
<body onload="load()" onunload="GUnload()"><h2>IP Geolocation Example</h2>
<div id="map" style="width: 640px; height: 480px"></div>
</body>
</html>

© 2007 Carnegie Mellon University 27
27© 2007 Carnegie Mellon University
The Results...

© 2007 Carnegie Mellon University 28
28© 2007 Carnegie Mellon University
Customizing Marker IconsTwo modifications needed
• Define the different icons upon initialization• Choose the icon when points are added

© 2007 Carnegie Mellon University 29
29© 2007 Carnegie Mellon University
geo-dst-v2.html (part 1)...
function load() {
if (GBrowserIsCompatible()) {
map = new GMap2(document.getElementById("map"));
map.addControl(new GLargeMapControl());
map.addControl(new GOverviewMapControl());
map.addControl(new GMapTypeControl());
map.setCenter(new GLatLng(38, -97), 1);
//create different pinssredicon.image = "green-s.png";sredicon.shadow = "shadow-s.png";sredicon.iconSize = new GSize(8, 13);sredicon.shadowSize = new GSize(14, 13);sredicon.iconAnchor = new GPoint(4, 12);sredicon.infoWindowAnchor = new GPoint(5, 1);
mredicon.image = "red-m.png";mredicon.shadow = "shadow-m.png";mredicon.iconSize = new GSize(12, 20);
...
loadpoints();
}
}

© 2007 Carnegie Mellon University 30
30© 2007 Carnegie Mellon University
geo-dst-v2.html (part 2)// http://code.google.com/apis/maps/documentation/services.html#XML_Requests
function loadpoints() {
GDownloadUrl(xmlFile, function(data, responseCode) {
var xml = GXml.parse(data);
var markers = xml.documentElement.getElementsByTagName("marker");
for (var i = 0; i < markers.length; i++) {
var point = new GLatLng(parseFloat(markers[i].getAttribute("lat")),
parseFloat(markers[i].getAttribute("lng")));
...
var ratio = Math.log ( parseFloat(markers[i].getAttribute("val")) /minval) / Math.log (maxval / minval) ;
//// Plot the pin corresponding to the logarithmic ratio//if (ratio < 0.2) {map.addOverlay(new GMarker(pointlist[i], {icon:sredicon, title:de...
} else if (ratio < 0.9) {map.addOverlay(new GMarker(pointlist[i], {icon:mredicon, title:de...
} else {map.addOverlay(new GMarker(pointlist[i], {icon:lredicon, title:de...
}
}
...

© 2007 Carnegie Mellon University 31
31© 2007 Carnegie Mellon University
The Results...

© 2007 Carnegie Mellon University 32
32© 2007 Carnegie Mellon University
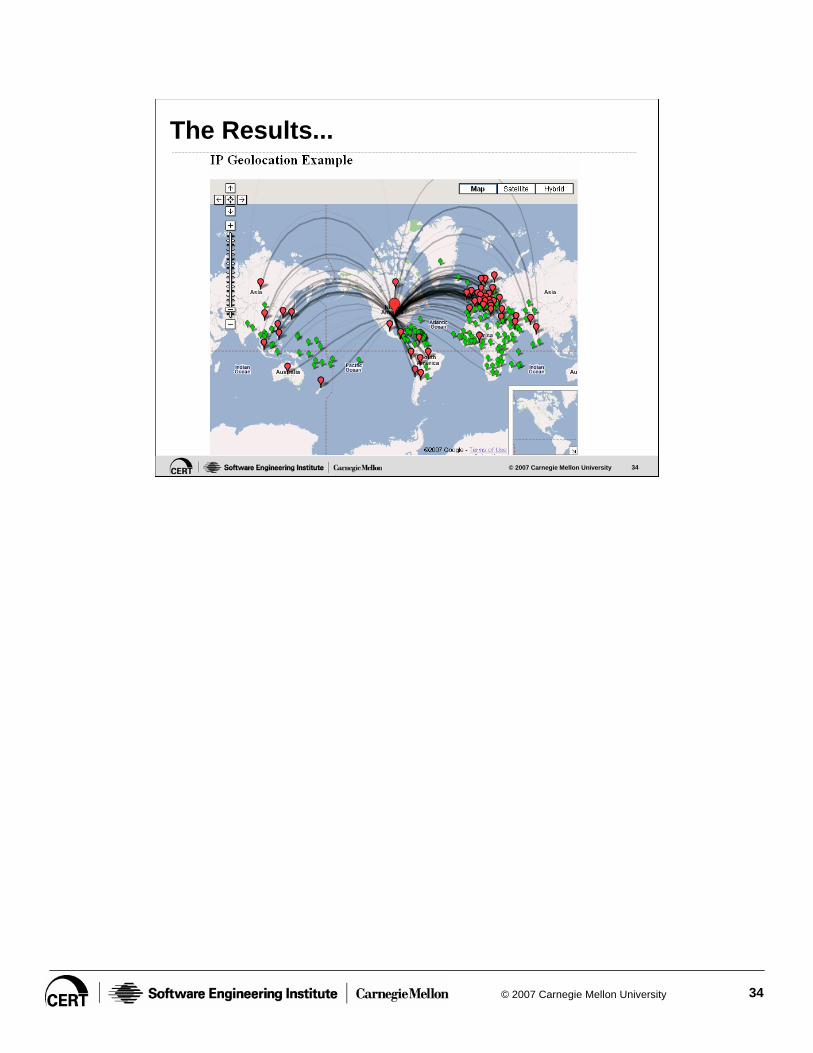
Adding LinksNeed a new data set
• Create an XML file with source location, destination location and value
• Add a new function to read and plot the data file

© 2007 Carnegie Mellon University 33
33© 2007 Carnegie Mellon University
geo-dst-v3.htmlfunction loadlinks() {
GDownloadUrl(xmlFile, function(data, responseCode) {
...
var slink = new GLatLng(parseFloat(links[i].getAttribute("slat")),
parseFloat(links[i].getAttribute("slng")));
var elink = new GLatLng(parseFloat(links[i].getAttribute("elat")),
parseFloat(links[i].getAttribute("elng")));
map.addOverlay (new GPolyline ([slink, elink], "#000000", ratio * 5, ratio / 2, {geodesic:true}));
...
OpacityColor
Thickness
© 2007 Carnegie Mellon University 34
34© 2007 Carnegie Mellon University
The Results...

© 2007 Carnegie Mellon University 35
35© 2007 Carnegie Mellon University
Where to go from hereMake it your own
• Generate info window popups• Drag markers• Add driving directions
See http://code.google.com/apis/maps/
Download sample code from the training server (128.2.243.104) in /home/sfaber/presentation
© 2007 Carnegie Mellon University 36
© 2007 Carnegie Mellon University
Using the GoogleMaps API for Flow VisualizationWhere on earth is my data?
Sid FaberNetwork Situational Awareness [email protected]
Download sample code from the training server (128.2.243.104)in directory /home/sfaber/presentation