using the gluten peak tester as a tool to measure physical properties of gluten
TRANSCRIPT

at SciVerse ScienceDirect
Journal of Cereal Science 56 (2012) 561e567
Contents lists available
Journal of Cereal Science
journal homepage: www.elsevier .com/locate/ jcs
Using the Gluten Peak Tester as a tool to measure physical properties of gluten
John P. Melnyk a, Jens Dreisoerner b, Massimo F. Marcone a, Koushik Seetharaman a,*
aDepartment of Food Science, University of Guelph, 50 Stone Road East, Guelph, Ontario, Canada N1G 2W1b Food Division, Brabender GmbH & Co. KG, 51-55 Kulturstrasse, 47055 Duisburg, Germany
a r t i c l e i n f o
Article history:Received 22 November 2011Received in revised form5 July 2012Accepted 24 July 2012
Keywords:Gluten aggregationGliadinGluteninFractionation and reconstitution
Abbreviations: GPT, Gluten Peak Tester; PMT, PeakMolecular Weight; SDS-PAGE, sodium dodecylelectrophoresis.* Corresponding author. Tel.: þ1 519 824 4120x522
E-mail address: [email protected] (K. Seethar
0733-5210/$ e see front matter � 2012 Elsevier Ltd.http://dx.doi.org/10.1016/j.jcs.2012.07.015
a b s t r a c t
The functional properties of wheat are largely dictated by composition and interactions of the glutenproteins. All flours contain gliadin and glutenin, but produce baked products of varying quality, whichprovides evidence that gluten proteins from different wheats possess different properties. A commonmethod to study differences in gluten properties, which is utilized in this study, is fractionation/reconstitution experiments to understand how various gliadin to glutenin ratios and how fractions fromdifferent wheat sources affect gluten aggregation properties. Gliadin and glutenin from a vital wheatgluten were fractionated with 70% ethanol and reconstituted at various gliadin to glutenin ratios. Gliadinand glutenin from a Canadian eastern soft, eastern hard and western hard wheat (14% moisture) werefractionated and substituted between flours at the native gliadin to glutenin ratio. Gluten combinationswere evaluated with a Gluten Peak Tester at constant temperature and mixing. Varying gliadin to glu-tenin ratio showed that 50:50 is optimal for fast gluten aggregation while amount of glutenin dictatesstrength. Substitution experiments showed that replacing good quality gluten fractions with those froma lower quality wheat decreases gluten quality, and vice versa. Data also showed that cultivar specificdifferences in gliadin and glutenin are more important in dictating gluten strength (torque), while gliadinto glutenin ratio dictates aggregation time (PMT) independent of the source of fractions. The studydemonstrated the ability of the improved method to evaluate gluten aggregation by controlling for allvariables except the one being tested. The data also revealed information about gluten aggregationproperties never before seen.
� 2012 Elsevier Ltd. All rights reserved.
1. Introduction
The functional properties of wheat are largely dictated by thecomposition of gluten proteins and interactions with each otherupon addition of water and mixing to form a dough (Shewry andTatham, 1997; Sliwinski et al., 2004a, b; Wall, 1979). All wheatscontain gliadin and glutenin, which together form gluten. However,not all wheats can produce products with the same quality. For thisreason, it has been determined that gluten from different wheatvarieties possess different properties that determine their suit-ability for various baked products (Preston and Tipples, 1980). Withthis knowledge, interest has been focused on determining whatdifferences are present in gluten of various wheat cultivars that
Maximum Time; HMW, Highsulfate-polyacrylamide gel
04; fax: þ1 519 824 6631.aman).
All rights reserved.
dictate gluten aggregation properties, dough properties, and bakingproperties.
There are two common methods for studying how flourcomponents affect dough quality (Uthayakumaran et al., 1999). Thefirst is to study the subfraction composition of various wheats andcorrelate differences to dough properties and breadmaking quality.The second, and highly used method, is fractionation/reconstitu-tion experiments to determine how varying certain fractionswithin and between wheats change dough/baking properties.Reconstitution studies that vary gluten content in flour have showncorrelations between total gluten and loaf volume (Aitken andGeddes, 1934; Grassberger et al., 2003). Studies that have variedgliadin to glutenin ratio have shown increases in dough strength,decreases in extensibility, and variable results regarding loafvolume with increasing glutenin ratio (Grassberger et al., 2003;Khatkar et al., 1995; Preston and Tipples, 1980; Uthayakumaranet al., 1999). Substitution experiments in which gluten, gliadin, orglutenin from one flour is replaced with another generally showshifts in dough and bread properties that become similar to theflour of the component substituted in (Booth and Melvin, 1979;

Table 1Combinations of gliadin and glutenin tested in the GPT.
Combination Source of gliadin fraction Source of glutenin fraction
Mixed at Warthog ratio of 33% gliadin, 67% glutenin1 Warthog Warthog2 Warthog Emmit3 Emmit Warthog
Mixed at Glenn ratio of 32% gliadin, 68% glutenin4 Glenn Glenn5 Glenn Emmit6 Emmit Glenn
J.P. Melnyk et al. / Journal of Cereal Science 56 (2012) 561e567562
Chakraborty and Khan, 1988; Khatkar et al., 1995). All of thesestudies have demonstrated that total gluten, gliadin to gluteninratio, and subfraction composition each have a role in dictating theproperties of the final gluten.
Since flour is a multi-component system that contains variousproteins, starch, andmoisture, it becomes difficult to test the effectsof one variable through fractionation/reconstitution while holdingthe remaining variables constant (Uthayakumaran et al., 1999). Thiscomplicates direct comparisons between flours. Many of thestudies have conducted experiments by adding gluten to flour,without controlling for gluten composition. Others have variedgliadin and glutenin ratio by adding isolated gliadin and gluteninback to the base flour at various quantities (Uthayakumaran et al.,1999). Comparisons between flours are difficult to make sincenative gluten between flours differ. Substitution experiments havebeen conducted by direct addition of gliadin or glutenin from oneflour to another flour, or through removal of a portion of glutenfrom one flour and addition of an equal amount of gliadin or glu-tenin from another flour (Khatkar et al., 1995). Once again, nativegluten proteins that are present differ from flour to flour, makingdirect comparisons difficult since two variables are changing:source of added fraction and gliadin to glutenin ratio.
This research utilizes an improved method to directly measuregluten aggregation time and strength of gluten network using puregliadin and glutenin fractions in the absence of starch and otherflour components. Using a physical, large deformation method,such as the Gluten Peak Tester, gluten aggregation time and torquegenerated by mixing pure gliadin and glutenin fractions can bemeasured. By varying gliadin to glutenin ratio of gluten whileholding all other variables constant (equal moisture, removal ofstarch), a clearer understanding of the effect of gluten ratio onaggregation properties is possible. The GPT uses small sample sizesand a quick, simple method to demonstrate physical differencesbetween proteins which can have valuable applications to researchand industry. Gliadin and glutenin were fractionated using 70%ethanol following previously outlined procedures (Weegels et al.,1995). Studies have shown that this method is acceptable forstudies on gluten properties, with minimal loss of protein func-tionality (Khatkar et al., 1995).
2. Experimental
2.1. Gluten and flour samples
A commercial vital wheat gluten (ADM, Montreal, QB) con-taining 78.5% protein (14% moisture basis), as determined by theDumas method (Leco FP-528, St. Joseph, MI) using a nitrogen factorof 5.7 was used.
Three wheat cultivars were selected to obtain a wide range ofprotein content and quality. Emmit is an Ontario, Canada soft redwinter wheat, Warthog is an Ontario hard red winter wheat, andGlenn is a Western Canada hard red winter wheat (Dow Agro-sciences, Blenheim, ON). Wheats were tempered to 16% moistureand then milled into flour using a Quadrumat Junior Mill (Bra-bender GmbH and Co KG, Duisburg, Germany) achieving approxi-mately 70% yield. Each flour was sifted to a particle size of 280 mm.Protein content (14% moisture basis) of each flour was determinedusing the Dumas method and a nitrogen factor of 5.7. Proteincontents for Emmit, Warthog, and Glennwere 7.4%, 8.4%, and 13.3%,respectively.
2.2. Gluten isolation
Gluten from the three flours was separated from starch usinga standard hand washing method (AACC Method 38-10.01, 2000).
The freeze dried Emmit, Warthog, and Glenn gluten samples con-tained 78.5%, 78.8%, and 80.1% protein, respectively (6% moisturebasis).
2.3. Gliadin and glutenin fractionation
Vital wheat gluten and the flour glutens were fractionated intogliadin and glutenin following the method outlined by Weegelset al. (1995). One part flour was mixed with 4 parts of 70%ethanol (analytical grade) and was left to shake at room tempera-ture for 45 min, before centrifuging at 3000 g for 10 min at roomtemperature. Two more extractions were carried out by adding 2parts of 70% ethanol, shaking for 30min, and centrifuging as before.The supernatants were combined and ethanol was evaporated(Buchi Rotavapor-R, New Castle, DE) under vacuum at 30 �C. Thegliadin supernatants and glutenin pellets were freeze dried as thegluten, ground and sifted to a final particle size of 280 mm. Proteincontents were determined as before.
2.4. Reconstitution and substitution of gluten fractions
For the first experiment, vital gliadin and glutenin were mixedto obtain various ratios of gliadin to glutenin on a protein basis.Ratios used were 0:100, 20:80, 40:60, 50:50, 60:40, 80:20, and100:0. Each combination was thoroughly mixed before analysiswith the GPT.
For the second experiment, gliadin and glutenin fractions weresubstituted between Emmit and Warthog or between Emmit andGlenn based on the native gliadin to glutenin flour ratios. Unfrac-tionated gluten of each flour sample was also run as the glutencontrol. The combinations tested are shown in Table 1.
2.5. Gluten aggregation properties
Prepared gluten combinations were run in the GPT (BrabenderGmbH and Co KG, Duisburg, Germany) to determine glutenaggregation time (peak maximum time, PMT) and the torquegenerated by the gluten network (Brabender equivalents, BE). Forflour samples, Warthog and Emmit were tested at 9.4 g flour and8.6 g water at a temperature of 35 �C and spindle speed of2196 rpm, which was a predetermined setting that worked fora wide range of flours. Glenn flour was run at 8 g flour, 10 g water,35 �C, and 2750 rpm. The higher moisture and faster speed wasrequired due to the higher flour protein content. For glutens, 3 g ofsample was combined with 4 g of deionized water immediatelybefore starting the test. The temperature was set to 35 �C andspindle speed was 2750 rpm. Tests were done in duplicate andstandard deviations are displayed as error bars. Significance of PMTor torque differences within each flour ratio tested was determinedusing ANOVA (p< 0.05). Tukey’s HSD test was applied to determinesignificant differences among samples within the flour ratio at the
J.P. Melnyk et al. / Journal of Cereal Science 56 (2012) 561e567 563
95% confidence level. Significance of identical gliadin/glutenincombinations between flour ratios was analyzed by a two-tailedpaired T-test (p < 0.05) (SPSS Inc., Chicago, IL).
3. Results
3.1. Effect of gliadin to glutenin ratio on gluten aggregation
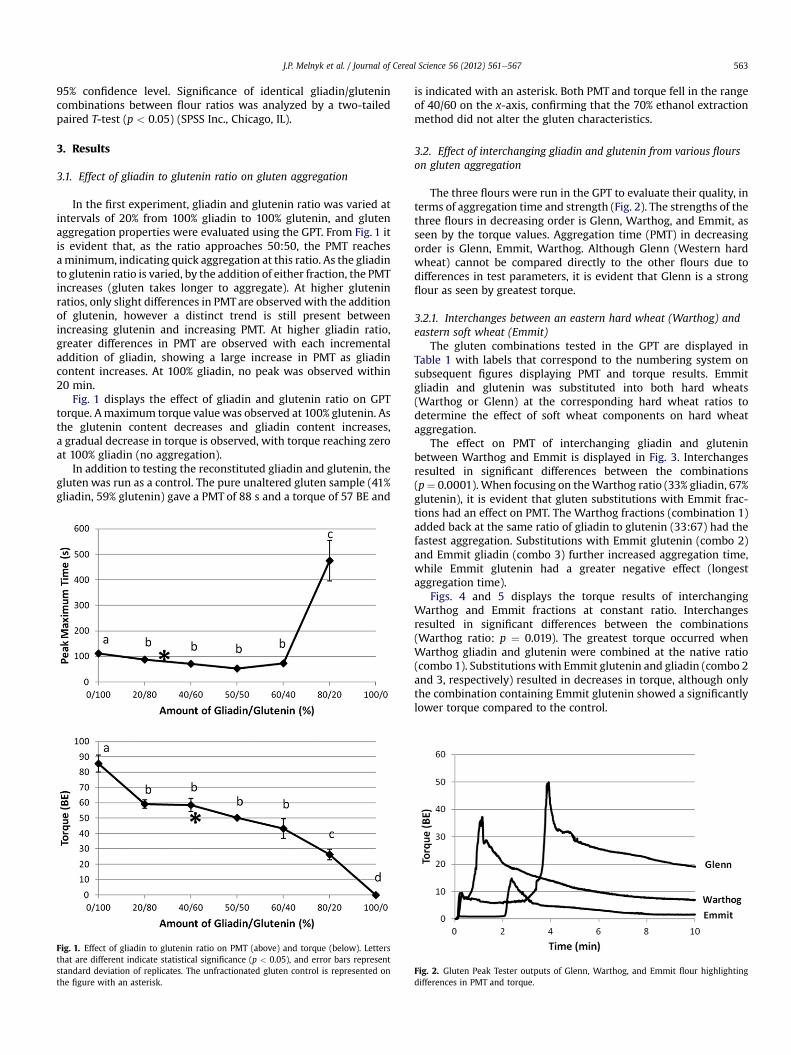
In the first experiment, gliadin and glutenin ratio was varied atintervals of 20% from 100% gliadin to 100% glutenin, and glutenaggregation properties were evaluated using the GPT. From Fig. 1 itis evident that, as the ratio approaches 50:50, the PMT reachesaminimum, indicating quick aggregation at this ratio. As the gliadinto glutenin ratio is varied, by the addition of either fraction, the PMTincreases (gluten takes longer to aggregate). At higher gluteninratios, only slight differences in PMTare observed with the additionof glutenin, however a distinct trend is still present betweenincreasing glutenin and increasing PMT. At higher gliadin ratio,greater differences in PMT are observed with each incrementaladdition of gliadin, showing a large increase in PMT as gliadincontent increases. At 100% gliadin, no peak was observed within20 min.
Fig. 1 displays the effect of gliadin and glutenin ratio on GPTtorque. Amaximum torque valuewas observed at 100% glutenin. Asthe glutenin content decreases and gliadin content increases,a gradual decrease in torque is observed, with torque reaching zeroat 100% gliadin (no aggregation).
In addition to testing the reconstituted gliadin and glutenin, thegluten was run as a control. The pure unaltered gluten sample (41%gliadin, 59% glutenin) gave a PMT of 88 s and a torque of 57 BE and
Fig. 1. Effect of gliadin to glutenin ratio on PMT (above) and torque (below). Lettersthat are different indicate statistical significance (p < 0.05), and error bars representstandard deviation of replicates. The unfractionated gluten control is represented onthe figure with an asterisk.
is indicated with an asterisk. Both PMT and torque fell in the rangeof 40/60 on the x-axis, confirming that the 70% ethanol extractionmethod did not alter the gluten characteristics.
3.2. Effect of interchanging gliadin and glutenin from various flourson gluten aggregation
The three flours were run in the GPT to evaluate their quality, interms of aggregation time and strength (Fig. 2). The strengths of thethree flours in decreasing order is Glenn, Warthog, and Emmit, asseen by the torque values. Aggregation time (PMT) in decreasingorder is Glenn, Emmit, Warthog. Although Glenn (Western hardwheat) cannot be compared directly to the other flours due todifferences in test parameters, it is evident that Glenn is a strongflour as seen by greatest torque.
3.2.1. Interchanges between an eastern hard wheat (Warthog) andeastern soft wheat (Emmit)
The gluten combinations tested in the GPT are displayed inTable 1 with labels that correspond to the numbering system onsubsequent figures displaying PMT and torque results. Emmitgliadin and glutenin was substituted into both hard wheats(Warthog or Glenn) at the corresponding hard wheat ratios todetermine the effect of soft wheat components on hard wheataggregation.
The effect on PMT of interchanging gliadin and gluteninbetween Warthog and Emmit is displayed in Fig. 3. Interchangesresulted in significant differences between the combinations(p¼ 0.0001). When focusing on theWarthog ratio (33% gliadin, 67%glutenin), it is evident that gluten substitutions with Emmit frac-tions had an effect on PMT. The Warthog fractions (combination 1)added back at the same ratio of gliadin to glutenin (33:67) had thefastest aggregation. Substitutions with Emmit glutenin (combo 2)and Emmit gliadin (combo 3) further increased aggregation time,while Emmit glutenin had a greater negative effect (longestaggregation time).
Figs. 4 and 5 displays the torque results of interchangingWarthog and Emmit fractions at constant ratio. Interchangesresulted in significant differences between the combinations(Warthog ratio: p ¼ 0.019). The greatest torque occurred whenWarthog gliadin and glutenin were combined at the native ratio(combo 1). Substitutions with Emmit glutenin and gliadin (combo 2and 3, respectively) resulted in decreases in torque, although onlythe combination containing Emmit glutenin showed a significantlylower torque compared to the control.
Fig. 2. Gluten Peak Tester outputs of Glenn, Warthog, and Emmit flour highlightingdifferences in PMT and torque.

Fig. 3. Effect of interchanging Warthog and Emmit or Glenn and Emmit gliadin and glutenin fractions on Peak Maximum Time (PMT). Letters within each wheat ratio that aredifferent indicate statistical significance (p < 0.05), and error bars represent standard deviation of replicates.
J.P. Melnyk et al. / Journal of Cereal Science 56 (2012) 561e567564
3.2.2. Interchanges between a western hard wheat (Glenn) andeastern soft wheat (Emmit)
Effect on PMT of substituting Glenn gliadin and glutenin frac-tions with corresponding Emmit fractions at the Glenn ratio of32:68 is displayed in Fig. 3. Combinations 5 and 6which substitutedin Emmit glutenin and gliadin respectively, showed PMT valuesgreater than Glenn/Glenn gliadin and glutenin (combo 4).
Fig. 4 displays the effect of Glenn and Emmit gluten substitu-tions on GPT torque. The reconstituted Glenn gliadin and glutenin(combo 6) had the lowest torque. Combination 5 and 6 containingGlenn gliadin and Emmit glutenin and Emmit gliadin and Glennglutenin had increasing torques compared to combination 4.
4. Discussion
The fractionation and reconstitution study conducted using GPThighlights differences in gluten quality from different wheats affectboth aggregation time and torque of developed gluten. The GPTwasable to elicit these differences demonstrating its potential as a toolto differentiate protein quality between flours.
Fig. 4. Effect of interchanging Warthog and Emmit or Glenn and Emmit gliadin and gluteninand error bars represent standard deviation of replicates.
4.1. Varying gliadin to glutenin ratio of vital wheat gluten
PMT results showed a minimum aggregation time at a ratio of50:50 (equal gliadin and glutenin), with aggregation timeincreasing as the ratio shifts to higher proportions of one fraction.These results suggest a maximum efficiency for gluten to forma fully developed network at equal proportions of gliadin to glu-tenin. Studies have attempted to demonstrate how the gliadin/glutenin balance affects other dough performancemeasures or howit relates to baking quality (Grassberger et al., 2003;Uthayakumaran et al., 1999). A study altering the gliadin to gluteninratio by adding fractions from different cultivars to a common baseflour reported an increase in mixing time (dough developmenttime) with increasing glutenin ratio. With each cultivar tested,a minimum in mixing time was observed at the ratio closest to50:50 although each cultivar had a ratio slightly higher in gluteninand no flours were tested at exactly 50:50 (Uthayakumaran et al.,1999). When gliadin or glutenin was reconstituted into theirnative flours to vary the ratio, results showed a minimum inMixograph mixing time at the ratio nearest to 50:50, however flour
fractions on torque. Letters that are different indicate statistical significance (p < 0.05),
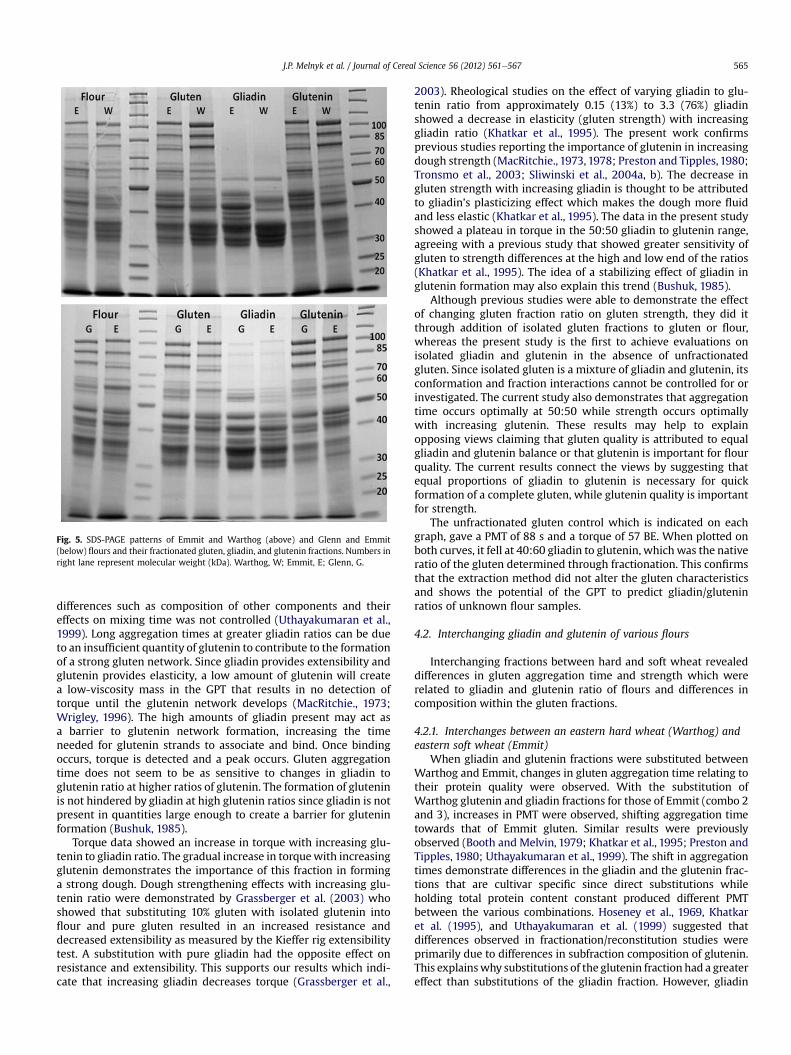
Fig. 5. SDS-PAGE patterns of Emmit and Warthog (above) and Glenn and Emmit(below) flours and their fractionated gluten, gliadin, and glutenin fractions. Numbers inright lane represent molecular weight (kDa). Warthog, W; Emmit, E; Glenn, G.
J.P. Melnyk et al. / Journal of Cereal Science 56 (2012) 561e567 565
differences such as composition of other components and theireffects on mixing time was not controlled (Uthayakumaran et al.,1999). Long aggregation times at greater gliadin ratios can be dueto an insufficient quantity of glutenin to contribute to the formationof a strong gluten network. Since gliadin provides extensibility andglutenin provides elasticity, a low amount of glutenin will createa low-viscosity mass in the GPT that results in no detection oftorque until the glutenin network develops (MacRitchie., 1973;Wrigley, 1996). The high amounts of gliadin present may act asa barrier to glutenin network formation, increasing the timeneeded for glutenin strands to associate and bind. Once bindingoccurs, torque is detected and a peak occurs. Gluten aggregationtime does not seem to be as sensitive to changes in gliadin toglutenin ratio at higher ratios of glutenin. The formation of gluteninis not hindered by gliadin at high glutenin ratios since gliadin is notpresent in quantities large enough to create a barrier for gluteninformation (Bushuk, 1985).
Torque data showed an increase in torque with increasing glu-tenin to gliadin ratio. The gradual increase in torquewith increasingglutenin demonstrates the importance of this fraction in forminga strong dough. Dough strengthening effects with increasing glu-tenin ratio were demonstrated by Grassberger et al. (2003) whoshowed that substituting 10% gluten with isolated glutenin intoflour and pure gluten resulted in an increased resistance anddecreased extensibility as measured by the Kieffer rig extensibilitytest. A substitution with pure gliadin had the opposite effect onresistance and extensibility. This supports our results which indi-cate that increasing gliadin decreases torque (Grassberger et al.,
2003). Rheological studies on the effect of varying gliadin to glu-tenin ratio from approximately 0.15 (13%) to 3.3 (76%) gliadinshowed a decrease in elasticity (gluten strength) with increasinggliadin ratio (Khatkar et al., 1995). The present work confirmsprevious studies reporting the importance of glutenin in increasingdough strength (MacRitchie., 1973, 1978; Preston and Tipples, 1980;Tronsmo et al., 2003; Sliwinski et al., 2004a, b). The decrease ingluten strength with increasing gliadin is thought to be attributedto gliadin’s plasticizing effect which makes the dough more fluidand less elastic (Khatkar et al., 1995). The data in the present studyshowed a plateau in torque in the 50:50 gliadin to glutenin range,agreeing with a previous study that showed greater sensitivity ofgluten to strength differences at the high and low end of the ratios(Khatkar et al., 1995). The idea of a stabilizing effect of gliadin inglutenin formation may also explain this trend (Bushuk, 1985).
Although previous studies were able to demonstrate the effectof changing gluten fraction ratio on gluten strength, they did itthrough addition of isolated gluten fractions to gluten or flour,whereas the present study is the first to achieve evaluations onisolated gliadin and glutenin in the absence of unfractionatedgluten. Since isolated gluten is a mixture of gliadin and glutenin, itsconformation and fraction interactions cannot be controlled for orinvestigated. The current study also demonstrates that aggregationtime occurs optimally at 50:50 while strength occurs optimallywith increasing glutenin. These results may help to explainopposing views claiming that gluten quality is attributed to equalgliadin and glutenin balance or that glutenin is important for flourquality. The current results connect the views by suggesting thatequal proportions of gliadin to glutenin is necessary for quickformation of a complete gluten, while glutenin quality is importantfor strength.
The unfractionated gluten control which is indicated on eachgraph, gave a PMT of 88 s and a torque of 57 BE. When plotted onboth curves, it fell at 40:60 gliadin to glutenin, which was the nativeratio of the gluten determined through fractionation. This confirmsthat the extraction method did not alter the gluten characteristicsand shows the potential of the GPT to predict gliadin/gluteninratios of unknown flour samples.
4.2. Interchanging gliadin and glutenin of various flours
Interchanging fractions between hard and soft wheat revealeddifferences in gluten aggregation time and strength which wererelated to gliadin and glutenin ratio of flours and differences incomposition within the gluten fractions.
4.2.1. Interchanges between an eastern hard wheat (Warthog) andeastern soft wheat (Emmit)
When gliadin and glutenin fractions were substituted betweenWarthog and Emmit, changes in gluten aggregation time relating totheir protein quality were observed. With the substitution ofWarthog glutenin and gliadin fractions for those of Emmit (combo 2and 3), increases in PMT were observed, shifting aggregation timetowards that of Emmit gluten. Similar results were previouslyobserved (Booth and Melvin, 1979; Khatkar et al., 1995; Preston andTipples, 1980; Uthayakumaran et al., 1999). The shift in aggregationtimes demonstrate differences in the gliadin and the glutenin frac-tions that are cultivar specific since direct substitutions whileholding total protein content constant produced different PMTbetween the various combinations. Hoseney et al., 1969, Khatkaret al. (1995), and Uthayakumaran et al. (1999) suggested thatdifferences observed in fractionation/reconstitution studies wereprimarily due to differences in subfraction composition of glutenin.This explainswhy substitutions of the glutenin fraction had a greatereffect than substitutions of the gliadin fraction. However, gliadin

J.P. Melnyk et al. / Journal of Cereal Science 56 (2012) 561e567566
substitutions also resulted in changes in PMT indicating the impor-tance of gliadin subfraction composition on gluten aggregation.
ReconstitutedWarthog fractions (combo 1) had a greater torquethan reconstituted Glenn/Emmit fractions (combo 2 and 3)following the same trends as the flour, indicating greater strengthof Warthog. This confirmed PMT data that substituting a goodquality gluten fraction for a lower quality gluten will result ina decreased quality similar to the poor gluten. As with PMT, greatereffects were observed with the substitution of the glutenin fractiondemonstrating the strong effect of glutenin in dictating glutenstrength (Hoseney et al., 1969; Khatkar et al., 1995; andUthayakumaran et al., 1999).
4.2.2. Interchanges between a western hard wheat (Glenn) andeastern soft wheat (Emmit)
Combination 4, the reconstituted Glenn gliadin and gluteninfractions had a PMT value similar to the control Glenn gluten(unfractionated) indicating similar functionality of the fraction-ated/reconstituted components and the unfractionated glutencontrol (results not shown). The fact that combinations 5 and 6produced PMT values that are not significantly different suggeststhat fractionation and reconstitution of gliadin and glutenin frac-tions from different flours produce the same results provided thatthe ratios are the same. These results also suggest that differencesin gluten quality of various wheat cultivars may lie in differences ingliadin to glutenin ratio within the native flours, since adjustingboth flours to equal ratios resulted in the same PMT. An extensivereview of the literature did not find comparable studies to thepresent one. Most studies added gliadin or glutenin to either glutenor flour. Since gliadin to glutenin ratio in the native gluten or flourvaried from sample to sample, it makes direct comparisonsbetween samples difficult since this variable is not controlled(Chakraborty and Khan, 1988; Grassberger et al., 2003; Khatkaret al., 1995; MacRitchie, 1987; Preston and Tipples, 1980;Uthayakumaran et al., 1999). Since gliadin to glutenin ratio couldnot be matched between samples in these studies, a directcomparison between flours at exactly equal ratios was not possible.Booth and Melvin (1979) had an experimental design closest toours since reconstitution of both samples was carried out at equalratio, however at different total protein contents. Since total proteinhas been shown to affect loaf volume, results are incomparable tothe current study since protein content was not controlled (Boothand Melvin, 1979; Grassberger et al., 2003). Substitutions ofGlenn glutenin and gliadin for Emmit fractions resulted in insig-nificant increases in PMT, indicating a slight loss in protein quality.The increased PMT may be due to an incompatibility of fractionsfrom two cultivars which resulted in a longer aggregation time.Further studies are required to understand trends observed in thisstudy.
Torque values of the three reconstituted Glenn and Emmitsamples at equal gliadin to glutenin ratio demonstrated thatdifferences in glutenin subfraction composition played a role ingluten development as measured by torque (Fig. 4). The recon-stituted Glenn gluten (combo 4) produced the lowest torque.Combination 5 which contained Emmit glutenin had a torque valuethat was significantly greater than combo 4, indicating that glu-tenin has cultivar specific differences that dictates torque. Torquedata showed cultivar specific significant differences betweengluten fractions, while PMT data showed insignificant trendsrelated to substitutions between cultivars. This indicates thatcultivar specific differences in gliadin and glutenin may be moreimportant in dictating gluten strength (torque), while gliadin toglutenin ratio dictates aggregation time (PMT) independent of thesource of fractions. Cultivar specific differences between glutenonly have a small effect on PMT compared to torque.
5. Conclusions
The present study demonstrated that the Osborne fractionationmethod, through gluten hand washing to remove starch and 70%ethanol for gliadin and glutenin fractionation was a suitablemethod for fractionation/reconstitution studies. By varying gliadinto glutenin ratio, it was shown that equal amount of each fractionresulted in fastest gluten aggregation while increasing glutenincontent increases gluten strength. This demonstrated the impor-tance of both ratio and total glutenin (HMW fractions) in glutenaggregation properties. Substitution experiments showed thatpairing gluten fractions from a high and low quality glutenprovided gluten characteristics intermediate of the two. Thisdemonstrated that gluten fraction differences are present inwheatsof various cultivars which dictate gluten aggregation. It was alsoobserved that gliadin to glutenin ratio dictated aggregation timealmost independent of cultivar, while cultivar specific differences inglutenin largely dictated torque. The GPT was proven as a usefulmethod to evaluate differences in gluten aggregation properties byfractionation/substitution experiments. The improved method thatcontrolled for all variables between flourswhile only varying glutenratio or gluten cultivar source revealed gluten aggregation prop-erties not previously observed.
Acknowledgments
Funding from MITACS with financial support from Dow Agro-Sciences is greatly appreciated. Funding from the Grain Farmers ofOntario is also greatly appreciated.
References
Aitken, T.R., Geddes, W.F., 1934. The behavior of strong flours of widely varyingprotein content when subjected to normal and severe baking procedures.Cereal Chemistry 11, 487e504.
American Association of Cereal Chemists International, 2000. Approved Methods ofAnalysis. Method 38e10.01. Gluten Hand Washing Method. ApprovedNovember 3, 1999. In: eleventh ed. (Ed.). AACC International, St. Paul, MN, USA.
Booth, M.R., Melvin, M.A., 1979. Factors responsible for the poor breadmakingquality of high yielding European wheat. Journal of the Science of Food andAgriculture 30, 1057e1064.
Bushuk, W., 1985. Flour proteins e Structure and functionality in dough and bread.Cereal Foods World 30, 447.
Chakraborty, K., Khan, K., 1988. Biochemical and breadmaking properties of wheat-protein components .2. Reconstitution baking studies of protein fractions fromvarious isolation procedures. Cereal Chemistry 65, 340e344.
Grassberger, A., Schieberle, P., Koehler, P., 2003. Fractionation and reconstitution ofwheat flour e Effect on dough rheology and baking. European Food Researchand Technology 216, 204e211.
Hoseney, R.C., Finney, K.F., Shogren, M.D., Pomeranz, Y., 1969. Functional (Bread-making) and biochemical properties of wheat flour components .3. Character-ization of gluten protein fractions obtained by ultracentrifugation. CerealChemistry 46, 126.
Khatkar, B.S., Bell, A.E., Schofield, J.D., 1995. The Dynamic rheological properties ofglutens and gluten subfractions from wheats of good and poor bread-makingquality. Journal of Cereal Science 22, 29e44.
MacRitchie, F., 1973. Conversion of a weak flour to a strong one by increasingproportion of its high molecular-weight gluten protein. Journal of the Science ofFood and Agriculture 24, 1325e1329.
MacRitchie, F., 1978. Differences in baking quality between wheat flours. Journal ofFood Technology 13, 187e194.
MacRitchie, F., 1987. Evaluation of contributions from wheat-protein fractions todough mixing and breadmaking. Journal of Cereal Science 6, 259e268.
Preston, K.R., Tipples, K.H., 1980. Effects of acid-soluble and acid-insoluble glutenproteins on the rheological and baking properties of wheat flours. CerealChemistry 57, 314e320.
Shewry, P.R., Tatham, A.S., 1997. Disulphide bonds in wheat gluten proteins. Journalof Cereal Science 25, 207e227.
Sliwinski, E.L., Kolster, P., Prins, A., van Vliet, T., 2004a. On the relationship betweengluten protein composition of wheat flour and large-deformation properties oftheir doughs. Journal of Cereal Science 39, 247e264.
Sliwinski, E.L., Kolster, P., van Vliet, T., 2004b. On the relationship between largedeformation properties of wheat flour dough and baking quality. Journal ofCereal Science 39, 231e245.

J.P. Melnyk et al. / Journal of Cereal Science 56 (2012) 561e567 567
Tronsmo, K.M., Magnus, E.M., Baardseth, P., Schofield, J.D., Aamodt, A.,Faergestad, E.M., 2003. Comparison of small and large deformationrheological properties of wheat dough and gluten. Cereal Chemistry 80,587e595.
Uthayakumaran, S., Gras, P.W., Stoddard, F.L., Bekes, F., 1999. Effect of varyingprotein content and glutenin-to-gliadin ratio on the functional properties ofwheat dough. Cereal Chemistry 76, 389e394.
Wall, J.S., 1979. Properties of proteins contributing to functionality of cereal foods.Cereal Foods World 24, 288e293.
Weegels, P.L., Hamer, J.R., Shofield, J.D., 1995. RP-HPLC and capillary electrophoresisof subunits from glutenin isolated by SDS and Osborne fractionation. Journal ofCereal Science 22, 211e224.
Wrigley, C.W., 1996. Biopolymers e Giant proteins with flour power. Nature 381,738e739.