using research to improve your site’s design and effectiveness nora paul, director, institute for...
TRANSCRIPT

Using research to improve yoursite’s design and effectiveness
Nora Paul, Director, Institute for New Media Studies, University of MinnesotaLaura Ruel, Assistant professor, University of North Carolina at Chapel Hill
Julie Jones and Itai Himelboim – Researchers - UMN
What MakesWhat MakesWeb Sites Work?Web Sites Work?

Who we are, what we research… and why What are news websites doing? How are they doing it? Should they be doing it?

What we will do today Learn how to make informed decisions about design
choices (based on research) Learn how to conduct your own usability tests on projects
you’ve created.

How to ensure your audience… Sticks with a slide show
Navigation Photo choice
Recalls breaking news stories Sees supplemental links on a story Doesn’t get overwhelmed by “story tools”

What do people do online? Emailed story to a friend….
Filled in a poll………………..
Read a blog…………………
Listened to a Podcast…….. Commented on a board… Sent email to a journalist…. Signed up for RSS…………...
Linked a story on Digg…….. Linked to del.icio.us………...
76.0%
68.0%
60.5%
52.0%
38.5%
38.0%
22.5%
10.0%
7.5%
142 people – wide range of age, race, education, time spent online

What does this tell about the online audience?

What is eyetracking?Why use it?

Eyetracking equipment

Video of gazeplot / eyegaze

above
HEAT MAP – Number of Fixations
below
HEAT MAP – Length of Fixations

Slide shows: navigation

Viewing photo slide shows
DiSEL research: Navigation possibility: thumbnail view
http://www.washingtonpost.com/wp-srv/photo/galleries/091506/korda/index.html

Viewing photo slide shows
DiSEL research: Navigation possibility: arrows and next
http://www.washingtonpost.com/wp-srv/photo/galleries/091506/korda/index.html

Viewing photo slide shows
DiSEL research: Navigation possibility: autoplay
http://www.washingtonpost.com/wp-srv/photo/galleries/091506/korda/index.html
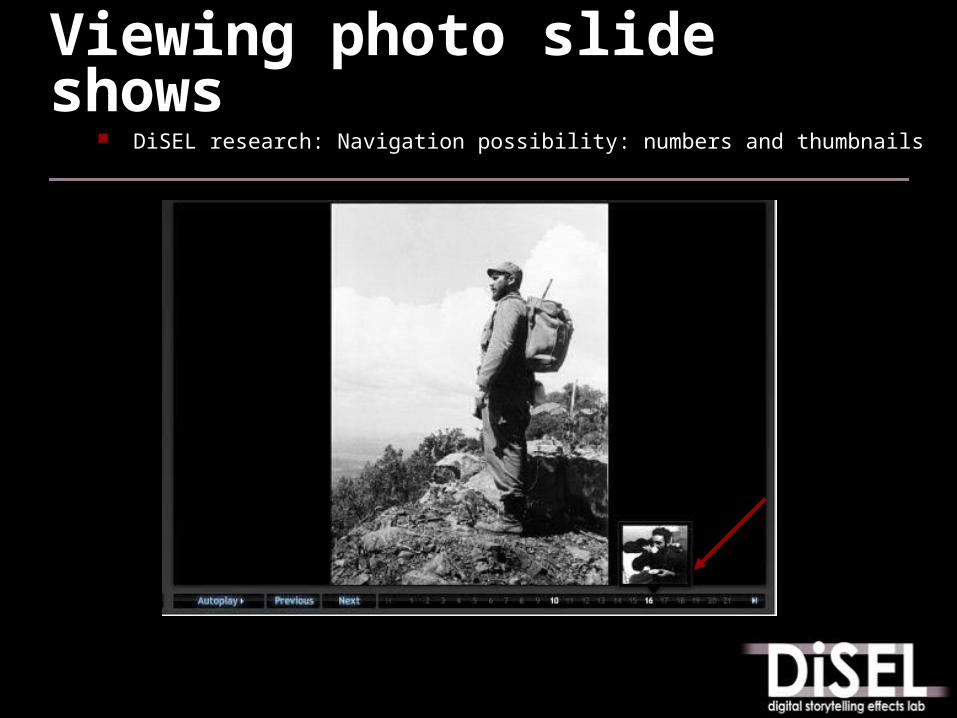
Viewing photo slide shows
DiSEL research: Navigation possibility: numbers and thumbnails
http://www.washingtonpost.com/wp-srv/photo/galleries/091506/korda/index.html

Viewing photo slide shows
Number of Slides Viewed (out of 40)• Next 28 (70%) • Arrow 25 (62%)• Numbers 12 (30%)
Time Spent • Next 2:34• Arrow 3:31• Numbers 2:16 •*aver. 2:49
Navigation Style UsedNext 56%Numbers 23%Arrows 15%Autoplay 6%View Thumbs 0%

Linearity Two “non-linear” navigation methods available
Click randomly in the numbers Thumbnails
Eight used “numbers” Four clicked in order (viewed 20 slides) Four clicked randomly (viewed 6 slides)
What does this tell us?

Viewing photos online Poynter Eyetrack III results: Faces in photos on home
pages and in multimedia generated the most eye fixations.

Viewing photos online Poynter Eyetrack III results and DiSEL results:
Text on photos received little attention.

Viewing photos online
Online images get fixations if they: Relate to surrounding content Are clear Feature “approachable” people
Faces are clear People are smiling / looking at the camera
Feature “real people” Models denote ads, and are avoided
Feature areas of private anatomy Well, the guys check it out mostly
Nielsen/Norman Study

Viewing photos online Nielsen/Norman results

Viewing photos online Nielsen/Norman results

Viewing photos online Nielsen/Norman results
http://www.ojr.org/ojr/stories/070312ruel/

Recent news – does design aid / hinder recall? THE STUDY
Top 100 US newspaper websites analyzed how “most recent news” items were
displayed Timestamped stories
(51%) Timestamped the page (12%) Box with “new” or “breaking”
(57%) Individual stories labeled
(12%)
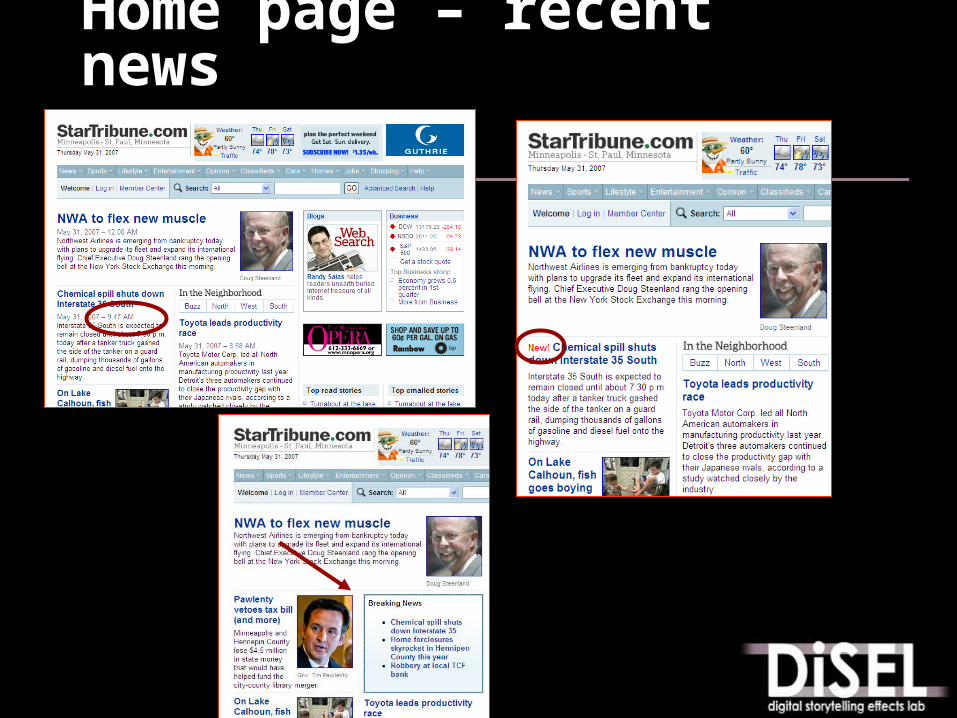
Home page – recent news

Ratio
Green - Saw the visual cue Yellow - Read the headlineOrange - Recalled the headline
Visual cues: Bigger’s better In visual designation of breaking news – box was most viewed by users. Bigger was better.
But in recall, the box was the least – the headline was smallest type.
Findings:Recent News
0
10
20
30
40
50
60
70
80
90
100
Box Timestamp New

Findings: Homepage story recall
Some of the keys to recall were design based (place on page, photo) but personal interests and background were the most compelling factors in story recall.
Homepage Story Recall
Personal Interest41.05%
Clicked 5.26%
Photo 8.42%
Size / position 10.53%
Other8.42%
Familiarity9.47%
Surprise / emotion 9.47%
Proximity6.32%
Design
Per
sona
l

Story page – supplemental links

Did they see it? (examination of eyegaze plot) bottom box page users who fixated 59.1% sidebar page users who fixated 36.4%
Did they read it? (post-exposure survey response) No statistical significance to number of links read
sidebar aver. of 1.00 link read bottom box aver. of 1.18 links read
Did they click it? (examination of gaze replay) Only 4 subjects clicked on supplemental links
2 sidebar page users 2 embedded link users 0 bottom box users
Findings: Supplemental links

Participants viewing the story with embedded links were more likely to recall the existence of links than those who viewed other link presentation styles.
Embedded 62.5%
At bottom 32.3%
Sidebar 25.0%
When asked in general how often they use related or supplemental links, on a scale of 1-5, the average was 3.12.
Findings: Supplemental linksRecall of links
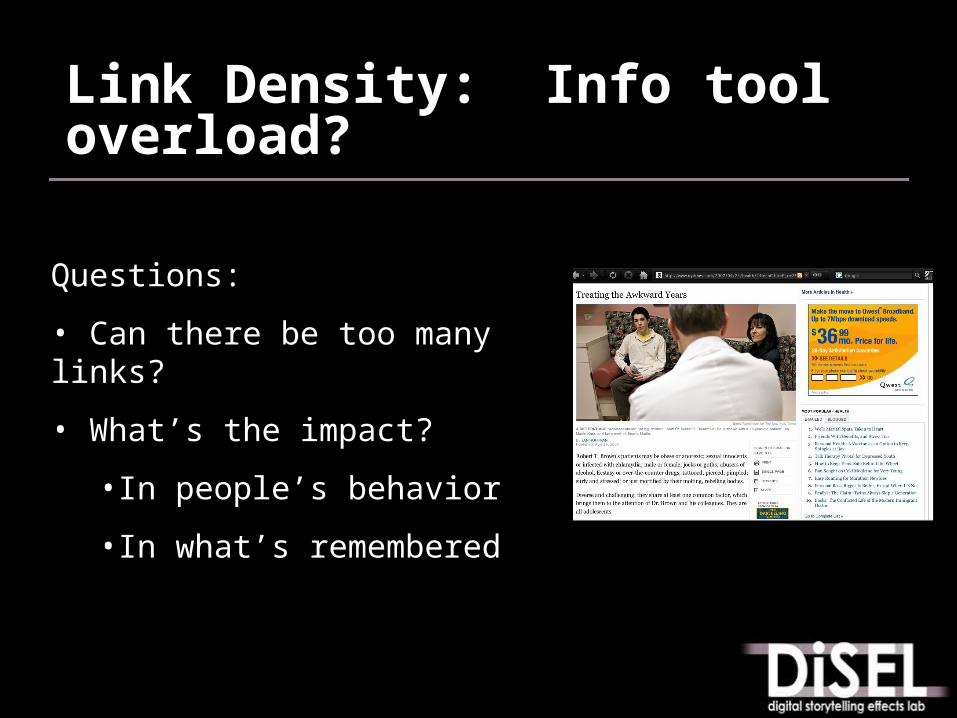
Link Density: Info tool overload?
Questions:
• Can there be too many links?
• What’s the impact?
•In people’s behavior
•In what’s remembered

Version 1 – Original
Version 2 –Embedded links stripped
Version 3 –Text and Story Tools only

Did they remember links?
Embedded links - the high condition users remembered the embedded links (86%)…
But so did 38% of the medium condition users (even though there weren’t any on the page!)
The high condition group also remembered that there were related stories more than others:
80% for high v. 39% for medium
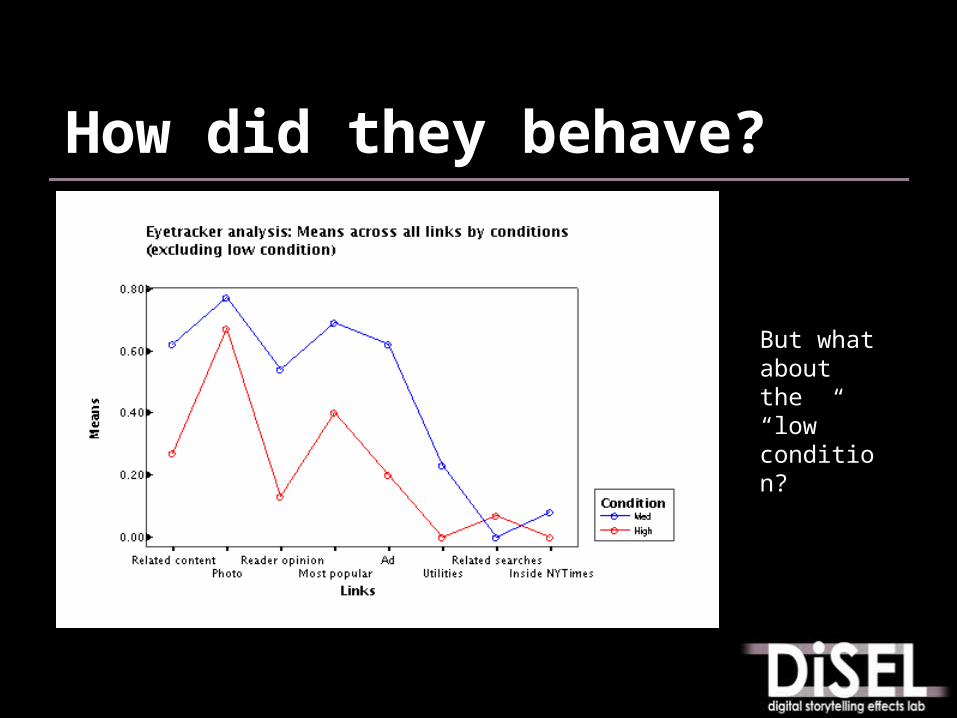
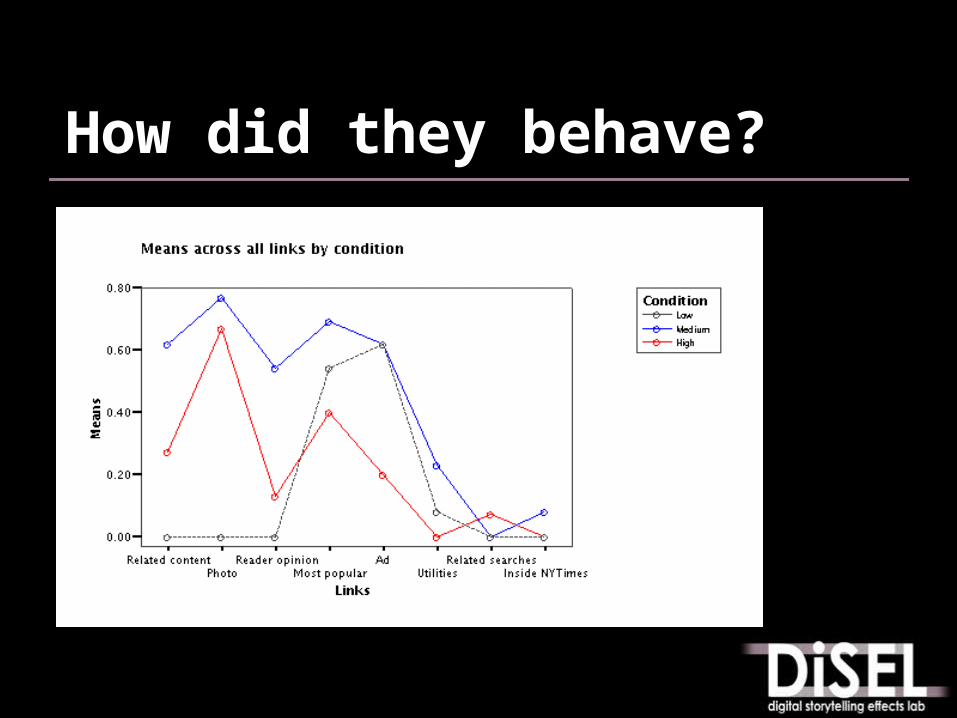
How did they behave?
But what about the “low” condition?
How did they behave?

Why do it?
Usability Testing

Quick guide to usability testing
Determine tasks to test Design experiment Develop questions Gather data Analyze results and determine improvements
5 (people) + 5 (hours) + 5 (steps) = 80% of problems

Thank you! Pick up your handout:
If…Then….resources Bookmark:
http://disel-project.org Watch for more detailed
publications about today’s talk.