using pressure transducers for noninvasive heart and
TRANSCRIPT
Using Pressure Transducers for Noninvasive Heart and
Respiratory Monitoring
Matthew Richard Barcroft Dowden
Thesis submitted to the faculty of the Virginia Polytechnic Institute and State
University in partial fulfillment of the requirements for the degree of
Master of Science
In
Mechanical Engineering
Alfred L. Wicks, Chair
Andre A. Muelenaer, Jr
Kevin B. Kochersberger
July 25, 2012
Blacksburg, Virginia
Keywords: heart rate, respiration, chest sensor, first responder, pressure transducer
Abstract
Using Pressure Transducers for Noninvasive Heart and
Respiratory Monitoring
Matthew Richard Barcroft Dowden
Detecting heart and respiratory rates is an essential means of providing emergency medical care.
Current methods of detecting such signals include the widely used electrocardiography (ECG) method.
Other more manual methods of heart and respiratory rate estimation require a practitioner to constantly
observe the patient. These methods are time consuming and detract valuable time from emergency
medical care. This thesis presents a novel, hands off, heart and respiratory monitor (HARMONI). It uses
pressure transducers and medical tubing placed on a person’s chest. The tubing is plugged off at one end,
and then attached to a pressure transducer at the other end. The transducer sees spikes in voltage
whenever the pressure inside the tubing changes. Heart and respiratory rates both cause expansion in the
chest, increasing the pressure in the tubing, and causing the transducer to see a change in voltage. The
method was first validated, and then tested in a simulated environment. Finally, the device was
transformed in to a full system prototype. Human tests were conducted to correlate the signal with that of
an industry standard ECG device. This thesis explains how heart and respiratory rates can be derived
using signal processing techniques and a simple non-invasive sensor. This device is a rapidly deployable
tool that has the potential to save lives specifically in mass casualty situations. It would be a force
multiplier, allowing a single responder to monitor multiple casualties, saving time and lives.

iii
Acknowledgements
Receiving a degree, at any level, is an accomplishment of not just one individual, but rather an
accomplishment of many. It is a celebration of all those teachers who have had an impact on a person,
throughout their life. A good teacher is one who helps you succeed in the subject in which they teach. A
great teacher is one who helps you succeed in all aspects of life. I have had the rare fortune of having
many great teachers in my life. It is these great people whom I dedicate this thesis.
I have to start of course with my family, for without them I would not be where I am today. My
brother Joshua delivered constant competition throughout my life, to which I owe my determination to
succeed. My grandfathers both showed me that hard work is the backbone for any profession. My Nana,
Florence Godley, showed me to be proud of my Italian heritage, and to take all of my successes and
failures in stride, because not taking yourself too seriously is essential to being happy. My Nana, Ruth
Dowden, showed me that everything in life has a lesson, regardless of what curveballs are thrown at you.
My father showed me that as long as you do your best in all things, then the result does not matter. From
the soccer field to the classroom and everywhere in between, this lesson has held true, every day of my
life. Finally, my mother for showing me the endless love, care, and compassion that allowed me to
develop in to the man I am today. She is a constant reminder of where I came from, which is a beacon of
hope when things don’t seem to go my way. Thank you Richard and Maria Dowden for being superb
parents, for all the advice and guidance I could ask for, and all the advice I didn’t ask for. It was the fuel
of my success. Love you always.
From the lessons within my family to the lessons in the classroom, my professors were just as
important to my successes. In junior high, it was Mr. Thresher, who instilled in me my love for math that
continues to this day. In high school, it was Mr. Rauer, Mr. Dight, Mr. Umbeck, and Mr. Lynas, who
through history, government, math, and physics classes were able to teach me life lessons like love of
God and duty to your country. They were all superb role models and are deserving of recognition for
believing in me and my abilities as a student. In college it was Dr. Roger Chang, for showing me the
dedication required to be a great teacher, and for being one of my greatest mentors. It was also Dr.
Michael Hyer, who really pushed me on the path towards higher education. Finally, in graduate school, I
thank Dr. Kevin Kochersberger for agreeing to be on my committee. I especially thank Dr. Al Wicks and
Dr. Andre Muelenaer, who took me under their wing, and let me build projects from the ground up.
Of course great teachers don’t just stand in front of the classroom. I had other great teachers in
the form of colleagues, friends, and fraternity brothers here at Virginia Tech. My colleagues and lab
mates in the Mechatronics lab, especially Dr. Bird and Dr. Gaines, deserve a lot of credit for their endless
guidance and help. I’d especially like to thank Thomas Ruscher for his invaluable influence on my
electronics design, and for instilling in me a piece of his passion for printed circuit boards. In addition to
these colleagues were my brothers in Theta Tau Professional Engineering Fraternity. They will be friends
for life, especially Steve Valeri and Kevin Garrison, whom I went through six years of engineering with.
And last but not least, I’d like to thank my other brothers. They are the guys that have been there
with me from the beginning, Rosario Farruggio, Michael “Cappy” Caporiccio, and Patrick Drury. These
men have the ability to move worlds in my eyes, and I am proud to know each one of them. They and
their families are part of who I am, crucial to my being, and are invaluable to my future. Thank you.
iv
Table of Contents
Chapter 1: Introduction .............................................................................................................................. 1
1.1 Emergency Medical Response Situations .......................................................................................... 2
1.1.1 Civilian Emergency Medical Applications ................................................................................... 2
1.1.2 Military Emergency Medical Applications .................................................................................. 2
1.1.3 The Need for Vital Sign Monitors in Mass Casualty Incidents .................................................... 3
1.2 Detecting Vital Signs without Using Bioelectric Signals ..................................................................... 3
Chapter 2: Literature Review ...................................................................................................................... 4
2.1 Background Information on Heart and Respiratory Rate .................................................................. 4
2.2 Manual Methods for Heart and Respiratory Rate Estimation ........................................................... 5
2.3 Electrocardiography (ECG) ................................................................................................................ 5
2.4 Respiratory Monitoring Using Impedance and Pressure Belts .......................................................... 8
2.5 Pulse Oximeters .............................................................................................................................. 10
2.6 Introduction to Non-contact Heart Monitoring .............................................................................. 10
2.6.1 Capacitive Coupled Non-contact Electrocardiography (CCNE) ................................................. 11
2.6.2 Non-contact Heart Monitoring Without Bioelectric Signals ..................................................... 12
2.7 Summary of Current Technologies .................................................................................................. 14
Chapter 3: Methods .................................................................................................................................. 15
3.1 Feasibility ........................................................................................................................................ 15
3.1.1 Test and Materials.................................................................................................................... 15
3.1.2 Feasibility Breadboard Circuit .................................................................................................. 16
3.1.3 Feasibility Results ..................................................................................................................... 17
3.1.4 Advancements Post Feasibility Tests ........................................................................................ 20
3.2 Simulation ....................................................................................................................................... 20
3.2.1 Modeling the Change in Volume with the Change in Pressure in the Tube ............................. 21
3.2.2 Anatomy of Heart and Respiratory Signals to the Chest .......................................................... 22
3.2.3 Application of the Model to the Transducer and Tubing Specifications ................................... 22
3.2.4 Data Acquisition and Gains ...................................................................................................... 24
3.2.5 Signal Processing Considerations ............................................................................................. 25

v
3.2.6 Circuit Board and Materials...................................................................................................... 25
3.2.7 Simulation Experiment ............................................................................................................. 27
3.2.8 Need for Improvements ........................................................................................................... 28
3.3 Full System Prototype ..................................................................................................................... 28
3.3.1 Overall Design Considerations ................................................................................................. 28
3.3.2 Software and Sensors Chosen .................................................................................................. 29
3.3.3 Ergonomics............................................................................................................................... 30
3.3.4 Power Requirements and Scheme ........................................................................................... 31
3.3.5 Product Design ......................................................................................................................... 33
3.3.6 Circuit Design ........................................................................................................................... 34
3.3.7 Bladder Configuration .............................................................................................................. 41
3.3.8 Software Development ............................................................................................................ 42
3.3.9 Institutional Review Board Human Testing .............................................................................. 43
3.3.10 Analysis and Signal Processing ............................................................................................... 44
3.3.11 Institutional Review Board Explorative Survey ....................................................................... 45
3.4 Signal Processing Techniques .......................................................................................................... 45
3.4.1 Fourier Series Analysis ............................................................................................................. 45
3.4.2 Cross Correlation and Cross Spectrum ..................................................................................... 45
3.4.3 Autocorrelation and Autospectrum ......................................................................................... 46
3.4.4 Coherence Function ................................................................................................................. 46
3.4.5 Averaging ................................................................................................................................. 46
3.4.6 Frequency Response Function ................................................................................................. 46
Chapter 4: Results and Discussion ............................................................................................................ 48
4.1 Simulation Results ........................................................................................................................... 48
4.2 Human Testing Results .................................................................................................................... 51
4.2.1 IRB Benchmark Testing ............................................................................................................ 51
4.2.2 IRB Explorative Survey ............................................................................................................. 58
4.3 Discussion ....................................................................................................................................... 58
4.3.1 Comparison of Current Technologies with HARMONI .............................................................. 58
4.3.2 Application of HARMONI in the Real World ............................................................................. 59
4.3.3 Assumptions for Real World Application.................................................................................. 59
4.4 Summary of Results ........................................................................................................................ 59

vi
Chapter 5: Conclusions and Future Work ................................................................................................. 60
5.1 Summary ......................................................................................................................................... 60
5.2 Future Work .................................................................................................................................... 61
5.2.1 Integration with Other Medical Technology ............................................................................ 61
5.2.2 Manufacturing a Custom Bladder ............................................................................................ 62
5.2.3 Improvement of Sensors and Chips ......................................................................................... 62
5.2.4 On Board Heart and Respiratory Rate Detection ..................................................................... 62
5.2.5 Fusing Pressure Data with an Accelerometer........................................................................... 63
5.3 Other Applications .......................................................................................................................... 63
5.3.1 Tracking Patients Movement and Vital Signs through a Mattress ............................................ 63
5.3.2 Creating a Smartphone Application for Every Day Use ............................................................ 64
5.3.3 Creating Noninvasive and Waterproof Exercise Monitor ......................................................... 64
References ................................................................................................................................................ 65
Appendix A: Circuit Boards and Schematics .............................................................................................. 66
Rev 2, Simulation Board ........................................................................................................................ 66
Rev 3, First Full System Prototype Board .............................................................................................. 67
Rev 4, Second Full System Prototype Board ......................................................................................... 68
Appendix B: MATLAB Code ....................................................................................................................... 69
MATLAB Code for Feasibility Results..................................................................................................... 69
MATLAB Code for Simulation Results ................................................................................................... 71
MATLAB Code for Human Testing Results ............................................................................................ 74
Battery Requirements for Full System Prototype ................................................................................. 77
Appendix C: LabVIEW Code....................................................................................................................... 79
Appendix D: IRB Forms ............................................................................................................................. 82
Appendix E: Results................................................................................................................................... 83
Simulation Testing Results .................................................................................................................... 83
IRB Benchmark Testing Results ............................................................................................................. 86
IRB Survey Results ................................................................................................................................. 89
Appendix F: Miscellaneous ..................................................................................................................... 103
vii
List of Figures
Figure 1-1. ECG image from the UMD Medical Center [4]. Used under fair use, 2012. ............................. 1
Figure 2-1. Diagram of the human heart [9]. Used under fair use, 2012. .................................................. 6
Figure 2-2. The basic pattern of electrical activity across the heart [11]. Used under fair use, 2012......... 7
Figure 2-3. Alive Mobile Cardiac Monitoring [12]. Used under fair use, 2012. .......................................... 8
Figure 2-4. Cardio Respiratory Belt by Twente Systems [14]. Used under fair use, 2012. ......................... 9
Figure 2-5. Respiration Monitor Belt diagram [15]. Used under fair use, 2012. ........................................ 9
Figure 2-6. A mobile pulse oximeter worn on the fingertip. Used under public domain. ........................ 10
Figure 2-7. Ford ECG Seat [18]. Used under fair use, 2012. ..................................................................... 11
Figure 2-8. Development device for sensing a person hiding in a car [20]. Used under fair use, 2012. ... 13
Figure 2-9. Illustration of how to sense a person hiding in a car [20]. Used under fair use, 2012. .......... 13
Figure 3-1. Feasibility test setup. Photo by author, 2012. ........................................................................ 16
Figure 3-2. Feasibility amplifier circuit. .................................................................................................... 17
Figure 3-3. Feasibility normalized data results in the time domain. ........................................................ 18
Figure 3-4. Feasibility autospectrum results up to the 50 Hz Nyquist frequency. .................................... 19
Figure 3-5. Feasibility autospectrum results up to 4 Hz. .......................................................................... 19
Figure 3-6. Visual interpretation of tubing being compressed by an impulse. ......................................... 21
Figure 3-7. Approximate epicenters for heart and respiratory impulse not drawn to scale. ................... 23
Figure 3-8. Simulation PCB schematic. ..................................................................................................... 26
Figure 3-9. Simulation PCB after populating the components. Photo by author, 2012. .......................... 26
Figure 3-10. Simulation device with tubing and chest strap. Photo by author, 2012. .............................. 27
Figure 3-11. Simulation device on the simulated breathing mannequin’s chest. Photo by author, 2012. 27
Figure 3-12. Prototype block diagram for power opeartion. ................................................................... 32
Figure 3-13. A rendition of the prototype targeted appearance. ............................................................. 33
Figure 3-14. EAGLE Schematic surrounding the BQ24123 switch mode charge manager. ...................... 35
Figure 3-15. EAGLE Schematic containing the MAX16054 on/off controller............................................ 36
Figure 3-16. EAGLE Schematic containing the amplifier and data acquisition circuit............................... 36
Figure 3-17. Prototype amplifier and DC decoupling circuit. ................................................................... 37
Figure 3-18. EAGLE Schematic showing the two JST connectors that are used for the LCD screen. ........ 39
Figure 3-19. EAGLE Schematic showing Bluetooth® module, and the Antenna. ...................................... 40
Figure 3-20. Prototype PCB board layout with dimensions. ..................................................................... 40
Figure 3-21. Prototype PCB after being populated. Photo by author, 2012. ............................................ 41
Figure 3-22. Prototype bladder configuration used for human testing. Photo by author, 2012. ............. 42
Figure 3-23. ECG lead locations during human testing. Photo by author, 2012. ...................................... 43
Figure 3-24. Human testing setup. Photo by author, 2012. ..................................................................... 44
Figure 4-1. Simulation device autospectrum results at 24 RR shown up to the 500 Hz Nyquist. ............. 49
Figure 4-2. Simulation device output as a function of time for the 24 RR test. ........................................ 50
Figure 4-3. Simulation device autospectrum results at 24 RR. ................................................................. 50
Figure 4-4. Subject 4 time domain and autospectrum results for the Full System Prototype. ................. 52
Figure 4-5. Subject 4 time domain and autospectrum results for the ECG. ............................................. 53

viii
Figure 4-6. Subject 4 coherence function results between the Full System Prototype and the ECG. ...... 54
Figure 4-7. Subject 2 time domain and autospectrum results for the Full System Prototype. ................. 55
Figure 4-8. Subject 2 time domain and autospectrum results for the ECG. ............................................. 55
Figure 4-9. Subject 2 coherence function results between the Full System Prototype and the ECG. ...... 56
Figure 5-1. Suggested implementation of emergency response companion application. ....................... 61

ix
List of Tables
Table 1. Approximate values for estimating pressure change. ................................................................ 22
Table 2. Pressure transducer metrics. ....................................................................................................... 24
Table 3. Prototype design constraints....................................................................................................... 30
Table 4. Logic conditioning for an AND gate. ........................................................................................... 32
Table 5. Prototype PCB current draw by component................................................................................ 32
Table 6. Simulated versus observed frequencies during simulation testing. ........................................... 51
Table 7. HARMONI vs. ECG observed respiratory frequencies and coherence. ....................................... 57
Table 8. HARMONI vs. ECG observed heart rate frequencies and coherence. ......................................... 57
1
Chapter 1: Introduction
Tracking heart and respiratory rates has always been at the foundation of emergency medical
care. For years, Emergency Medical Technicians, or EMT’s, have been told to rapidly estimate a
casualty’s heart and respiratory rate in order to better triage their patients. However, there are often
cases where patients are over-triaged or even under-triaged [1]. This study is intended to explore the
idea of using pressure transducers to actively detect heart and respiratory rates in a rapidly deployable
form factor for use in emergency response situations. The objective is to provide more information
throughout the triage process, without hindering the caregiver’s ability to respond to multiple
casualties.
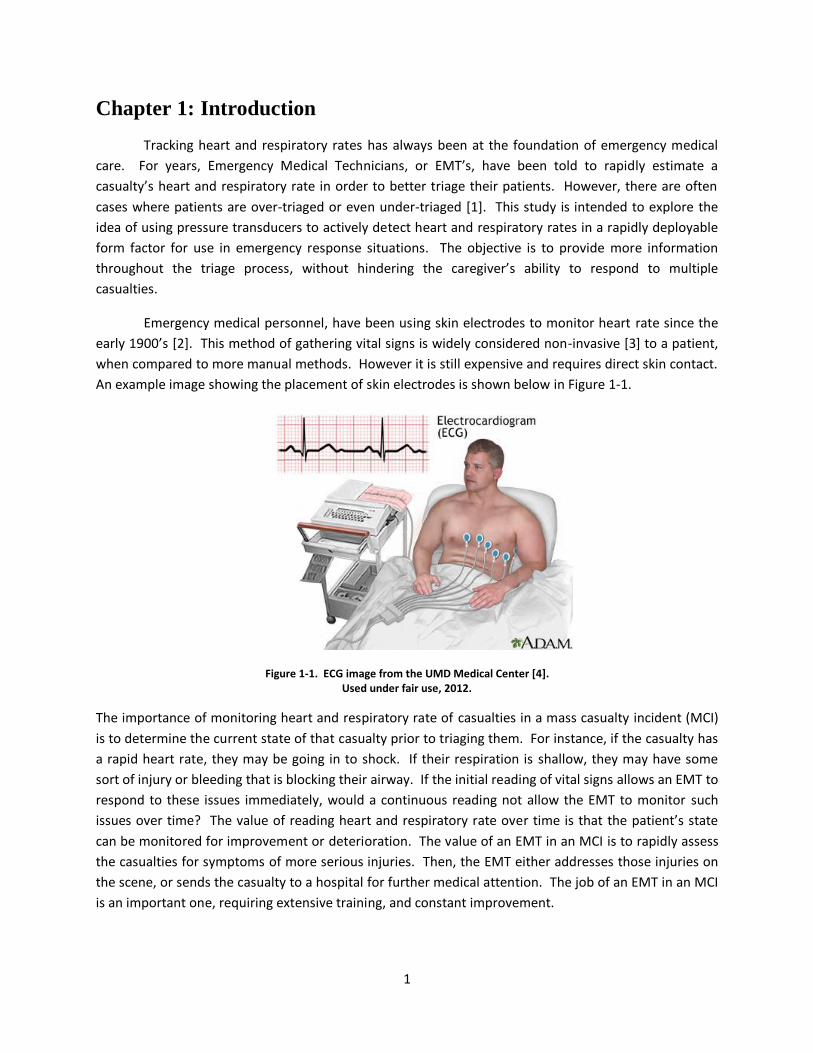
Emergency medical personnel, have been using skin electrodes to monitor heart rate since the
early 1900’s [2]. This method of gathering vital signs is widely considered non-invasive [3] to a patient,
when compared to more manual methods. However it is still expensive and requires direct skin contact.
An example image showing the placement of skin electrodes is shown below in Figure 1-1.
Figure 1-1. ECG image from the UMD Medical Center [4]. Used under fair use, 2012.
The importance of monitoring heart and respiratory rate of casualties in a mass casualty incident (MCI)
is to determine the current state of that casualty prior to triaging them. For instance, if the casualty has
a rapid heart rate, they may be going in to shock. If their respiration is shallow, they may have some
sort of injury or bleeding that is blocking their airway. If the initial reading of vital signs allows an EMT to
respond to these issues immediately, would a continuous reading not allow the EMT to monitor such
issues over time? The value of reading heart and respiratory rate over time is that the patient’s state
can be monitored for improvement or deterioration. The value of an EMT in an MCI is to rapidly assess
the casualties for symptoms of more serious injuries. Then, the EMT either addresses those injuries on
the scene, or sends the casualty to a hospital for further medical attention. The job of an EMT in an MCI
is an important one, requiring extensive training, and constant improvement.
2
1.1 Emergency Medical Response Situations
When an emergency MCI occurs, the overall response is usually a three step process. The
responders typically begin by setting up a command center in a safe location near the incident scene.
The second step, and perhaps the most critical one, is to triage the patients. Triage is the process of
determining the condition of all victims involved in the incident. During this stage, patients are
prioritized based on severity of their injuries. The third step is to transport patients to a hospital in the
prioritized order determined during the triage stage. There are several different acronyms and methods
used to help first responders become better at the entire process. In general, they all follow the same
three step approach as outlined. Similarly, the individual response to each casualty is a three step
process. This individual response is known as the ABC’s of EMT’s. This prompts checking the airway for
obstruction, then the breathing rate, and finally checking the casualty’s circulation.
1.1.1 Civilian Emergency Medical Applications
In a study related to the use of triage protocols for assessing patients, a well accepted protocol
was evaluated for a mass casualty triage of 132 patients. It was found that 64 patients (48%) were
triaged correctly, 65 were over-triaged (49%), and 3 were under-triaged (2%) [1]. During a MCI, triage
decisions must be made after taking the availability of resources in to consideration. As the National
Guideline for Mass Casualty Triage reports, “Responding to 30 victims with 4 ambulances is different
from responding with 16 ambulances and numerous responders” [1].
It is widely accepted in the emergency medical community that a minimum 15 second time
period is required to estimate a patient’s pulse. The same time period is required for respiratory rate
[5]. However, that is based on the assumption that the EMT is capable of doing near instantaneous
calculations in their head, and that they did not have difficulty finding the pulse in the first place. A
rapidly deployable heart and respiratory monitor would allow for emergency responders to concentrate
more on triaging the patients appropriately, than on estimating the patient’s vital signs.
1.1.2 Military Emergency Medical Applications
EMTs are constantly being thrown in to situations on a daily basis where they are accustomed to
restore order out of chaos. However, there are times when the need for their services far exceeds their
capacity to provide them [6]. No one can attest to this more than, Thomas A. Middleton, who served as
a combat medic in Iraq as part of Task Force Saber from June 2005 to June 2006, before returning home
to serve as assistant fire marshal in Burlington, Vermont. Thomas wrote a book on his experiences, but
relates several very important tips based on his time as a combat medic. The first thing to do in a MCI is
to shout at all of the casualties and ask them to move toward the sound of your voice. Those that
respond are likely of lowest priority, those that can at least walk are termed delayed and those that
don’t move are termed immediate. Middleton goes on to note that the responder’s knees should never
touch the ground, because that results in a tendency to focus on a single patient. A general rule of
thumb is that each patient should be re-assessed every five minutes for an immediate patient, and every
fifteen minutes for a delayed patient [6]. Note that the main concern of an emergency responder in an
3
MCI is to tag and assess patients so that further treatment can be made down the line. It is a difficult
but necessary task, and emergency responders need all the help they can get. Middleton himself admits
that “no one ever gets it exactly right, and there will always be room for improvement” [6].
1.1.3 The Need for Vital Sign Monitors in Mass Casualty Incidents
There are incidents every day where the number of casualties outweighs the resources of the
emergency responders. Therefore, any monitor that would seamlessly fit in to such a situation, without
requiring extensive training, or without interrupting patient care, would be a worthwhile technology.
There are several methods that exist that allow vital sign monitoring, from respiratory belts, to wet
electrodes, to manual estimation. However, there is no single device that can seamlessly, noninvasively,
and rapidly be applied during an MCI. There is no single device that would allow an individual EMT to
monitor multiple casualty’s heart and respiratory rates simultaneously.
What if there was such a device? What if there were methods that allowed an EMT to monitor
casualty’s heart rates without having to place electrodes on to the skin? What if there were ways for
one EMT to wirelessly monitor all casualties, without being distracted from the most critical ones?
1.2 Detecting Vital Signs without Using Bioelectric Signals
There are several areas of research in to noncontact patient monitoring. While some
technologies such as an ECG monitor bio-electric signals, other technologies monitor pure mechanical
signals within the body. One such method, of mechanical monitoring, is using highly sensitive pressure
transducers to monitor patients. It works by plugging off one end of a length of tubing, then attaching
the other end to the pressure transducer. The mechanical response of the chest due to heart and
respiratory rate causes the pressure in the tubing to change. The tubing replaces the skin electrode as
the nearest part of the device to the patient. It can be used in a chest strap form factor, and placed over
clothing near the area of maximum cardiac impulse. This would greatly reduce the time that otherwise
would be required to remove the patient’s clothing and to place the electrodes properly.
The ability to create a sensor that does not require skin electrodes would be valuable in many
ways beyond its reduced invasive nature. Consider a MCI such as the ones EMTs are called to. Many
different people require aid and monitoring, yet the ratio of patients requiring attention to EMTs is
often too high. Being able to swiftly install a wireless monitoring device on patients over their clothing
would be a valuable time saver. Also, if the system can generate alerts when vital signs fall outside
normal parameters, this would be of tremendous value as well.
This technology could also be utilized for monitoring military and civilian underwater
technicians. Skin electrodes are a reliability risk when being used underwater. In contrast, medical
tubing and the pressure transducers can easily be waterproofed for use in monitoring the heart and
respiratory rates of a diver. Combine this with a wireless transceiver, and this device would be capable
of providing underwater situational awareness. All of these benefits make the technology a worthwhile
application in an MCI. What other technologies exist that can be applied in an MCI? What are their
apparent benefits and drawbacks?
4
Chapter 2: Literature Review
There are several different methods of heart and respiratory monitoring that can be applied in
an emergency response situation. Understanding what existing technologies have been able to
accomplish, is the first objective. To do this, a review of heart and respiratory rate information is
conducted, followed by a look at mobile health monitors that are currently on the market. This includes
a look at both bioelectric and mechanical monitors.
Regardless of the approach, it is important to recognize that each technology has its pros and
cons. For instance, ECG provides an in depth look at the heart’s operation, giving more than just heart
rate. It also provides respiratory rate by comparing the signals received by multiple leads. However, it is
expensive, requires direct skin contact, and can easily be disrupted by movement or moist
environments. Other industry standard technologies include the pulse oximeter, which is a small sensor
usually placed on the fingertip that measures the oxygenation of a patient’s hemoglobin. It is small
affordable, and provides a very clear heart rate signal. However, it is easily interrupted by small body
movements, and its most practical application is in the intensive care unit (ICU) where patients are
extremely stationary over time. Other current technologies include impedance and pressure belts for
monitoring respiratory rate. They are great for monitoring respiratory rate, but do not necessarily make
an attempt to monitor heart rate simultaneously.
While these traditional ECG monitors have provided the basis for heart and respiratory
monitoring for decades, there has been a wealth of research on improving the technology. Such
improvements include making them less invasive, more mobile, and by adding wireless capabilities.
Integrating wireless heart and respiratory monitors is also one of the fields of improvement. It is an idea
that has been around since the early 2000’s. The first application of wireless technology in a medical
environment was wireless local area networks [7]. Since then, integrating wireless technologies in to
medical devices has been in the forefront of noninvasive medical research. One attempt at making
ECG’s less invasive is non-contact ECG’s which utilize capacitively coupled leads to measure heart rate
through thin layers of material such as a t-shirt. Another attempt to truly push the definition of the
term non-invasive is a vital sign monitor of humans inside a vehicle. A mechanical explanation of what
they are attempting to do might disprove their results. However, their methods are helpful in
understanding how to use pressure sensors to monitor vital signs.
2.1 Background Information on Heart and Respiratory Rate
When considering heart and respiratory rates in emergency situations, one must be prepared to
detect both the upper and lower limits of each. Tachycardia refers to the abnormally rapid heart rate,
while bradycardia refers to abnormally slow heart rate [8]. Similarly, tachypnea and bradypnea refer to
the abnormal high and low respiratory rates respectively. All four limits vary with age and health.
However, in general, safe heart rate can vary as low as 40 beats per minute (HR) for experienced adult
athletes, and as high as 160 HR for babies. In general the safe respiratory rate is as low as 12 breaths
per minute (RR) for older adults, and as high as 40 RR for newborn babies [5]. With such a range of
values, there is a need for methods and devices that are both accurate and versatile.
5
2.2 Manual Methods for Heart and Respiratory Rate Estimation
The most common method of estimating heart and respiratory rates is to do so manually.
Nurses, doctors, and in this case EMT’s have been trained to do this in a very simple manner. For
observing the radial pulse, they place their middle and index fingers gently along the inside of the wrist.
For a quick estimate, count the number of pulses felt during 15 seconds, then multiply that number by 4
to get the bpm. The same thing goes for breathing. Watch the patient’s chest and count the number of
times it cycles during 15 seconds, and then multiply that number by 4 to get the breaths per minute.
Assuming the patient is cooperative, and the EMT is rapid in their estimations, this takes a task takes a
minimum of 30 seconds to complete. The result of manual heart and respiratory rate estimation is a
single value at a specific instance in time and does not provide the attention that many patients require
over long term care. This is the instigating factor behind creating monitors that actively track the
patient’s vital signs over time.
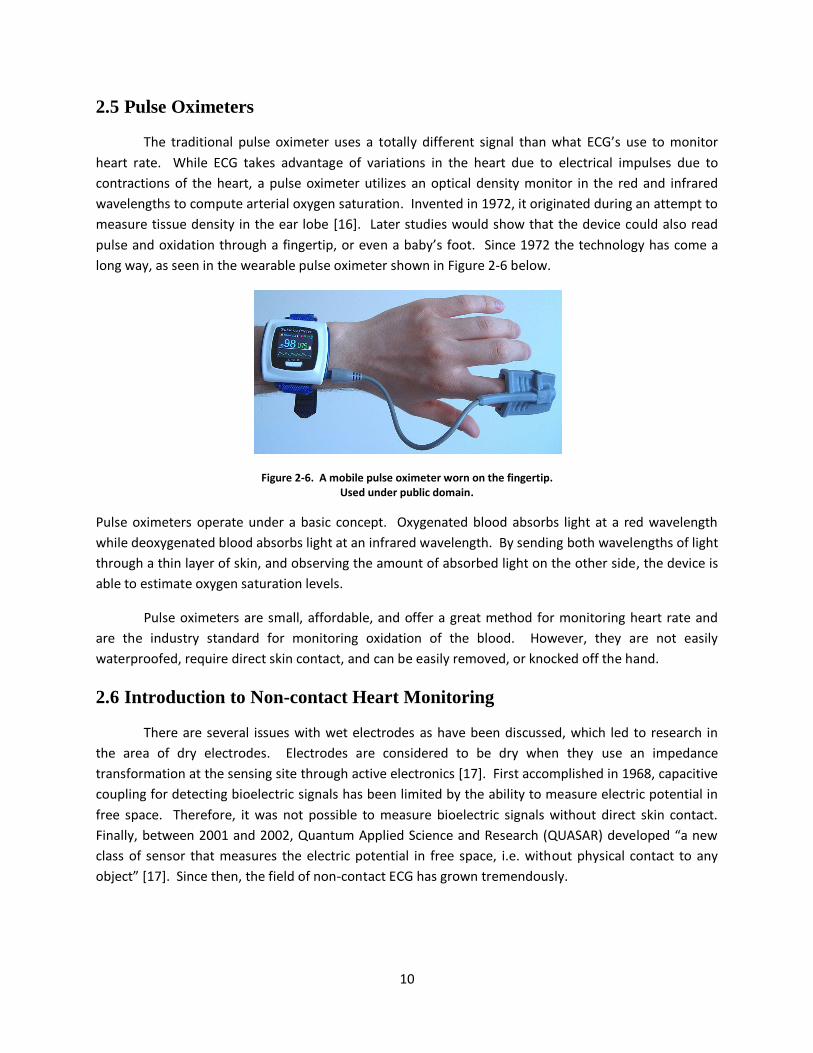
2.3 Electrocardiography (ECG)
The most widely used form of heart monitoring is the electrocardiography. Originally invented
in 1872, electrocardiography is “the recording of the electrical activity generated by the cells of the
heart that reaches the body surface” [9]. It is this electrical activity of the heart that initiates the muscle
to contract and pump blood to the rest of the body. The most common application of an ECG is to
observe abnormal rhythms of the heart in patients. An ECG wet electrode is what connects the
measurement device to the patient. Electrodes are considered to be wet when they contain an
electrolyte gel. The purpose of this gel is to decrease the influence of the skin on the impedance by
moisturizing its dry outer layer and making it more ion-conductive [10]. They are required to be placed
directly against the patient’s skin, and often require the area to be cleaned with alcohol, or even shaved.
The standard 12 lead ECG is capable of representing the heart’s electrical activity from several different
locations on the patient. The results of an ECG are in terms of voltage and are always comprised of
different waves representing different contractions and behaviors of the heart. A diagram of the heart
can be seen below in Figure 2-1.
6
Figure 2-1. Diagram of the human heart [9]. Used under fair use, 2012.
Each wave can be described as a P, QRS, or T wave. The P wave is a deflection wave that is
caused by atrial depolarization. The PR interval is the time between the first variation in the P wave, and
the first variation on the QRS spike. The three point QRS wave represents ventricular depolarization.
The first downward deflection is the Q wave, and represents the depolarization of the interventricular
septum. The large upward peak is the R wave, and represents the depolarization of the main mass of
the ventricles. Finally the second downward deflection is the S wave, and represents the final
depolarization of the ventricles at the base of the heart. The T wave corresponds with ventricular
repolarization, hence the fact that the ST segment, is the time between ventricular depolarization and
repolarization [11]. An example of the resulting waveform can be seen below in Figure 2-2.

7
Figure 2-2. The basic pattern of electrical activity across the heart [11]. Used under fair use, 2012.
Based on reliability and availability, the ECG is the clear industry standard when it comes to
heart monitoring. This also makes it the most widely attempted base device for mobile heart
monitoring. While it allows users to have a comprehensive view of their heart’s performance, it still
involves constant direct skin contact in order to function. As will be discussed, it is clear that all
electrode based mobile heart monitors have their benefits and drawbacks due to this constraint. The
most notable drawbacks being that they are invasive to the patient, take time to attach, and usually
require the surface to be wet, but not so much as to disrupt the bioelectric signal.
One mobile technology that delivers ECG data to an active patient is the Alive Heart and Activity
Monitor by Alive Technologies. This device has a wide variety of applications, from “cardiac rehab, to
cardiovascular screening, home monitoring, disease management, falls monitoring, fitness monitoring,
sports training” [12], and more. It utilizes a 3 axis accelerometer and a 2 lead electrode based ECG
system. The small form factor allows it to be worn in nearly any activity. However, it is still l imited to
the fact that it requires the wet electrodes in order to operate. This means that it shares the same
drawbacks of all wet electrode based approaches. Firstly the material used to create the electrode or
paste could cause irritation and discomfort to the skin, especially if the subject is in the middle of a
heavy physical activity and may be perspiring [13]. Another issue is that during bodily movements, the
leads may loosen, breaking electrical contact and causing noise spikes in the signal [13]. Figure 2-3
below shows the Alive Mobile Cardiac monitor according to their product brochure.

8
Figure 2-3. Alive Mobile Cardiac Monitoring [12]. Used under fair use, 2012.
While this device is capable of finding bioelectric signals, it does not seem to adhere to the
physical lifestyle of the consumers it is geared towards. It does not account of the issue of excess sweat,
nor does it deal with the issue of discomfort over long periods of time. This mobile cardiac monitoring
unit may be portable but it does not have the ability to save time in an emergency response
environment, because it still requires the precise placement of electrodes on the patient.
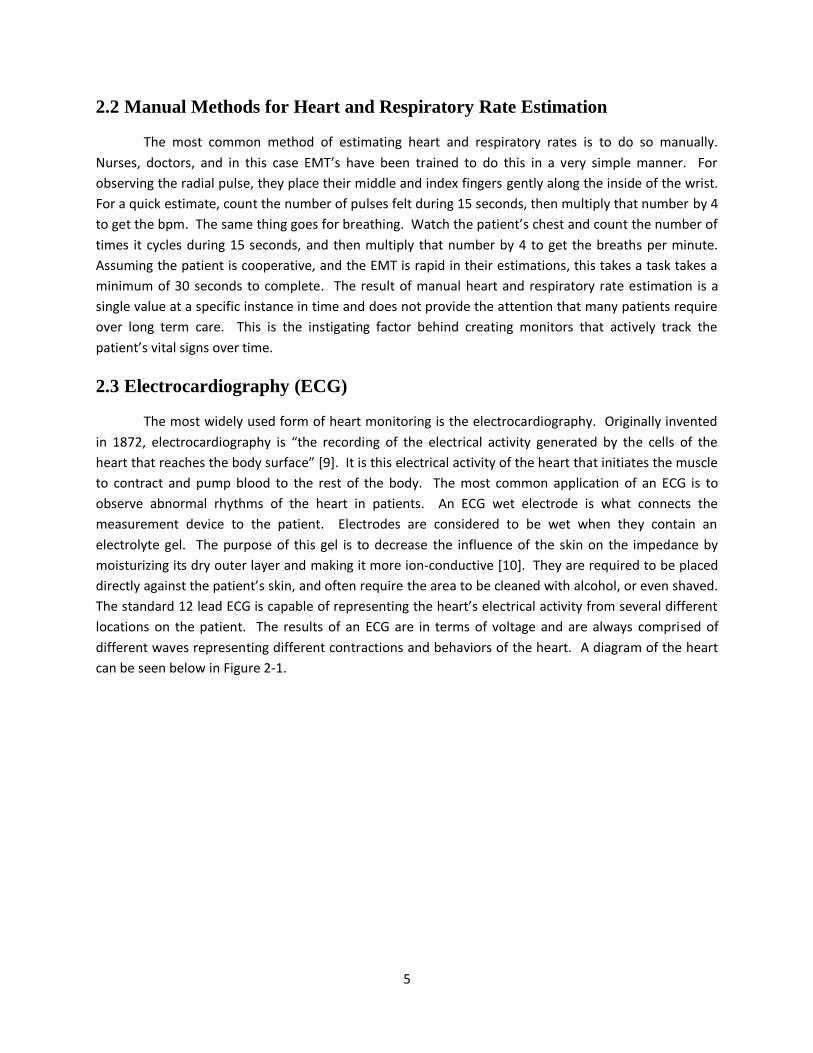
2.4 Respiratory Monitoring Using Impedance and Pressure Belts
Another technology that is akin with HARMONI in terms of recording respiratory rate is the
Cardio Respiratory Belt by Twente Medical Systems International (TMSI). Specializing in physiological
instrumentation, TMSI develops multi-channel amplifiers and data acquisition (DAQ) systems. Their
cardio-respiratory belt utilizes a dual purpose belt that can measure both the resistance and inductance
the belt when it undergoes changes due to breathing. The direct result is a respiratory signal, where
apnea and other respiratory issues can be seen and evaluated. The belt does not specify that it needs to
be worn directly on the skin, and is simply too large of an item to be used in the emergency MCI’s where
HARMONI is intended to be utilized. The cardio respiratory belt is seen below in Figure 2-4.
9
Figure 2-4. Cardio Respiratory Belt by Twente Systems [14]. Used under fair use, 2012.
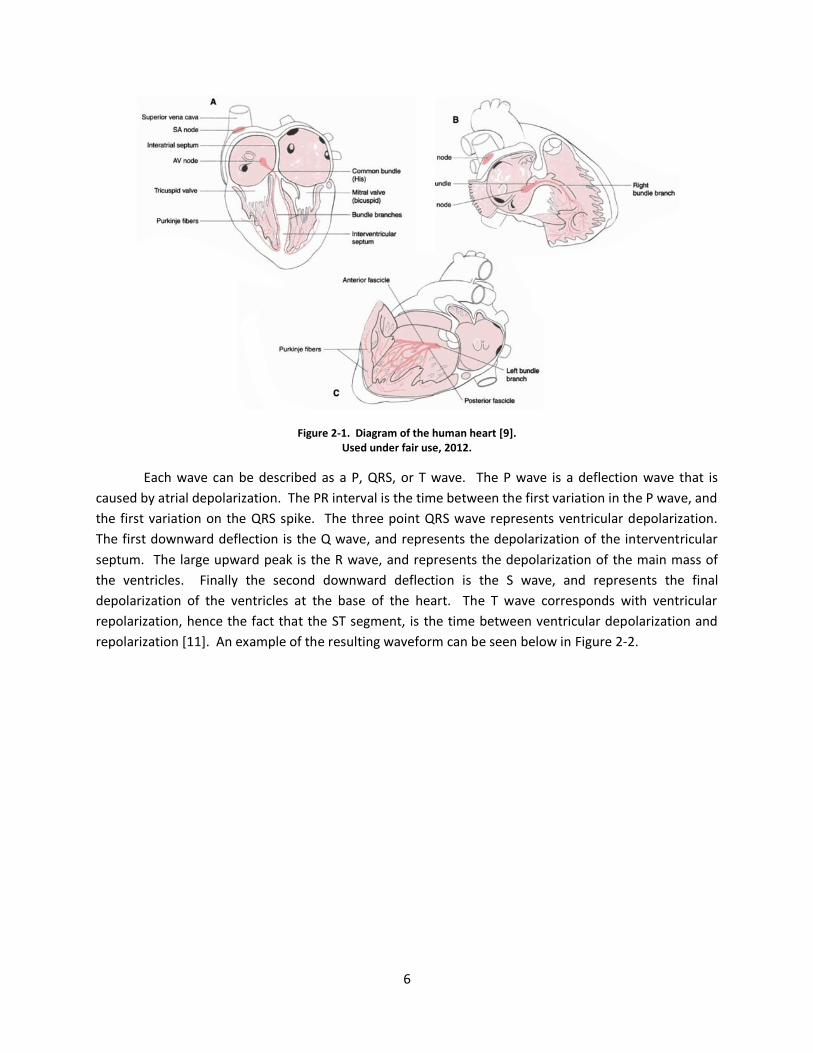
Yet another technology that actually does utilize pressure transducers to detect respiratory
rates is the Respiration Monitor Belt by Vernier Software and Technology. Their monitor is composed of
a belt strap that is secured around the chest of a patient using Velcro. The belt is positioned directly
over the diaphragm, with an air bladder resting near the base of the rib cage as seen in Figure 2-5 below.
Figure 2-5. Respiration Monitor Belt diagram [15]. Used under fair use, 2012.
When the user has the belt in position, they pump up the air bladder to about 106 kPa, and then begin
data collection. As the user breaths, their chest compresses against the air bladder, causing a change in
pressure. The results are then analyzed using peak to peak estimation, to determine the respiration rate
[15]. The device does not have any wireless connectivity options, and it requires a secondary sensor in
order to estimate heart rate. That being said, it does utilize the same proposed method for monitoring
heart and respiratory rate.
While all of these products described are capable of detecting heart and respiratory rate, all of
the heart rate monitors require direct contact with the patient’s skin. However, there are several non-
contact methods for heart rate monitoring using newer technologies such as dry electrodes.
10
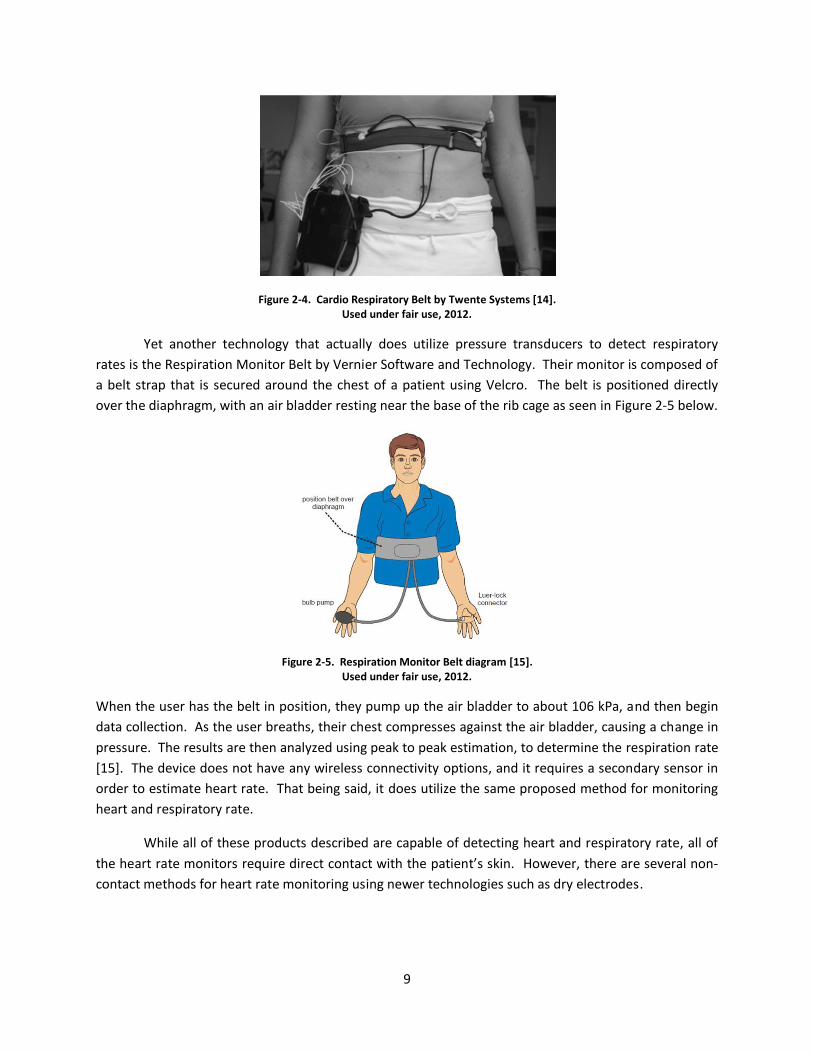
2.5 Pulse Oximeters
The traditional pulse oximeter uses a totally different signal than what ECG’s use to monitor
heart rate. While ECG takes advantage of variations in the heart due to electrical impulses due to
contractions of the heart, a pulse oximeter utilizes an optical density monitor in the red and infrared
wavelengths to compute arterial oxygen saturation. Invented in 1972, it originated during an attempt to
measure tissue density in the ear lobe [16]. Later studies would show that the device could also read
pulse and oxidation through a fingertip, or even a baby’s foot. Since 1972 the technology has come a
long way, as seen in the wearable pulse oximeter shown in Figure 2-6 below.
Figure 2-6. A mobile pulse oximeter worn on the fingertip. Used under public domain.
Pulse oximeters operate under a basic concept. Oxygenated blood absorbs light at a red wavelength
while deoxygenated blood absorbs light at an infrared wavelength. By sending both wavelengths of light
through a thin layer of skin, and observing the amount of absorbed light on the other side, the device is
able to estimate oxygen saturation levels.
Pulse oximeters are small, affordable, and offer a great method for monitoring heart rate and
are the industry standard for monitoring oxidation of the blood. However, they are not easily
waterproofed, require direct skin contact, and can be easily removed, or knocked off the hand.
2.6 Introduction to Non-contact Heart Monitoring
There are several issues with wet electrodes as have been discussed, which led to research in
the area of dry electrodes. Electrodes are considered to be dry when they use an impedance
transformation at the sensing site through active electronics [17]. First accomplished in 1968, capacitive
coupling for detecting bioelectric signals has been limited by the ability to measure electric potential in
free space. Therefore, it was not possible to measure bioelectric signals without direct skin contact.
Finally, between 2001 and 2002, Quantum Applied Science and Research (QUASAR) developed “a new
class of sensor that measures the electric potential in free space, i.e. without physical contact to any
object” [17]. Since then, the field of non-contact ECG has grown tremendously.

11
2.6.1 Capacitive Coupled Non-contact Electrocardiography (CCNE)
One of the first evaluations of dry electrode technology was done in 2004 by Walter Reed Army
Institute of Research (WRAIR). Their objective was to evaluate the use of CCNE’s, for use on the future
Objective WarFighter uniform. The results of the study showed that there was a high correlation
between the normal ECG, and the CCNE. Furthermore, it was shown that the CCNE method provides
unbiased estimates of ECG results [17].
Yet another evaluation of dry electrode technology was done in 2006 by a collaborative team of
the University of California, and QUASAR, which was the group that originally developed capacitively-
coupled electrodes. In the report, the engineers stated that wet electrodes are simply not capable of
being used in high activity situations. The team was able to develop a 3 lead ECG monitoring system
that weighed less than 17 grams. In addition the team says that their system integrates capacitive ECG
sensors, which have been demonstrated to have 99% correlation with conventional electrodes [13].
The ECG chair, created by the Ford European Research and Innovation Center in Germany is
another technology that utilizes non-contact ECG’s to detect heart rate. The purpose of the technology
is to actively monitor heart rate of a driver and in the case of a heart attack, to provide an automated
vehicle response to ensure the safety of the driver of the vehicle. It is claimed that the seat produces
correct results during 98 percent of driving time for 95 percent of drivers [18]. The seamless integration
of this technology in to the seat is seen below in Figure 2-7.
Figure 2-7. Ford ECG Seat [18]. Used under fair use, 2012.
With all of these noncontact electrodes being researched and evaluated, a group at IEEE
developed a methodological review on dry electrode technologies. The study adds that wet electrodes
are used almost universally in clinical applications today, provide an excellent signal, but are
“cumbersome and irritating for mobile use” [19]. The group divides the performance of all electrodes in
to two categories. First is the signal to noise ratio (SNR) of the device, and motion sensitivity. Second is
the comfort of the device based on its interface to the skin, either by contact or proximity. Wet
electrodes simply do not have the ability to transmit bioelectric signals through cotton clothing. Even a
thin layer of cotton acts like a large resistor. The clothing introduces large noise signals, rendering wet
electrodes useless in noncontact applications. Likewise, movement of the electrodes can cause an
12
artifact in the signal, creating bias. It was found that while dry electrodes allow the devices to be worn
over clothing, they still often succumb to the same motion induced artifacts that wet electrodes do. The
main way around this is to require a tight vest and chest band [19], in order to secure the electrodes in
place, and reduce movement. This also leads in to the second issue with dry electrodes, of friction
based artifacts from the sensors rubbing up against the clothing. The tighter the strap around the body,
the less likely motion or friction induced artifacts will distort the signal. It can be concluded that while
wet electrodes provide direct and accurate results, they were simply prone to issues with skin irritation,
as well as motion induced noise. Meanwhile dry electrodes, still only provide accurate results after
being applied within a micrometer of the skin, and with tendencies to fluctuate under motion and
friction induced noise.
2.6.2 Non-contact Heart Monitoring Without Bioelectric Signals
While capacitively-coupled ECGs have been proven effective in strict test environments, they
still require very close proximity to the patient. Often times an electrode based approach is simply not a
practical method for gathering vital signs. However, there are very few devices that are capable of non-
contact heart monitoring without the use of bioelectric signals.
One device that has been researched as a method for detecting vital signs without using
bioelectric signals actually uses a similar approach. However, instead of trying to detect vital signs
through clothing, they attempt to detect vital signs through vehicle tires. The project is aimed at helping
homeland security through border control. The final criteria are that a vehicle must pull on to a place of
highly sensitive pressure sensors, turn off their engine, and all occupants must get out of the vehicle. If
a person is hiding inside the vehicle, then the pressure sensor is supposed to detect their heart beat or
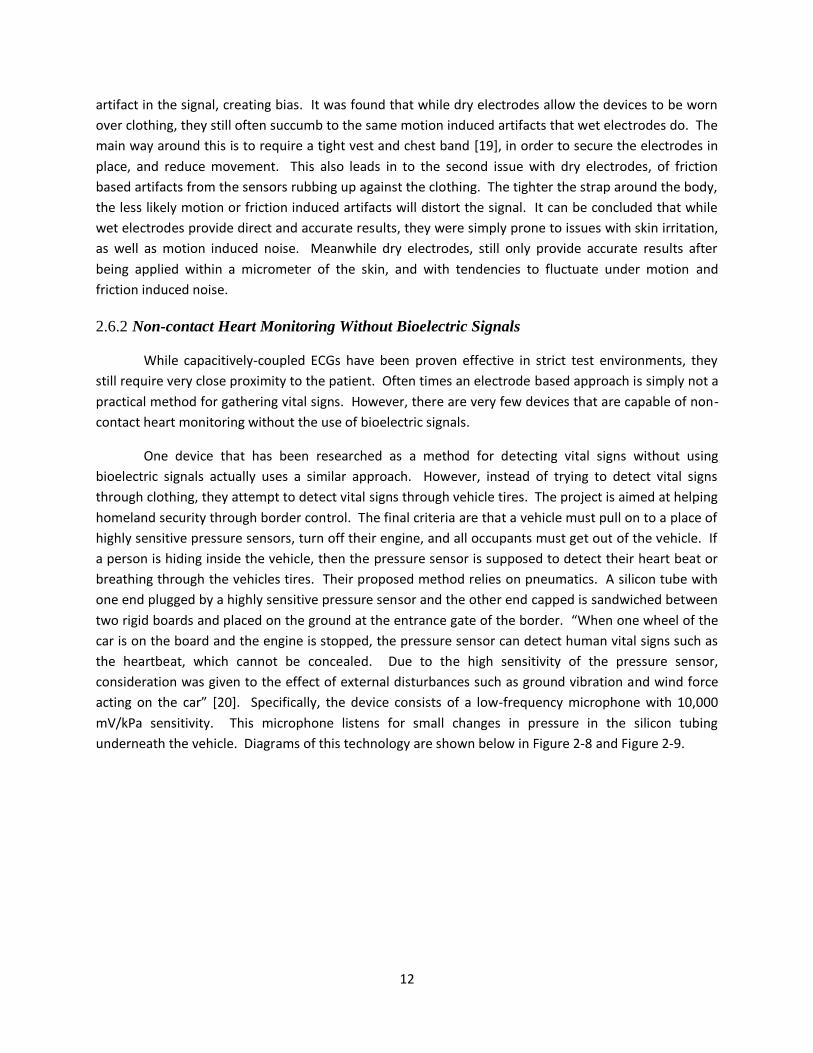
breathing through the vehicles tires. Their proposed method relies on pneumatics. A silicon tube with
one end plugged by a highly sensitive pressure sensor and the other end capped is sandwiched between
two rigid boards and placed on the ground at the entrance gate of the border. “When one wheel of the
car is on the board and the engine is stopped, the pressure sensor can detect human vital signs such as
the heartbeat, which cannot be concealed. Due to the high sensitivity of the pressure sensor,
consideration was given to the effect of external disturbances such as ground vibration and wind force
acting on the car” [20]. Specifically, the device consists of a low-frequency microphone with 10,000
mV/kPa sensitivity. This microphone listens for small changes in pressure in the silicon tubing
underneath the vehicle. Diagrams of this technology are shown below in Figure 2-8 and Figure 2-9.
13
Figure 2-8. Development device for sensing a person hiding in a car [20]. Used under fair use, 2012.
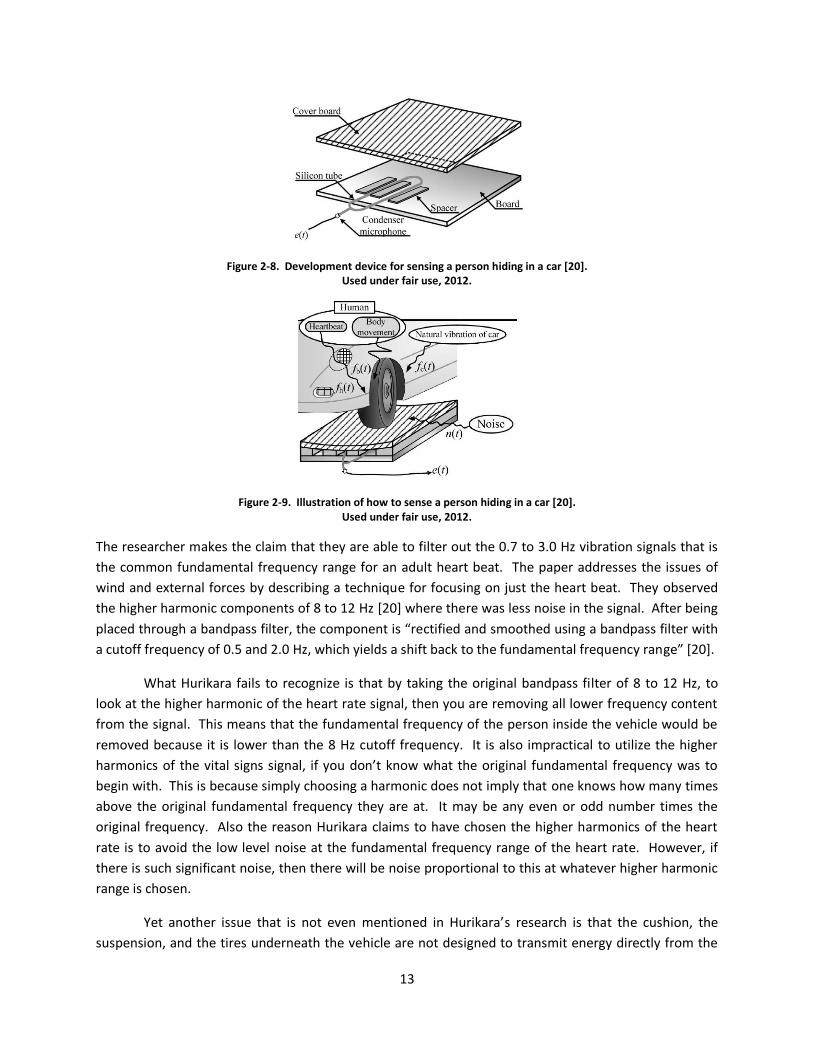
Figure 2-9. Illustration of how to sense a person hiding in a car [20]. Used under fair use, 2012.
The researcher makes the claim that they are able to filter out the 0.7 to 3.0 Hz vibration signals that is
the common fundamental frequency range for an adult heart beat. The paper addresses the issues of
wind and external forces by describing a technique for focusing on just the heart beat. They observed
the higher harmonic components of 8 to 12 Hz [20] where there was less noise in the signal. After being
placed through a bandpass filter, the component is “rectified and smoothed using a bandpass filter with
a cutoff frequency of 0.5 and 2.0 Hz, which yields a shift back to the fundamental frequency range” [20].
What Hurikara fails to recognize is that by taking the original bandpass filter of 8 to 12 Hz, to
look at the higher harmonic of the heart rate signal, then you are removing all lower frequency content
from the signal. This means that the fundamental frequency of the person inside the vehicle would be
removed because it is lower than the 8 Hz cutoff frequency. It is also impractical to utilize the higher
harmonics of the vital signs signal, if you don’t know what the original fundamental frequency was to
begin with. This is because simply choosing a harmonic does not imply that one knows how many times
above the original fundamental frequency they are at. It may be any even or odd number times the
original frequency. Also the reason Hurikara claims to have chosen the higher harmonics of the heart
rate is to avoid the low level noise at the fundamental frequency range of the heart rate. However, if
there is such significant noise, then there will be noise proportional to this at whatever higher harmonic
range is chosen.
Yet another issue that is not even mentioned in Hurikara’s research is that the cushion, the
suspension, and the tires underneath the vehicle are not designed to transmit energy directly from the
14
road to the passenger. Rather they are designed to dampen out vibrations that might interfere with the
driving experience. It is highly unlikely that such low amplitude, low frequency vibration of a person’s
heart rate is going to be transmitted directly through the tires to the pressure pad. A method of
monitoring heart rate through clothing rather than through a vehicle’s tires will encounter less noise and
therefore will require less signal processing than what Hurikara has proposed.
2.7 Summary of Current Technologies
With all of the technologies that have been explored, there is no single device like the one
proposed. An affordable device that can be rapidly deployed in to a MCI, that is capable of being a force
multiplier for a single EMT to monitor multiple casualties, would be a practical addition to the current
market of health monitors. The method of using pressure transducers to accomplish this was the result
of three main objectives. The first objective was that the device be sensitive enough to detect heart and
respiratory rates over clothing. This ability would greatly reduce the time required for an emergency
responder to administer the device. The second objective was that the device be compact and
affordable. The more compact and affordable, the more of these devices an EMT could carry in to a
MCI. Finally, the third objective was that the device be rugged. The more rugged the device, the more
likely it can withstand the hazardous environments where it might be utilized.
15
Chapter 3: Methods
Now that existing techniques and research in heart and respiratory monitoring has been
explored, a new method of using pressure transducers to detect both heart and respiratory rate will be
explained, developed, and tested. Three stages of research were implemented in order to accomplish
this. These stages were feasibility, simulated testing, and human testing. In feasibility, the concept
undergoes its first reduction to practice. During the simulation stage, the technology is implemented on
a printed circuit board (PCB), and then tested on a simulated breathing mannequin. Finally during the
human testing stage, the device is refined in to a prototype and tested on humans in order to correlate
its data with an industry standard ECG. Each stage involved materials, schematics, testing procedures,
and goals that will be explained in detail. The final step is to understand the applicable signal processing
techniques which will prove useful to analyze the testing and results. All of the details of the stages
described as well as the signal processing involved will be explored in this section.
3.1 Feasibility
The initial key to the technology was to prove whether or not the combination of pressure
transducers and flexible medical tubing can be used to adequately detect the desired signals.
Preliminary tests had to be designed to validate this concept. By attaching a small bladder or piece of
medical tubing to a pressure transducer, it is possible to create a movement sensor that is compact,
rugged, and sensitive. The idea is simple. Power the pressure transducer, attach a piece of medical
tubing, plug off its free end, and then place the apparatus against the chest. When a human breathes,
the rise in volume in the lungs causes the chest cavity to expand, resulting in a displacement in the
chest. You can think of the beating of the heart in the same way. When a human’s heart beats, the
result is a displacement in the chest, except usually at a much higher frequency and lower amplitude
when compared to breathing. It was determined that it might be possible to detect these displacements
through clothing, by pressing a piece of medical tubing to the chest, and monitoring the change in
pressure in the tubing using a pressure transducer. The feasibility results will show that it is possible to
extract heart and respiratory information using pressure transducers and tubing.
3.1.1 Test and Materials
With the conception of this idea came the need for a viability test. The experimental setup
consisted of three main components. These were the pressure transducer, the flexible medical tubing,
and an op-amp. The pressure transducer used was a Freescale temperature compensated and
calibrated MPVZ4006G series integrated silicon gauge pressure sensor with on-chip signal conditioning.
This sensor had a sensitivity of 766 mV/kPa. The nozzle was attached to one end of a section of
common medical tubing. Next, a 30 gain op-amp circuit was created with adjustable offset voltage.
Once the circuit was properly configured, the tubing was placed inside a strip of elastic medical wrap.
This medical wrap was then placed around the chest of a test subject. Images of this assembly can be
seen in Figure 3-1.
16
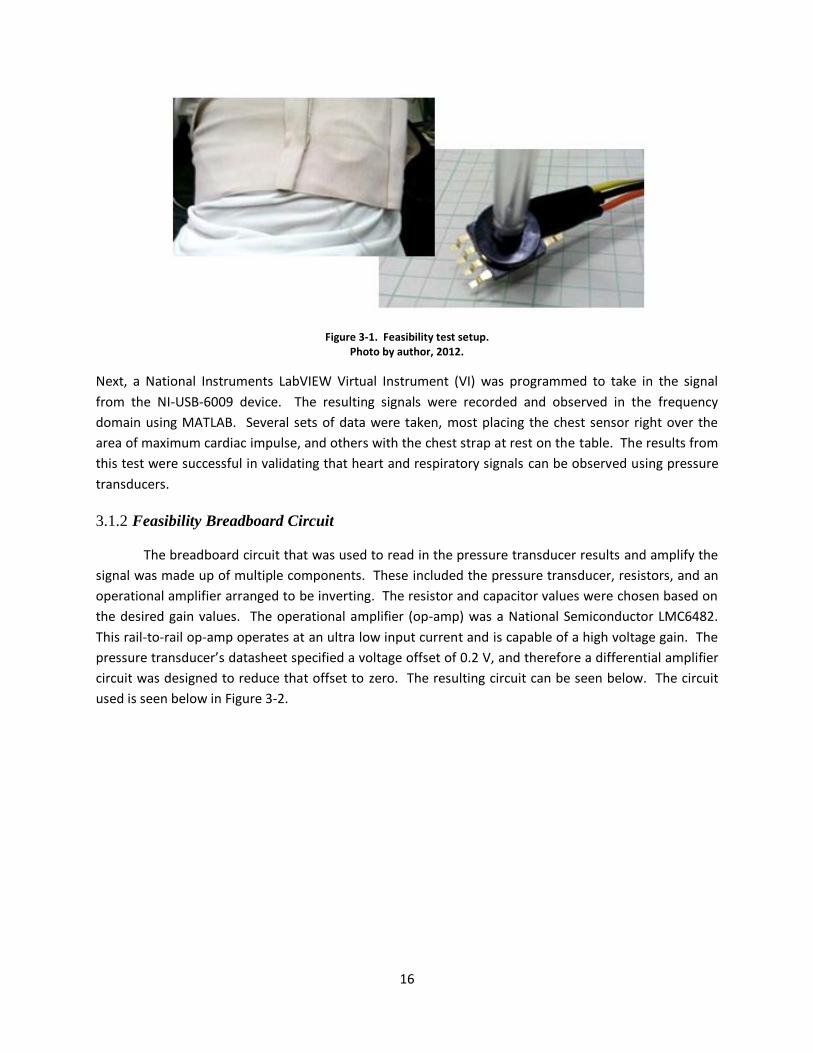
Figure 3-1. Feasibility test setup. Photo by author, 2012.
Next, a National Instruments LabVIEW Virtual Instrument (VI) was programmed to take in the signal
from the NI-USB-6009 device. The resulting signals were recorded and observed in the frequency
domain using MATLAB. Several sets of data were taken, most placing the chest sensor right over the
area of maximum cardiac impulse, and others with the chest strap at rest on the table. The results from
this test were successful in validating that heart and respiratory signals can be observed using pressure
transducers.
3.1.2 Feasibility Breadboard Circuit
The breadboard circuit that was used to read in the pressure transducer results and amplify the
signal was made up of multiple components. These included the pressure transducer, resistors, and an
operational amplifier arranged to be inverting. The resistor and capacitor values were chosen based on
the desired gain values. The operational amplifier (op-amp) was a National Semiconductor LMC6482.
This rail-to-rail op-amp operates at an ultra low input current and is capable of a high voltage gain. The
pressure transducer’s datasheet specified a voltage offset of 0.2 V, and therefore a differential amplifier
circuit was designed to reduce that offset to zero. The resulting circuit can be seen below. The circuit
used is seen below in Figure 3-2.
17
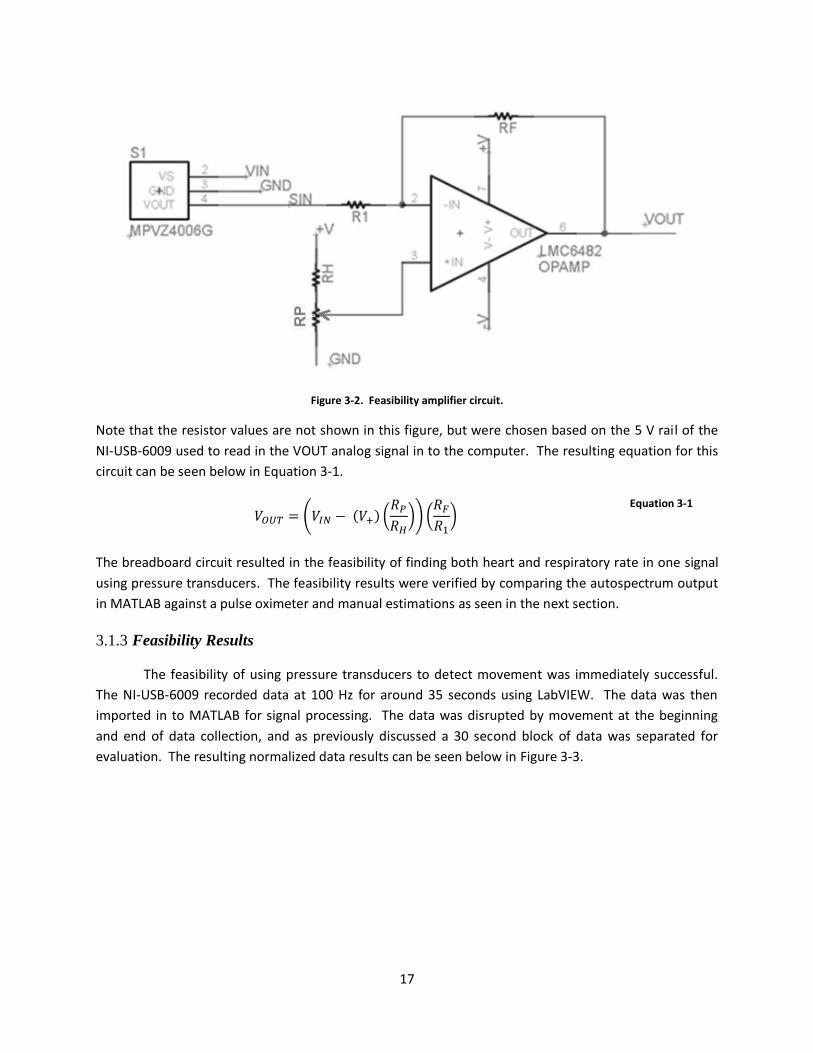
Figure 3-2. Feasibility amplifier circuit.
Note that the resistor values are not shown in this figure, but were chosen based on the 5 V rail of the
NI-USB-6009 used to read in the VOUT analog signal in to the computer. The resulting equation for this
circuit can be seen below in Equation 3-1.
Equation 3-1
The breadboard circuit resulted in the feasibility of finding both heart and respiratory rate in one signal
using pressure transducers. The feasibility results were verified by comparing the autospectrum output
in MATLAB against a pulse oximeter and manual estimations as seen in the next section.
3.1.3 Feasibility Results
The feasibility of using pressure transducers to detect movement was immediately successful.
The NI-USB-6009 recorded data at 100 Hz for around 35 seconds using LabVIEW. The data was then
imported in to MATLAB for signal processing. The data was disrupted by movement at the beginning
and end of data collection, and as previously discussed a 30 second block of data was separated for
evaluation. The resulting normalized data results can be seen below in Figure 3-3.
18
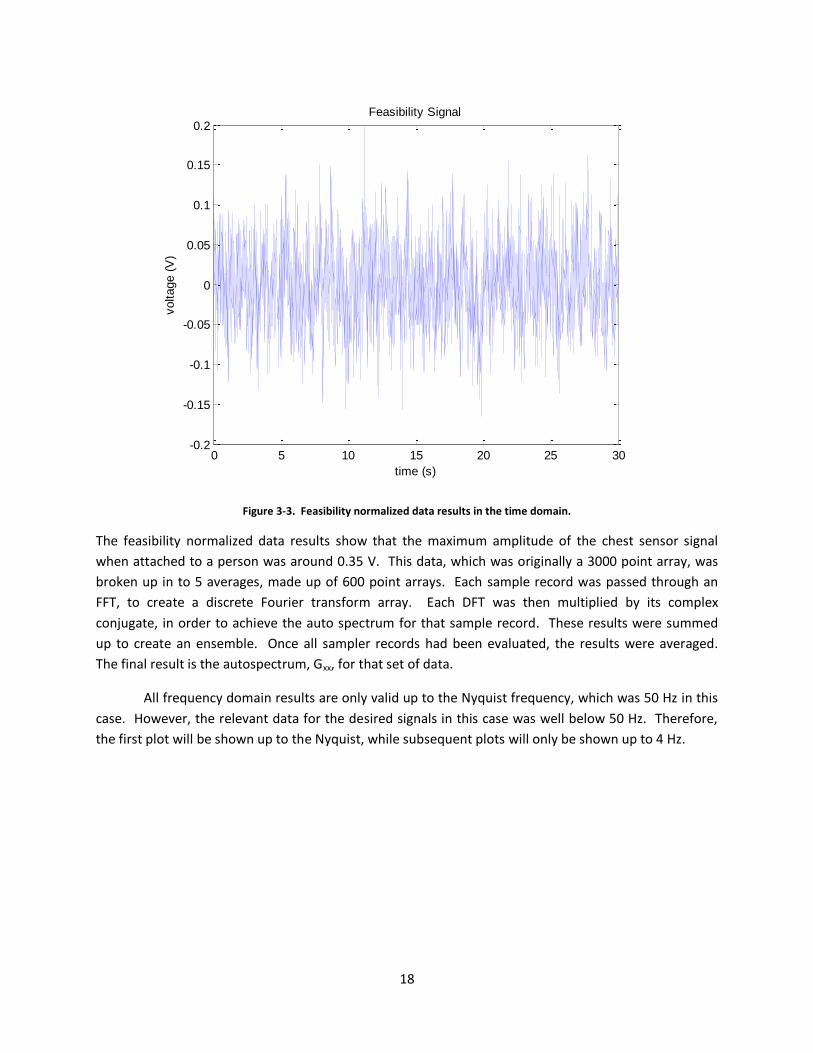
Figure 3-3. Feasibility normalized data results in the time domain.
The feasibility normalized data results show that the maximum amplitude of the chest sensor signal
when attached to a person was around 0.35 V. This data, which was originally a 3000 point array, was
broken up in to 5 averages, made up of 600 point arrays. Each sample record was passed through an
FFT, to create a discrete Fourier transform array. Each DFT was then multiplied by its complex
conjugate, in order to achieve the auto spectrum for that sample record. These results were summed
up to create an ensemble. Once all sampler records had been evaluated, the results were averaged.
The final result is the autospectrum, Gxx, for that set of data.
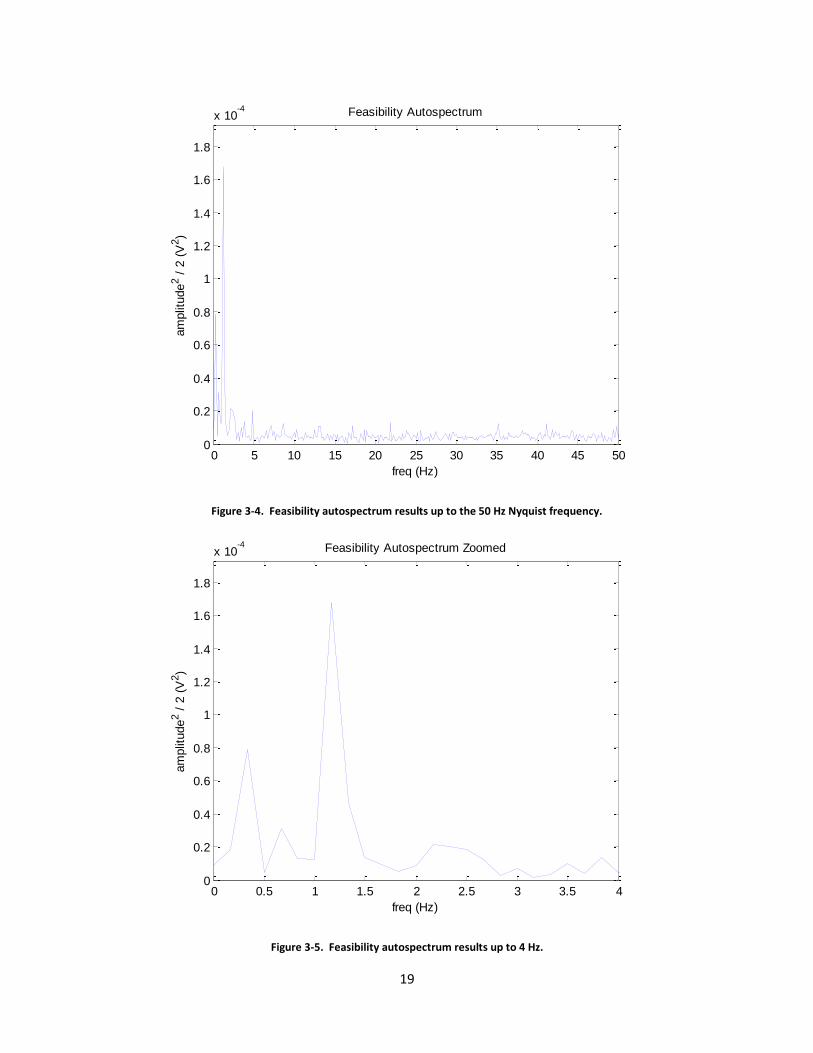
All frequency domain results are only valid up to the Nyquist frequency, which was 50 Hz in this
case. However, the relevant data for the desired signals in this case was well below 50 Hz. Therefore,
the first plot will be shown up to the Nyquist, while subsequent plots will only be shown up to 4 Hz.
0 5 10 15 20 25 30-0.2
-0.15
-0.1
-0.05
0
0.05
0.1
0.15
0.2
time (s)
voltage (
V)
Feasibility Signal
19
Figure 3-4. Feasibility autospectrum results up to the 50 Hz Nyquist frequency.
Figure 3-5. Feasibility autospectrum results up to 4 Hz.
0 5 10 15 20 25 30 35 40 45 500
0.2
0.4
0.6
0.8
1
1.2
1.4
1.6
1.8
x 10-4
freq (Hz)
am
plit
ude
2 /
2 (
V2)
Feasibility Autospectrum
0 0.5 1 1.5 2 2.5 3 3.5 40
0.2
0.4
0.6
0.8
1
1.2
1.4
1.6
1.8
x 10-4
freq (Hz)
am
plit
ude
2 /
2 (
V2)
Feasibility Autospectrum Zoomed
20
Note that the autospectrum results show observed frequencies at 0.3333 and 1.167 Hz. These spikes
correspond with 20 RR and 70 HR accordingly. This was verified using a pulse oximeter and manual
estimation at the time that the person was being tested. The expected values were 20 RR and 70 HR,
which matched with the autospectrum results. The noise in the autospectrum can be compared to the
signal using an SNR estimate.
Here, the SNR will be defined as the ratio of the RMS value of the signal to the RMS value of the
noise floor. The autospectrum results are already in terms of power, V2, so the SNR can be estimated by
taking the square root of the magnitude for the signal divided by the square root of the mean
magnitude for the noise. This is seen below in Equation 3-2.
Equation 3-2
The resulting SNR value for the respiration signal during feasibility testing was 4.014, while the SNR for
heart rate was 5.866. The SNR during feasibility testing was not expected to be very high, due to the
fact that the signals were found and amplified using a breadboard circuit and through-hole components.
However, it is important to note that any future circuits should be compared for effectiveness against
these initial SNR results. The success of the feasibility tests resulted in the push towards a second
generation concept, to be used in a simulated environment.
3.1.4 Advancements Post Feasibility Tests
The road towards a working prototype involved further research in several areas, even as early
on as the feasibility stage. Firstly, there needed to be a model for the relationship between pressure in
tubing and the expected compression of the chest. Once the pressure transducer and tubing could be
properly specified, a PCB would have to be designed with built in op-amp. This intermediate device
would act as a simulation, so that further data could be gathered. The Carilion Center for Experiential
Learning at Carilion Roanoke Memorial Hospital was specified as an appropriate location by the Pediatric
Medical Device Institute. This location possesses a simulated breathing mannequin that was ideal for
data collection.
3.2 Simulation
In order to develop the best MCI force multiplier, several questions must be answered. Firstly,
what kind of amplitude should be expected from the heart or from the respiratory signals on the human
when observed through clothing? Next, what pressure sensors and data acquisition tools are capable of
detecting such a response? Once these questions have been answered, and the components are
arranged on a PCB, the device must be tested. It was for the purposes such testing, and to prove the
model, that the device was taken to Carilion Center for Experiential Learning, to be tested on a
simulated breathing mannequin.

21
3.2.1 Modeling the Change in Volume with the Change in Pressure in the Tube
Understanding the physics and the relationship between volume and pressure inside the tubing
is a necessary step prior to choosing the tubing itself. The impulse of the heart or respiratory rate is
transmitted through the clothing and in to the tubing, which then compresses, decreasing its air volume,
and increasing its air pressure, which then causes an increase in voltage reading from the pressure
transducer. Figure 3-6 below shows a simple illustration of how the impulse causes a decrease in
volume in the tubing.
Figure 3-6. Visual interpretation of tubing being compressed by an impulse.
Note that the final relationship or equation can be determined through several basic equations. Boyle’s
law states that so long as temperature remains constant, pressure and volume remain inversely
proportional to each other. This can be seen in the equations below.
Equation 3-3
Equation 3-4
Following this relationship, one must know what the air volume in the tubing is. The volume of a
cylinder is the product of inner circular area and the length of the tubing as seen in the equation below.
Equation 3-5
Assuming that the deflection of a specific length of tubing causes a change in radius, , over a small
tube length, Lx, then the change in volume can be calculated as seen in the following equations.
Equation 3-6
Equation 3-7
Combining Equation 3-4, Equation 3-5, and Equation 3-6, it is possible to approximate the change in
pressure in the tube as shown below. P1 is assumed to be 100 kPa, or near atmospheric pressure.
Equation 3-8
Equation 3-9
Equation 3-10
22
Based on these equations it is possible to estimate what kind of changes in pressure to expect from
compressing the tubing. However, before calculating the expected change in pressure, it is necessary to
understand the anatomy of heart and respiratory rates, and their impact on the chest cavity.
3.2.2 Anatomy of Heart and Respiratory Signals to the Chest
The transfer of motion that is seen in the human chest is known as the apex beat, cardiac
impulse, or the apical thrust. It is created by the left ventricular contraction of the heart. It is located at
the lowest point on the chest at which the contractions of the heart can be felt. While this impulse is
usually the point of maximum impulse, a diseased heart will often have pulsations correlating with other
problems such as an enlarged right ventricle. It may also be noted that it might not be observable in the
supine position in some subjects [21]. Regardless, the expected peak to peak displacement of the chest
at the area of maximum cardiac impulse is around 0.3 mm [22].
Similar to heart rate, but with larger amplitude, and at a lower frequency, is respiratory rate.
When humans breathe, the chest cavity expands, allowing the flow of oxygen in to the lungs. The peak
to peak displacement of the chest due to respiration is between 4 and 12 mm [22].
3.2.3 Application of the Model to the Transducer and Tubing Specifications
Based on the information about the anatomy of the vital signs, it is possible to define the
appropriate tubing as well as define the specifications for the pressure transducer. When it comes to
tubing, a material that is malleable enough to displace without requiring a large amount of force, will
allow the heart and respiratory signals to be more easily observed. A material, such as super-soft latex,
is often used in medical applications, and fits this requirement. The first tubing ordered was super-soft
latex rubber tubing with a 1/4” outer diameter, a 1/8” inner diameter, and a 1” bending radius.
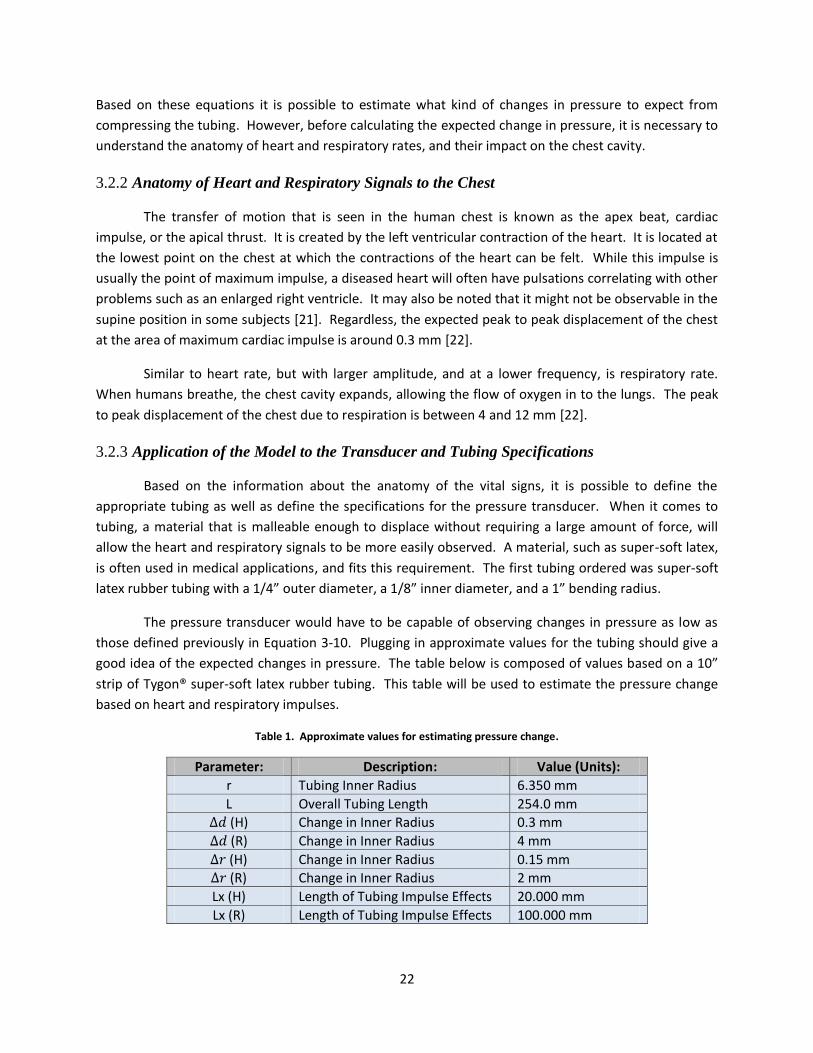
The pressure transducer would have to be capable of observing changes in pressure as low as
those defined previously in Equation 3-10. Plugging in approximate values for the tubing should give a
good idea of the expected changes in pressure. The table below is composed of values based on a 10”
strip of Tygon® super-soft latex rubber tubing. This table will be used to estimate the pressure change
based on heart and respiratory impulses.
Table 1. Approximate values for estimating pressure change.
Parameter: Description: Value (Units):
r Tubing Inner Radius 6.350 mm
L Overall Tubing Length 254.0 mm
(H) Change in Inner Radius 0.3 mm
(R) Change in Inner Radius 4 mm
(H) Change in Inner Radius 0.15 mm
(R) Change in Inner Radius 2 mm
Lx (H) Length of Tubing Impulse Effects 20.000 mm
Lx (R) Length of Tubing Impulse Effects 100.000 mm
23
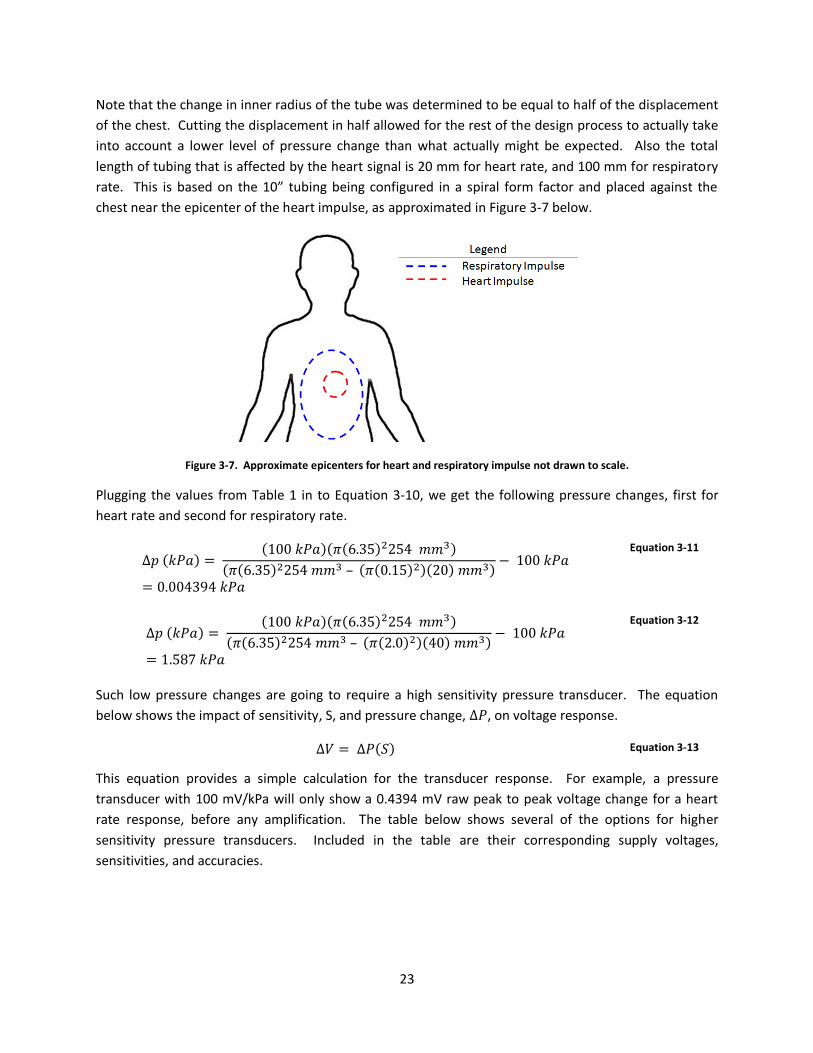
Note that the change in inner radius of the tube was determined to be equal to half of the displacement
of the chest. Cutting the displacement in half allowed for the rest of the design process to actually take
into account a lower level of pressure change than what actually might be expected. Also the total
length of tubing that is affected by the heart signal is 20 mm for heart rate, and 100 mm for respiratory
rate. This is based on the 10” tubing being configured in a spiral form factor and placed against the
chest near the epicenter of the heart impulse, as approximated in Figure 3-7 below.
Figure 3-7. Approximate epicenters for heart and respiratory impulse not drawn to scale.
Plugging the values from Table 1 in to Equation 3-10, we get the following pressure changes, first for
heart rate and second for respiratory rate.
Equation 3-11
Equation 3-12
Such low pressure changes are going to require a high sensitivity pressure transducer. The equation
below shows the impact of sensitivity, S, and pressure change, , on voltage response.
Equation 3-13
This equation provides a simple calculation for the transducer response. For example, a pressure
transducer with 100 mV/kPa will only show a 0.4394 mV raw peak to peak voltage change for a heart
rate response, before any amplification. The table below shows several of the options for higher
sensitivity pressure transducers. Included in the table are their corresponding supply voltages,
sensitivities, and accuracies.
24
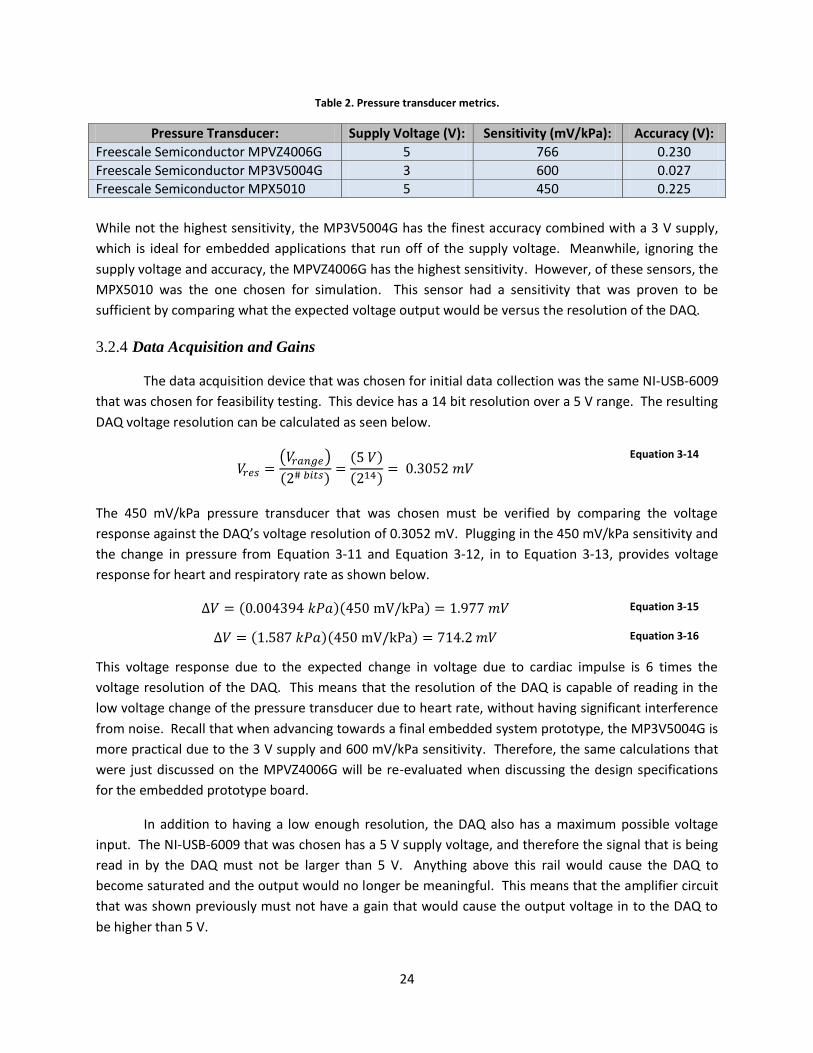
Table 2. Pressure transducer metrics.
Pressure Transducer: Supply Voltage (V): Sensitivity (mV/kPa): Accuracy (V):
Freescale Semiconductor MPVZ4006G 5 766 0.230
Freescale Semiconductor MP3V5004G 3 600 0.027
Freescale Semiconductor MPX5010 5 450 0.225
While not the highest sensitivity, the MP3V5004G has the finest accuracy combined with a 3 V supply,
which is ideal for embedded applications that run off of the supply voltage. Meanwhile, ignoring the
supply voltage and accuracy, the MPVZ4006G has the highest sensitivity. However, of these sensors, the
MPX5010 was the one chosen for simulation. This sensor had a sensitivity that was proven to be
sufficient by comparing what the expected voltage output would be versus the resolution of the DAQ.
3.2.4 Data Acquisition and Gains
The data acquisition device that was chosen for initial data collection was the same NI-USB-6009
that was chosen for feasibility testing. This device has a 14 bit resolution over a 5 V range. The resulting
DAQ voltage resolution can be calculated as seen below.
Equation 3-14
The 450 mV/kPa pressure transducer that was chosen must be verified by comparing the voltage
response against the DAQ’s voltage resolution of 0.3052 mV. Plugging in the 450 mV/kPa sensitivity and
the change in pressure from Equation 3-11 and Equation 3-12, in to Equation 3-13, provides voltage
response for heart and respiratory rate as shown below.
Equation 3-15
Equation 3-16
This voltage response due to the expected change in voltage due to cardiac impulse is 6 times the
voltage resolution of the DAQ. This means that the resolution of the DAQ is capable of reading in the
low voltage change of the pressure transducer due to heart rate, without having significant interference
from noise. Recall that when advancing towards a final embedded system prototype, the MP3V5004G is
more practical due to the 3 V supply and 600 mV/kPa sensitivity. Therefore, the same calculations that
were just discussed on the MPVZ4006G will be re-evaluated when discussing the design specifications
for the embedded prototype board.
In addition to having a low enough resolution, the DAQ also has a maximum possible voltage
input. The NI-USB-6009 that was chosen has a 5 V supply voltage, and therefore the signal that is being
read in by the DAQ must not be larger than 5 V. Anything above this rail would cause the DAQ to
become saturated and the output would no longer be meaningful. This means that the amplifier circuit
that was shown previously must not have a gain that would cause the output voltage in to the DAQ to
be higher than 5 V.
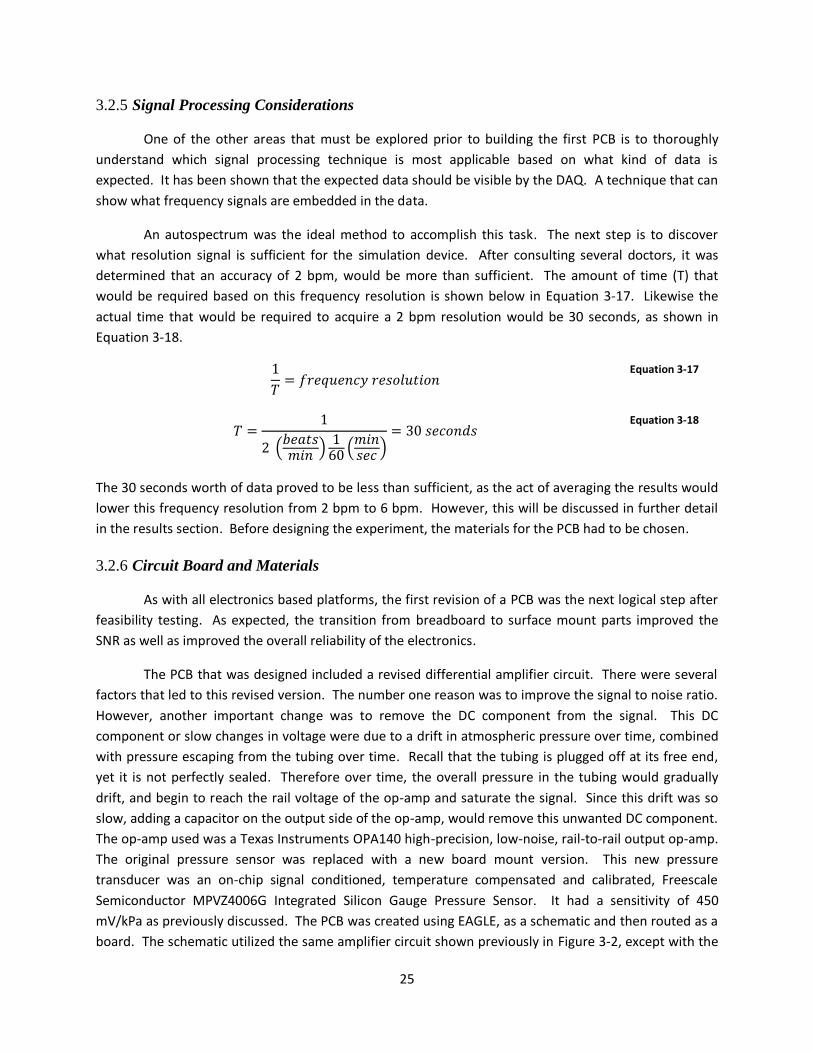
25
3.2.5 Signal Processing Considerations
One of the other areas that must be explored prior to building the first PCB is to thoroughly
understand which signal processing technique is most applicable based on what kind of data is
expected. It has been shown that the expected data should be visible by the DAQ. A technique that can
show what frequency signals are embedded in the data.
An autospectrum was the ideal method to accomplish this task. The next step is to discover
what resolution signal is sufficient for the simulation device. After consulting several doctors, it was
determined that an accuracy of 2 bpm, would be more than sufficient. The amount of time (T) that
would be required based on this frequency resolution is shown below in Equation 3-17. Likewise the
actual time that would be required to acquire a 2 bpm resolution would be 30 seconds, as shown in
Equation 3-18.
Equation 3-17
Equation 3-18
The 30 seconds worth of data proved to be less than sufficient, as the act of averaging the results would
lower this frequency resolution from 2 bpm to 6 bpm. However, this will be discussed in further detail
in the results section. Before designing the experiment, the materials for the PCB had to be chosen.
3.2.6 Circuit Board and Materials
As with all electronics based platforms, the first revision of a PCB was the next logical step after
feasibility testing. As expected, the transition from breadboard to surface mount parts improved the
SNR as well as improved the overall reliability of the electronics.
The PCB that was designed included a revised differential amplifier circuit. There were several
factors that led to this revised version. The number one reason was to improve the signal to noise ratio.
However, another important change was to remove the DC component from the signal. This DC
component or slow changes in voltage were due to a drift in atmospheric pressure over time, combined
with pressure escaping from the tubing over time. Recall that the tubing is plugged off at its free end,
yet it is not perfectly sealed. Therefore over time, the overall pressure in the tubing would gradually
drift, and begin to reach the rail voltage of the op-amp and saturate the signal. Since this drift was so
slow, adding a capacitor on the output side of the op-amp, would remove this unwanted DC component.
The op-amp used was a Texas Instruments OPA140 high-precision, low-noise, rail-to-rail output op-amp.
The original pressure sensor was replaced with a new board mount version. This new pressure
transducer was an on-chip signal conditioned, temperature compensated and calibrated, Freescale
Semiconductor MPVZ4006G Integrated Silicon Gauge Pressure Sensor. It had a sensitivity of 450
mV/kPa as previously discussed. The PCB was created using EAGLE, as a schematic and then routed as a
board. The schematic utilized the same amplifier circuit shown previously in Figure 3-2, except with the
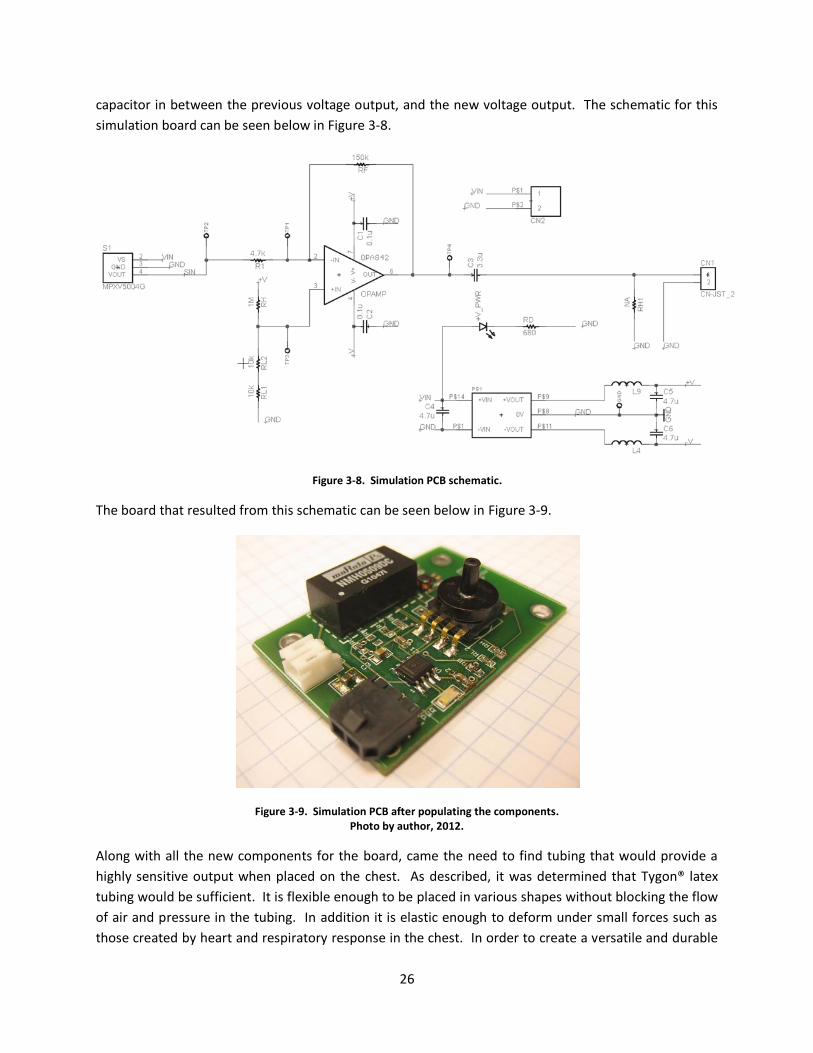
26
capacitor in between the previous voltage output, and the new voltage output. The schematic for this
simulation board can be seen below in Figure 3-8.
Figure 3-8. Simulation PCB schematic.
The board that resulted from this schematic can be seen below in Figure 3-9.
Figure 3-9. Simulation PCB after populating the components. Photo by author, 2012.
Along with all the new components for the board, came the need to find tubing that would provide a
highly sensitive output when placed on the chest. As described, it was determined that Tygon® latex
tubing would be sufficient. It is flexible enough to be placed in various shapes without blocking the flow
of air and pressure in the tubing. In addition it is elastic enough to deform under small forces such as
those created by heart and respiratory response in the chest. In order to create a versatile and durable

27
system that could endure long periods of testing and analysis, the board was attached to a section of
fiber glass just long enough to hold the PCB and a certain length of Tygon® tubing. The resulting
simulation device is seen below in Figure 3-10.
Figure 3-10. Simulation device with tubing and chest strap. Photo by author, 2012.
3.2.7 Simulation Experiment
The device was taken to the Carilion Center for Experiential Learning at Carilion Roanoke
Memorial Hospital, in order to compare its response to that of an actual simulated breathing
mannequin. The simulated breathing mannequin is capable of outputting a programmable respiratory
rate through a bladder in the mannequin’s chest. However, it is incapable of providing heart rate in the
same manner. Note that the experimental setup can be seen below in Figure 3-11, with the device
placed right underneath the left breast of the mannequin.
Figure 3-11. Simulation device on the simulated breathing mannequin’s chest. Photo by author, 2012.
28
The device was attached using a Velcro strap, and measurements were taken for six different simulated
respiratory rates. A computer program at the test site was used to dial up the respiratory rates for at
least thirty seconds for each of the six simulated respiratory rates. The data from the op-amp circuit
was read through the NI-USB-6009 as previously discussed.
Data was recorded, and then its autospectrum was calculated in MATLAB. These autospectrum
results were created using 30 seconds worth of data as previously discussed. The results suggested that
there was correlation between the estimated breathing rate and the actual simulated breathing rate. It
should be noted that the simulated breathing mannequin did not have the ability to emit a heart rate in
addition to respiratory rate. Therefore, an experiment approved for human testing, would have to be
developed to test the device for correlation with heart rate. In addition, qualitative assessment of the
autospectrum does not provide the quantitative results needed, to conclude that this device is actually
doing what it is intended to do. Having an industry standard tool, such as an ECG machine, would allow
for such a quantitative assessment of the results through a cross spectrum and through coherence
function analysis.
3.2.8 Need for Improvements
Despite the success of the simulation experiment, there was still a need for improvements to
the PCB. Specifically, the SNR was low as will be shown. The changes that needed to be made in order
to improve the SNR are to move to a higher sensitivity pressure transducer, or a higher resolution ADC.
Another issue was that the tubing being used was not completely sealed at the end attached to the
pressure transducer. This allowed air to often escape the tubing during compression, causing an
increase in pressure over time. The result was a built up of pressure over time in the tubing. To solve
this, the AC component would have to be decoupled from the signal using a high pass filter. With the
need for all these improvements, came the transition to a full system prototype.
3.3 Full System Prototype
With the need for improvements to the hardware and software, came the next revolution of the design
process. Firstly, new sensors needed to be specified, and a new more versatile and durable design
would have to be incorporated. The first prototype should also have advanced software with real time
capabilities. This meant that a new fully embedded prototype would have to be created that combines
both data acquisition and analysis.
3.3.1 Overall Design Considerations
Given the fact that the next board would be the first embedded prototype, there were several
changes that needed to be considered. In mass casualty situations, it has been shown that a durable
tool that can act as a force multiplier would be most useful. It was also mentioned that the device must
be capable of being utilized in multiple ways. Three ways that would be easiest for an EMT to
communicate with the system would be through flashing LED’s that blink with the heart and respiratory
rates, an LCD screen that actively displays the rates via text, and finally a wireless monitoring capability
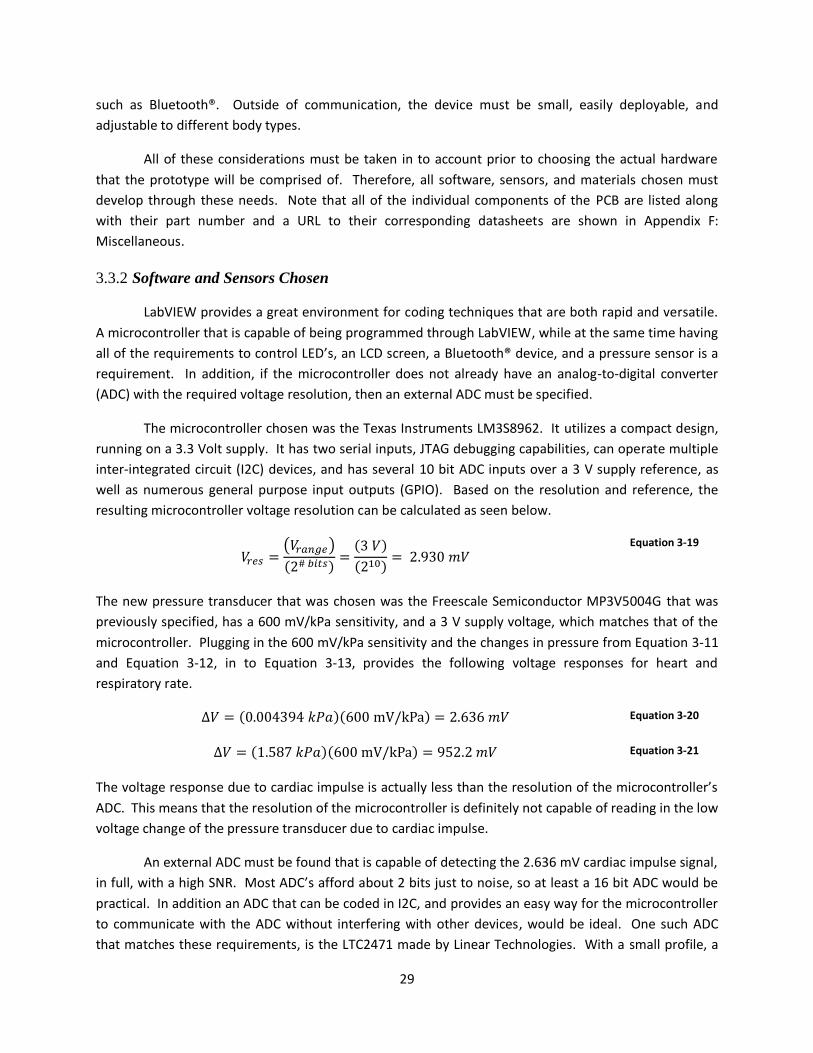
29
such as Bluetooth®. Outside of communication, the device must be small, easily deployable, and
adjustable to different body types.
All of these considerations must be taken in to account prior to choosing the actual hardware
that the prototype will be comprised of. Therefore, all software, sensors, and materials chosen must
develop through these needs. Note that all of the individual components of the PCB are listed along
with their part number and a URL to their corresponding datasheets are shown in Appendix F:
Miscellaneous.
3.3.2 Software and Sensors Chosen
LabVIEW provides a great environment for coding techniques that are both rapid and versatile.
A microcontroller that is capable of being programmed through LabVIEW, while at the same time having
all of the requirements to control LED’s, an LCD screen, a Bluetooth® device, and a pressure sensor is a
requirement. In addition, if the microcontroller does not already have an analog-to-digital converter
(ADC) with the required voltage resolution, then an external ADC must be specified.
The microcontroller chosen was the Texas Instruments LM3S8962. It utilizes a compact design,
running on a 3.3 Volt supply. It has two serial inputs, JTAG debugging capabilities, can operate multiple
inter-integrated circuit (I2C) devices, and has several 10 bit ADC inputs over a 3 V supply reference, as
well as numerous general purpose input outputs (GPIO). Based on the resolution and reference, the
resulting microcontroller voltage resolution can be calculated as seen below.
Equation 3-19
The new pressure transducer that was chosen was the Freescale Semiconductor MP3V5004G that was
previously specified, has a 600 mV/kPa sensitivity, and a 3 V supply voltage, which matches that of the
microcontroller. Plugging in the 600 mV/kPa sensitivity and the changes in pressure from Equation 3-11
and Equation 3-12, in to Equation 3-13, provides the following voltage responses for heart and
respiratory rate.
Equation 3-20
Equation 3-21
The voltage response due to cardiac impulse is actually less than the resolution of the microcontroller’s
ADC. This means that the resolution of the microcontroller is definitely not capable of reading in the low
voltage change of the pressure transducer due to cardiac impulse.
An external ADC must be found that is capable of detecting the 2.636 mV cardiac impulse signal,
in full, with a high SNR. Most ADC’s afford about 2 bits just to noise, so at least a 16 bit ADC would be
practical. In addition an ADC that can be coded in I2C, and provides an easy way for the microcontroller
to communicate with the ADC without interfering with other devices, would be ideal. One such ADC
that matches these requirements, is the LTC2471 made by Linear Technologies. With a small profile, a
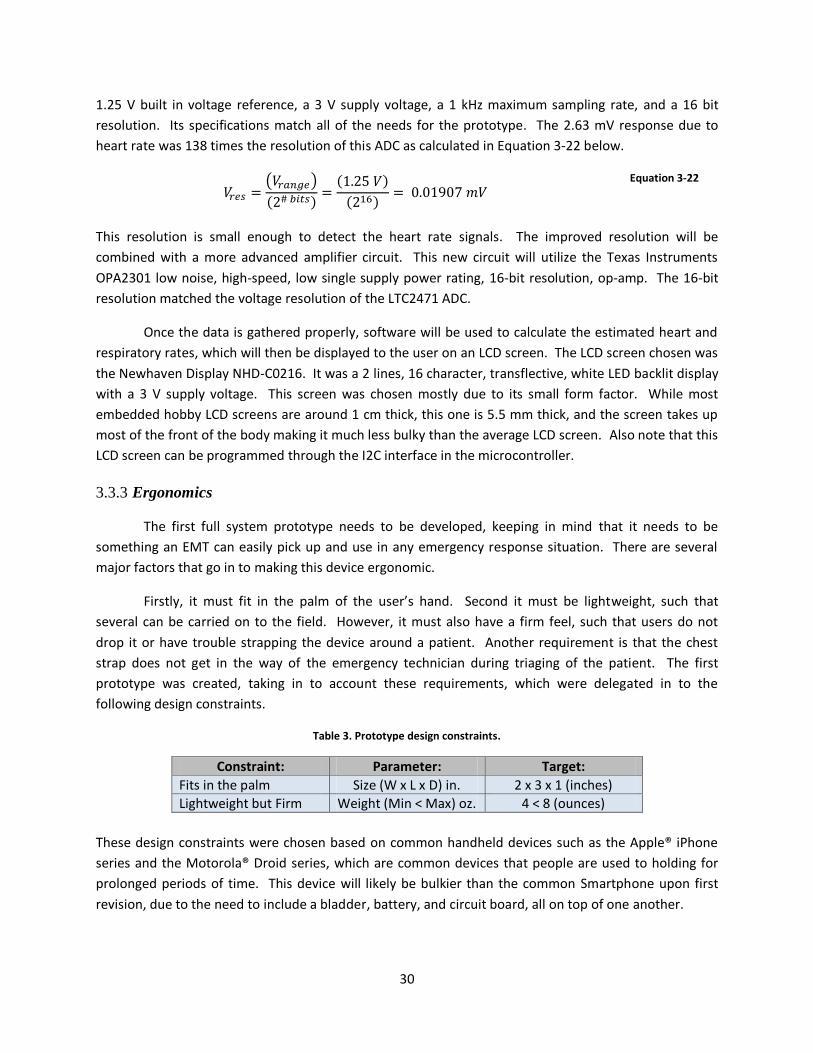
30
1.25 V built in voltage reference, a 3 V supply voltage, a 1 kHz maximum sampling rate, and a 16 bit
resolution. Its specifications match all of the needs for the prototype. The 2.63 mV response due to
heart rate was 138 times the resolution of this ADC as calculated in Equation 3-22 below.
Equation 3-22
This resolution is small enough to detect the heart rate signals. The improved resolution will be
combined with a more advanced amplifier circuit. This new circuit will utilize the Texas Instruments
OPA2301 low noise, high-speed, low single supply power rating, 16-bit resolution, op-amp. The 16-bit
resolution matched the voltage resolution of the LTC2471 ADC.
Once the data is gathered properly, software will be used to calculate the estimated heart and
respiratory rates, which will then be displayed to the user on an LCD screen. The LCD screen chosen was
the Newhaven Display NHD-C0216. It was a 2 lines, 16 character, transflective, white LED backlit display
with a 3 V supply voltage. This screen was chosen mostly due to its small form factor. While most
embedded hobby LCD screens are around 1 cm thick, this one is 5.5 mm thick, and the screen takes up
most of the front of the body making it much less bulky than the average LCD screen. Also note that this
LCD screen can be programmed through the I2C interface in the microcontroller.
3.3.3 Ergonomics
The first full system prototype needs to be developed, keeping in mind that it needs to be
something an EMT can easily pick up and use in any emergency response situation. There are several
major factors that go in to making this device ergonomic.
Firstly, it must fit in the palm of the user’s hand. Second it must be lightweight, such that
several can be carried on to the field. However, it must also have a firm feel, such that users do not
drop it or have trouble strapping the device around a patient. Another requirement is that the chest
strap does not get in the way of the emergency technician during triaging of the patient. The first
prototype was created, taking in to account these requirements, which were delegated in to the
following design constraints.
Table 3. Prototype design constraints.
Constraint: Parameter: Target:
Fits in the palm Size (W x L x D) in. 2 x 3 x 1 (inches)
Lightweight but Firm Weight (Min < Max) oz. 4 < 8 (ounces)
These design constraints were chosen based on common handheld devices such as the Apple® iPhone
series and the Motorola® Droid series, which are common devices that people are used to holding for
prolonged periods of time. This device will likely be bulkier than the common Smartphone upon first
revision, due to the need to include a bladder, battery, and circuit board, all on top of one another.

31
3.3.4 Power Requirements and Scheme
Similarly to ergonomics, the power requirements are of great importance when designing the
first full system prototype. From the on/off mechanism to battery life, everything must be considered
and evaluated against how this device is intended to be used.
Most modern devices have a power scheme based around a switch mode charge manager. This
manager is what allows a device to be powered by an AC adapter, which simultaneously charges a
battery in the device. In this way, when the device is unplugged, it can be used for a given amount of
time on battery life, before needing to be recharged. The first step in developing the power scheme for
this device was to choose a switch mode charge manager, a voltage converter, a power switch, a low
power voltage detector, and then to specify all of the current draws of each component on the board.
The switch mode charge manager that was chosen for this device was the BQ24123 by Texas
Instruments. It was chosen because it is suitable for 1-, 2-, or 3-Cell Li-Ion and Li-Polymer Battery Packs.
It includes battery temperature monitoring, and an automatic sleep mode for low power consumption.
In addition it is small, cost effective, requires a low 3.5 uA supply, and includes a “charging, adapter
present, and done charging” pins for LED indicators. The BQ24123 on its own is not capable of providing
all of the power scheme functionality of modern devices. Rather it works in conjunction with an on/off
controller to allow the device to be easily enabled and disabled at the push of a button. The charge
manager also requires a step down converter from the 5 V lines of the adapter and battery, to the 3.3 V
lines that the microcontroller and other components operate on.
The on/off controller chosen was the MAX16054 by Maxim. It is a pushbutton on/off controller
with a single switch debouncer and built-in latch. It requires a 3 volt single supply, and operates at 7 uA.
It is intended to be used in conjunction with a step down converter to enable and disable the power at
any given time. The step down converter chosen was the TPS62203 step-down or buck converter, by
Texas Instruments. It operates from a standard 5 V rail, and steps down to 3.3 V output. Pulling this
device’s enable pin to ground causes it to go into shutdown mode. Conversely, pulling the enable pin
high causes it to start back up again. This will be a useful part of the power schematic.
All together, the system follows a block diagram operation for power operation based around
the enable pin on the TPS62203. There are two methods by which the TPS62203 can be told to disable
the power supply from reaching the rest of the circuit. Firstly an STM1061 low voltage detectors by ST
Microelectronics, checks to see if the battery voltage is at dangerously low levels. The detector chosen
considers anything below, 3.4 V, to be dangerous. When the battery voltage goes below a 3.4 V
threshold, its output signal goes low. Secondly, the MAX16054 checks for whether or not the power
button has been turned on or not. Whenever the power button is pressed, then “in” pin receives a
momentary low pulse, causing the output logic to invert. Based on this, the desired logic output to the
TPS62203 is such that the enable pin should be low, if either the MAX16054 outputs low, or the
STM1061 outputs low. The desired logic conditioner is therefore an AND gate, as seen in the table
below.
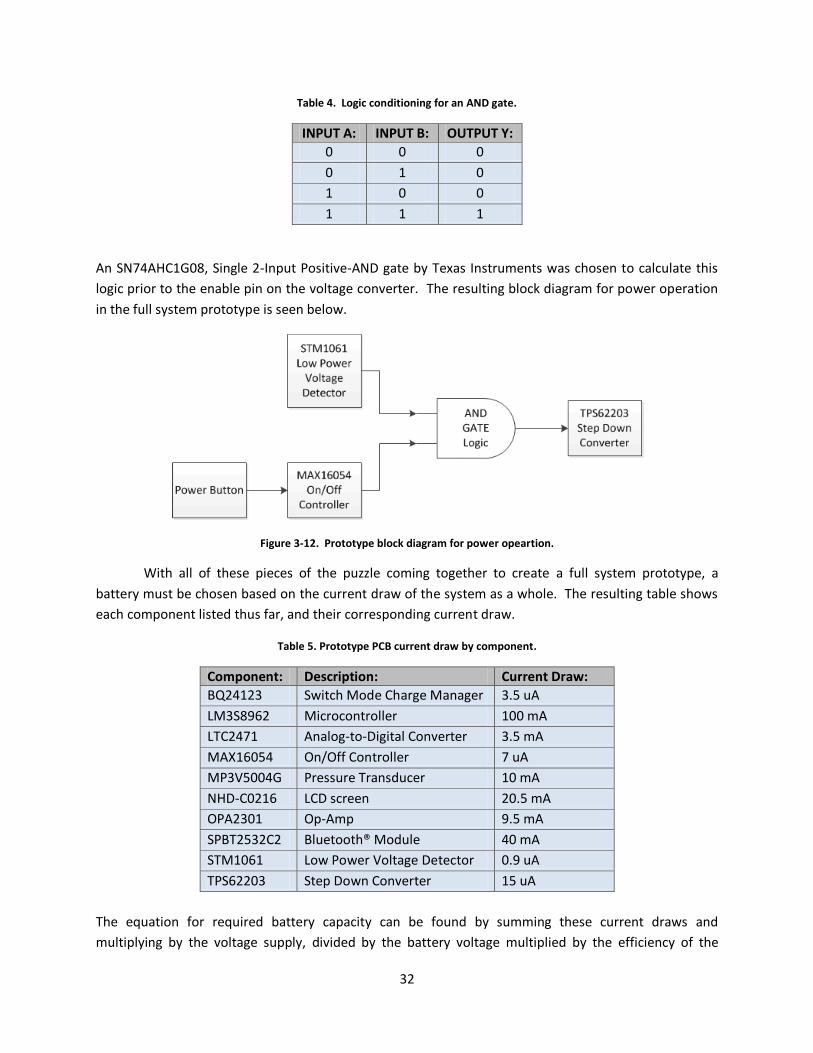
32
Table 4. Logic conditioning for an AND gate.
INPUT A: INPUT B: OUTPUT Y:
0 0 0
0 1 0
1 0 0
1 1 1
An SN74AHC1G08, Single 2-Input Positive-AND gate by Texas Instruments was chosen to calculate this
logic prior to the enable pin on the voltage converter. The resulting block diagram for power operation
in the full system prototype is seen below.
Figure 3-12. Prototype block diagram for power opeartion.
With all of these pieces of the puzzle coming together to create a full system prototype, a
battery must be chosen based on the current draw of the system as a whole. The resulting table shows
each component listed thus far, and their corresponding current draw.
Table 5. Prototype PCB current draw by component.
Component: Description: Current Draw:
BQ24123 Switch Mode Charge Manager 3.5 uA
LM3S8962 Microcontroller 100 mA
LTC2471 Analog-to-Digital Converter 3.5 mA
MAX16054 On/Off Controller 7 uA
MP3V5004G Pressure Transducer 10 mA
NHD-C0216 LCD screen 20.5 mA
OPA2301 Op-Amp 9.5 mA
SPBT2532C2 Bluetooth® Module 40 mA
STM1061 Low Power Voltage Detector 0.9 uA
TPS62203 Step Down Converter 15 uA
The equation for required battery capacity can be found by summing these current draws and
multiplying by the voltage supply, divided by the battery voltage multiplied by the efficiency of the

33
voltage converter. This equation and its subsequent calculations can be seen below in Equation 3-23
and Equation 3-24.
Equation 3-23
Equation 3-24
Repetitive calculations for this value were made for different operating ranges, as seen in Appendix B:
MATLAB Code under Battery Requirements for Full System Prototype. Also note that the efficiency from
Equation 3-23, refers to the efficiency of the step down converter, which is 90% at a 3.3 V operating
voltage.
The BQ24123 charge manager schematic chosen, and the TPS62203 step down converter,
dictate that the ideal battery is a 1-cell, 3.7 volt battery. Since 24 hours of operation requires over 4364
mAhrs, then 8 hours of operation should require a 1456 mAhr battery. Common 1-cell, 3.7 volt devices
are for handheld devices, and have around 1000 mAhr capacities. Taking this in to account, a battery
was selected that was 3.7 volt, single cell, and had between 1000 and 1456 mAhr capacity. The
NuPower Replacement Rechargeable Battery for Apple IPod 4th Generation Models was a capable 3.7
volt, single cell battery, with a 1350 mAhr capacity.
3.3.5 Product Design
When creating a full system prototype, the device must be something that is both familiar and
ergonomic. Based on the number of components, a form factor the size of the average smart phone is
more than practical. Knowing some of the components, a rough sketch was created as a design target
for the full system prototype to be modeled after. The resulting sketch provided an idea of the end
product, which is invaluable to circuit board design for a full prototype. This design can be seen below
in Figure 3-13. Other renditions of the product design can be seen in Appendix F: Miscellaneous.
Figure 3-13. A rendition of the prototype targeted appearance.
34
Most smart phones fall well within the 5 x 3 inch range previously specified. Therefore, an
enclosure was chosen that would house the PCB, the LCD screen, the LED lights, the auxiliary buttons,
and the batteries. The Pactec® enclosures HM series was chosen, as it has a clean form factor, and can
easily be milled to house the LCD screen, the LED lights, and any buttons. The enclosure chosen was
approximately 3 ¾ inches long by 2 ¼ inches wide and 7/8 inches thick. While this project box was
within sight of the original concept drawing, the final product design differed slightly. For instance, the
power and reset lights were placed to the left of the screen, and two auxiliary lights were added to the
right side of the screen. Finally the power, reset, and auxiliary buttons were placed on either side of the
enclosure. The buttons chosen for the final prototype were TL1105B tactile momentary switches by
ESwitch®. These switches were chosen because their buttons extend long enough away from the board
to be accessible from outside the project box.
3.3.6 Circuit Design
All circuit design was done using EAGLE version 4.16r2. Dominant sections of this schematic are
divided into components devoted to power, pressure acquisition, the LCD screen, and Bluetooth®. The
board layout was situated based on these individual divisions of the schematic.
Power Scheme
The power schematic chosen followed the BQ24123 Charge Manager’s typical applications
schematic for 1-cell batteries. Note that this board was designed to attach to a PJ-053D, 3 mm, DC
power jack to provide the 5 V supply voltage for the battery to charge off of. Also, instead of attaching 3
separate LED’s directly to the power, charge, and done lights, a simple common anode Bivar 3 mm T1 bi-
color LED combined the charge and done lights in to one LED. It was wired such that it will light up
yellow when charging, and then green when done charging. A simple 3 pin JST connector was attached
so either a battery or external power supplies could easily be used to power the board. A kill switch was
also added such that the battery could stay attached at all times without requiring the project box to be
constantly disassembled while testing. The resulting schematic surrounding the BQ24123 is as shown.
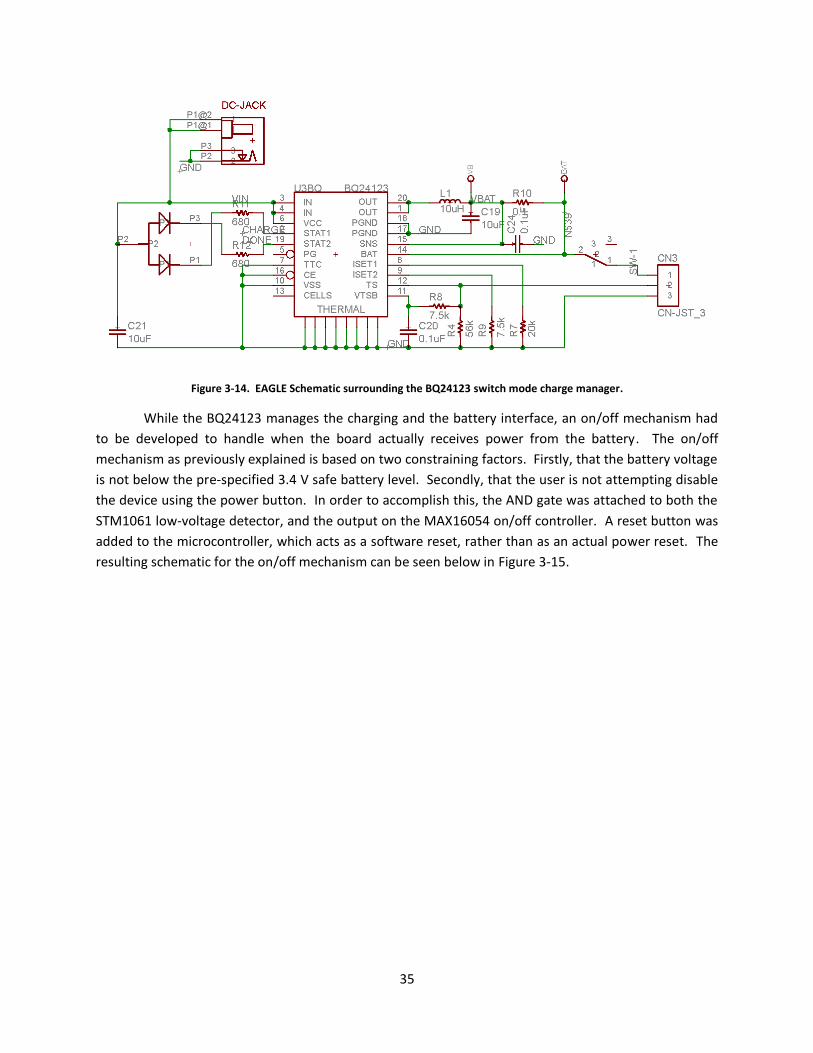
35
Figure 3-14. EAGLE Schematic surrounding the BQ24123 switch mode charge manager.
While the BQ24123 manages the charging and the battery interface, an on/off mechanism had
to be developed to handle when the board actually receives power from the battery. The on/off
mechanism as previously explained is based on two constraining factors. Firstly, that the battery voltage
is not below the pre-specified 3.4 V safe battery level. Secondly, that the user is not attempting disable
the device using the power button. In order to accomplish this, the AND gate was attached to both the
STM1061 low-voltage detector, and the output on the MAX16054 on/off controller. A reset button was
added to the microcontroller, which acts as a software reset, rather than as an actual power reset. The
resulting schematic for the on/off mechanism can be seen below in Figure 3-15.
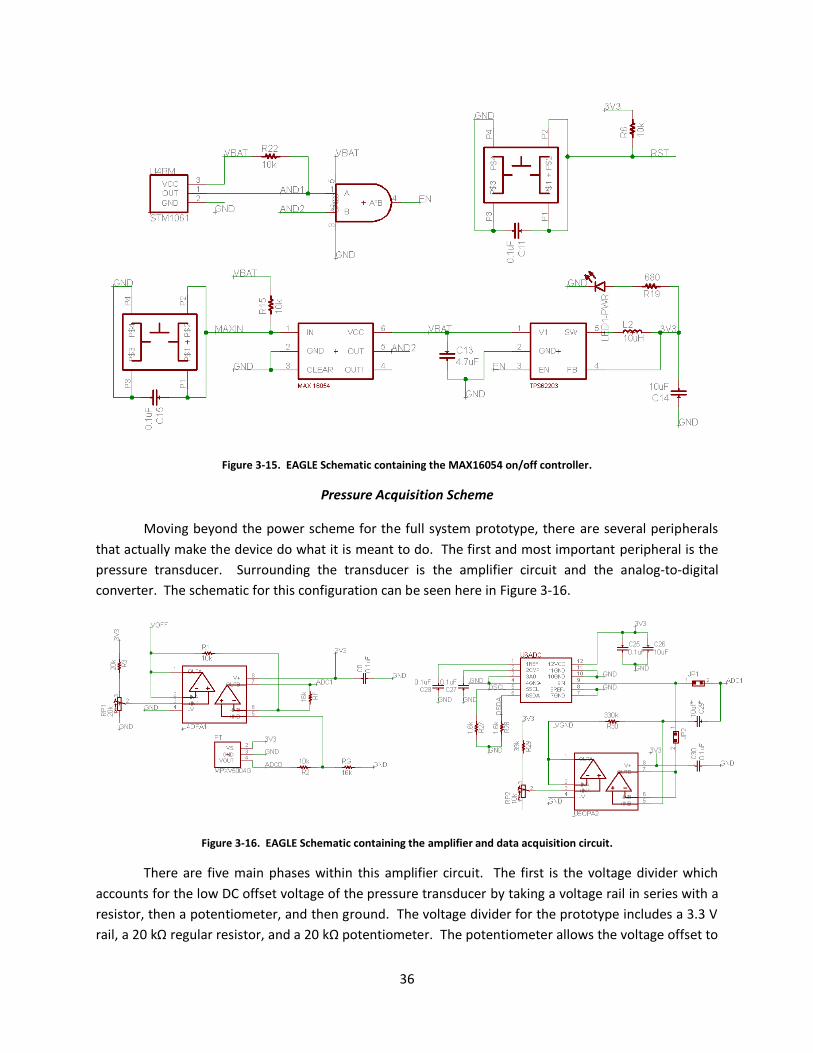
36
Figure 3-15. EAGLE Schematic containing the MAX16054 on/off controller.
Pressure Acquisition Scheme
Moving beyond the power scheme for the full system prototype, there are several peripherals
that actually make the device do what it is meant to do. The first and most important peripheral is the
pressure transducer. Surrounding the transducer is the amplifier circuit and the analog-to-digital
converter. The schematic for this configuration can be seen here in Figure 3-16.
Figure 3-16. EAGLE Schematic containing the amplifier and data acquisition circuit.
There are five main phases within this amplifier circuit. The first is the voltage divider which
accounts for the low DC offset voltage of the pressure transducer by taking a voltage rail in series with a
resistor, then a potentiometer, and then ground. The voltage divider for the prototype includes a 3.3 V
rail, a 20 kΩ regular resistor, and a 20 kΩ potentiometer. The potentiometer allows the voltage offset to
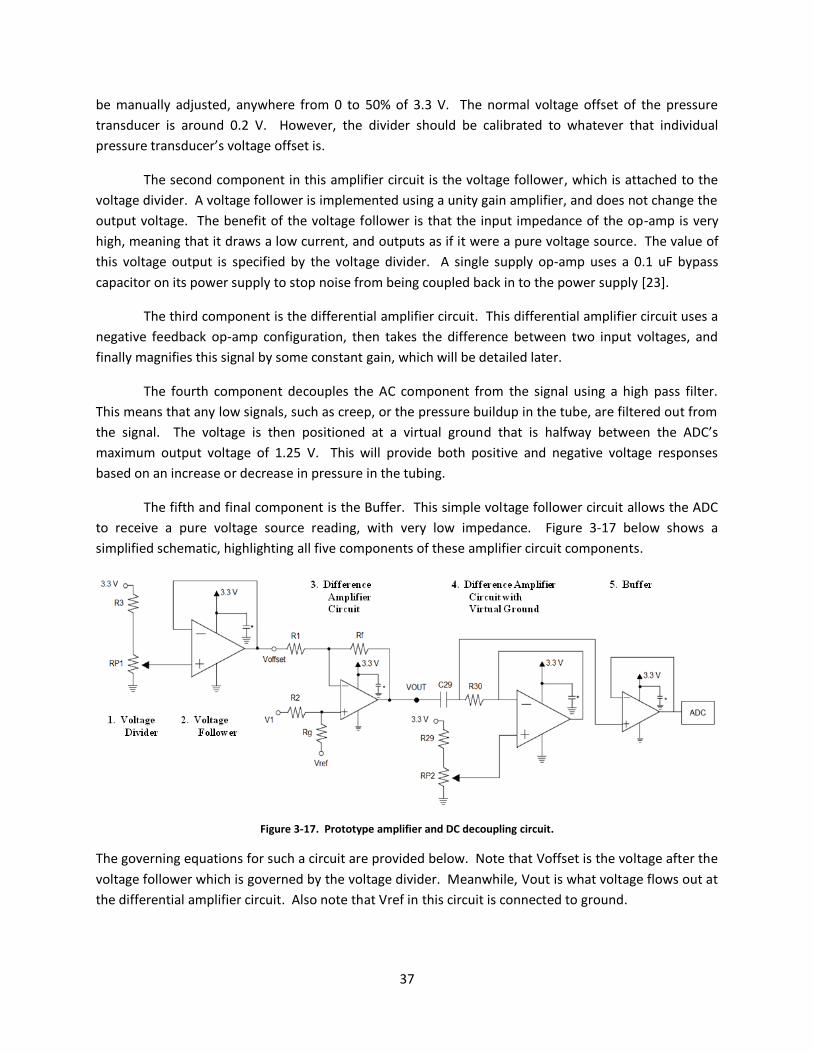
37
be manually adjusted, anywhere from 0 to 50% of 3.3 V. The normal voltage offset of the pressure
transducer is around 0.2 V. However, the divider should be calibrated to whatever that individual
pressure transducer’s voltage offset is.
The second component in this amplifier circuit is the voltage follower, which is attached to the
voltage divider. A voltage follower is implemented using a unity gain amplifier, and does not change the
output voltage. The benefit of the voltage follower is that the input impedance of the op-amp is very
high, meaning that it draws a low current, and outputs as if it were a pure voltage source. The value of
this voltage output is specified by the voltage divider. A single supply op-amp uses a 0.1 uF bypass
capacitor on its power supply to stop noise from being coupled back in to the power supply [23].
The third component is the differential amplifier circuit. This differential amplifier circuit uses a
negative feedback op-amp configuration, then takes the difference between two input voltages, and
finally magnifies this signal by some constant gain, which will be detailed later.
The fourth component decouples the AC component from the signal using a high pass filter.
This means that any low signals, such as creep, or the pressure buildup in the tube, are filtered out from
the signal. The voltage is then positioned at a virtual ground that is halfway between the ADC’s
maximum output voltage of 1.25 V. This will provide both positive and negative voltage responses
based on an increase or decrease in pressure in the tubing.
The fifth and final component is the Buffer. This simple voltage follower circuit allows the ADC
to receive a pure voltage source reading, with very low impedance. Figure 3-17 below shows a
simplified schematic, highlighting all five components of these amplifier circuit components.
Figure 3-17. Prototype amplifier and DC decoupling circuit.
The governing equations for such a circuit are provided below. Note that Voffset is the voltage after the
voltage follower which is governed by the voltage divider. Meanwhile, Vout is what voltage flows out at
the differential amplifier circuit. Also note that Vref in this circuit is connected to ground.

38
Equation 3-25
Equation 3-26
In addition to these equations are the equations for the high pass filter and virtual ground. The high
pass filter filters out all frequencies below the cutoff frequency fc. Meanwhile the virtual ground is
determined by the same equation for the voltage divider. The resulting equations are shown below.
Equation 3-27
Equation 3-28
In terms of actual components, a Texas Instruments OPA2301 was chosen to read the output
from the pressure transducer, because it had 16-bit resolution which matched the voltage resolution
required for the lowest amplitude signal. In addition it had low noise, a low single supply power rating,
and a compact form factor containing two amplifiers in one component. The linear technologies
LTC2471 ADC was chosen also due to its 16-bit resolution, as previously described. The incoming
pressure signals are converted and read in through the I2C interface on the microcontroller. Both the
op-amp and the ADC were powered by the 3.3 V singly supply rail. The gain on the differential amplifier
circuit was chosen to be 1.6, to keep the DC component of the signal less than the ADC’s 1.25 V rail. This
value may be lowered, if the system begins to have issues with oversaturation of the ADC or op-amp.
LCD Screen Scheme
With the data being gathered at the correct resolution, and with the voltage offset of the
pressure transducer accounted for, the software can then receive a high resolution signal from the
pressure transducer. Depending on available resources, the heart and respiratory rates can then display
them to the NHD-C0216 LCD screen. Similar to the ADC, the LCD screen was written to using the I2C
interface on the microcontroller. The schematic shown below in Figure 3-18, follows the LCD screen’s
datasheet for normal operation.
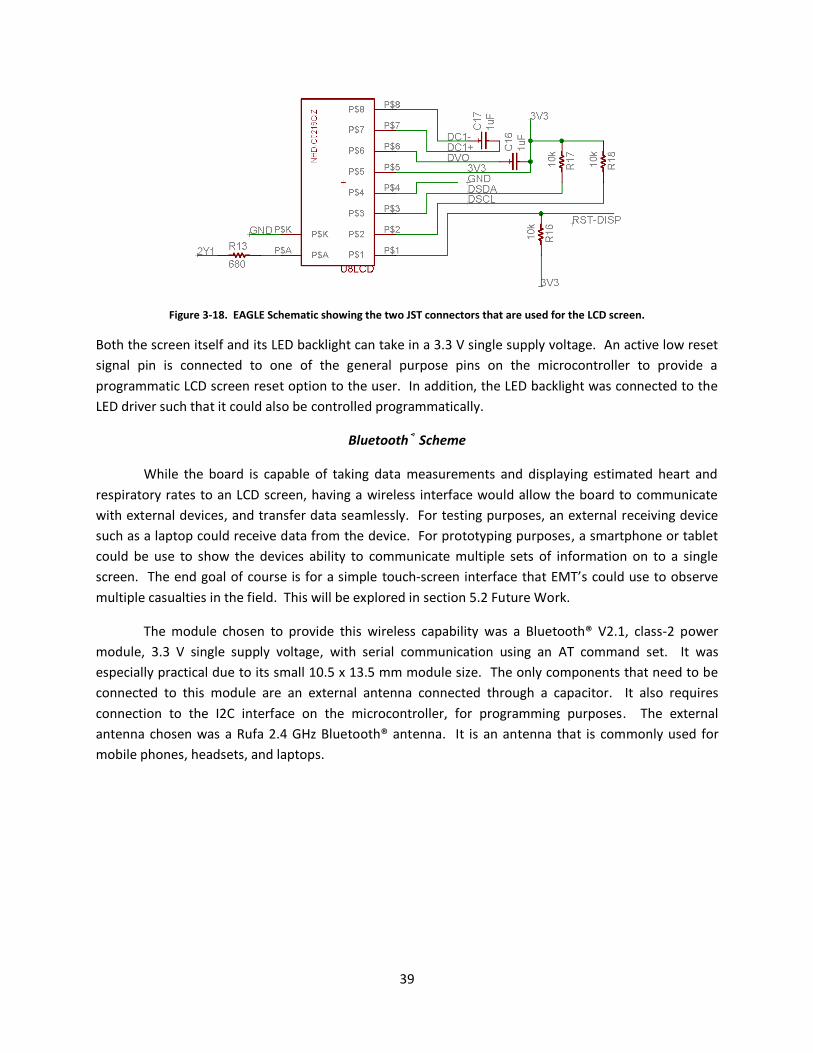
39
Figure 3-18. EAGLE Schematic showing the two JST connectors that are used for the LCD screen.
Both the screen itself and its LED backlight can take in a 3.3 V single supply voltage. An active low reset
signal pin is connected to one of the general purpose pins on the microcontroller to provide a
programmatic LCD screen reset option to the user. In addition, the LED backlight was connected to the
LED driver such that it could also be controlled programmatically.
Bluetooth® Scheme
While the board is capable of taking data measurements and displaying estimated heart and
respiratory rates to an LCD screen, having a wireless interface would allow the board to communicate
with external devices, and transfer data seamlessly. For testing purposes, an external receiving device
such as a laptop could receive data from the device. For prototyping purposes, a smartphone or tablet
could be use to show the devices ability to communicate multiple sets of information on to a single
screen. The end goal of course is for a simple touch-screen interface that EMT’s could use to observe
multiple casualties in the field. This will be explored in section 5.2 Future Work.
The module chosen to provide this wireless capability was a Bluetooth® V2.1, class-2 power
module, 3.3 V single supply voltage, with serial communication using an AT command set. It was
especially practical due to its small 10.5 x 13.5 mm module size. The only components that need to be
connected to this module are an external antenna connected through a capacitor. It also requires
connection to the I2C interface on the microcontroller, for programming purposes. The external
antenna chosen was a Rufa 2.4 GHz Bluetooth® antenna. It is an antenna that is commonly used for
mobile phones, headsets, and laptops.
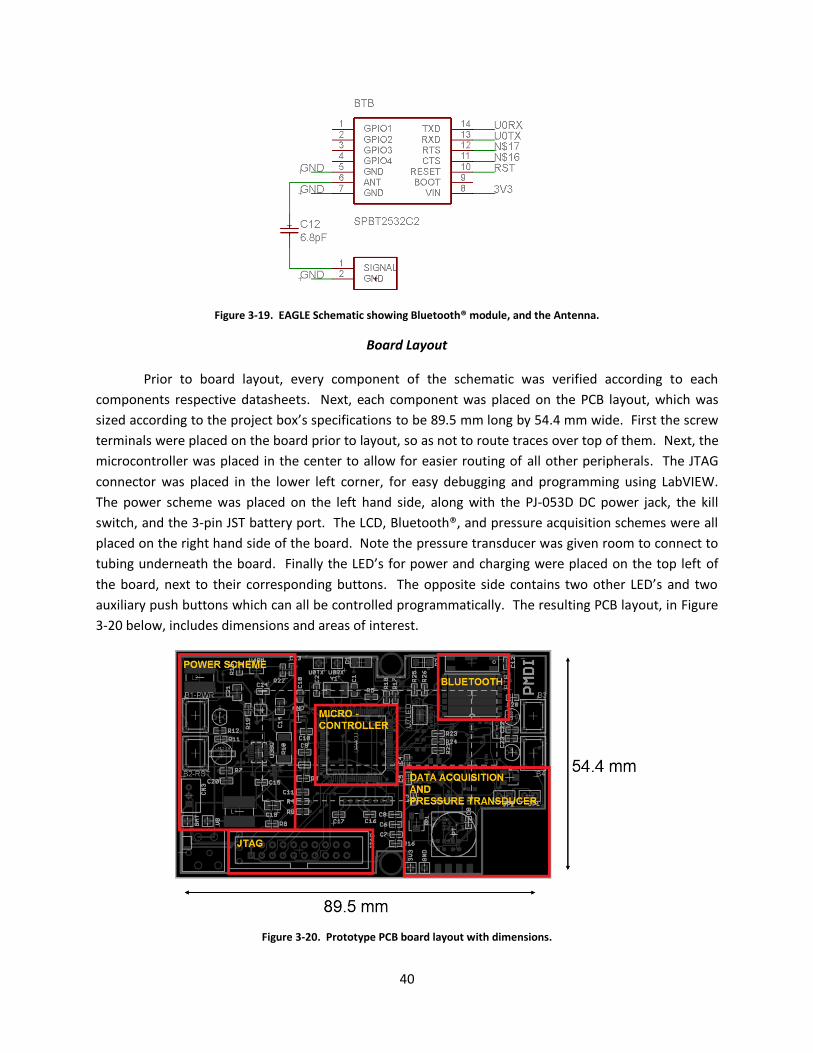
40
Figure 3-19. EAGLE Schematic showing Bluetooth® module, and the Antenna.
Board Layout
Prior to board layout, every component of the schematic was verified according to each
components respective datasheets. Next, each component was placed on the PCB layout, which was
sized according to the project box’s specifications to be 89.5 mm long by 54.4 mm wide. First the screw
terminals were placed on the board prior to layout, so as not to route traces over top of them. Next, the
microcontroller was placed in the center to allow for easier routing of all other peripherals. The JTAG
connector was placed in the lower left corner, for easy debugging and programming using LabVIEW.
The power scheme was placed on the left hand side, along with the PJ-053D DC power jack, the kill
switch, and the 3-pin JST battery port. The LCD, Bluetooth®, and pressure acquisition schemes were all
placed on the right hand side of the board. Note the pressure transducer was given room to connect to
tubing underneath the board. Finally the LED’s for power and charging were placed on the top left of
the board, next to their corresponding buttons. The opposite side contains two other LED’s and two
auxiliary push buttons which can all be controlled programmatically. The resulting PCB layout, in Figure
3-20 below, includes dimensions and areas of interest.
Figure 3-20. Prototype PCB board layout with dimensions.
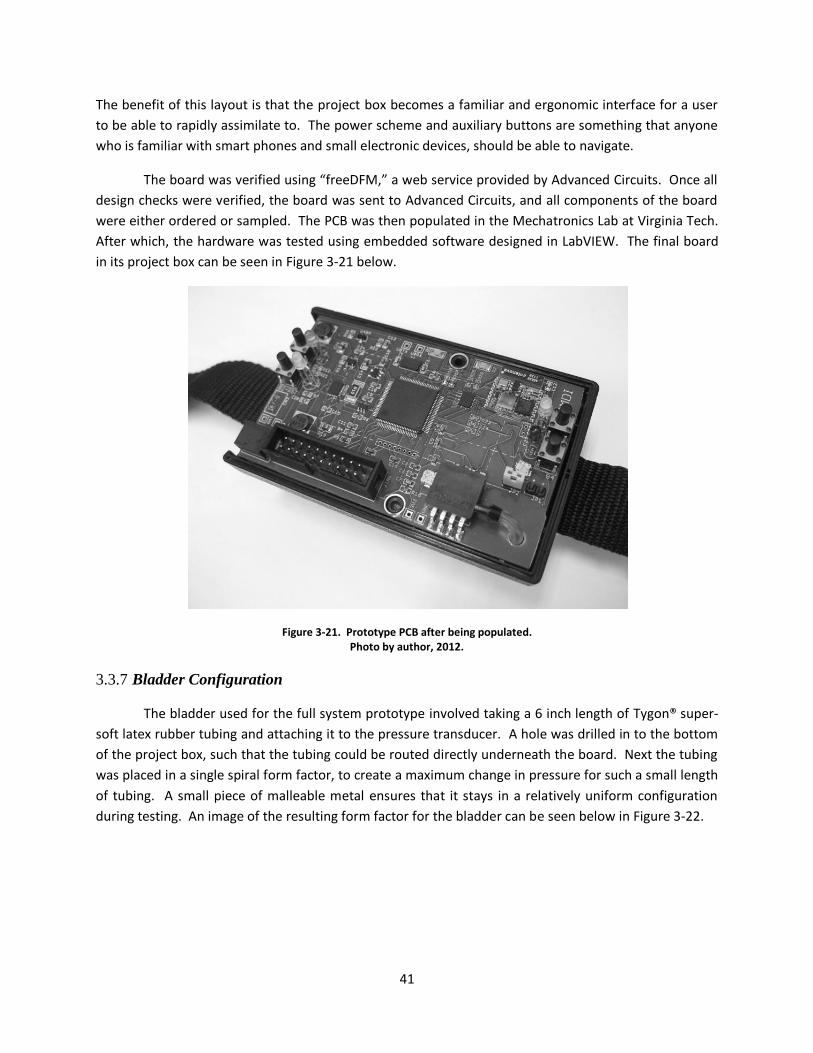
41
The benefit of this layout is that the project box becomes a familiar and ergonomic interface for a user
to be able to rapidly assimilate to. The power scheme and auxiliary buttons are something that anyone
who is familiar with smart phones and small electronic devices, should be able to navigate.
The board was verified using “freeDFM,” a web service provided by Advanced Circuits. Once all
design checks were verified, the board was sent to Advanced Circuits, and all components of the board
were either ordered or sampled. The PCB was then populated in the Mechatronics Lab at Virginia Tech.
After which, the hardware was tested using embedded software designed in LabVIEW. The final board
in its project box can be seen in Figure 3-21 below.
Figure 3-21. Prototype PCB after being populated. Photo by author, 2012.
3.3.7 Bladder Configuration
The bladder used for the full system prototype involved taking a 6 inch length of Tygon® super-
soft latex rubber tubing and attaching it to the pressure transducer. A hole was drilled in to the bottom
of the project box, such that the tubing could be routed directly underneath the board. Next the tubing
was placed in a single spiral form factor, to create a maximum change in pressure for such a small length
of tubing. A small piece of malleable metal ensures that it stays in a relatively uniform configuration
during testing. An image of the resulting form factor for the bladder can be seen below in Figure 3-22.

42
Figure 3-22. Prototype bladder configuration used for human testing. Photo by author, 2012.
This change in tubing configuration from a pure spiral to a single crossed spiral should result in a
different voltage response. It is anticipated that two layers of tubing will create a higher voltage
response than a single layer of tubing, given the same input. The tubing or bladder configuration is
considered a highly variable factor in the design, and future work concerning it will be discussed in
section 5.2.2 Manufacturing a Custom Bladder.
3.3.8 Software Development
Once the full system prototype was fully assembled and ready to go, each component had to be
programmed in LabVIEW. The three main components of the full system prototype that required
programming were the NHD-C0216 LCD screen, the LTC2471 ADC, and the SPBT2532C2 Bluetooth®
module. The LCD screen and the ADC both were programmable through the I2C interface. LabVIEW’s
ARM I2C palettes provide subVI’s with the ability to configure, open, read, write, and close I2C ports.
Therefore the only thing necessary to get the two to operate, was to provide LabVIEW the slave address
and any configuration messages that might be required to operate each of the two respective devices.
The LCD screen’s slave address was x7C, while the ADC’s slave address was x14. Due to a known
configuration issue in the LCD screen by Newhaven, a bit shifting occurs when reading in the slave
address. Therefore, the LCD screen chosen can only be recognized when bit shifted to the right or by
dividing its address in decimal form by two. This means the LCD screen’s new slave address becomes
x3E. The rest of the configuration VI with some sample code can be seen throughout Appendix C:
LabVIEW Code.
In order to prepare the device for gathering data, the Bluetooth module was configured to
transmit samples from the ADC every second. The sampling frequency of the ADC needs to be twice
that of the highest expected frequency, in order for it to be seen using signal processing techniques such
as an autospectrum. Heart rate is therefore the confounding factor, because it occurs at a higher
frequency than respiration, in most cases. The upper limit of heart rate, as previously stated, varies with
age. However, one can safely assume that 200 bpm is well above the upper limit for any person. 200
bpm corresponds with a 3.333 Hz heart rate signal. The sampling frequency therefore must be at least
6.666 Hz. Due to the available hardware resources, a 20 Hz sampling frequency was chosen, such that
there would be three times the required sampling frequency to extract the desired signals. The reason
why a higher sampling frequency was not chosen has more to do with the available memory on the
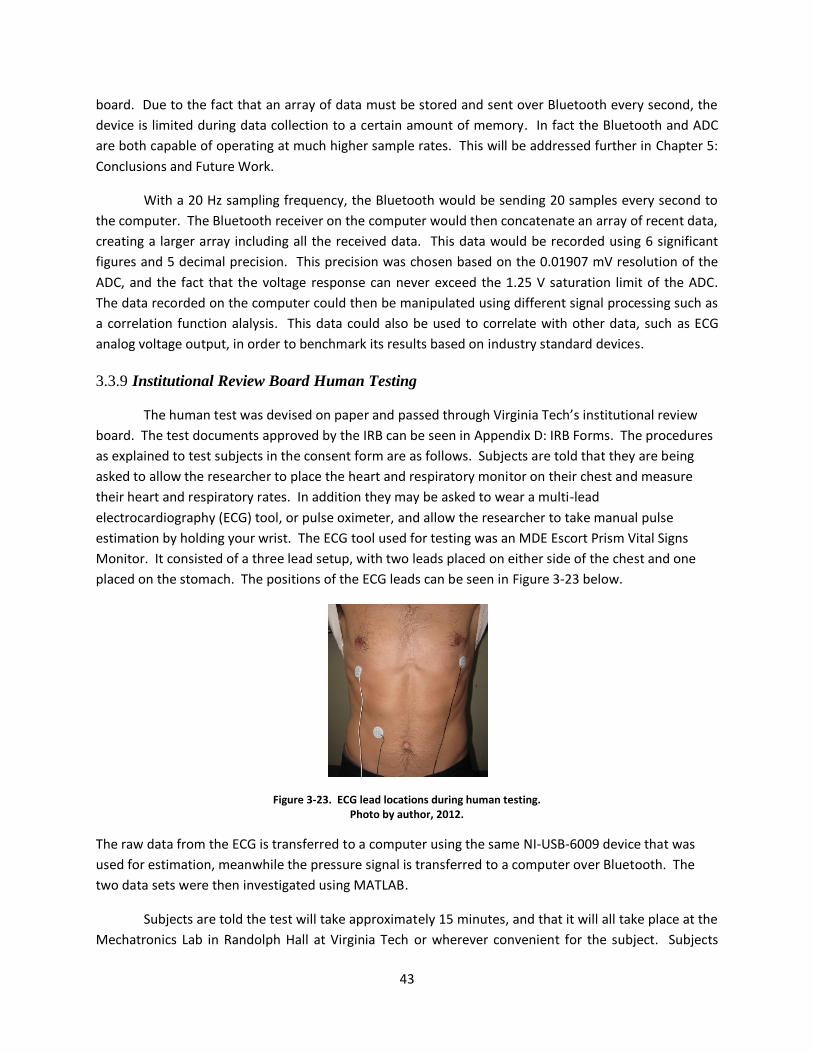
43
board. Due to the fact that an array of data must be stored and sent over Bluetooth every second, the
device is limited during data collection to a certain amount of memory. In fact the Bluetooth and ADC
are both capable of operating at much higher sample rates. This will be addressed further in Chapter 5:
Conclusions and Future Work.
With a 20 Hz sampling frequency, the Bluetooth would be sending 20 samples every second to
the computer. The Bluetooth receiver on the computer would then concatenate an array of recent data,
creating a larger array including all the received data. This data would be recorded using 6 significant
figures and 5 decimal precision. This precision was chosen based on the 0.01907 mV resolution of the
ADC, and the fact that the voltage response can never exceed the 1.25 V saturation limit of the ADC.
The data recorded on the computer could then be manipulated using different signal processing such as
a correlation function alalysis. This data could also be used to correlate with other data, such as ECG
analog voltage output, in order to benchmark its results based on industry standard devices.
3.3.9 Institutional Review Board Human Testing
The human test was devised on paper and passed through Virginia Tech’s institutional review
board. The test documents approved by the IRB can be seen in Appendix D: IRB Forms. The procedures
as explained to test subjects in the consent form are as follows. Subjects are told that they are being
asked to allow the researcher to place the heart and respiratory monitor on their chest and measure
their heart and respiratory rates. In addition they may be asked to wear a multi-lead
electrocardiography (ECG) tool, or pulse oximeter, and allow the researcher to take manual pulse
estimation by holding your wrist. The ECG tool used for testing was an MDE Escort Prism Vital Signs
Monitor. It consisted of a three lead setup, with two leads placed on either side of the chest and one
placed on the stomach. The positions of the ECG leads can be seen in Figure 3-23 below.
Figure 3-23. ECG lead locations during human testing. Photo by author, 2012.
The raw data from the ECG is transferred to a computer using the same NI-USB-6009 device that was
used for estimation, meanwhile the pressure signal is transferred to a computer over Bluetooth. The
two data sets were then investigated using MATLAB.
Subjects are told the test will take approximately 15 minutes, and that it will all take place at the
Mechatronics Lab in Randolph Hall at Virginia Tech or wherever convenient for the subject. Subjects
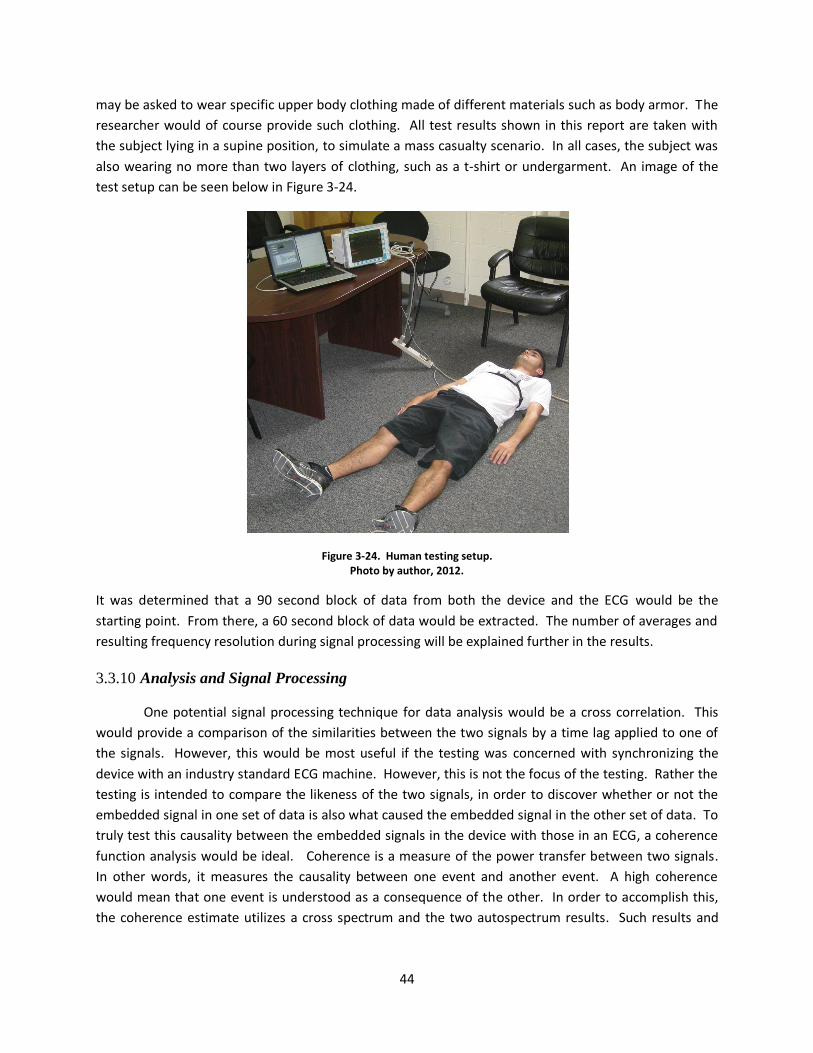
44
may be asked to wear specific upper body clothing made of different materials such as body armor. The
researcher would of course provide such clothing. All test results shown in this report are taken with
the subject lying in a supine position, to simulate a mass casualty scenario. In all cases, the subject was
also wearing no more than two layers of clothing, such as a t-shirt or undergarment. An image of the
test setup can be seen below in Figure 3-24.
Figure 3-24. Human testing setup. Photo by author, 2012.
It was determined that a 90 second block of data from both the device and the ECG would be the
starting point. From there, a 60 second block of data would be extracted. The number of averages and
resulting frequency resolution during signal processing will be explained further in the results.
3.3.10 Analysis and Signal Processing
One potential signal processing technique for data analysis would be a cross correlation. This
would provide a comparison of the similarities between the two signals by a time lag applied to one of
the signals. However, this would be most useful if the testing was concerned with synchronizing the
device with an industry standard ECG machine. However, this is not the focus of the testing. Rather the
testing is intended to compare the likeness of the two signals, in order to discover whether or not the
embedded signal in one set of data is also what caused the embedded signal in the other set of data. To
truly test this causality between the embedded signals in the device with those in an ECG, a coherence
function analysis would be ideal. Coherence is a measure of the power transfer between two signals.
In other words, it measures the causality between one event and another event. A high coherence
would mean that one event is understood as a consequence of the other. In order to accomplish this,
the coherence estimate utilizes a cross spectrum and the two autospectrum results. Such results and

45
analysis were vital in measuring the capability of this device versus the industry standard. However,
survey results were vital to gaining input on the need and the future applications of the device.
3.3.11 Institutional Review Board Explorative Survey
In order to receive direct feedback from emergency medical responders, a survey was created,
and passed through Virginia Tech’s institutional review board. The survey, which can be seen in
Appendix D: IRB Forms, was provided to emergency medical responders throughout Roanoke and
Blacksburg, using contacts from researchers at Carilion Clinic, Carilion Roanoke Memorial Hospital, and
the Virginia Tech Rescue squad.
As seen in the survey, there were very important questions that needed to be answered. These
answers would help in development of the full system prototype, and in future applications of the
project. Firstly, it was important to know by what means the average EMT takes heart and respiratory
rate information from a patient. Secondly, how much time does it take them to do this, and do they
ever have difficulty finding the information based on their current method? Finally, would they find it
useful to have a deployable chest sensor such as the one that we are creating? The survey was
distributed throughout the spring and summer of 2012. The data was then collected, analyzed, and is
described in section 4.2.2 IRB Explorative Survey. Regardless of the results, it was expected that future
applications of the technology will take in to account the comments found in the survey results.
3.4 Signal Processing Techniques
Through digital signal processing it is possible to extract information from a discrete time
domain signal that is not always obvious to an observer. In order to observe both cardio and respiratory
signals simultaneously, an understanding of several signal processing techniques is required. Several
techniques have already been explored throughout the methods section. However, this section is
meant to explain those techniques in further detail, as they will be utilized throughout the results
section. These techniques include but are not limited to Fourier series, cross correlation, cross
spectrum, autocorrelation, autospectrum, coherence analysis, and averaging.
3.4.1 Fourier Series Analysis
Fourier series analysis is a method by which time domain waveforms are decomposed in to
magnitude and phase estimates in the frequency domain [24]. These decompositions are made up of
sine and cosine functions, at a variety of frequencies. It is a widely utilized technique throughout signal
processing. The discrete Fourier transform or DFT provides this decomposition. It is used to calculate
the cross spectrum and the autospectrum. It is assumed throughout this discussion that there are two
arrays of data, x and y.
3.4.2 Cross Correlation and Cross Spectrum
Cross correlation (Cxy) is a measure of the likeness of x and y as a function of time lag applied to
one of them. Meanwhile the cross spectrum (Gxy) is the Fourier transform of this cross correlation.

46
Note that the conjugate of Gxy is equal to Gyx. It is always a complex valued function, and does contain
phase information between two signals. The easiest way to find the cross spectrum, programmatically,
is to take the DFT of sample record of y, and then multiply this by the complex conjugate of the DFT the
same size sample record of x [24]. The result is the double-sided spectrum, because the amplitude of
the cross spectrum is half of the desired result, or the single-sided spectrum.
3.4.3 Autocorrelation and Autospectrum
Autocorrelation (Cxx or Cyy) is the cross correlation between a signal and itself. This can mean
the cross correlation between x and itself, or between y and itself. Autospectrum (Gxx or Gyy) is the
Fourier transform of the autocorrelation. It is always a positive function, and it contains no phase
information. One way to find the autospectrum, of x for example, is to take the DFT of a sample record
of x, and then multiply this by the complex conjugate of the same sample record. The outcome is again
the double-sided spectrum, because the amplitude of the autospectrum is half of the desired result, or
the single-sided spectrum. Once Gxy, Gxx, and Gyy have been found one can use these to measure the
causality between x and y. Such causality can be found by relating these spectral estimations in terms of
correlated and uncorrelated content.
3.4.4 Coherence Function
Coherence is a measure of the causality between two events as a function of frequency. This
will only be useful in showing what level of confidence exists that an event in x causes an event in y. The
coherence function has a value between 0 and 1, where 0 suggests that the output measurement is
composed entirely of uncorrelated content. Meanwhile a value of 1 suggests that there is no
uncorrelated content in the output measurement.
3.4.5 Averaging
In order to gain true confidence in the results, several sample records of data must be evaluated
from the original data. This is where the term averaging comes in to play. Averaging provides
confidence behind the results of Gxy, Gxx, and Gyy, by creating an ensemble of sample records. The
individual auto and cross spectrum results of each sample record are then averaged. The more
averages, the more confidence one can have in the results. The number of averages that can be taken is
limited by the original size of the data. If there is only one sample record, then there can be no
confidence in the autospectrum or cross spectrum results. Meanwhile as the number of averages
approaches infinity, the more confidence one can have in the result.
3.4.6 Frequency Response Function
When defining inputs and outputs, the term Frequency Response Function (FRF) is inseparable.
The FRF can be measured from output to input or from input to output. In this case, the calculations are
based on an H1 estimate, where the FRF is equal to Gxy divided by Gxx. If the calculations were based on
an H2 estimate, the FRF would be equal to Gyy divided by Gyx [24]. Recall that the conjugate Gxy is equal
to Gyx. Note that the coherence estimate would be the same, regardless of an H1 or an H2 estimate.

47
These techniques will prove useful, as explained throughout the following sections on simulated
testing, and human testing. In the section on simulation, the autospectrum will be useful in order to
understand the characteristics of the embedded signal. It will also be useful for determining the signal
to noise ratio, which will be discussed. For the human testing results, the cross spectrum and coherence
function will be useful in order to understand the causality between the signals embedded in the
pressure transducer device output, with the signals embedded in the ECG machine’s output. The
number of averages used to estimate Gxy, Gxx, and Gyy will be explained according to each section.
48
Chapter 4: Results and Discussion
Now that all of the methods for simulated testing and human testing have been explained in
detail, the results of each stage will be provided. The simulation results will compare the data results
from the first PCB to the simulated breathing mannequin. Finally, the human testing results will
showcase the coherence between the data from the final pressure transducer device with an industry
standard ECG. In addition, some of the general trends that resulted from the IRB survey will be
presented and explained. Note that the y-axis in all of the plots, as well as the rest of the time domain
plots shown, is in terms of voltage (V) and not gauge pressure (kPa). The conversion between the two is
based on the sensitivity of the pressure transducer being used, along with the offset, and the gains of
the amplification circuit. However, such a conversion is not relevant to purpose of these tests.
4.1 Simulation Results
The simulation device was taken to Carilion Center for Experiential Learning and attached to a
simulated breathing mannequin. Data was collected at a 1000 Hz sampling frequency for a minimum of
30 seconds. This sampling rate far exceeded what was needed in order to show the frequencies that
were expected due to heart and respiratory rate. The highest frequency that was expected during
simulation would be 1.0 Hz. Therefore the minimum sampling frequency required, would only have to
be twice this, or 2.0 Hz. By decimating the 30,000 point array down in to 10 sets of 3,000 point arrays,
the frequency range of the autospectrum results would now have a sampling frequency of 100 Hz, and
therefore a Nyquist of only 50 Hz. However, these sample records were created differently for
simulation results, than for any other results. In this case, the original array was decimated. The benefit
of doing it this way is the user still has 30 second blocks of data to use for averaging. This method is
therefore much more effective in this case, as long as no aliasing appears due to higher frequency
content in the results. A plot below shows the autospectrum results for the 24 RR test, based on the
original data before decimation.
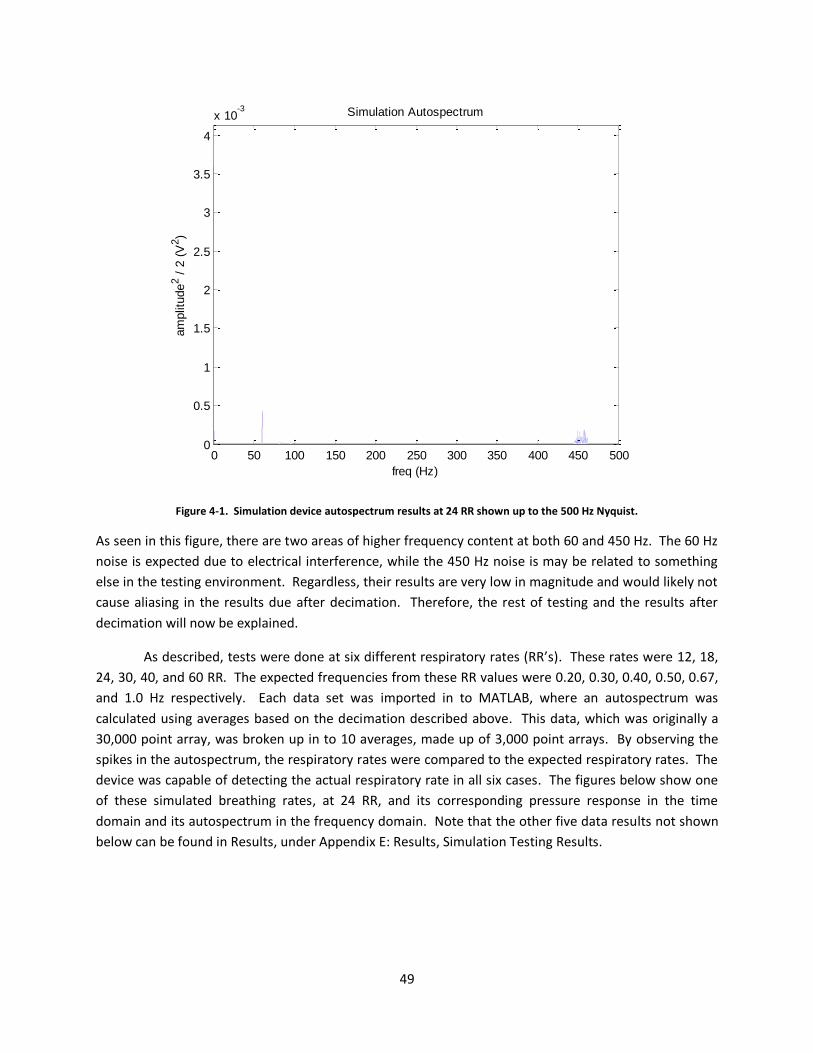
49
Figure 4-1. Simulation device autospectrum results at 24 RR shown up to the 500 Hz Nyquist.
As seen in this figure, there are two areas of higher frequency content at both 60 and 450 Hz. The 60 Hz
noise is expected due to electrical interference, while the 450 Hz noise is may be related to something
else in the testing environment. Regardless, their results are very low in magnitude and would likely not
cause aliasing in the results due after decimation. Therefore, the rest of testing and the results after
decimation will now be explained.
As described, tests were done at six different respiratory rates (RR’s). These rates were 12, 18,
24, 30, 40, and 60 RR. The expected frequencies from these RR values were 0.20, 0.30, 0.40, 0.50, 0.67,
and 1.0 Hz respectively. Each data set was imported in to MATLAB, where an autospectrum was
calculated using averages based on the decimation described above. This data, which was originally a
30,000 point array, was broken up in to 10 averages, made up of 3,000 point arrays. By observing the
spikes in the autospectrum, the respiratory rates were compared to the expected respiratory rates. The
device was capable of detecting the actual respiratory rate in all six cases. The figures below show one
of these simulated breathing rates, at 24 RR, and its corresponding pressure response in the time
domain and its autospectrum in the frequency domain. Note that the other five data results not shown
below can be found in Results, under Appendix E: Results, Simulation Testing Results.
0 50 100 150 200 250 300 350 400 450 5000
0.5
1
1.5
2
2.5
3
3.5
4
x 10-3
freq (Hz)
am
plit
ude
2 /
2 (
V2)
Simulation Autospectrum
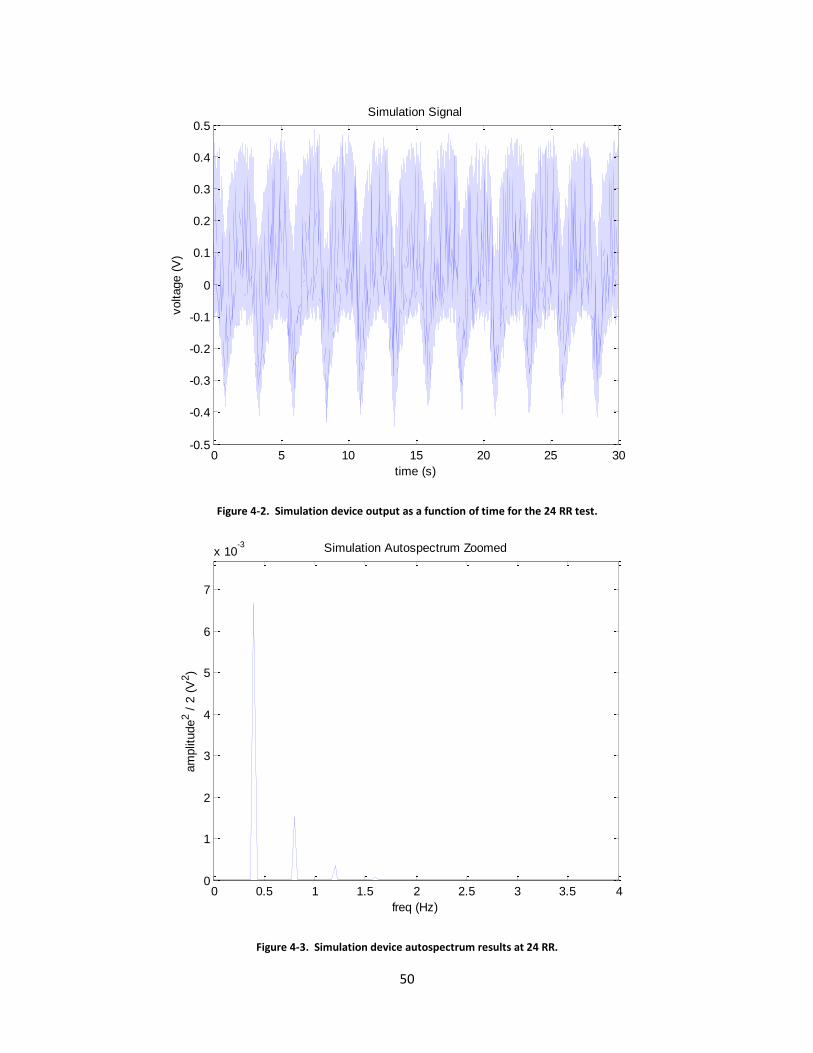
50
Figure 4-2. Simulation device output as a function of time for the 24 RR test.
Figure 4-3. Simulation device autospectrum results at 24 RR.
0 5 10 15 20 25 30-0.5
-0.4
-0.3
-0.2
-0.1
0
0.1
0.2
0.3
0.4
0.5
time (s)
voltage (
V)
Simulation Signal
0 0.5 1 1.5 2 2.5 3 3.5 40
1
2
3
4
5
6
7
x 10-3
freq (Hz)
am
plit
ude
2 /
2 (
V2)
Simulation Autospectrum Zoomed
51
It should be noted that the multiple peaks after the first observed frequency in each of the
autospectrum results, are harmonics of the original signal. These peaks are expected in any Fourier
analysis, as they represent whole number multiples, or harmonics, of the original frequency. The SNR
for respiration improved from 4.014 during feasibility testing, to 48.915 for the simulation tests.
The increased SNR is a positive sign. It can be explained in two ways. The first explanation is
that the feasibility test was done on a human. Humans have more variation in their breathing and other
extraneous movements than the simulated breathing mannequin. The second explanation, as expected,
is that the move from through-hole breadboard components, to solder mounted PCB components,
reduced the transfer of noise. Besides improved SNR, the device must be capable of accurate
estimation of the respiratory rates of the mannequin. The observed frequencies in each of the six tests
are tallied in the table below. The plots for each of these tests can be found in Results, under Simulation
Testing Results.
Table 6. Simulated versus observed frequencies during simulation testing.
Test # Respiratory Rate (per minute) Expected Freq. (Hz) Observed Freq. Spike (Hz)
1 12 0.20 0.20
2 18 0.30 0.30
3 24 0.40 0.40
4 30 0.50 0.50
5 40 0.6667 0.6667
6 60 1.0 1.0
As shown the observed frequencies matched exactly to each of the six expected frequencies. Any
coherence analysis would require another signal to compare to. The hypothesis being that the
embedded signals in each are caused by each other. As mentioned previously, human testing was
carried out that would verify whether or not these signals were caused by each other.
4.2 Human Testing Results
For the purposes of benchmarking this device versus the industry standard for heart and
respiratory monitoring, a set of IRB approved human tests were carried out. Specifically, several
subjects were attached to ECG leads, which would monitor their heart and respiratory rates.
Simultaneously, they were attached to the full system prototype. Both the ECG and the full system
prototype transmitted data to the computer for 90 seconds at a 20 Hz sampling rate. In addition to the
benchmark testing, an explorative survey was distributed to EMT’s. The results of both the benchmark
testing and the explorative survey are shown below.
4.2.1 IRB Benchmark Testing
The raw data was taken in to MATLAB, where the following results were found. Firstly, the
results varied from person to person. Some subjects had heart and respiratory rates that could easily be
seen by both the pressure transducer device and the ECG. Meanwhile, other subjects’ heart rates were
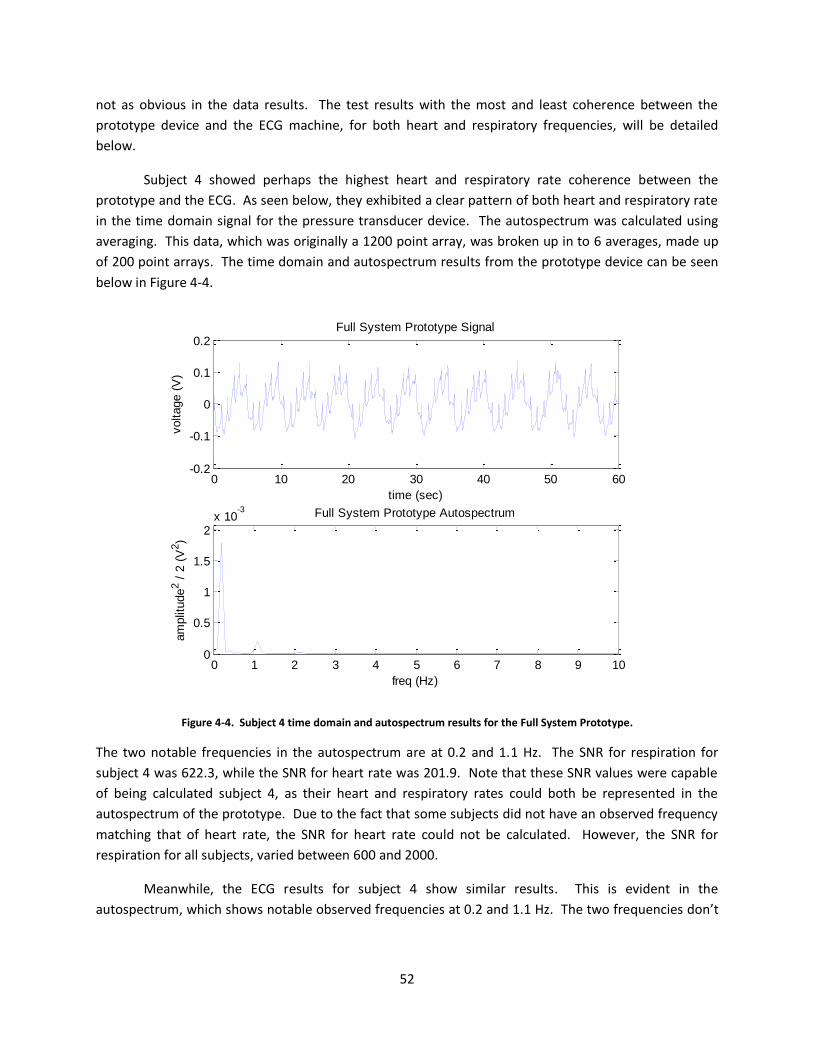
52
not as obvious in the data results. The test results with the most and least coherence between the
prototype device and the ECG machine, for both heart and respiratory frequencies, will be detailed
below.
Subject 4 showed perhaps the highest heart and respiratory rate coherence between the
prototype and the ECG. As seen below, they exhibited a clear pattern of both heart and respiratory rate
in the time domain signal for the pressure transducer device. The autospectrum was calculated using
averaging. This data, which was originally a 1200 point array, was broken up in to 6 averages, made up
of 200 point arrays. The time domain and autospectrum results from the prototype device can be seen
below in Figure 4-4.
Figure 4-4. Subject 4 time domain and autospectrum results for the Full System Prototype.
The two notable frequencies in the autospectrum are at 0.2 and 1.1 Hz. The SNR for respiration for
subject 4 was 622.3, while the SNR for heart rate was 201.9. Note that these SNR values were capable
of being calculated subject 4, as their heart and respiratory rates could both be represented in the
autospectrum of the prototype. Due to the fact that some subjects did not have an observed frequency
matching that of heart rate, the SNR for heart rate could not be calculated. However, the SNR for
respiration for all subjects, varied between 600 and 2000.
Meanwhile, the ECG results for subject 4 show similar results. This is evident in the
autospectrum, which shows notable observed frequencies at 0.2 and 1.1 Hz. The two frequencies don’t
0 10 20 30 40 50 60-0.2
-0.1
0
0.1
0.2
time (sec)
voltage (
V)
Full System Prototype Signal
0 1 2 3 4 5 6 7 8 9 100
0.5
1
1.5
2x 10
-3
freq (Hz)
am
plit
ude
2 /
2 (
V2)
Full System Prototype Autospectrum
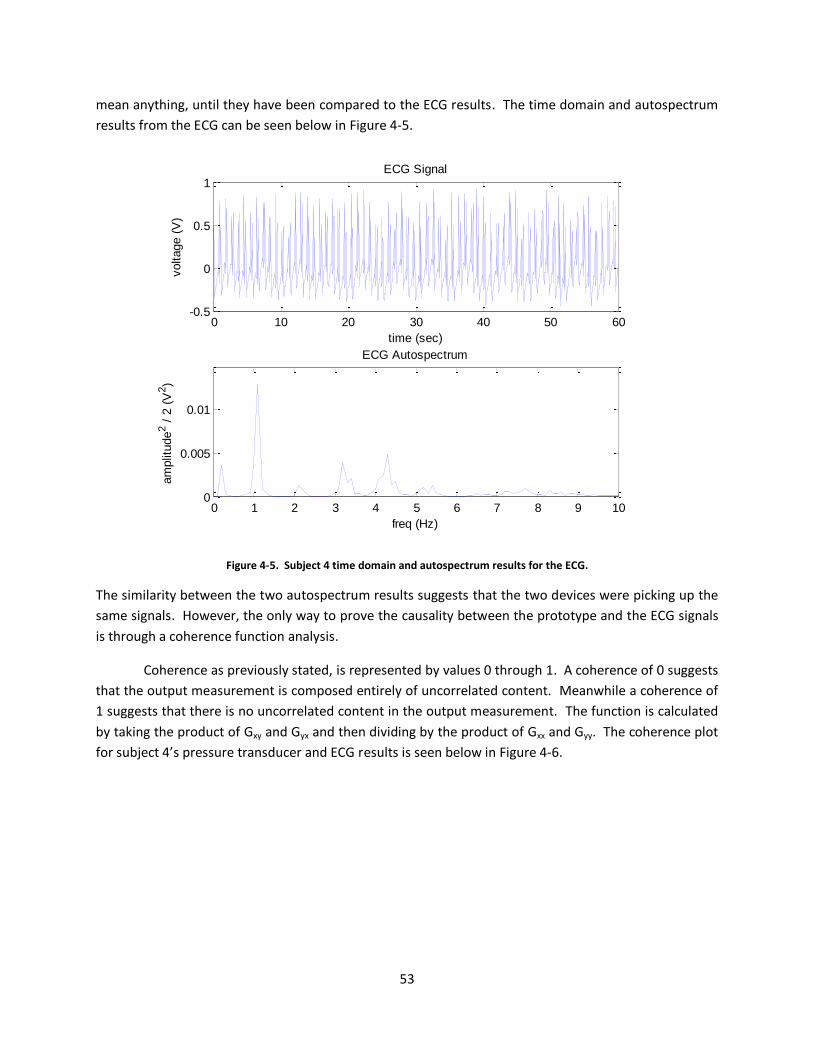
53
mean anything, until they have been compared to the ECG results. The time domain and autospectrum
results from the ECG can be seen below in Figure 4-5.
Figure 4-5. Subject 4 time domain and autospectrum results for the ECG.
The similarity between the two autospectrum results suggests that the two devices were picking up the
same signals. However, the only way to prove the causality between the prototype and the ECG signals
is through a coherence function analysis.
Coherence as previously stated, is represented by values 0 through 1. A coherence of 0 suggests
that the output measurement is composed entirely of uncorrelated content. Meanwhile a coherence of
1 suggests that there is no uncorrelated content in the output measurement. The function is calculated
by taking the product of Gxy and Gyx and then dividing by the product of Gxx and Gyy. The coherence plot
for subject 4’s pressure transducer and ECG results is seen below in Figure 4-6.
0 10 20 30 40 50 60-0.5
0
0.5
1
time (sec)
voltage (
V)
ECG Signal
0 1 2 3 4 5 6 7 8 9 100
0.005
0.01
freq (Hz)
am
plit
ude
2 /
2 (
V2)
ECG Autospectrum
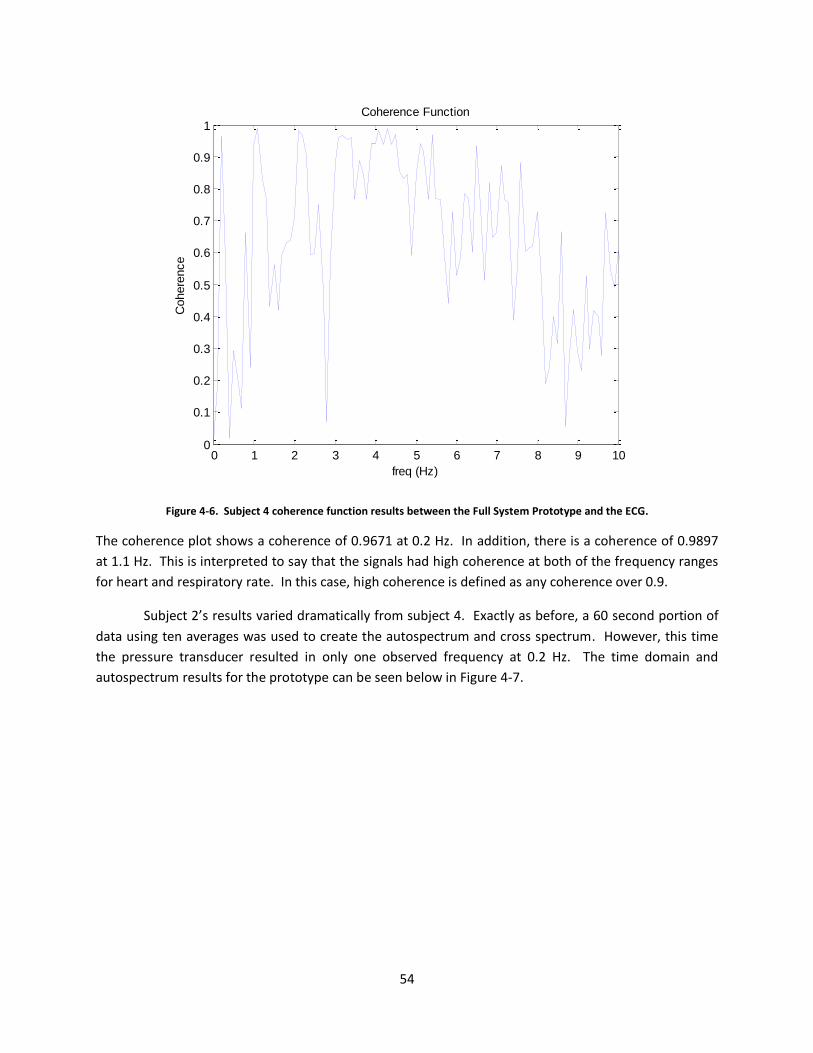
54
Figure 4-6. Subject 4 coherence function results between the Full System Prototype and the ECG.
The coherence plot shows a coherence of 0.9671 at 0.2 Hz. In addition, there is a coherence of 0.9897
at 1.1 Hz. This is interpreted to say that the signals had high coherence at both of the frequency ranges
for heart and respiratory rate. In this case, high coherence is defined as any coherence over 0.9.
Subject 2’s results varied dramatically from subject 4. Exactly as before, a 60 second portion of
data using ten averages was used to create the autospectrum and cross spectrum. However, this time
the pressure transducer resulted in only one observed frequency at 0.2 Hz. The time domain and
autospectrum results for the prototype can be seen below in Figure 4-7.
0 1 2 3 4 5 6 7 8 9 100
0.1
0.2
0.3
0.4
0.5
0.6
0.7
0.8
0.9
1
freq (Hz)
Cohere
nce
Coherence Function
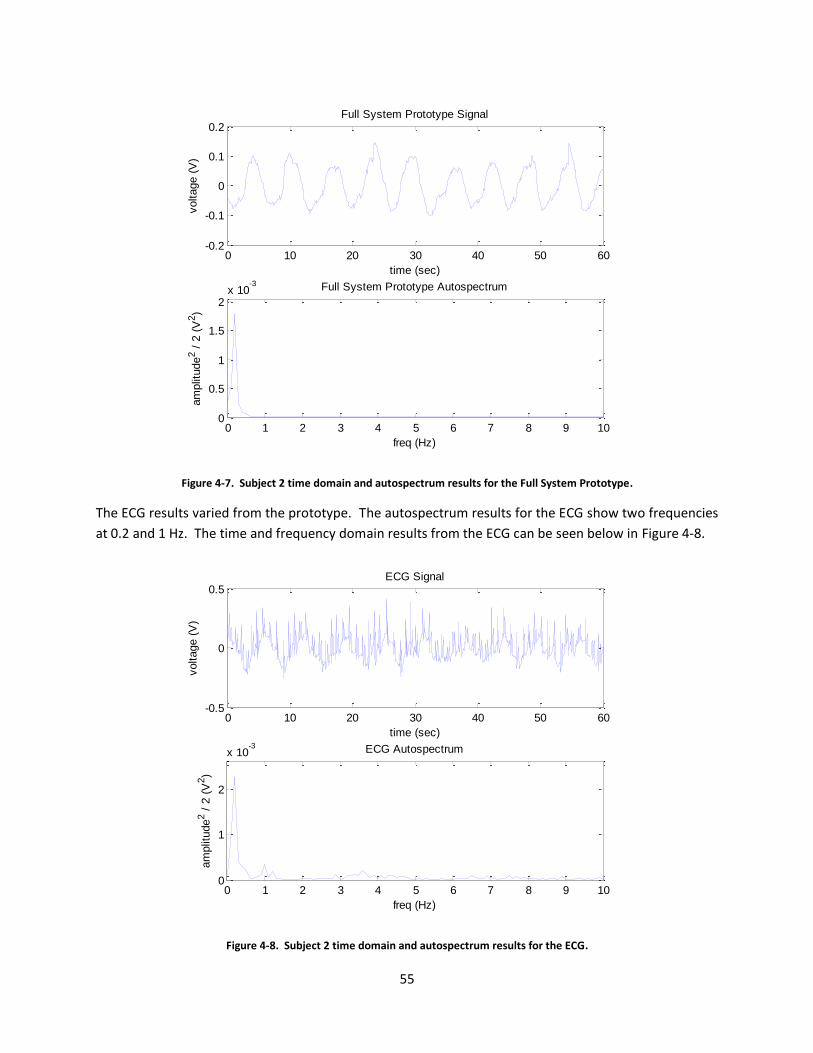
55
Figure 4-7. Subject 2 time domain and autospectrum results for the Full System Prototype.
The ECG results varied from the prototype. The autospectrum results for the ECG show two frequencies
at 0.2 and 1 Hz. The time and frequency domain results from the ECG can be seen below in Figure 4-8.
Figure 4-8. Subject 2 time domain and autospectrum results for the ECG.
0 10 20 30 40 50 60-0.2
-0.1
0
0.1
0.2
time (sec)
voltage (
V)
Full System Prototype Signal
0 1 2 3 4 5 6 7 8 9 100
0.5
1
1.5
2x 10
-3
freq (Hz)
am
plit
ude
2 /
2 (
V2)
Full System Prototype Autospectrum
0 10 20 30 40 50 60-0.5
0
0.5
time (sec)
voltage (
V)
ECG Signal
0 1 2 3 4 5 6 7 8 9 100
1
2
x 10-3
freq (Hz)
am
plit
ude
2 /
2 (
V2)
ECG Autospectrum

56
The autospectrum results suggest that the two devices were picking up the same respiratory rate,
however the heart rate was not clear. As with subject 4, the coherence plot will show the true test of
the relationship between the prototype output and the ECG output. The coherence plot for subject 2’s
pressure transducer and ECG results is seen below in Figure 4-9.
Figure 4-9. Subject 2 coherence function results between the Full System Prototype and the ECG.
The coherence plot shows a coherence of 0.8662 at 0.1 Hz. However, beyond that there were no areas
of coherence that even approached the 0.9 limit. At the 1 Hz, where one would expected there to be
high coherence between the prototype and the ECG, the coherence was 0.1462. This means that this
subject’s results had a high coherence at the frequency range matching that of the respiratory rate.
However, there was very low coherence at the frequency matching that of the heart rate.
The rest of the data results varied between those of subjects 4 and 2. Every set of data results
showed that respiratory signal could be detected using the pressure transducer device. Table 7 shows
the coherence result at the expected respiratory frequencies for each subject.
0 1 2 3 4 5 6 7 8 9 100
0.1
0.2
0.3
0.4
0.5
0.6
0.7
0.8
0.9
1
freq (Hz)
Cohere
nce
Coherence Function
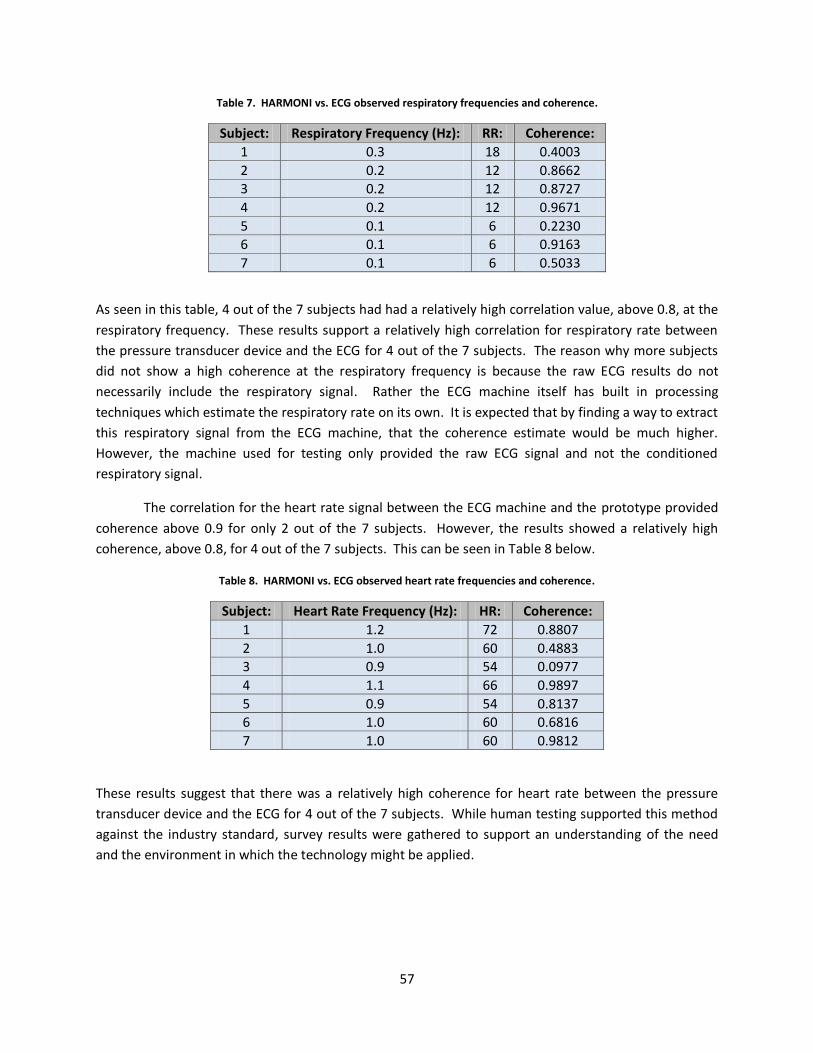
57
Table 7. HARMONI vs. ECG observed respiratory frequencies and coherence.
Subject: Respiratory Frequency (Hz): RR: Coherence:
1 0.3 18 0.4003
2 0.2 12 0.8662
3 0.2 12 0.8727
4 0.2 12 0.9671
5 0.1 6 0.2230
6 0.1 6 0.9163
7 0.1 6 0.5033
As seen in this table, 4 out of the 7 subjects had had a relatively high correlation value, above 0.8, at the
respiratory frequency. These results support a relatively high correlation for respiratory rate between
the pressure transducer device and the ECG for 4 out of the 7 subjects. The reason why more subjects
did not show a high coherence at the respiratory frequency is because the raw ECG results do not
necessarily include the respiratory signal. Rather the ECG machine itself has built in processing
techniques which estimate the respiratory rate on its own. It is expected that by finding a way to extract
this respiratory signal from the ECG machine, that the coherence estimate would be much higher.
However, the machine used for testing only provided the raw ECG signal and not the conditioned
respiratory signal.
The correlation for the heart rate signal between the ECG machine and the prototype provided
coherence above 0.9 for only 2 out of the 7 subjects. However, the results showed a relatively high
coherence, above 0.8, for 4 out of the 7 subjects. This can be seen in Table 8 below.
Table 8. HARMONI vs. ECG observed heart rate frequencies and coherence.
Subject: Heart Rate Frequency (Hz): HR: Coherence:
1 1.2 72 0.8807
2 1.0 60 0.4883
3 0.9 54 0.0977
4 1.1 66 0.9897
5 0.9 54 0.8137
6 1.0 60 0.6816
7 1.0 60 0.9812
These results suggest that there was a relatively high coherence for heart rate between the pressure
transducer device and the ECG for 4 out of the 7 subjects. While human testing supported this method
against the industry standard, survey results were gathered to support an understanding of the need
and the environment in which the technology might be applied.
58
4.2.2 IRB Explorative Survey
The surveys were distributed using several different resources, including the VT Rescue squad,
and the EMT’s at Carilion Roanoke Memorial Hospital. The results from VT Rescue are presented in this
report. There were some notable trends in these results that should be pointed out.
VT Rescue’s survey results provided broad perspectives. Firstly, there were fourteen survey’s
completed through VT Rescue. Those who participated had career lengths varying anywhere from a few
months to eight years. The average career length of the participants was 3 years. 42.86% had
responded to a mass casualty situation. By definition a mass casualty situation is usually one in which
the number of patients outweighs the resources of the responders. Many responded to MCI’s such as at
football games where up to a hundred patients require monitoring. Meanwhile, others responded to
car accidents and some to more threatening incidents. Of those that participated, every single one
answered that detecting heart rate was often times difficult. The difficulty measuring heart rate was
sometimes a result of the type of injury, while other times it was due to the body type of the patient.
71.43% of the participants said that having a deployable chest strap that wirelessly monitored
multiple patients simultaneously would be considered a worthwhile technology, if certain conditions
were met. The most common condition was that the device not be expensive. Several of the secondary
comments concerned sanitation, privacy of the patient, and in what way it would be implemented in to
their response environment. The complete collection of survey results can be seen in Appendix E:
Results under IRB Survey Results.
4.3 Discussion
With all of the results shown simulated testing and human testing, it is important to discuss the
implications that come with those results. Firstly, how does this technology compare to the industry
standard technologies that exist? Secondly, how would the technology be implemented in the real
world? A discussion of what needs to change, and the assumptions made prior to real world
implementation, is required.
4.3.1 Comparison of Current Technologies with HARMONI
As seen in the simulation results, the device was capable of accurately estimating respiratory
rate on a simulated breathing mannequin. In addition, the human testing results showed that the
prototype was capable of detecting the same heart rate signal as an industry standard ECG. While an
ECG can provide a complex analysis of the human heart, the pressure transducer device only provides
heart rate. However, an ECG is time consuming and expensive, while the pressure transducer device is
rapidly deployable and inexpensive. These are the tradeoffs that make the pressure transducer device
ideal for mass casualty situations.
There are several areas that require further research. Firstly, signal processing techniques used
to condition the data might be implemented such that the estimation of heart and respiratory rates
could be done on the board itself. Secondly, how do body weight and gender affect the usefulness of
59
this technology? It would be expected that a larger subject pool, with a random sample, would provide
incite in to how these factors affect the results. Despite the need for further research, it has been
shown that the prototype was capable of showing high coherence with the ECG results at the expected
frequency range of both heart and respiratory rate. The fact that only a few of the subjects showed high
coherence for both heart and respiratory rate, suggests that further testing, research, and development
is needed to ensure that the device is more reliable regardless of which subject is being tested.
4.3.2 Application of HARMONI in the Real World
The original goal for where this device would be implemented is in a mass casualty situation. As
discussed in the introduction, it is a well accepted rule of thumb that each casualty in a mass casualty
situation should be reevaluated every 5 minutes. Also as seen in the survey results, an EMT usually
allots at least 30 seconds to estimate the heart and respiratory rates of each person. This means that if
the device could be attached to a patient and give accurate readings within at least 30 seconds, then it
would not only provide an initial reading, but it would provide continuous readings over the next 4
minutes and 30 seconds, before that patient should be reevaluated. The tracking of said patient’s vital
signs over the course of minutes, is an unparalleled ability in an MCI, and has the potential to be a life
saving tool. However, there are several assumptions for such an application.
4.3.3 Assumptions for Real World Application
The first assumption of applying this device in the real world is that it is easy to use for the EMT,
such that it would take them less than 30 seconds to apply and get results. A second assumption is that
the device can measure heart and respiratory rates through certain layers of clothing, making it a more
rapidly applied tool than the industry standard ECG. A third assumption would be that the device is
capable of doing all of the signal processing and estimation on the board, without having to send data to
a central processing unit. That being said, a central unit could still gather the estimated heart and
respiratory rates. This will be discussed further in the next chapter on conclusions and future work.
4.4 Summary of Results
The method of using pressure transducers to detect heart and respiratory rate was validated.
Simulated testing revealed that the device was capable of detecting respiratory rate on a
simulated breathing mannequin at 6 different respiratory rates.
A PCB that can be used as a base platform for future work was designed and tested.
Human testing revealed that 4 out of the 7 subjects had respiratory rates observed using the
prototype, which had coherence over 0.9, with the data provided by an ECG machine.
Human testing revealed that 4 out of the 7 subjects had heart rates observed using the
prototype, which had coherence over 0.8, with the data provided by an ECG machine.
Survey results revealed that over 70% of EMT’s recommended that a deployable chest strap for
monitoring patients in a mass casualty situation would be useful if certain conditions were met.

60
Chapter 5: Conclusions and Future Work
This final chapter reviews the results of the study on using pressure transducers for noninvasive
detection of heart and respiratory rate, and how these results can be applied in to mass casualty
situations. All of the results from the feasibility to human testing suggest that the device could be
incorporated in to mass casualty situations to improve patient monitoring. Prior to being implemented
in to such a high risk situation, there must first be further research and testing, as well as several
improvements to the device’s sensors, on board processing, and form factor. This will all be discussed
under the section entitled Future Work. In addition, there are several applications of using pressure
sensors to monitor movement that will also be explored.
5.1 Summary
Creating a new method for heart and respiratory monitoring for emergency response
environments may seem unnecessary at first, when considering the accuracy of current methods.
However, it has been shown that under the time constraints of mass casualty situations, a rapidly
deployable heart and respiratory monitor that can go over clothing and wirelessly monitor multiple
patients would act as a force multiplier for EMT’s. Survey results showed that EMT’s strongly agree with
this statement. It was also shown that using pressure transducers for noninvasive detection of heart
and respiratory rates is an affordable alternative to electrode based methods. When combined with a
wireless transceiver, it would allow a single EMT to monitor multiple casualties simultaneously.
A literature review revealed that pressure sensors have been used to monitor vital signs. Yet,
none of these attempts were targeted towards the mass casualty situation. The contributions of this
research were to show that a single affordable pressure sensor and a small strip of medical tubing could
be combined to create a cheap, durable, and compact vital signs monitor. In addition, a PCB was
developed that would act as a base platform for future pressure transducer based movement sensors.
The results of the testing showed relatively high coherence, above 0.8, between the prototype and the
ECG device for respiratory signals in 4 out of the 7 subjects. Meanwhile the results also showed a
relatively high coherence, above 0.8, between the prototype and the ECG device for heart rate signals in
4 out of the 7 subjects. Such results suggest that there needs to be further research, development, and
testing concerning how the results vary based on the test subject and other factors.
Other contributions include the software basis for operating a Bluetooth based data acquisition
device. Note this was done while simultaneous operation of both an ADC and an LCD screen over the
same I2C bus. Additional contributions, in terms of software, include a sustainable state machine
architecture that allows for sub routines to be added and removed from the program with ease. While
these contributions make a strong foundation for the technology to be incorporated in to mass casualty
situations, there is still much work to be done, and improvements to be made.
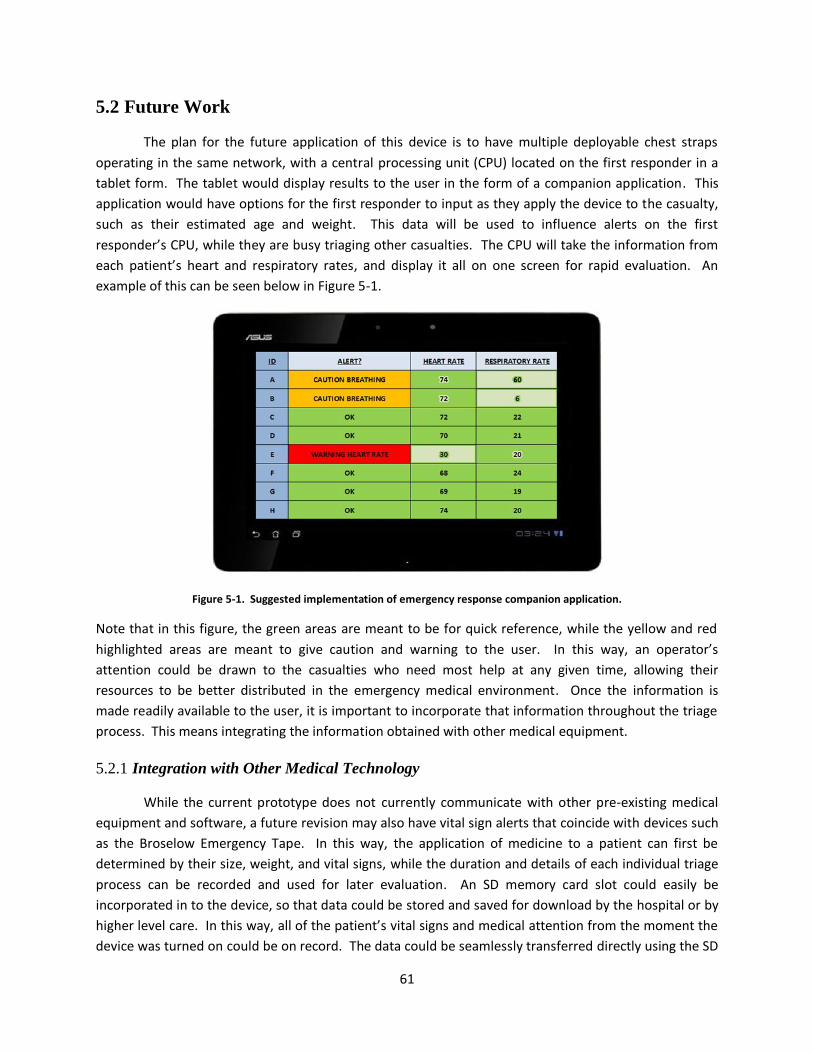
61
5.2 Future Work
The plan for the future application of this device is to have multiple deployable chest straps
operating in the same network, with a central processing unit (CPU) located on the first responder in a
tablet form. The tablet would display results to the user in the form of a companion application. This
application would have options for the first responder to input as they apply the device to the casualty,
such as their estimated age and weight. This data will be used to influence alerts on the first
responder’s CPU, while they are busy triaging other casualties. The CPU will take the information from
each patient’s heart and respiratory rates, and display it all on one screen for rapid evaluation. An
example of this can be seen below in Figure 5-1.
Figure 5-1. Suggested implementation of emergency response companion application.
Note that in this figure, the green areas are meant to be for quick reference, while the yellow and red
highlighted areas are meant to give caution and warning to the user. In this way, an operator’s
attention could be drawn to the casualties who need most help at any given time, allowing their
resources to be better distributed in the emergency medical environment. Once the information is
made readily available to the user, it is important to incorporate that information throughout the triage
process. This means integrating the information obtained with other medical equipment.
5.2.1 Integration with Other Medical Technology
While the current prototype does not currently communicate with other pre-existing medical
equipment and software, a future revision may also have vital sign alerts that coincide with devices such
as the Broselow Emergency Tape. In this way, the application of medicine to a patient can first be
determined by their size, weight, and vital signs, while the duration and details of each individual triage
process can be recorded and used for later evaluation. An SD memory card slot could easily be
incorporated in to the device, so that data could be stored and saved for download by the hospital or by
higher level care. In this way, all of the patient’s vital signs and medical attention from the moment the
device was turned on could be on record. The data could be seamlessly transferred directly using the SD
62
card or by using the Bluetooth technology and a simple .exe file placed on the user’s computer station.
Besides integrating the device with other medical equipment, the device itself can see improvements as
the project moves towards implementation. This begins with one of the most variable factors in the
device, the bladder and tubing configuration.
5.2.2 Manufacturing a Custom Bladder
While human testing showed that the current configuration of the pressure transducer proved
to be sufficient. There was no evidence to suggest it is the best bladder configuration. In fact, the
device likely had difficulty detecting the heart rate in some subjects, due to the bladder configuration.
One would suspect that a flatter bladder with a wider area, would allow for a higher sensitivity on a
greater number of individuals. Physically, this can be proven considering the change in surface area. A
larger contact area between the bladder and the subject’s chest will create a larger observed change in
volume, and hence pressure. This new form factor could be realistically achieved by approaching a
plastics company, such as Plastics One® in Roanoke. This company specializes in custom medical
equipment, and would be capable of manufacturing a wider, flatter, bladder, with a nozzle attachment
for the pressure transducer. Assuming that the bladder can be improved, the next set of improvements
would be the on board sensors.
5.2.3 Improvement of Sensors and Chips
There are several on board sensors that can be reevaluated for improvement. These include the
Bluetooth antenna, the ADC, the LCD screen, and most importantly the pressure transducer. Firstly, the
Bluetooth antenna’s range could be improved by replacing it all together with a broader ranging
antenna. The ADC could be improved by finding an alternative ADC with the same precision but a higher
reference voltage. A higher resolution as previously discussed would allow the smaller changes in
pressure due to heart rate to be more easily detected. This could be accomplished by finding an ADC
with a reference voltage above the current 1.25 V, while still having 16 bit precision and 3 V supply
voltage. The current LCD screen accomplished all of the objectives laid out for the full system prototype.
However, even it could be improved by incorporating a programmable dimming circuit. In this way the
LCD screen could be dimmed just like any other smart device.
Finally, the pressure transducer is perhaps the most critical sensor, when considering the whole
system, which could be improved. While there was no comparable device that had a 3 V operating
range, was affordable, and had more than 600 mV/kPa sensitivity, this does not mean that a better
sensor will not come along. Higher sensitivities would mean changes to the data acquisition circuit. Any
future changes, should follow the steps outlined in section 3.3.6 Circuit Design. Assuming that the
sensors and chips could be improved, the algorithm used to estimate the heart and respiratory rates
should be integrated in to the board itself.
5.2.4 On Board Heart and Respiratory Rate Detection
While almost all of the signal processing done in this research has been done post data
collection. The integration of the technology in to a mass casualty situation requires near real time
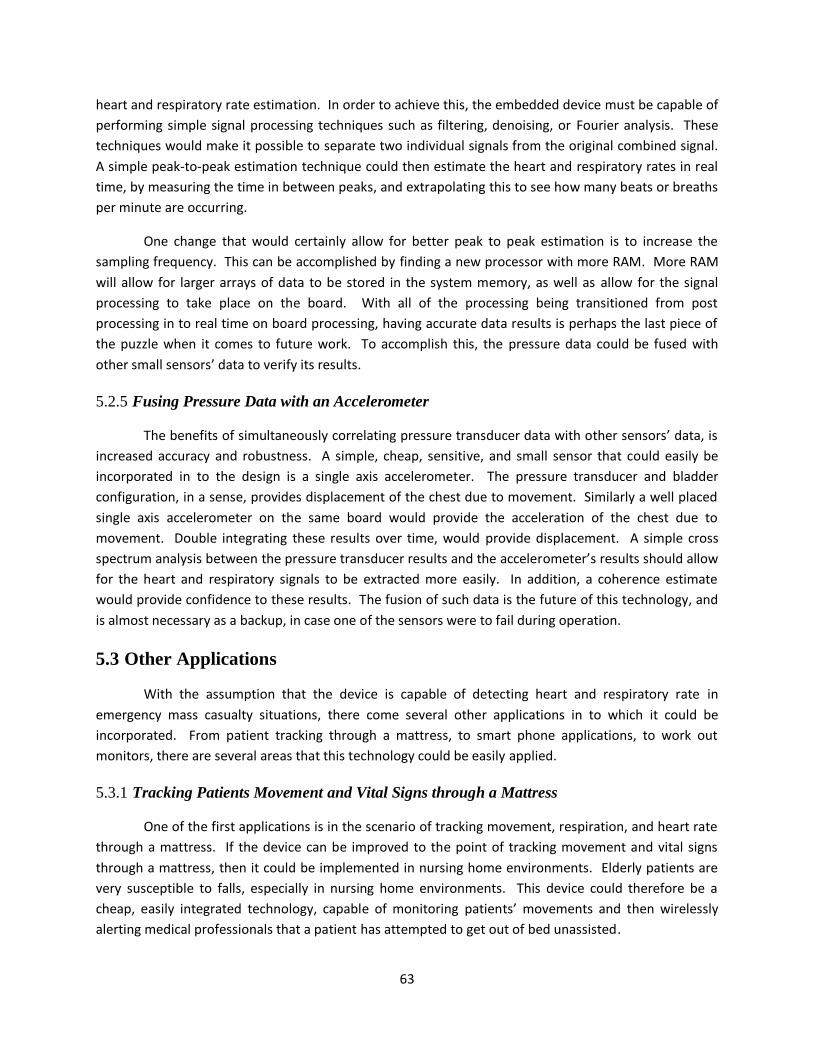
63
heart and respiratory rate estimation. In order to achieve this, the embedded device must be capable of
performing simple signal processing techniques such as filtering, denoising, or Fourier analysis. These
techniques would make it possible to separate two individual signals from the original combined signal.
A simple peak-to-peak estimation technique could then estimate the heart and respiratory rates in real
time, by measuring the time in between peaks, and extrapolating this to see how many beats or breaths
per minute are occurring.
One change that would certainly allow for better peak to peak estimation is to increase the
sampling frequency. This can be accomplished by finding a new processor with more RAM. More RAM
will allow for larger arrays of data to be stored in the system memory, as well as allow for the signal
processing to take place on the board. With all of the processing being transitioned from post
processing in to real time on board processing, having accurate data results is perhaps the last piece of
the puzzle when it comes to future work. To accomplish this, the pressure data could be fused with
other small sensors’ data to verify its results.
5.2.5 Fusing Pressure Data with an Accelerometer
The benefits of simultaneously correlating pressure transducer data with other sensors’ data, is
increased accuracy and robustness. A simple, cheap, sensitive, and small sensor that could easily be
incorporated in to the design is a single axis accelerometer. The pressure transducer and bladder
configuration, in a sense, provides displacement of the chest due to movement. Similarly a well placed
single axis accelerometer on the same board would provide the acceleration of the chest due to
movement. Double integrating these results over time, would provide displacement. A simple cross
spectrum analysis between the pressure transducer results and the accelerometer’s results should allow
for the heart and respiratory signals to be extracted more easily. In addition, a coherence estimate
would provide confidence to these results. The fusion of such data is the future of this technology, and
is almost necessary as a backup, in case one of the sensors were to fail during operation.
5.3 Other Applications
With the assumption that the device is capable of detecting heart and respiratory rate in
emergency mass casualty situations, there come several other applications in to which it could be
incorporated. From patient tracking through a mattress, to smart phone applications, to work out
monitors, there are several areas that this technology could be easily applied.
5.3.1 Tracking Patients Movement and Vital Signs through a Mattress
One of the first applications is in the scenario of tracking movement, respiration, and heart rate
through a mattress. If the device can be improved to the point of tracking movement and vital signs
through a mattress, then it could be implemented in nursing home environments. Elderly patients are
very susceptible to falls, especially in nursing home environments. This device could therefore be a
cheap, easily integrated technology, capable of monitoring patients’ movements and then wirelessly
alerting medical professionals that a patient has attempted to get out of bed unassisted.

64
Similarly it could provide a less invasive method for sleep monitoring, allowing a person to
experience a more natural sleep environment without the respiratory impedance sensors and electrode
based methods having to be used to track their vital signs. These sensors are often cumbersome and
take away from the whole idea of sleep evaluation, because the people who are being studied are not
used to being attached to such sensors in their normal sleep environment. A wireless monitor placed
under the mattress would therefore be a worthwhile alternative that would in turn provide a more
wholesome and normal sleep experience.
5.3.2 Creating a Smartphone Application for Every Day Use
Another application of the technology is to provide the everyday consumer with a method for
monitoring their heart and respiratory rates. To do this, a smart phone application that could observe
the results from the pressure sensor device would be ideal. Such an application would allow the smart
phone to read information over Bluetooth, from the device, over an extended period of time. This
information could then be displayed such that the user could see their vital signs tracked over the
course of a day. In addition, the application could provide alerts based on abnormal results.
5.3.3 Creating Noninvasive and Waterproof Exercise Monitor
Along the same lines as the smart phone application, would be the implementation of this
device in to a mobile workout monitor. Many of the electrode based workout monitors give accurate
results for a short amount of time. The drawbacks begin when the ECG leads irritate the user’s skin, or
detract from the runner’s usual stride, or the results are skewed by sweat and water buildup around the
leads. A waterproof chest strap monitor that requires low levels of pressure against the runner’s chest
might be the answer to all of these issues. Being able to filter out all of the extraneous movement
artifacts that occur during exercise would be an issue in implementing this device. However,
understanding such an issue would also improve the original application of monitoring vital signs in a
mass casualty situation, where indeed extraneous movement artifacts would also be present.

65
References
1. E. Brooke Lerner, P., Richard B. Schwartz, MD, Phillip L. Coule, MD, et al., Mass Casualty Triage: An Evaluation of the Data and Development of a Proposed National Guideline. Disaster and Public Health Preparedness, 2008. 2(1): p. 10.
2. Moises Rivera-Ruiz, C.C., and Joseph Varon, Einthoven's String Galvanometer. Texas Heart Institute Journal, 2008. 35: p. 174-148.
3. Wellens, H.J., Advances in Arrhythmia and Electrophysiology: Forty Years of Invasive Clinical Electrophysiology: 1967-2007.
4. Steven Kang, M., ECG, in UMMC Encyclopedia 2009, University of Maryland Medical Center: Baltimore, MD.
5. Baseline Vital Signs and SAMPLE History. 2011 [cited 2012 June 12]; Available from: http://www.emtsource.org/blvs.php.
6. Middleton, T.A. Managing a Mass Casualty Incident: A Military Medic's Perspective. 2010. 7. Ngoc, T.V., Medical Applications of Wireless Networks, 2008. 8. Mirna M Farah, M. Pediatric Tachycardia. 2008 [cited 2012 June 12]. 9. Wagner, G.S., Marriott's Practical Electrocardiography (Eleventh Edition)2008, Philadelphia, PA:
Lippincott Williams & Wilkins. 468. 10. Anna Karilainen, S.H., Jörg Müller, Dry and Capacitive Electrodes for Long-Term ECG-Monitoring,
in 8th Annual Workshop on Semiconductor Advances2005. p. 155-161. 11. Euan A Ashley, J.N., Cardiology Explained 2004, London, UK. 12. Mobile Cardiac Monitoring: Bluetooth ECG and Activity Monitor, 2008, Alive Technologies:
Queensland, Australia. 13. Chulsung Park, P.H.C. An Ultra-Wearable, Wireless, Low Power ECG Monitoring System. in IEEE
BioCAS. 2006. London, UK. 14. Measuring Respiration Using the Cardio-Respiratory Belt, 2005, TMS International. 15. Respiration Monitor Belt, 2010, Vernier. 16. John W. Severinghaus, Y.H., History of Blood Gas Analysis VII Pulse Oximetry. Journal of Clinical
Monitoring, 1987. 3(2): p. 135-138. 17. Jaime M. Lee, F.P., Andrew D. Hibbs, Robert Matthews, Craig Morrissette, Evaluation of a
Capacitively-Coupled, Non-Contact (through Clothing) Electrode or ECG Monitoring and Life Signs Detection for the Objective Force Warfighter, in Combat Casualty Care in Ground Based Tactical Situations: Trauma Technology and Emergency Medical Procedures2004: St. Pete Beach, USA.
18. Ford Unveils Contactless ECG Sensing Driver, in Medgadget2011. 19. Yu Mike Chi, Y.-P.J., Gert Cauwenberghs, Dry-Contact and Noncontact Biopotential Electrodes:
Methodological Revie. IEEE Reviews in Biomedical Engineering, 2010. 3(1): p. 106-119. 20. Yosuke Kurihara, K.W., Development of Sensing Device to Detect Persons Hiding in a Car. IEEE
Sensors Journal, 2011. 11(9). 21. Eugene Braunwald, D.P.Z., Peter Libby, ed. Heart Disease: a Textbook of Cardiovascular
Medicine. ed. R. Zorab2001, W. B. Saunders Company: USA. 22. Dany Obeid, S.S., Gheorghe Zaharia, Ghais El Zein, Noncontact Heartbeat Detection at 2.4, 5.8,
and 60 GHz: A Comparitive Study. Microwave and Optical Technology Letters, 2008. 51(3): p. 666 - 669.
23. Baker, B. Using Single Supply Operational Amplifiers in Embedded Systems. Microchip, 2000. 24. Smith, S.W., The Scientist and Engineer's Guide to Digital Signal Processing2009: dspguide.com.
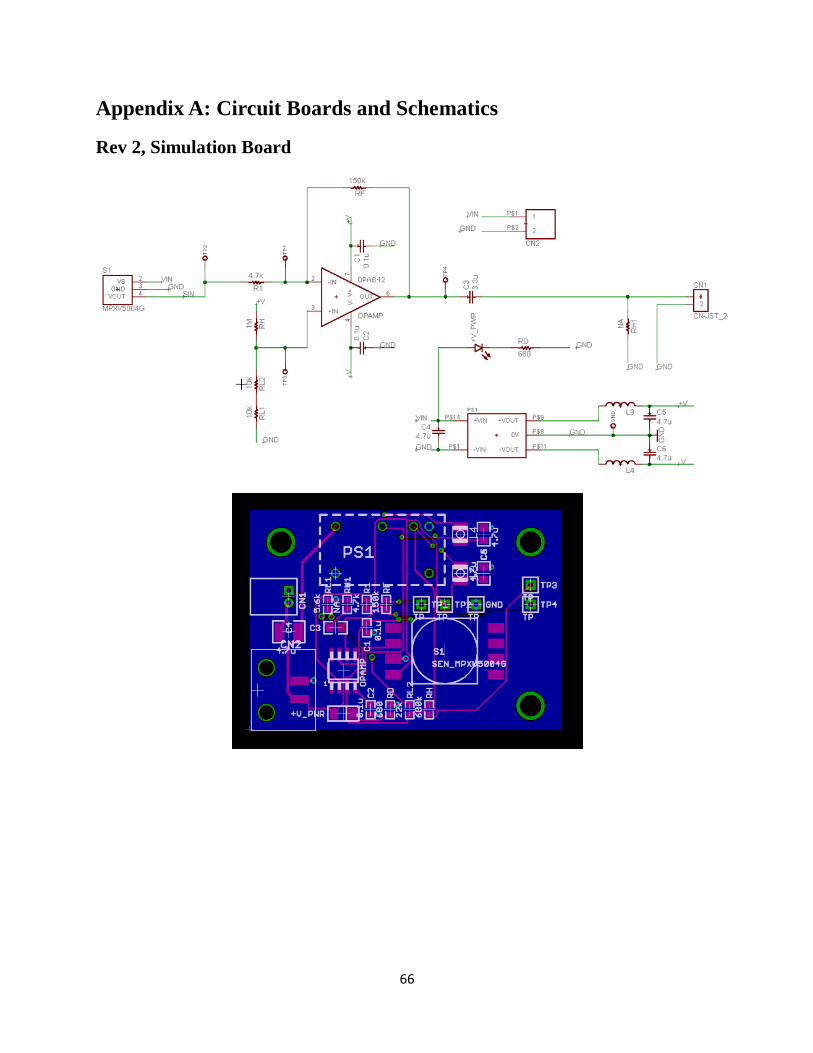
66
Appendix A: Circuit Boards and Schematics
Rev 2, Simulation Board
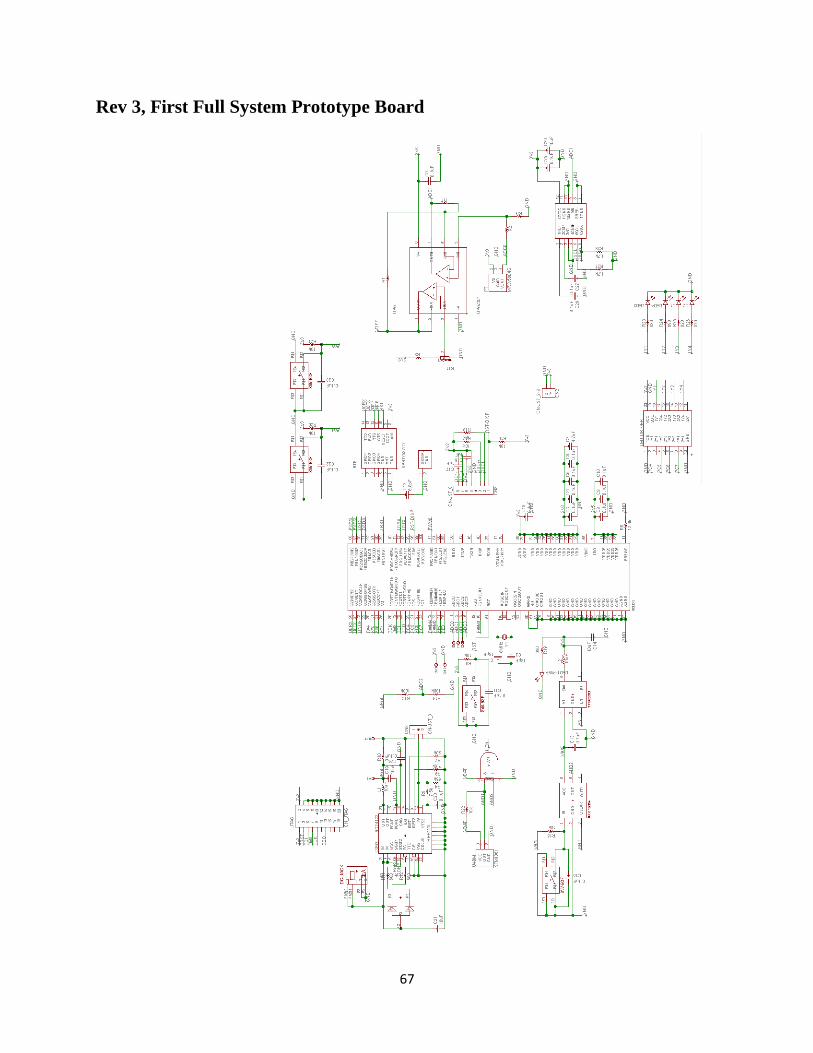
67
Rev 3, First Full System Prototype Board
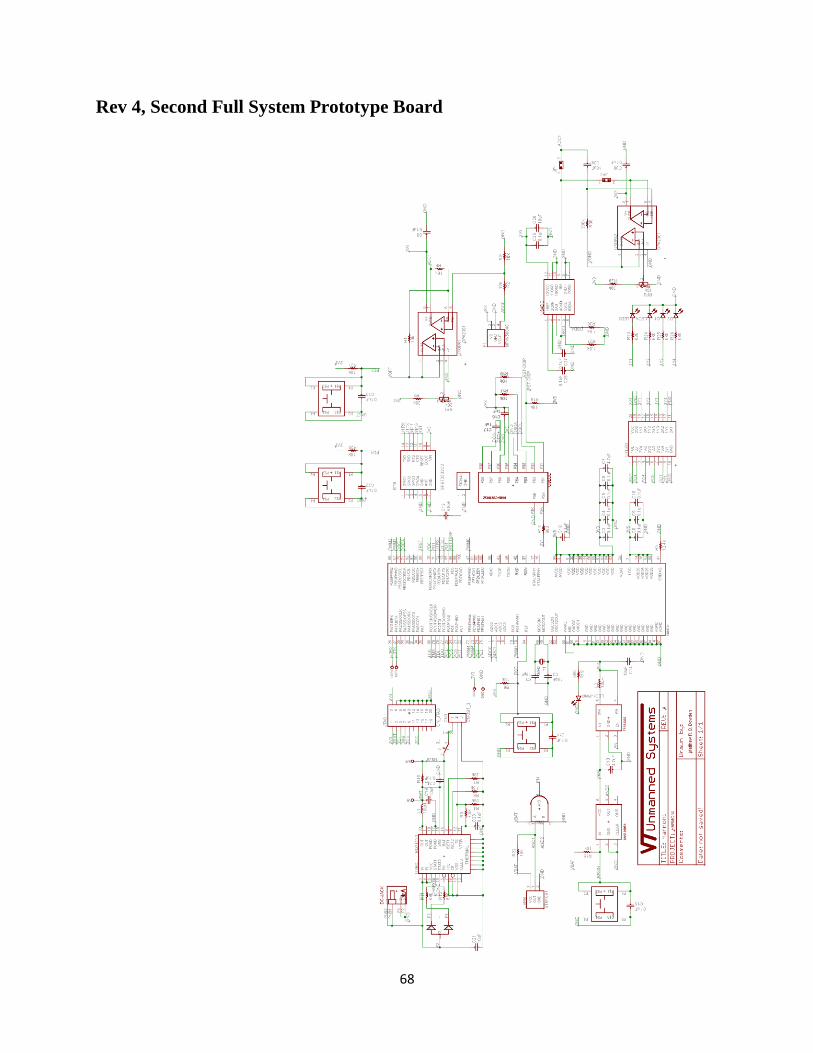
68
Rev 4, Second Full System Prototype Board

69
Appendix B: MATLAB Code
MATLAB Code for Feasibility Results
clc clear all close all
%% import the data data = importdata('feasibility_5.txt'); null = importdata('feasibility_0.txt');
%% define a window, such as 30 seconds x = data((length(data)-3100):(length(data)-100)); y = null((length(null)-3100):(length(null)-100));
%% normalize the data x = x - mean(x); y = y - mean(y);
%% define parameters, time and frequency domain Fs = 100; % Sampling frequency Nyq = Fs/2; % Nyquist frequency T = 1/Fs; % Sample time
Lx = length(x); % Length of signal x Ly = length(y); % Length of signal y
tx = 0:1/Fs:(length(x) - 1)/Fs; % Time vector rx = (Fs)/Lx; % Frequency Resolution fx = 0:rx:Fs - rx; % Frequency vector up to Fs
%% compute cross spectrums using averaging m = 1; k = 600;
gxx = 0; % auto spectrum x gyy = 0; % auto spectrum y gxy = 0; % cross spectrum x,y gyx = 0; % cross spectrum y,x
while m < Lx - k; gxx = gxx + conj(fft(x(m:m+k-1))).*fft(x(m:m+k-1)); gyy = gyy + conj(fft(y(m:m+k-1))).*fft(y(m:m+k-1)); gxy = gxy + conj(fft(x(m:m+k-1))).*fft(y(m:m+k-1)); gyx = gyx + conj(fft(y(m:m+k-1))).*fft(x(m:m+k-1)); m = m+k; end
gxx = (2*gxx)/k; gyy = (2*gyy)/k;
pxy = unwrap(angle(gxy));

70
gxy = (abs(2*gxy)/k); gyx = (abs(2*gyx)/k);
fa = 0:Fs/length(gxx):Fs - Fs/length(gxx);
%% plot results figure() plot(tx,x) xlabel('time (s)') ylabel('voltage (V)') title('Feasibility Signal')
figure() plot(fa,gxx/Lx) axis([0 Nyq 0 1.15*max(gxx/Lx)]) xlabel('freq (Hz)') ylabel('amplitude^2 / 2 (V^2)') title('Feasibility Autospectrum')
figure() plot(fa,gxx/Lx) axis([0 4 0 1.15*max(gxx/Lx)]) xlabel('freq (Hz)') ylabel('amplitude^2 / 2 (V^2)') title('Feasibility Autospectrum Zoomed')
%% calculate and display the signal to noise ratios [C,I] = max(gxx); snr_r = sqrt(max(gxx(1:I-3)/max(gyy))); snr_r_db = 20*(log10(snr_r));
snr_h = sqrt(max(gxx)/max(gyy)); snr_h_db = 20*(log10(snr_h));
fprintf('SNR for Respiration = %4.3f\n',snr_r); fprintf('SNR for Respiration (dB) = %4.3f dB\n\n',snr_r_db);
fprintf('SNR for Heart Rate = %4.3f\n',snr_h); fprintf('SNR for Heart Rate (dB) = %4.3f dB\n',snr_h_db);

71
MATLAB Code for Simulation Results
clc clear all close all
%% import the data data = importdata('proof_13.txt'); null = importdata('proof_14.txt');
%% choose a window size block = 30; % in seconds block = block*1000; x = data(100:block + 99); y = null(100:block + 99);
%% normalize the data x = x - mean(x); y = y - mean(y); original = x; to = 0:1/1000:(length(original) - 1)/1000;
%% decimate the data d = 10; size = length(x); n = 1;
while n < d + 1; a(n,:) = decimate(x(n:size - d + n),d); b(n,:) = decimate(y(n:size - d + n),d); n = n + 1; end
x = a; y = b; Fs = 1000/d;
%% define parameters Nyq = Fs/2; % Nyquist frequency T = 1/Fs; % Sample time Lx = length(x); % Length of signal tx = 0:1/Fs:(length(x) - 1)/Fs; % Time vector rx = (Fs)/Lx; % Frequency Resolution
Ly = length(y); % Length of signal ty = 0:1/Fs:(length(y) - 1)/Fs; % Time vector ry = (Fs)/Ly; % Frequency Resolution
fx = 0:rx:Fs - rx; % Frequency vector for x fy = 0:ry:Fs - ry; % Frequency vector for y
%% compute cross spectrums using averaging m = 1; k = d;

72
gxx = 0; % auto spectrum x gyy = 0; % auto spectrum y gxy = 0; % cross spectrum x,y gyx = 0; % cross spectrum y,x
fprintf('Averages = %4.3f\n',k);
while m < d; gxx = gxx + conj(fft(x(m,:))).*fft(x(m,:)); gyy = gyy + conj(fft(y(m,:))).*fft(y(m,:)); gxy = gxy + conj(fft(x(m,:))).*fft(y(m,:)); gyx = gyx + conj(fft(y(m,:))).*fft(x(m,:)); m = m+k; end
gxx = (2*gxx)/(size/d); gyy = (2*gyy)/(size/d);
pxy = unwrap(angle(gxy)); gxy = (abs(2*gxy)/(size/d)); gyx = (abs(2*gyx)/(size/d));
fa = 0:Fs/length(gxx):Fs - Fs/length(gxx);
%% plot results figure() plot(to,original) xlabel('time (s)') ylabel('voltage (V)') title('Simulation Signal')
figure() plot(fa,gxx/Lx) axis([0 Nyq 0 1.15*max(gxx/Lx)]) xlabel('freq (Hz)') ylabel('amplitude^2 / 2 (V^2)') title('Simulation Autospectrum')
figure() plot(fa,gxx/Lx) axis([0 4 0 1.15*max(gxx/Lx)]) xlabel('freq (Hz)') ylabel('amplitude^2 / 2 (V^2)') title('Simulation Autospectrum Zoomed')
figure() subplot(2,1,1) plot(to,original) xlabel('time (s)') ylabel('voltage (V)') title('Simulation Signal')
subplot(2,1,2) plot(fa,gxx/Lx)

73
axis([0 4 0 1.15*max(gxx/Lx)]) xlabel('freq (Hz)') ylabel('amplitude^2 / 2 (V^2)') title('Simulation Autospectrum Zoomed')
%% calculate and display the signal to noise ratios snr_r = sqrt(max(gxx)/mean(gyy)); snr_r_db = 20*(log10(snr_r));
fprintf('SNR for Respiration = %4.3f\n',snr_r); fprintf('SNR for Respiration (dB) = %4.3f dB\n\n',snr_r_db);
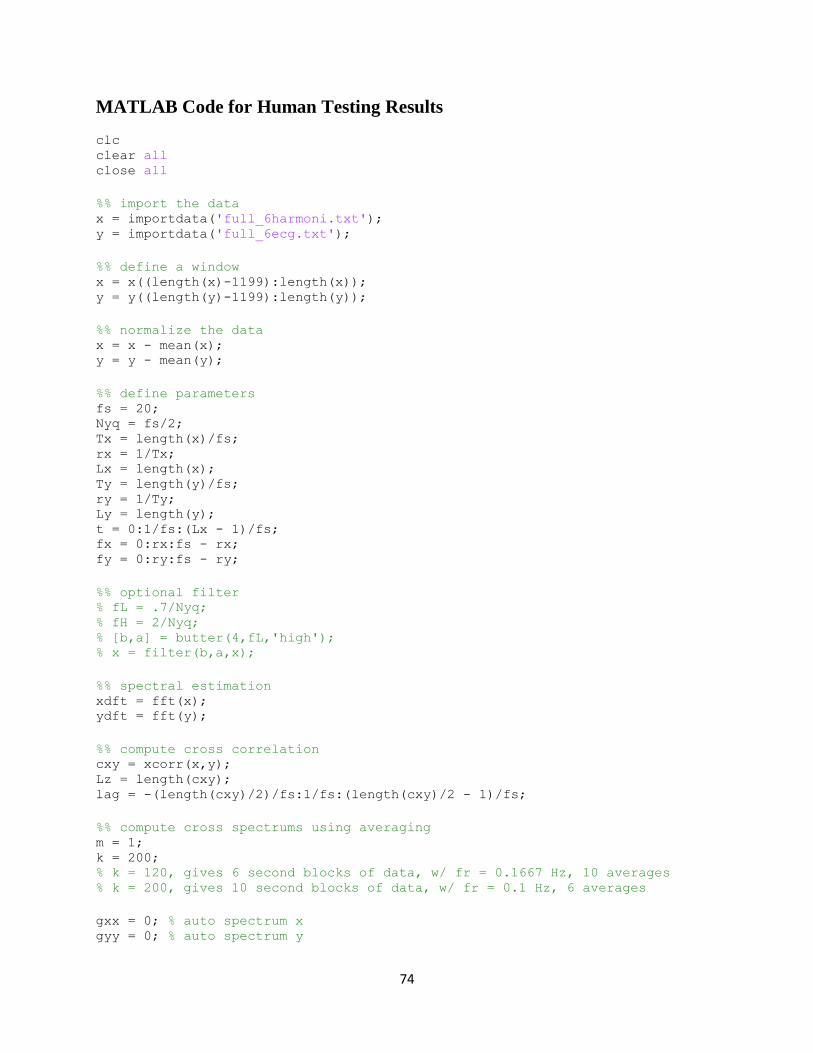
74
MATLAB Code for Human Testing Results
clc clear all close all
%% import the data x = importdata('full_6harmoni.txt'); y = importdata('full_6ecg.txt');
%% define a window x = x((length(x)-1199):length(x)); y = y((length(y)-1199):length(y));
%% normalize the data x = x - mean(x); y = y - mean(y);
%% define parameters fs = 20; Nyq = fs/2; Tx = length(x)/fs; rx = 1/Tx; Lx = length(x); Ty = length(y)/fs; ry = 1/Ty; Ly = length(y); t = 0:1/fs:(Lx - 1)/fs; fx = 0:rx:fs - rx; fy = 0:ry:fs - ry;
%% optional filter % fL = .7/Nyq; % fH = 2/Nyq; % [b,a] = butter(4,fL,'high'); % x = filter(b,a,x);
%% spectral estimation xdft = fft(x); ydft = fft(y);
%% compute cross correlation cxy = xcorr(x,y); Lz = length(cxy); lag = -(length(cxy)/2)/fs:1/fs:(length(cxy)/2 - 1)/fs;
%% compute cross spectrums using averaging m = 1; k = 200; % k = 120, gives 6 second blocks of data, w/ fr = 0.1667 Hz, 10 averages % k = 200, gives 10 second blocks of data, w/ fr = 0.1 Hz, 6 averages
gxx = 0; % auto spectrum x gyy = 0; % auto spectrum y
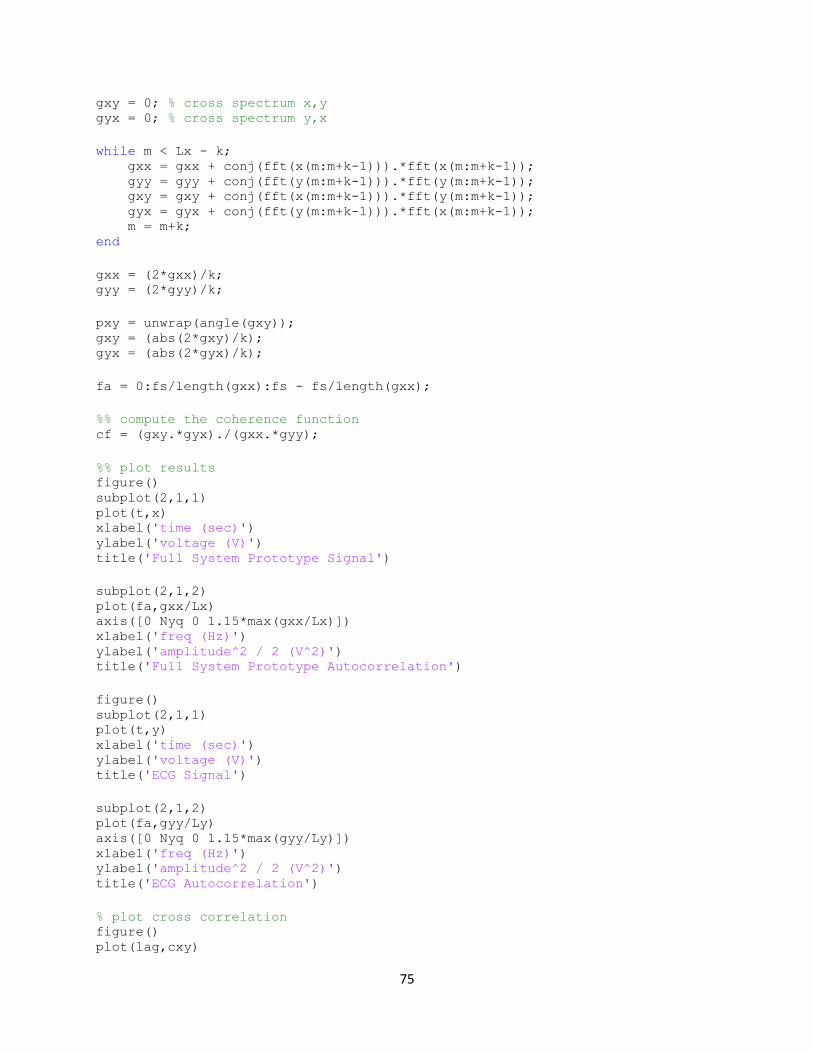
75
gxy = 0; % cross spectrum x,y gyx = 0; % cross spectrum y,x
while m < Lx - k; gxx = gxx + conj(fft(x(m:m+k-1))).*fft(x(m:m+k-1)); gyy = gyy + conj(fft(y(m:m+k-1))).*fft(y(m:m+k-1)); gxy = gxy + conj(fft(x(m:m+k-1))).*fft(y(m:m+k-1)); gyx = gyx + conj(fft(y(m:m+k-1))).*fft(x(m:m+k-1)); m = m+k; end
gxx = (2*gxx)/k; gyy = (2*gyy)/k;
pxy = unwrap(angle(gxy)); gxy = (abs(2*gxy)/k); gyx = (abs(2*gyx)/k);
fa = 0:fs/length(gxx):fs - fs/length(gxx);
%% compute the coherence function cf = (gxy.*gyx)./(gxx.*gyy);
%% plot results figure() subplot(2,1,1) plot(t,x) xlabel('time (sec)') ylabel('voltage (V)') title('Full System Prototype Signal')
subplot(2,1,2) plot(fa,gxx/Lx) axis([0 Nyq 0 1.15*max(gxx/Lx)]) xlabel('freq (Hz)') ylabel('amplitude^2 / 2 (V^2)') title('Full System Prototype Autocorrelation')
figure() subplot(2,1,1) plot(t,y) xlabel('time (sec)') ylabel('voltage (V)') title('ECG Signal')
subplot(2,1,2) plot(fa,gyy/Ly) axis([0 Nyq 0 1.15*max(gyy/Ly)]) xlabel('freq (Hz)') ylabel('amplitude^2 / 2 (V^2)') title('ECG Autocorrelation')
% plot cross correlation figure() plot(lag,cxy)
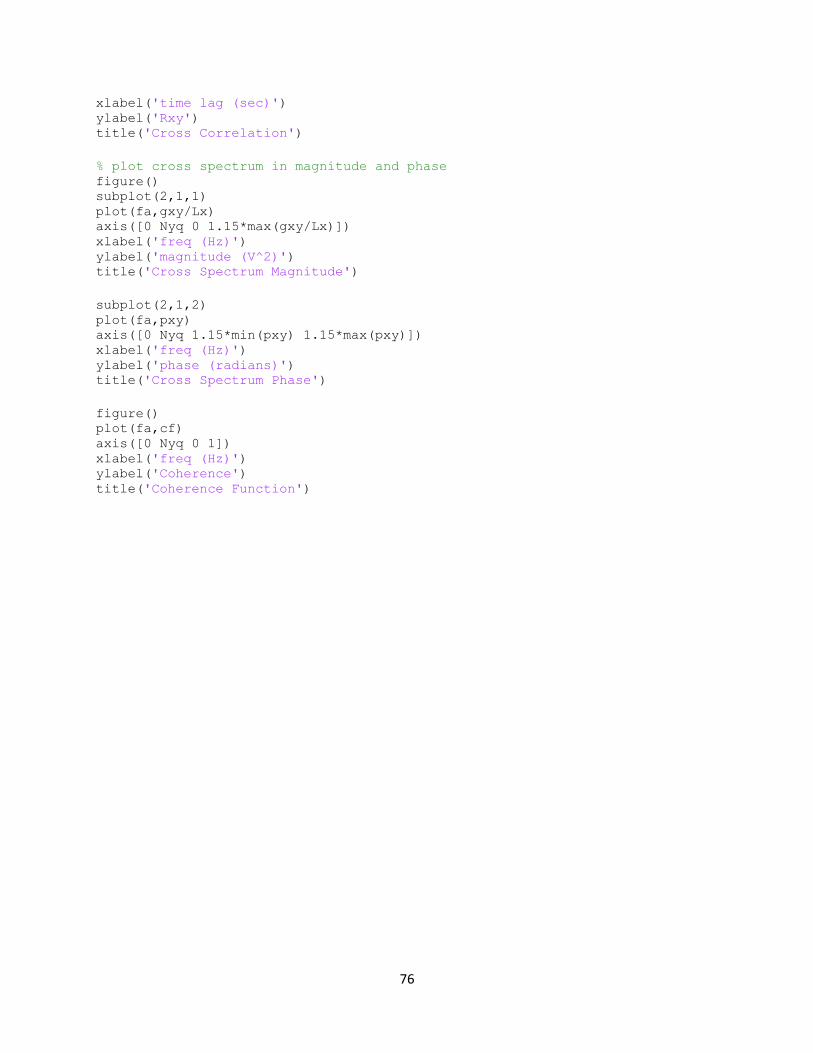
76
xlabel('time lag (sec)') ylabel('Rxy') title('Cross Correlation')
% plot cross spectrum in magnitude and phase figure() subplot(2,1,1) plot(fa,gxy/Lx) axis([0 Nyq 0 1.15*max(gxy/Lx)]) xlabel('freq (Hz)') ylabel('magnitude (V^2)') title('Cross Spectrum Magnitude')
subplot(2,1,2) plot(fa,pxy) axis([0 Nyq 1.15*min(pxy) 1.15*max(pxy)]) xlabel('freq (Hz)') ylabel('phase (radians)') title('Cross Spectrum Phase')
figure() plot(fa,cf) axis([0 Nyq 0 1]) xlabel('freq (Hz)') ylabel('Coherence') title('Coherence Function')
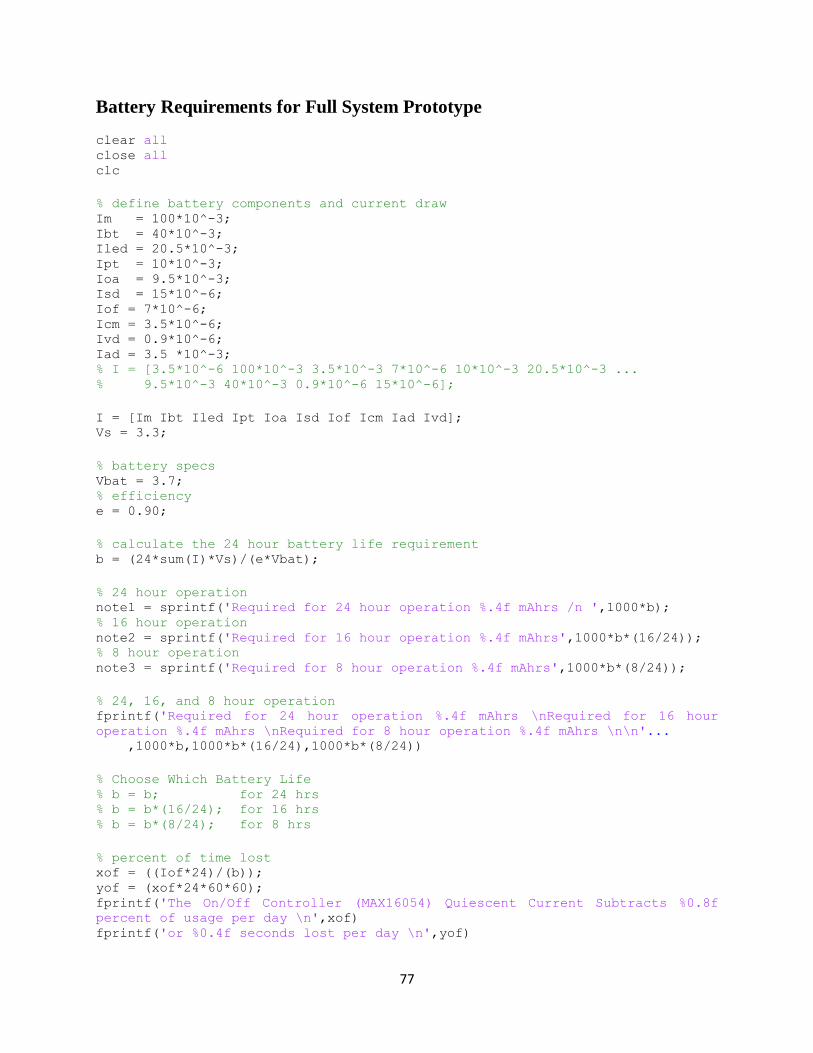
77
Battery Requirements for Full System Prototype
clear all close all clc
% define battery components and current draw Im = 100*10^-3; Ibt = 40*10^-3; Iled = 20.5*10^-3; Ipt = 10*10^-3; Ioa = 9.5*10^-3; Isd = 15*10^-6; Iof = 7*10^-6; Icm = 3.5*10^-6; Ivd = 0.9*10^-6; Iad = 3.5 *10^-3; % I = [3.5*10^-6 100*10^-3 3.5*10^-3 7*10^-6 10*10^-3 20.5*10^-3 ... % 9.5*10^-3 40*10^-3 0.9*10^-6 15*10^-6];
I = [Im Ibt Iled Ipt Ioa Isd Iof Icm Iad Ivd]; Vs = 3.3;
% battery specs Vbat = 3.7; % efficiency e = 0.90;
% calculate the 24 hour battery life requirement b = (24*sum(I)*Vs)/(e*Vbat);
% 24 hour operation note1 = sprintf('Required for 24 hour operation %.4f mAhrs /n ',1000*b); % 16 hour operation note2 = sprintf('Required for 16 hour operation %.4f mAhrs',1000*b*(16/24)); % 8 hour operation note3 = sprintf('Required for 8 hour operation %.4f mAhrs',1000*b*(8/24));
% 24, 16, and 8 hour operation fprintf('Required for 24 hour operation %.4f mAhrs \nRequired for 16 hour
operation %.4f mAhrs \nRequired for 8 hour operation %.4f mAhrs \n\n'... ,1000*b,1000*b*(16/24),1000*b*(8/24))
% Choose Which Battery Life % b = b; for 24 hrs % b = b*(16/24); for 16 hrs % b = b*(8/24); for 8 hrs
% percent of time lost xof = ((Iof*24)/(b)); yof = (xof*24*60*60); fprintf('The On/Off Controller (MAX16054) Quiescent Current Subtracts %0.8f
percent of usage per day \n',xof) fprintf('or %0.4f seconds lost per day \n',yof)

78
xsd = ((Isd*24)/(b)); ysd = (xsd*24*60*60); fprintf('The Step Down (TPS62203) Quiescent Current Subtracts %0.8f percent
of usage per day \n',xsd) fprintf('or %0.4f seconds lost per day \n',ysd)
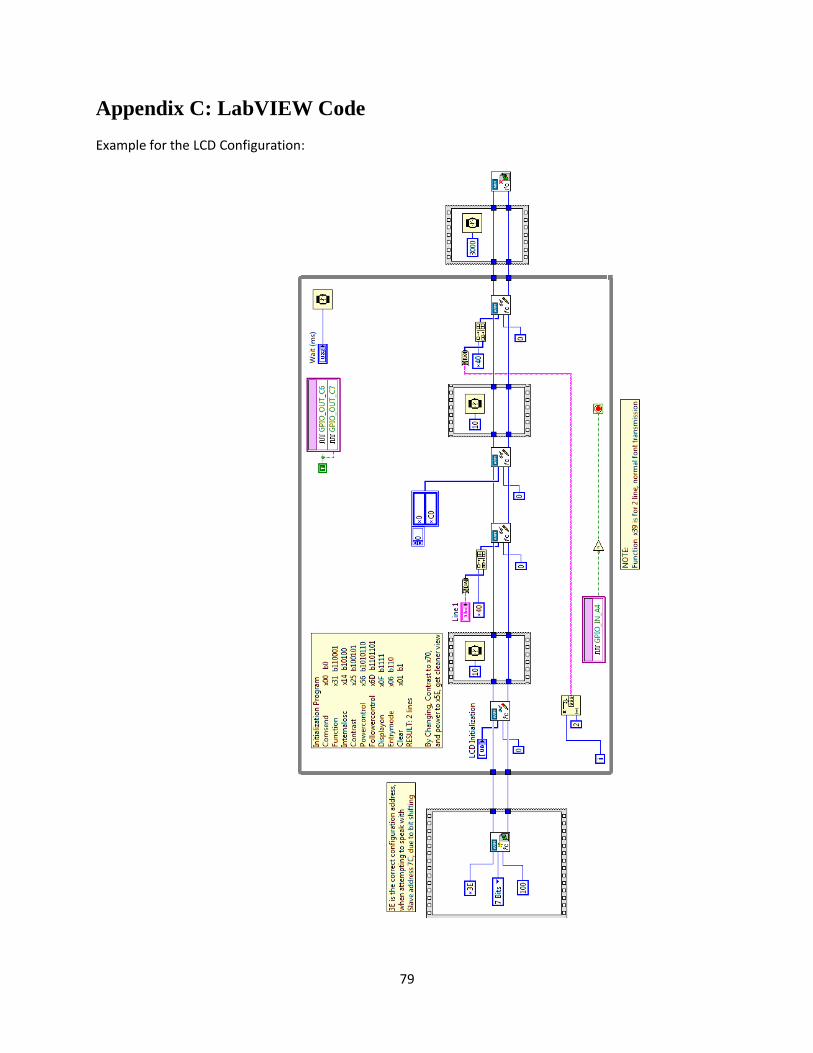
79
Appendix C: LabVIEW Code
Example for the LCD Configuration:
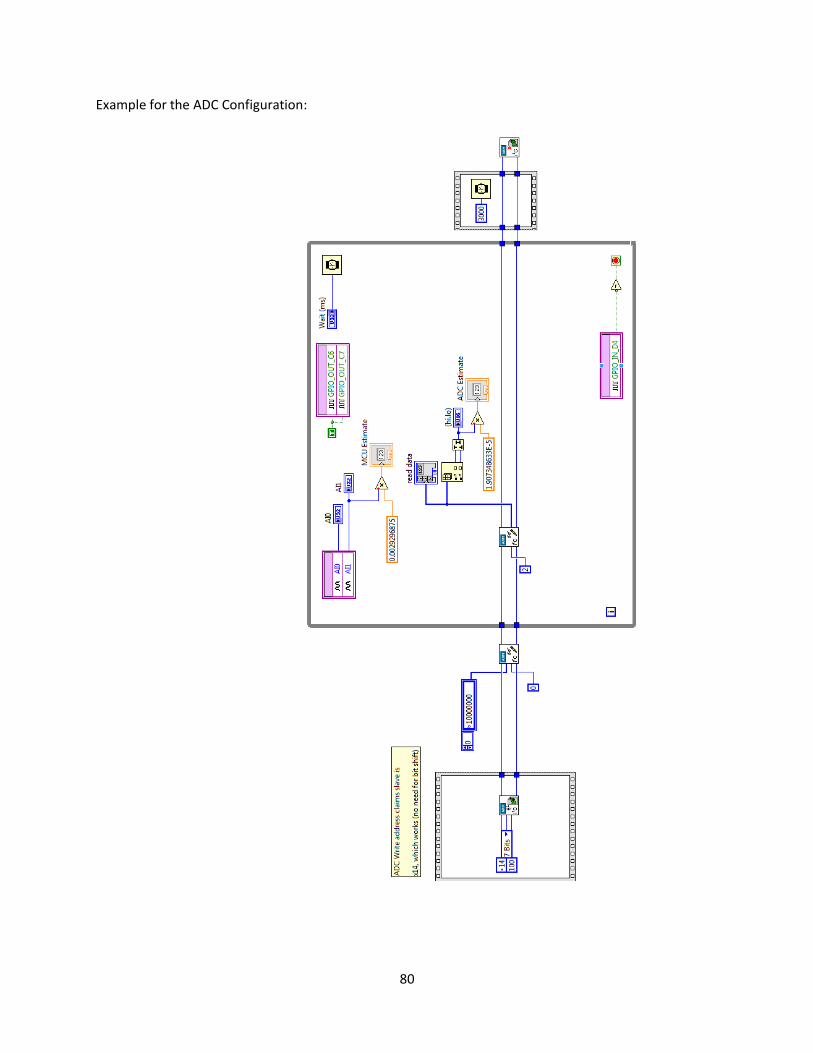
80
Example for the ADC Configuration:
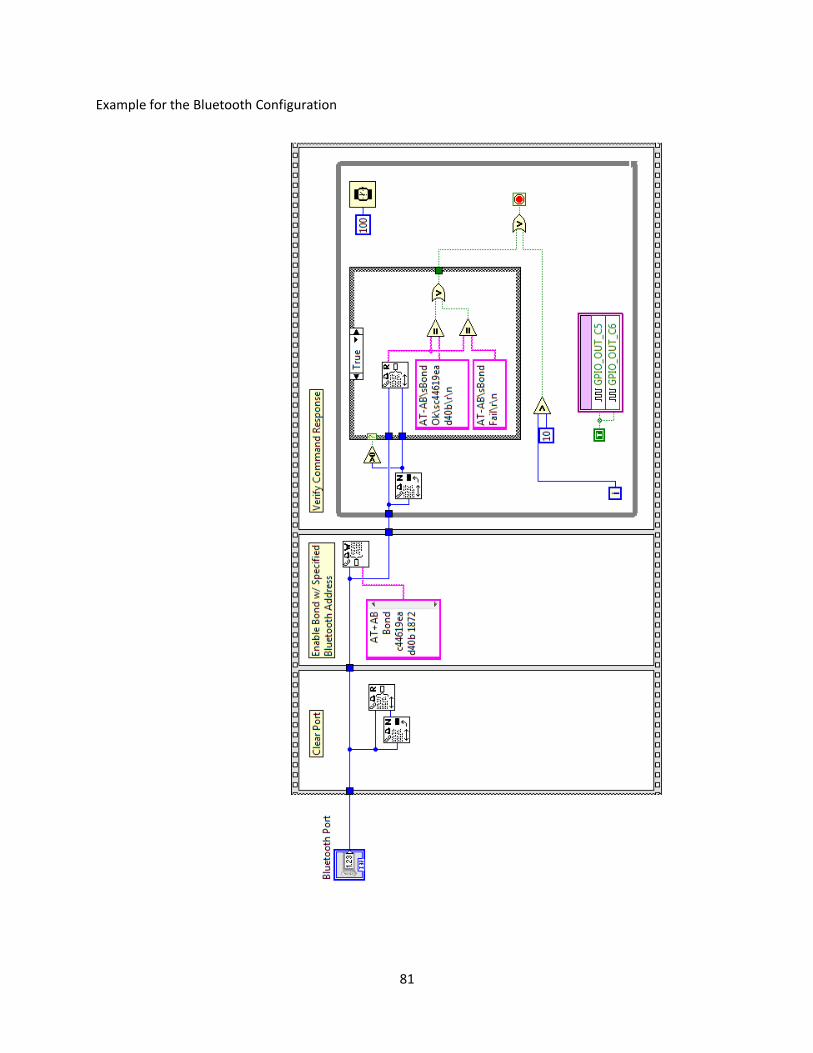
81
Example for the Bluetooth Configuration
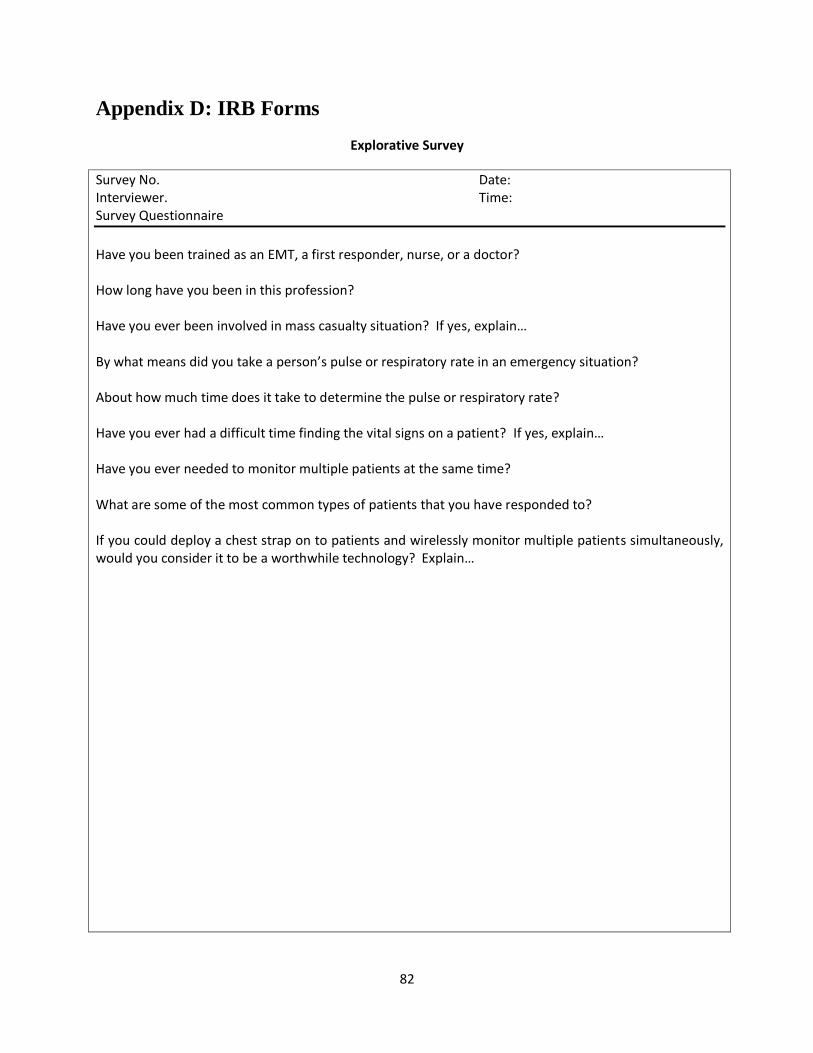
82
Appendix D: IRB Forms
Explorative Survey
Survey No. Date: Interviewer. Time: Survey Questionnaire
Have you been trained as an EMT, a first responder, nurse, or a doctor? How long have you been in this profession? Have you ever been involved in mass casualty situation? If yes, explain… By what means did you take a person’s pulse or respiratory rate in an emergency situation? About how much time does it take to determine the pulse or respiratory rate? Have you ever had a difficult time finding the vital signs on a patient? If yes, explain… Have you ever needed to monitor multiple patients at the same time? What are some of the most common types of patients that you have responded to? If you could deploy a chest strap on to patients and wirelessly monitor multiple patients simultaneously, would you consider it to be a worthwhile technology? Explain…
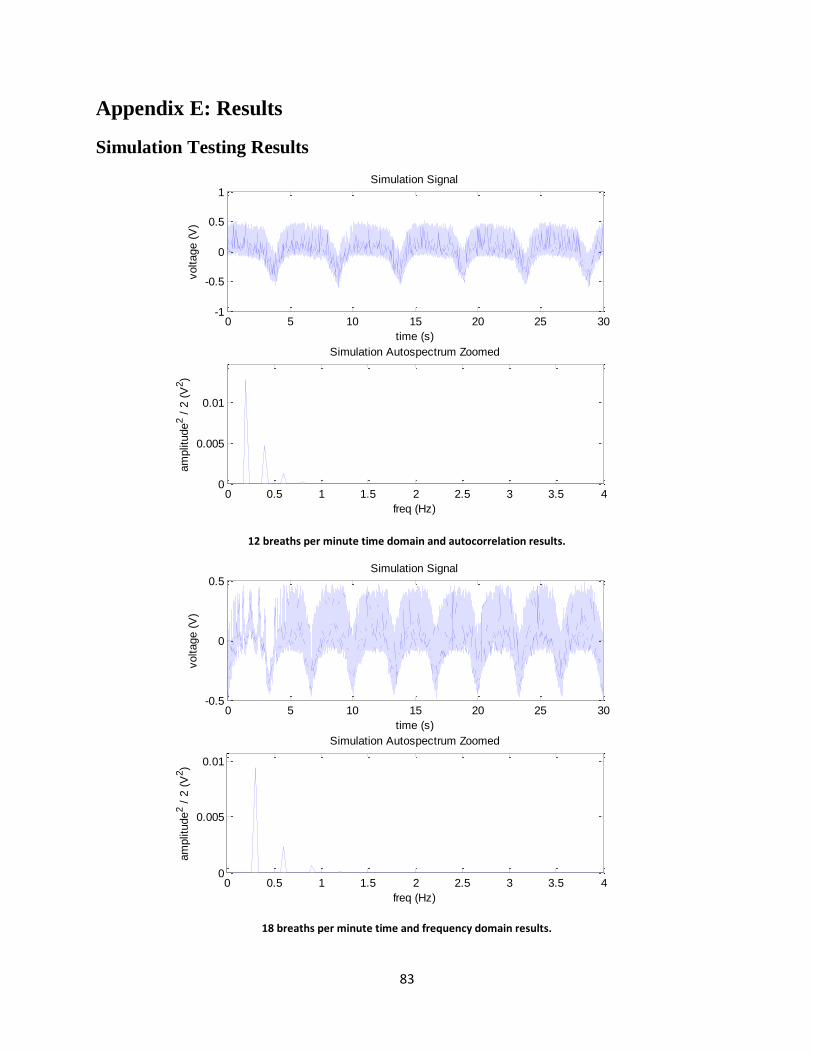
83
Appendix E: Results
Simulation Testing Results
12 breaths per minute time domain and autocorrelation results.
18 breaths per minute time and frequency domain results.
0 5 10 15 20 25 30-1
-0.5
0
0.5
1
time (s)
voltage (
V)
Simulation Signal
0 0.5 1 1.5 2 2.5 3 3.5 40
0.005
0.01
freq (Hz)
am
plit
ude
2 /
2 (
V2)
Simulation Autospectrum Zoomed
0 5 10 15 20 25 30-0.5
0
0.5
time (s)
voltage (
V)
Simulation Signal
0 0.5 1 1.5 2 2.5 3 3.5 40
0.005
0.01
freq (Hz)
am
plit
ude
2 /
2 (
V2)
Simulation Autospectrum Zoomed
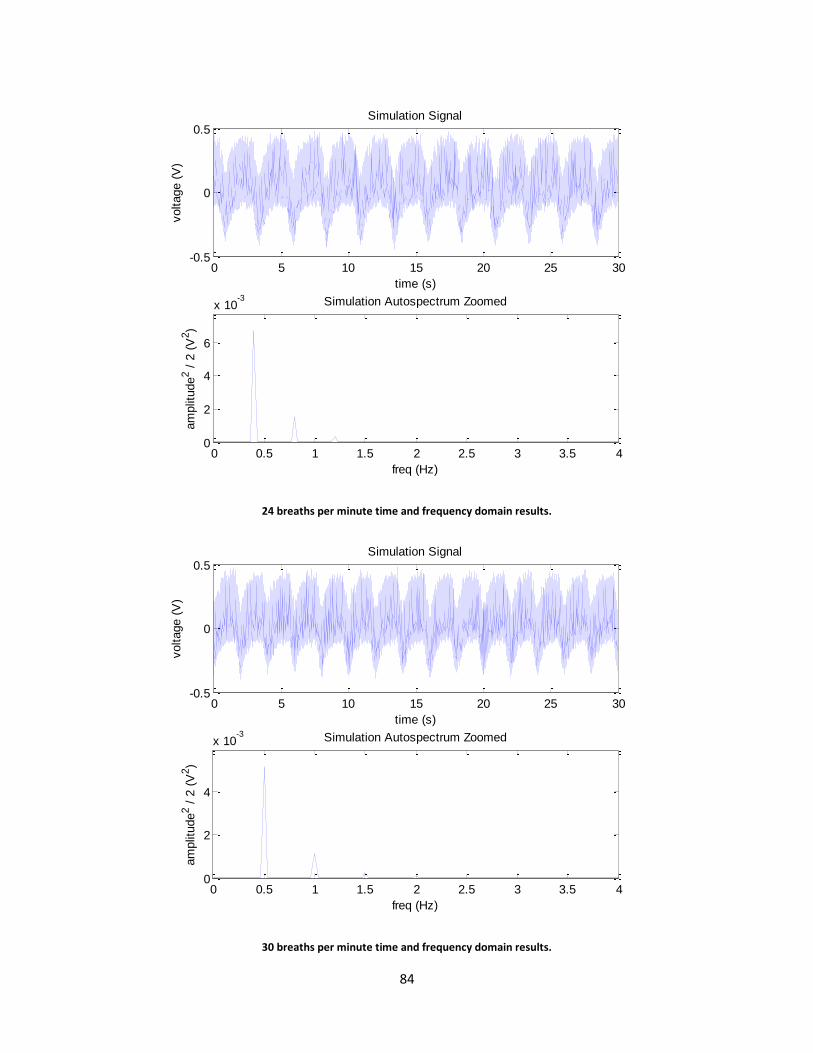
84
24 breaths per minute time and frequency domain results.
30 breaths per minute time and frequency domain results.
0 5 10 15 20 25 30-0.5
0
0.5
time (s)
voltage (
V)
Simulation Signal
0 0.5 1 1.5 2 2.5 3 3.5 40
2
4
6
x 10-3
freq (Hz)
am
plit
ude
2 /
2 (
V2)
Simulation Autospectrum Zoomed
0 5 10 15 20 25 30-0.5
0
0.5
time (s)
voltage (
V)
Simulation Signal
0 0.5 1 1.5 2 2.5 3 3.5 40
2
4
x 10-3
freq (Hz)
am
plit
ude
2 /
2 (
V2)
Simulation Autospectrum Zoomed

85
40 breaths per minute time and frequency domain results.
60 breaths per minute time and frequency domain results.
0 5 10 15 20 25 30-0.5
0
0.5
time (s)
voltage (
V)
Simulation Signal
0 0.5 1 1.5 2 2.5 3 3.5 40
1
2
3
x 10-3
freq (Hz)
am
plit
ude
2 /
2 (
V2)
Simulation Autospectrum Zoomed
0 5 10 15 20 25 30-0.5
0
0.5
time (s)
voltage (
V)
Simulation Signal
0 0.5 1 1.5 2 2.5 3 3.5 40
0.5
1
1.5
x 10-3
freq (Hz)
am
plit
ude
2 /
2 (
V2)
Simulation Autospectrum Zoomed

86
IRB Benchmark Testing Results
Subject 1 results.
Subject 2 results.
0 10 20 30 40 50 60-0.5
0
0.5
time (sec)
voltage (
V)
Full System Prototype Signal
0 10 20 30 40 50 60-1
0
1
time (sec)
voltage (
V)
ECG Signal
0 1 2 3 4 5 6 7 8 9 100
0.5
1
freq (Hz)
Cohere
nce
Coherence Function
0 10 20 30 40 50 60-0.2
0
0.2
time (sec)
voltage (
V)
Full System Prototype Signal
0 10 20 30 40 50 60-0.5
0
0.5
time (sec)
voltage (
V)
ECG Signal
0 1 2 3 4 5 6 7 8 9 100
0.5
1
freq (Hz)
Cohere
nce
Coherence Function
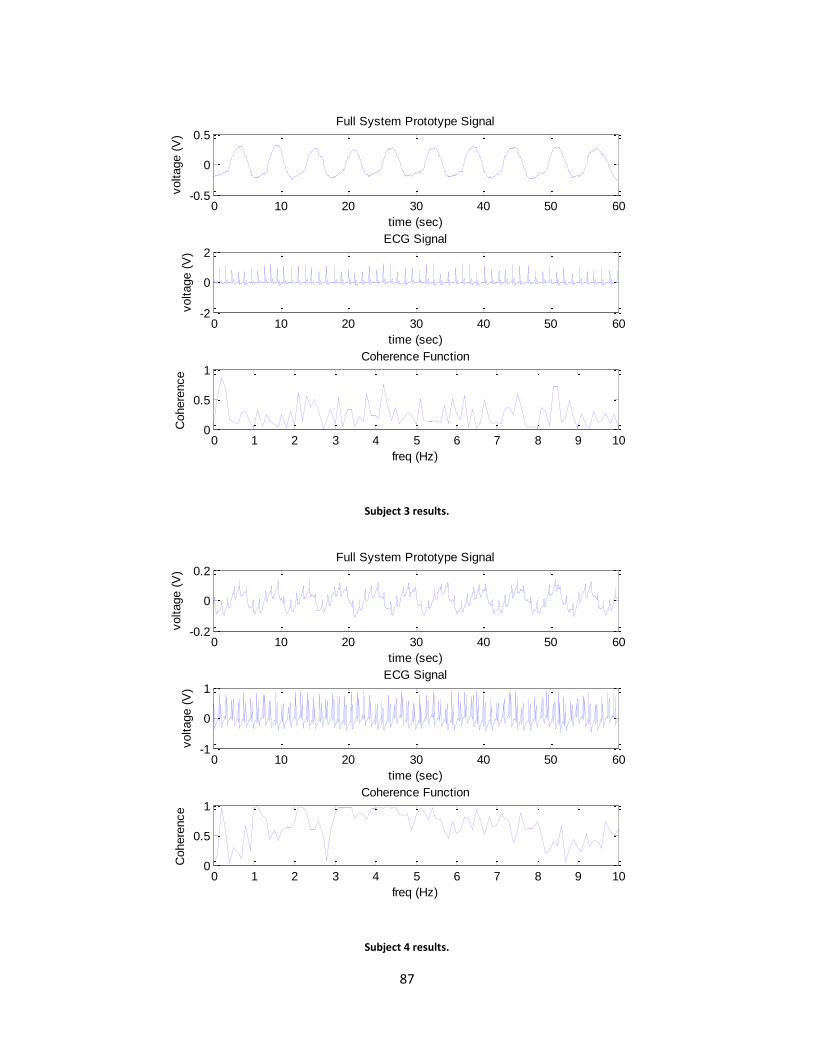
87
Subject 3 results.
Subject 4 results.
0 10 20 30 40 50 60-0.5
0
0.5
time (sec)
voltage (
V)
Full System Prototype Signal
0 10 20 30 40 50 60-2
0
2
time (sec)
voltage (
V)
ECG Signal
0 1 2 3 4 5 6 7 8 9 100
0.5
1
freq (Hz)
Cohere
nce
Coherence Function
0 10 20 30 40 50 60-0.2
0
0.2
time (sec)
voltage (
V)
Full System Prototype Signal
0 10 20 30 40 50 60-1
0
1
time (sec)
voltage (
V)
ECG Signal
0 1 2 3 4 5 6 7 8 9 100
0.5
1
freq (Hz)
Cohere
nce
Coherence Function
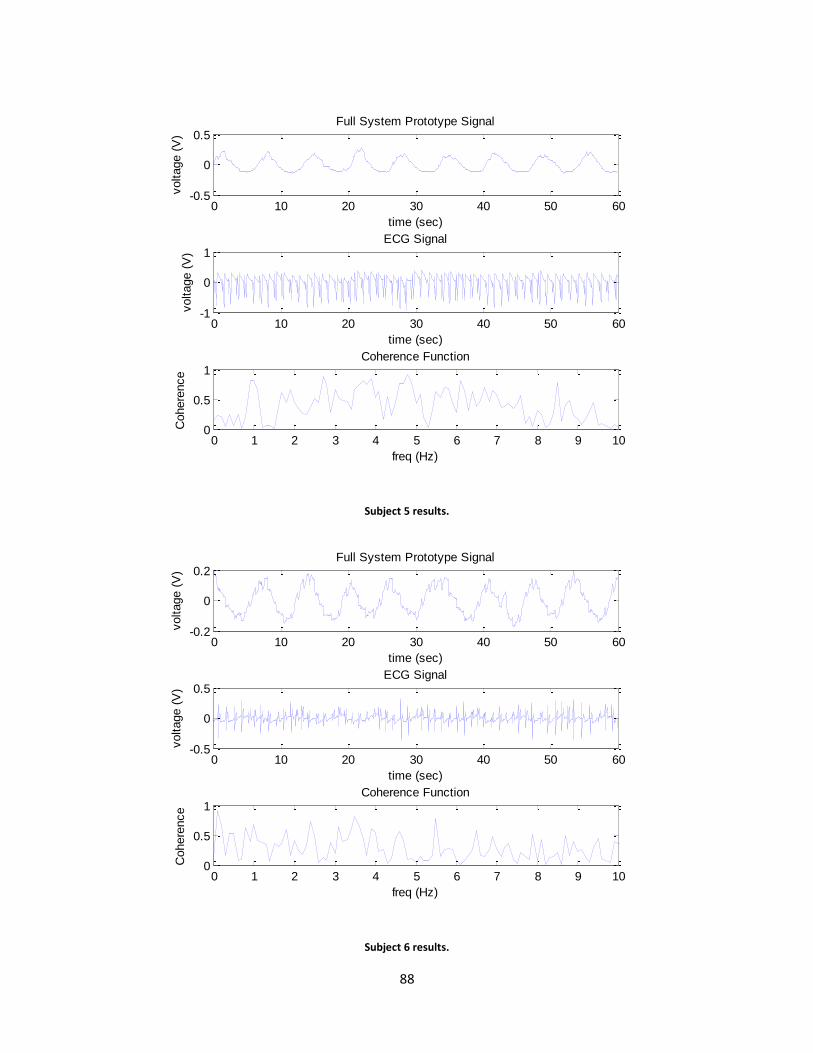
88
Subject 5 results.
Subject 6 results.
0 10 20 30 40 50 60-0.5
0
0.5
time (sec)
voltage (
V)
Full System Prototype Signal
0 10 20 30 40 50 60-1
0
1
time (sec)
voltage (
V)
ECG Signal
0 1 2 3 4 5 6 7 8 9 100
0.5
1
freq (Hz)
Cohere
nce
Coherence Function
0 10 20 30 40 50 60-0.2
0
0.2
time (sec)
voltage (
V)
Full System Prototype Signal
0 10 20 30 40 50 60-0.5
0
0.5
time (sec)
voltage (
V)
ECG Signal
0 1 2 3 4 5 6 7 8 9 100
0.5
1
freq (Hz)
Cohere
nce
Coherence Function
89
IRB Survey Results
SURVEY 1
Have you been trained as an EMT, a first responder, nurse, or a doctor? EMT
How long have you been in this profession? 8 Years
Have you ever been involved in mass casualty situation? If yes, explain… Yes. April 16th
By what means did you take a person’s pulse or respiratory rate in an emergency situation? Depends. If awake, radial pulse, if unconscious, carotid pulse. Resiratory rate based of rise and fall of shoulders or chest.
About how much time does it take up to estimate the pulse or respiratory rate? 30 seconds to be accurate and determine any anomalies in rhythm.
Have you ever had a difficult time finding the vital signs on a patient? If yes, explain… Yes. When heart rate and blood pressure are low, extremity pulses are hard to find, and you have to return to the carotid.
How often do you make an estimate of vital signs, because you couldn’t get an accurate reading, or didn’t have enough time? Resiratory rate is the most estimated vital sign. You can typically tell if they are breathing fast, slow or normally.
Have you ever needed to monitor multiple patients at the same time? Yes. First aid room at football games.
What are some of the most common types of patients that you have responded to? Musculoskeletal injuries, alcohol related injuries. Transports from Schiffert Health Center
If you could deploy a chest strap on to patients and wirelessly monitor multiple patients simultaneously, would you consider it to be a worthwhile technology? Explain… Only worth while in controlled situations such as first aid rooms, but this means someone would be dedicated to watch a screen. Depends on overall patient load. Low pt load would work better, but not worth it in hectic situations.

90
SURVEY 2
Have you been trained as an EMT, a first responder, nurse, or a doctor? EMT
How long have you been in this profession? 8 Years
Have you ever been involved in mass casualty situation? If yes, explain… Yes. April 16th
By what means did you take a person’s pulse or respiratory rate in an emergency situation? Depends. If awake, radial pulse, if unconscious, carotid pulse. Resiratory rate based of rise and fall of shoulders or chest.
About how much time does it take up to estimate the pulse or respiratory rate? 30 seconds to be accurate and determine any anomalies in rhythm.
Have you ever had a difficult time finding the vital signs on a patient? If yes, explain… Yes. When heart rate and blood pressure are low, extremity pulses are hard to find, and you have to return to the carotid.
How often do you make an estimate of vital signs, because you couldn’t get an accurate reading, or didn’t have enough time? Resiratory rate is the most estimated vital sign. You can typically tell if they are breathing fast, slow or normally.
Have you ever needed to monitor multiple patients at the same time? Yes. First aid room at football games.
What are some of the most common types of patients that you have responded to? Musculoskeletal injuries, alcohol related injuries. Transports from Schiffert Health Center
If you could deploy a chest strap on to patients and wirelessly monitor multiple patients simultaneously, would you consider it to be a worthwhile technology? Explain… Only worth while in controlled situations such as first aid rooms, but this means someone would be dedicated to watch a screen. Depends on overall patient load. Low pt load would work better, but not worth it in hectic situations.
91
SURVEY 3
Have you been trained as an EMT, a first responder, nurse, or a doctor? Yes. And, though you didn't ask this, and EMT-I
How long have you been in this profession? 5 years
Have you ever been involved in mass casualty situation? If yes, explain… yes, April 16, 2007
By what means did you take a person’s pulse or respiratory rate in an emergency situation? pulse by palp or pulse-ox resps by counting over 15 sec and estimating
About how much time does it take up to estimate the pulse or respiratory rate? less than a minute
Have you ever had a difficult time finding the vital signs on a patient? If yes, explain… yes, BP can be difficult.
How often do you make an estimate of vital signs, because you couldn’t get an accurate reading, or didn’t have enough time? Estimate? I'll ball park it. You can tell by a quick glance if the patient is breathing at an abnormal rate. So, yes, I might give a number in the normal range without spending much time on it. BP and pulse, no. If I can't get a BP, I'll say so.
Have you ever needed to monitor multiple patients at the same time? Yes. Anyone who has been stationed in a first aid room at Lane Stadium during a football game has had to keep track of multiple patients at one time.
What are some of the most common types of patients that you have responded to? Pretty much everything. Heat stroke, intoxication, gun shot wounds, altered mental status, diabetic emergency, heart issues, asthma, difficulty breathing, broken bones...
If you could deploy a chest strap on to patients and wirelessly monitor multiple patients simultaneously, would you consider it to be a worthwhile technology? Explain… Yes, if it were reliable and easy to deploy. I'm assuming you mean a chest strap that would go all the way around a patient. It would be very difficult to put something like that on many patients. For example, trauma patients are immediately backboarded. Bariatric patients are nearly impossible to lift. Would it interfere with cardiac monitoring (12-leads)? Would it require patients to be exposed in the chest area, leading to privacy issues? So, maybe in a perfect world it's a good idea, but it would depend on the device and the circumstances.

92
SURVEY 4
Have you been trained as an EMT, a first responder, nurse, or a doctor? Yes (EMT)
How long have you been in this profession? 2 years
Have you ever been involved in mass casualty situation? If yes, explain… No
By what means did you take a person’s pulse or respiratory rate in an emergency situation? I have taken radial pulses every time I had to assess pulse rate/quality and I observed the rise and fall of the chest to assess respiratory rate.
About how much time does it take up to estimate the pulse or respiratory rate? 30 seconds to 1 minute total
Have you ever had a difficult time finding the vital signs on a patient? If yes, explain… Yes. When patients have low blood pressure or a weak heart beat or small sunken veins it can be difficult. I've found the hardest pulses to locate are usually on small women.
How often do you make an estimate of vital signs, because you couldn’t get an accurate reading, or didn’t have enough time? Never. I don't estimate or make up vital signs-that's dangerous. I take the time to get it right, or I get another crew member to try.
Have you ever needed to monitor multiple patients at the same time? Yes.
What are some of the most common types of patients that you have responded to? Flu-like symptoms, sports injuries, and drunks.
If you could deploy a chest strap on to patients and wirelessly monitor multiple patients simultaneously, would you consider it to be a worthwhile technology? Explain… It seems like a good idea, but with something that invasive (particularly for women who don't want to show off the pups) it might not always be warranted. In a true emergency, why not just use the heart monitors we already have? The only real advantages I could see over a heart monitor are 1) wireless technology may be easier to deploy, especially with multiple patients and 2) our entire agency only has 10 or so heart monitors, and they aren't cheap. If we had a 20+ MCI, throwing in a dozen of your chest strap devices might save us time, money, and effort.
93
SURVEY 5
Have you been trained as an EMT, a first responder, nurse, or a doctor? Currently a paramedic and also in medical school
How long have you been in this profession? Began EMS in 2005 with initial certification in 2006. Began medical school in 2005
Have you ever been involved in mass casualty situation? If yes, explain… Yes, 4/16 at VT
By what means did you take a person’s pulse or respiratory rate in an emergency situation? Radial pulse x 15 seconds and multiply by four. Observe chest rise and fall x 15 seconds and multiply by four. Though sometimes in an emergency setting I just check for quality and approximate rate of both pulse and RR during quick patient interactions such as triage
About how much time does it take up to estimate the pulse or respiratory rate? As stated above, about 15 seconds for a count. Can take shorter time if you just want an approximation. If there is a non emergency situation, pulse and RR are measured by counting for 30 seconds and multiplying by two, in theory providing a more accurate set of vital signs.
Have you ever had a difficult time finding the vital signs on a patient? If yes, explain… Sometimes can be challenging to locate peripheral pulses on trauma patients secondary to hypotension
How often do you make an estimate of vital signs, because you couldn’t get an accurate reading, or didn’t have enough time? Only in emergent, life threatening situations.
Have you ever needed to monitor multiple patients at the same time? Not really in the out of hospital setting
What are some of the most common types of patients that you have responded to? Minor trauma, breathing difficulty, abdominal pain, altered level of consciousness
If you could deploy a chest strap on to patients and wirelessly monitor multiple patients simultaneously, would you consider it to be a worthwhile technology? Explain… It sounds great but the cost of implementing such a device would likely be restrictive
94
SURVEY 6
Have you been trained as an EMT, a first responder, nurse, or a doctor? Yes.
How long have you been in this profession? 8 months
Have you ever been involved in mass casualty situation? If yes, explain… No.f
By what means did you take a person’s pulse or respiratory rate in an emergency situation? I take pulses and respiratory rates on a daily basis when on the scene of a 911 call.
About how much time does it take up to estimate the pulse or respiratory rate? 30 seconds for each.
Have you ever had a difficult time finding the vital signs on a patient? If yes, explain… Yes, bariatric patients can have layers of fat covering their arteries and therefore it can be difficult to initially locate a pulse.
How often do you make an estimate of vital signs, because you couldn’t get an accurate reading, or didn’t have enough time? Never.
Have you ever needed to monitor multiple patients at the same time? Yes.
What are some of the most common types of patients that you have responded to? Sports related injuries.
If you could deploy a chest strap on to patients and wirelessly monitor multiple patients simultaneously, would you consider it to be a worthwhile technology? Explain… Yes and no. It would depend what the device is measuring. For vitals such as pulse, a machine can calculate the vital but cannot calculate the quality of the pulse (strong, weak, thready). You would have to make sure that the technology could completely detect any vital signs that may be taken.
95
SURVEY 7
Have you been trained as an EMT, a first responder, nurse, or a doctor? 2.5 years
How long have you been in this profession? 3 years
Have you ever been involved in mass casualty situation? If yes, explain… Yes.... Car accidents
By what means did you take a person’s pulse or respiratory rate in an emergency situation? By palpation
About how much time does it take up to estimate the pulse or respiratory rate? 15 seconds
Have you ever had a difficult time finding the vital signs on a patient? If yes, explain… Yes. Some people have wear pulses or very shallow respirations
How often do you make an estimate of vital signs, because you couldn’t get an accurate reading, or didn’t have enough time? Very rarely
Have you ever needed to monitor multiple patients at the same time? Yes
What are some of the most common types of patients that you have responded to? Medical, sports injuries
If you could deploy a chest strap on to patients and wirelessly monitor multiple patients simultaneously, would you consider it to be a worthwhile technology? Explain… Yea. It would allow me to focus on pt care and assessing them rather than getting vitals continuously.
96
SURVEY 8
Have you been trained as an EMT, a first responder, nurse, or a doctor? yes
How long have you been in this profession? less than a year
Have you ever been involved in mass casualty situation? If yes, explain… no
By what means did you take a person’s pulse or respiratory rate in an emergency situation? pulse by palpation either radial or carotid we also use a pulse-ox Respirations by visualy counting number of breaths
About how much time does it take up to estimate the pulse or respiratory rate? 30 seconds for both
Have you ever had a difficult time finding the vital signs on a patient? If yes, explain… yes, on some patients especially elderly it can be difficult to hear a blood pressure
How often do you make an estimate of vital signs, because you couldn’t get an accurate reading, or didn’t have enough time? Never
Have you ever needed to monitor multiple patients at the same time? no
What are some of the most common types of patients that you have responded to? sport related injuries, ETOH, respiratory difficulties
If you could deploy a chest strap on to patients and wirelessly monitor multiple patients simultaneously, would you consider it to be a worthwhile technology? Explain… yes and no, if there are multiple patients then yes also if the device can accurately read respiration, however on a normal call we almost always like to take manual vital signs for example in the case of taking a pulse if take it manually you can feel rate, strength and regularity, if it is taken manually you only get a rate

97
SURVEY 9
Have you been trained as an EMT, a first responder, nurse, or a doctor? Yes
How long have you been in this profession? Two Years
Have you ever been involved in mass casualty situation? If yes, explain… No
By what means did you take a person’s pulse or respiratory rate in an emergency situation? feeling and counting a pulse and observing respirations
About how much time does it take up to estimate the pulse or respiratory rate? no longer than 15 seconds
Have you ever had a difficult time finding the vital signs on a patient? If yes, explain… yes. Sometimes the pulse is very weak, which can mean finding a blood pressure is hard as well. It typically means you just try a second time.
How often do you make an estimate of vital signs, because you couldn’t get an accurate reading, or didn’t have enough time? Often I estimate the respiratory rate, but none other
Have you ever needed to monitor multiple patients at the same time? Yes
What are some of the most common types of patients that you have responded to? Sports injury (ankle, knee, wrist) and abdominal pain
If you could deploy a chest strap on to patients and wirelessly monitor multiple patients simultaneously, would you consider it to be a worthwhile technology? Explain… yes. If there is one person in the back of an ambulance or multiple patients, it becomes difficult to obtain a set of vitals as needed while determining required information about the patients condition and demographics.
98
SURVEY 10
Have you been trained as an EMT, a first responder, nurse, or a doctor? Yes
How long have you been in this profession? 9 months
Have you ever been involved in mass casualty situation? If yes, explain… I participated in an MCI drill during fall 2011 semester. Just a drill.
By what means did you take a person’s pulse or respiratory rate in an emergency situation? Manually; radial pulse
About how much time does it take up to estimate the pulse or respiratory rate? Pulse- 30 seconds Respiratory rate- 30 seconds
Have you ever had a difficult time finding the vital signs on a patient? If yes, explain… Yes, some individuals have difficult radial pulses to find; sometimes it is difficult to count respirations when they are shallow
How often do you make an estimate of vital signs, because you couldn’t get an accurate reading, or didn’t have enough time? Never.
Have you ever needed to monitor multiple patients at the same time? Only during the MCI drill.
What are some of the most common types of patients that you have responded to? Athletic injuries; syncopal episodes; difficulty breathing; ETOH alcohol involved
If you could deploy a chest strap on to patients and wirelessly monitor multiple patients simultaneously, would you consider it to be a worthwhile technology? Explain… No. No technology compares to manual readings
99
SURVEY 11
Have you been trained as an EMT, a first responder, nurse, or a doctor? EMT
How long have you been in this profession? 1 year
Have you ever been involved in mass casualty situation? If yes, explain… no
By what means did you take a person’s pulse or respiratory rate in an emergency situation? manual
About how much time does it take up to estimate the pulse or respiratory rate? 15-30 seconds
Have you ever had a difficult time finding the vital signs on a patient? If yes, explain… yes, it can be difficult in the truck especially if the person has weak pulses. it is also difficult to listen for a blood pressure and lung sounds because you can hear the engine of the truck
How often do you make an estimate of vital signs, because you couldn’t get an accurate reading, or didn’t have enough time? I never make up vitals, if you can't get them you include that in the report
Have you ever needed to monitor multiple patients at the same time? yes
What are some of the most common types of patients that you have responded to? sports injuries, illness, falls
If you could deploy a chest strap on to patients and wirelessly monitor multiple patients simultaneously, would you consider it to be a worthwhile technology? Explain… Not for what we do. If I did long transports, then maybe. It isn't too hard to monitor a patient and I don't know how much I would trust a chest strap in the truck
100
SURVEY 12
Have you been trained as an EMT, a first responder, nurse, or a doctor? Yes
How long have you been in this profession? Since Fall 2011
Have you ever been involved in mass casualty situation? If yes, explain… No
By what means did you take a person’s pulse or respiratory rate in an emergency situation? I watch the chest for movement for a respiration rate and check the radial pulse
About how much time does it take up to estimate the pulse or respiratory rate? 30 seconds
Have you ever had a difficult time finding the vital signs on a patient? If yes, explain… Yes, radial pulses can be difficult to find
How often do you make an estimate of vital signs, because you couldn’t get an accurate reading, or didn’t have enough time? Never
Have you ever needed to monitor multiple patients at the same time? No
What are some of the most common types of patients that you have responded to? Drunks and sports injuries
If you could deploy a chest strap on to patients and wirelessly monitor multiple patients simultaneously, would you consider it to be a worthwhile technology? Explain… I am not trained to use cardiac monitors to monitor the heart
101
SURVEY 13
Have you been trained as an EMT, a first responder, nurse, or a doctor? EMT
How long have you been in this profession? 5 years
Have you ever been involved in mass casualty situation? If yes, explain… Yes. Multiple from bus accidents to multi car accidents, as well as countless trainings.
By what means did you take a person’s pulse or respiratory rate in an emergency situation? Pulse: I use my index and middle finger to feel the radial pulse. If they are unconscious, i use the same fingers and feel their carotid. Respirations: look at the chest and count...
About how much time does it take up to estimate the pulse or respiratory rate? You never estimate a vital sign.......thats piss poor patient care. When i assess their vitals, it takes 30 seconds for pulse and an additional 30 seconds for respirations.
Have you ever had a difficult time finding the vital signs on a patient? If yes, explain… Yes, especially on geriatrics. If it is difficult, you should note the problem and NEVER 'estimate' vitals.
How often do you make an estimate of vital signs, because you couldn’t get an accurate reading, or didn’t have enough time? NEVER ESTIMATE VITAL SIGNS!!!! The job of an EMT aka a medical profrasional is to obtain vitals, thats you job...dont estimate, because when you do that, and you get it wrong you could kill someone. If you cant get an accurate reading, note that, dont estimate or a better way yo put it....lie.
Have you ever needed to monitor multiple patients at the same time? Yes.
What are some of the most common types of patients that you have responded to? Sports injuries, general illness, ETOH abuse.
If you could deploy a chest strap on to patients and wirelessly monitor multiple patients simultaneously, would you consider it to be a worthwhile technology? Explain… For the right price, yes. It would help in the circumstances when u have multiple patients and few providers, but that rarely happens, so the price would have to be right to be worth it.
102
SURVEY 14
Have you been trained as an EMT, a first responder, nurse, or a doctor? Trained as an EMT
How long have you been in this profession? 8 months
Have you ever been involved in mass casualty situation? If yes, explain… no
By what means did you take a person’s pulse or respiratory rate in an emergency situation? pulse be radial pulse and respirations by observation/auscultation.
About how much time does it take up to estimate the pulse or respiratory rate? 30 seconds for each = 1 minute total
Have you ever had a difficult time finding the vital signs on a patient? If yes, explain… yes- I had an elderly patient who had recent surgery on their left hand. it was difficult to find a radial pulse in that hand
How often do you make an estimate of vital signs, because you couldn’t get an accurate reading, or didn’t have enough time? when it comes to a noncritical patient, say a minor lac or superficial abrasion, I have estimated respirations/
Have you ever needed to monitor multiple patients at the same time? yes- football games
What are some of the most common types of patients that you have responded to? Medical issues- chest pain, nausea, ETOH, etc.
If you could deploy a chest strap on to patients and wirelessly monitor multiple patients simultaneously, would you consider it to be a worthwhile technology? Explain… it seems expensive... plus we are taught to treat the patient, not the machine. peoples "normal range" vital signs vary
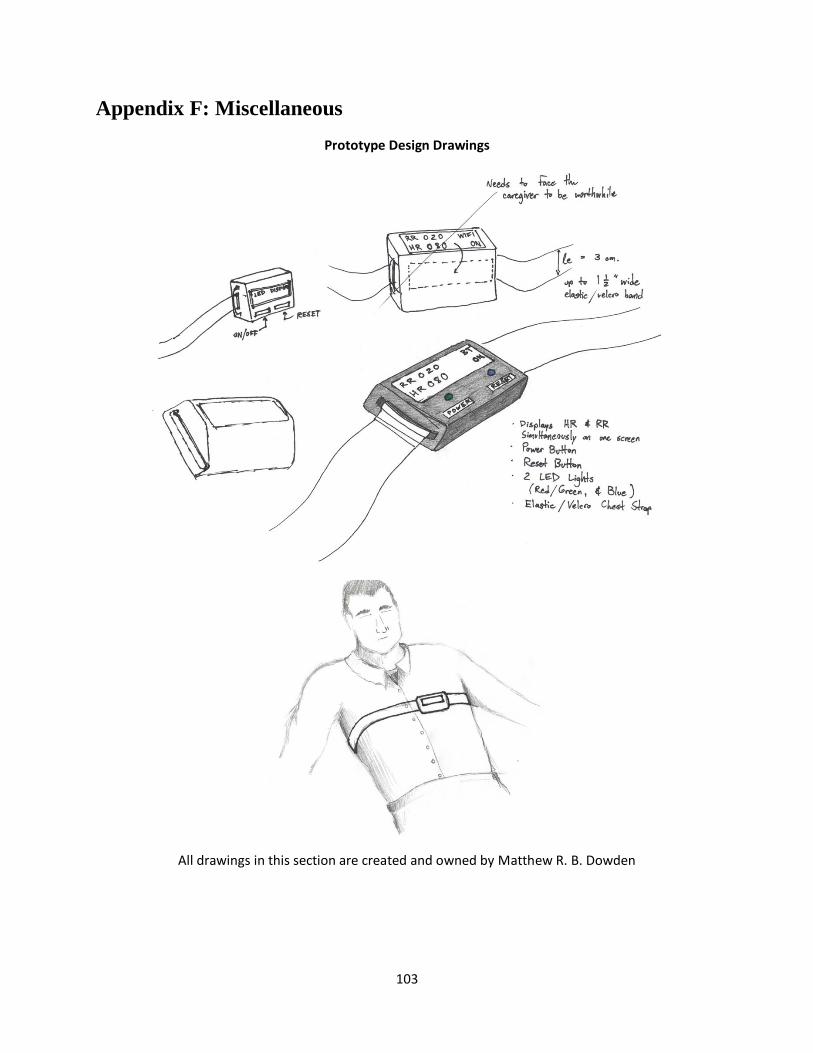
103
Appendix F: Miscellaneous
Prototype Design Drawings
All drawings in this section are created and owned by Matthew R. B. Dowden

104
Datasheets
Product Description Product Number Datasheet URL
Analog to Digital Converter
LTC2471 http://cds.linear.com/docs/Datasheet/24713f.pdf
And Gate SN74AHC1G08 http://www.ti.com/lit/ds/symlink/sn74ahc1g08.pdf
BQ Charge Controller BQ24123
Bluetooth Antenna Rufa2v4 3030A58 http://www.antenova.com/Product%20Specs/AE020157-N-Product-Specification-Rufa.pdf
Bluetooth Module SPBT2532C2-AT http://www.st.com/internet/com/TECHNICAL_RESOURCES/TECHNICAL_LITERATURE/DATASHEET/CD00243909.pdf
LCD Screen NHD-C0216CiZ-FSW-FBW-3V3
http://www.newhavendisplay.com/specs/NHD-C0216CiZ-FSW-FBW-3V3.pdf
LCD Screen User Manual
ST7032 http://www.newhavendisplay.com/app_notes/ST7032.pdf
LED Driver sn74lvc244a http://www.ti.com/lit/ds/symlink/sn74lvc244a.pdf
Low Power Voltage Detector
STM1061 http://www.st.com/internet/com/TECHNICAL_RESOURCES/TECHNICAL_LITERATURE/DATASHEET/CD00065467.pdf
Microcontroller LM3S8962 http://www.ti.com/lit/ds/symlink/lm3s8962.pdf
On/Off Controller MAX16054 http://datasheets.maxim-ic.com/en/ds/MAX16054.pdf
Op-amp OPA2301 http://www.ti.com/lit/ds/symlink/opa2301.pdf
Project Box http://www.pactecenclosures.com/pdfs/drw_HM.pdf
Power Jack PJ-053D http://www.cui.com/Product/Resource/DigiKeyPDF/PJ-053D.pdf
Pressure Transducer MP3V5004G http://www.freescale.com/files/sensors/doc/data_sheet/MP3V5004G.pdf
Step Down Converter TPS62203 http://www.ti.com/general/docs/lit/getliterature.tsp?genericPartNumber=tps62203&fileType=pdf
Switch, SPDT SLS121RA04 http://documents.tycoelectronics.com/commerce/DocumentDelivery/DDEController?Action=srchrtrv&DocNm=1825116&DocType=CD&DocLang=EN
Switch, Momentary TL1105BF160Q http://spec.e-switch.com/P-J/P010003C.pdf