using opportunity to learn and early grade reading fluency to measure school effectiveness in...
TRANSCRIPT

7/28/2019 Using Opportunity to Learn and Early Grade Reading Fluency to Measure School Effectiveness in Guatemala
http://slidepdf.com/reader/full/using-opportunity-to-learn-and-early-grade-reading-fluency-to-measure-school 1/36
CASE SUDY
Using Opportunity to Learn and Early GradeReading Fluency to Measure School Eectivenessin Guatemala
Executive Summary How do we know i and when schools are eective? o most educational planners, theterm “eective” is the search or actors and variables that enhance a child’s learning irrespective o their background. While many denitions o school eectiveness exist inthe literature, the “Five-Factor” model o school eectiveness suggests that leadership,
acquisition o basic skills, a secure environment, high expectations o students, andrequent assessment o perormance are critical elements o eectiveness (Sheerans,2000).
Tis study argues that to improve school eectiveness, schools and educators shouldocus on even more basic elements than those posited by other research. Te ocusshould be on providing a basic opportunity to learn by having the school open every day; the teacher present; students present and ready to learn; and instructional time ontask. Te educational value o that basic opportunity then depends on how teachersand students use the time available during the day, whether materials are present andused by them, and whether class sizes are reasonable. Te study urther established
an opportunity to learn (OL) index based on 12 actors and measures the extent to which opportunity to learn is optimized in a sample o schools in Guatemala. Te study answers the ollowing questions:
• How well do schools provide opportunity to learn?• How does actual opportunity to learn compare to potential opportunity to learn?• How does opportunity to learn vary across schools?
Methodology Data or the study were collected through rst-hand eld research in each o the
our countries, made possible through collaboration with Save the Children (SC) USand their country oce in Guatemala. Te sample o schools was drawn rom thoseparticipating in the SC education programs in each respective country, based onstratication by school size and location. Control schools – those not participating in theNGO supported programs – were also sampled.
Field research teams visited 26 schools and collected data through the use o a series o instruments, including Early Grade Reading Assessments (EGRA); Stallings classroomobservation instrument; school observations; and interviews with teachers and principals.Data analysis included regression, ANOVA, and actor analysis along with qualitativeanalysis o interviews.

7/28/2019 Using Opportunity to Learn and Early Grade Reading Fluency to Measure School Effectiveness in Guatemala
http://slidepdf.com/reader/full/using-opportunity-to-learn-and-early-grade-reading-fluency-to-measure-school 2/36
Measuring School Eective ness: Guatemala
Context Save the Children has been operating in Guatemala or more than 10 years withprograms ocused on hunger, malnutrition, emergency preparedness, child/reproductivehealth, and education. More recently, SC’s education interventions have ocused onthree states within Guatemala: K’iche’, Huehuetenango, and Solola (the poorest andmost marginalized), as it works to ensure that each child is aorded the basic right toattend school.
Students included in the sample reported speaking our dierent languages at home:34 percent o the students spoke K’iche as their mother tongue, 30 percent Mam, 25percent Ixil, and 11 percent spoke only Spanish. Students in the study were evenly splitby gender. Te average age o the students in the sample was 10 and 73 percent reported
having participated in kindergarten.
Results Schools in Guatemala were open on average 97 percent o the days they should be, andteacher and student attendance rates are airly high (88 and 92 percent, respectively).However, time loss because o late starts, early close and time-on-task is quite signicant.Schools on average are using only 72 percent o the available day or instruction becauseo late start, early end, and prolonged breaks in the day or recess, and students are ontask only 59 percent o the time.
When we combine the time loss caused by school being closed, teachers and students
being absent, time lost during the day and students being o task during lessons,schools on average are using only 33 percent o the equivalent available time (days) orinstruction (OL Factor 6). Expressed in terms o the number o days in the school year,this equivalent time comes out to approximately 56 days.
In terms o the remaining OL actors, on average 63 percent o students in the samplehave language textbooks in the classroom. However, students were observed using those books a very small percentage o the time (3 percent o the time). Students werealso observed reading any material in class at similarly low percentages o the time (11percent o the time). In terms o oral reading fuency, students were able to read on
average 46 words per minute (wpm). Te average class sizes or schools included in thestudy was 27 students and schools on average reported to be receiving sucient supportvisits during the year.
Variation o opportunity to learn across schools was airly extensive. Te smallestamount o variation was ound in the rst OL indicators: schools open, with thegreatest variation in teacher and student attendance and textbook availability. imespent on task in classrooms also varied greatly between schools, with the lowest time ontask at 47 percent and the highest at 71 percent.
Conclusions
Te main ndings suggest that a) a great deal o time that could be used or instructionis being lost; b) little i any reading instruction is taking place in the classroom; and

7/28/2019 Using Opportunity to Learn and Early Grade Reading Fluency to Measure School Effectiveness in Guatemala
http://slidepdf.com/reader/full/using-opportunity-to-learn-and-early-grade-reading-fluency-to-measure-school 3/36
c) while textbooks exist, their eective use is suspect. Additionally, while students hadairly good knowledge o Concepts about Print (CAP), their reading fuency scores weregenerally below the acceptable threshold o 60 wpm.
Te OL index urther revealed that the variation among schools in each country wasconsiderable and none o the 12 OL actors was signicantly correlated with learning.While sample sizes were small and likely impacted regression results, researchers believethe lack o a relationship is because little or no reading instruction was taking place inthe classrooms.
Te OL index and subsequent analysis rom this case study provides useul insightsinto the relationship between schools, instruction and learning—namely that unlessthere is a minimum amount o instruction, specically instruction in reading, then weshould not expect to nd a relationship between opportunity to learn and learning. Tisnding has important policy implications or those implementing programs or making sector policy.
Tis study proposes a number o interventions and policies that could improve theclassroom environment and help children learn. eacher and student absenteeism needto be more closely monitored and the actors that impact their attendance addressed.More o the school day needs to be eectively used and more time should be devotedto reading. Tere needs to be increased investment in teacher training in the areas o literacy development and reading resources need to be provided to schools and students.
Curriculum needs to be restructured to help build a strong link between reading andwriting. Finally, remediation and more individualized instruction should be introduced.
IntroductionDeveloping countries and international agencies are recognizing that gains in access toschooling alone are not sucient to build the human resource base needed or economicdevelopment in the 21st century. Tis recognition has pushed agencies to increasingly direct attention and investment to improving learning outcomes or students—shiting the ocus rom increased access to improving quality. Ensuring that lessons learned romapproaches to schooling that eectively promote and support student learning outcomes
are well-documented and shared is critical to shaping where and how uture educationinvestments are used.
Research conducted by the Education Quality Improvement Program (EQUIP2) oncomplementary education programs showed how NGO-supported programs are ableto cost-eectively promote school completion and learning. Cases studies o variouscomplementary education programs completed in 2007 identied a series o policiesand practices that improve the opportunities to learn oered at the school level. Forexample, the study showed that policies that promote mother-tongue instruction at theschool level or early grades helped students build oundational literacy and numeracy skills more eectively than i they began instruction in the ocial country language.
Based on the ndings rom this research, EQUIP2 developed an opportunity to learnindex intended to describe and measure the basic elements required or initial learning

7/28/2019 Using Opportunity to Learn and Early Grade Reading Fluency to Measure School Effectiveness in Guatemala
http://slidepdf.com/reader/full/using-opportunity-to-learn-and-early-grade-reading-fluency-to-measure-school 4/36
Measuring School Eectiveness: Guatemala
to occur. Te concept o opportunity to learn mainly ocuses on the time allocated toteaching, learning, and curriculum coverage and is supported throughout the literature(Gillies and Quijada, 2008). Te OL actors that are necessary or basic oundationalskills to be developed include the ollowing:
1. Percentage o days school is open;2. eacher attendance;3. Student attendance;4. Percentage o the school day available or instruction;5. Percentage o student time-on-task;6. Equivalent percentage o days available or instruction;7. Percentage o students with a textbook;
8. Percentage o observed textbook use;9. Percentage o time spent reading;10. Grade 3 reading ability;11. Class size; and12. School support.
o build on the existing opportunity to learn and eectiveness research, the teamelaborated a new study to quantiy the relationship between the OL indicators, timeloss in the classroom and student’s learning outcomes. One drawback o the EQUIP2complementary education research was the lack o data in most countries on student
learning outcomes. Proxies such as end-o-cycle exams or other standardized tests hadto be used, which only include students who make it to the end o the cycle, ocus ondiscriminating between high achieving students, and thereore do not refect the ullrange o perormance o students in the system (Kellaghan, 2004). Because Guatemala lacked a national or school level reading assessment that could easily be used as thelearning measure, the team drew on the renement and growing use o early gradereading assessment (EGRA) methodologies, which oered EQUIP2 a chance to urtherits research on school eectiveness.
EGRA provides a airly easy to design and implement methodology to quickly assess a variety o early literacy skills, and thereore to gauge school and/or system eectiveness
at ostering acquisition o those skills. Te EdData II project in particular has beeninstrumental in promoting and improving the use o EGRA as a measure o schooleectiveness and has now supported its application in almost 20 countries. However,one o the drawbacks o EGRA is that it has a foor eect. It ails to measure the skillso students who are below the “foor” o being able to read letters, words, or connectedtext. Working with Save the Children, EQUIP2 introduced the Concepts about Printmethodology as an additional assessment tool to ensure the evaluation o pre-reading skills in students who are non-readers.
Te combination o the opportunity to learn ramework, EGRA, and CAP are whatinspired the design o the current EQUIP2 research on eective schools. Tis researchis based on the idea that school eectiveness, as measured by whether the school enables

7/28/2019 Using Opportunity to Learn and Early Grade Reading Fluency to Measure School Effectiveness in Guatemala
http://slidepdf.com/reader/full/using-opportunity-to-learn-and-early-grade-reading-fluency-to-measure-school 5/36
children to learn to read, is a unction o how well the school assures a oundationalopportunity to learn and whether it draws on teaching approaches that make the bestpossible use o the instructional time that is available. Tis study posits that schooleectiveness is a unction o the optimization o opportunity to learn, time spenton learning tasks and the instructional methods that make good use o the availableopportunity to learn (Benavot and Amadio, 2004). Trough a partnership with Savethe Children, EQUIP2 was able to access schools in the areas o Guatemala where SCoperates to successully conduct the study.
Building on EQUIP2’s complementary education and opportunity to learn research,this study seeks to answer the ollowing questions.
• How well do schools provide opportunity to learn?• How does actual opportunity to learn compare to potential opportunity to learn?• How does opportunity to learn vary across schools?
Context Guatemala is one o the northernmost countries o Central America and is the region’smost populous nation. Its 13 million inhabitants represent a cosmopolitan mix o Mestizo (59 percent) and multiple Amerindian groups which speak a total o 24distinct languages, including Spanish and various Mayan dialects (CIA, 2009). Spanish,however, is not universally spoken. A signicant part o the population does not even
speak it as a second language.Access to and quality o education in Guatemala has substantively improved in thepast decade. According to UNESCO (2009), in 2006, net enrollment rate jumped to94 percent, almost reaching the Latin American average o 95 percent. Guatemala hasnearly reached ull primary school coverage or its school-aged children.
Save the Children began operations in Guatemala in 1999 with programs ocusedon hunger, malnutrition, emergency preparedness, child/reproductive health, andeducation. More recently, SC’s education interventions have ocused on threestates within Guatemala: K’iche’, Huehuetenango, and Solola (the poorest and
most marginalized). SC’s main goal is to increase access to quality early childhooddevelopment, pre-primary, primary, and secondary education at 80 schools (SC, 2009).SC’s education program is based on active teaching, which includes a dynamic, fexible,and creative process through signicant activities (SC, 2006). o reach the objectives o this active methodology, SC has ocused their interventions on the ollowing activities.
• Promoting Mayan culture by implementing an intercultural bilingual educationprogram
• Oering teachers, administrators, and school board members skill-building training • Reurbishing and equipping schools with educational materials• Encouraging parents to become involved in their children’s education

7/28/2019 Using Opportunity to Learn and Early Grade Reading Fluency to Measure School Effectiveness in Guatemala
http://slidepdf.com/reader/full/using-opportunity-to-learn-and-early-grade-reading-fluency-to-measure-school 6/36
Measuring School Eectiveness: Guatemala
Te implementation o SC’s educational program was designed to be carried out inphases: diagnosis, identication o children’s needs, planning, execution, monitoring and evaluation, and results. When this program started in 2001, it supported 54schools. By 2007, the total coverage o this program was 72 schools that enrolled 16,985children (SC, 2006). able 1 summarizes the breadth and depth o the SC program inGuatemala.
Table 1. Universe o schools
otal Number o Schools 72
otal Enrollment 16,985
% Girls 49%
Number o Schools in Huehuetenango 14
Number o Schools in K’iche’ 32
Number o Schools in Solola 16
Number o Schools Receiving Support 72
-or More than 5 years 1
-or 3 to 4 years 57
-or 1-2 years 14
Sampling and Methodology Based on a mutual interest to understand what interventions best support studentsuccess and eectiveness in schools, EQUIP2 partnered with SC to conduct this casestudy. SC provided access to a sample o their schools; eld support rom their oces ordata collection, transportation and materials; and hired two Save-University Partnershipor Education Research (SUPER) ellows who served as the main researchers/data collectors or the study. Te ollowing discussion elaborates on the methodology used orcollecting and analyzing the data presented in the case study. Te results represent theestablishment o a baseline o time loss, instructional time on task, and student reading fuency or a sample o SC and control schools. Te purpose o the baseline is to assist
SC in rening their interventions to better assist teachers and students in the classroom.It is not an evaluation o SC perormance.
Sampling Te study examines data at the student, classroom and school level. wenty SCsupported schools were randomly selected, representing 15 percent o the 72 schoolsSC currently supports in Guatemala. Te sample was stratied by distance rom anurban center and size o school. Schools were then proportionally selected rom threeo the areas where SC Guatemala currently works: Nebaj, K’iche’, and Huehuetenango.o ensure a point o comparison, six control schools – two rom each area – were also
selected. Te control schools were selected based on the matched characteristics o
7/28/2019 Using Opportunity to Learn and Early Grade Reading Fluency to Measure School Effectiveness in Guatemala
http://slidepdf.com/reader/full/using-opportunity-to-learn-and-early-grade-reading-fluency-to-measure-school 7/36
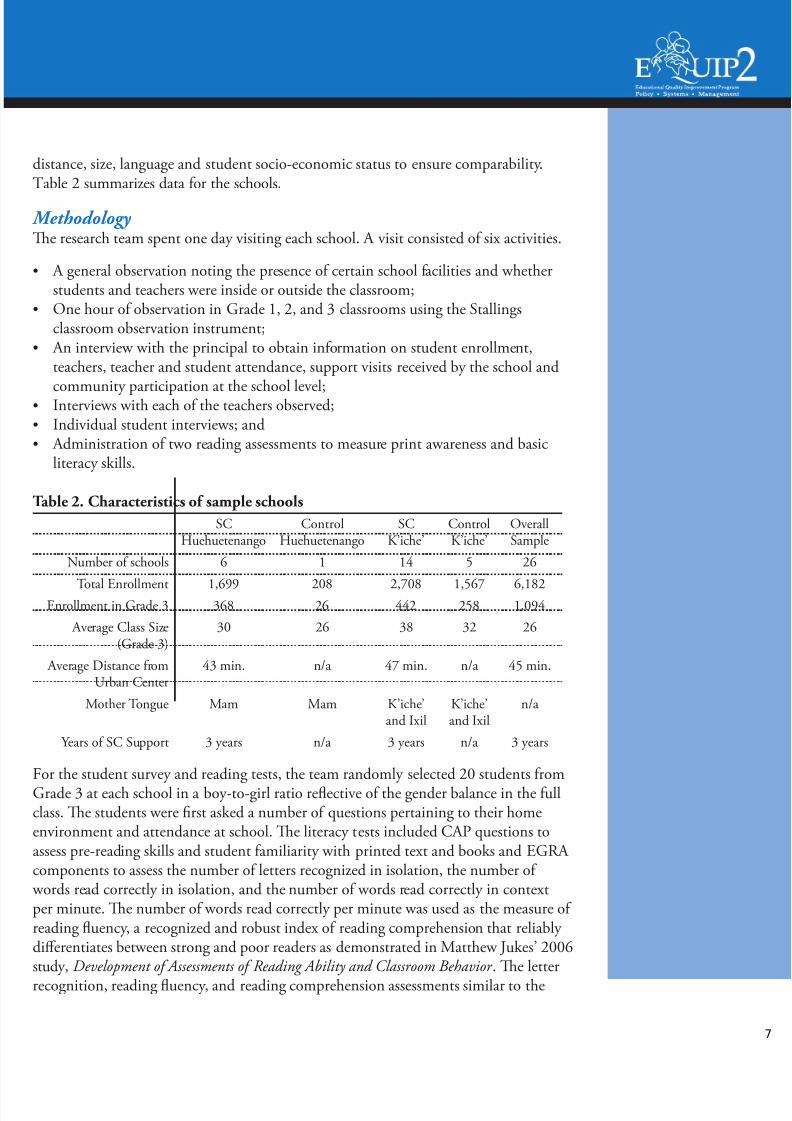
distance, size, language and student socio-economic status to ensure comparability.able 2 summarizes data or the schools.
Methodology Te research team spent one day visiting each school. A visit consisted o six activities.
• A general observation noting the presence o certain school acilities and whetherstudents and teachers were inside or outside the classroom;
• One hour o observation in Grade 1, 2, and 3 classrooms using the Stallingsclassroom observation instrument;
• An interview with the principal to obtain inormation on student enrollment,teachers, teacher and student attendance, support visits received by the school and
community participation at the school level;• Interviews with each o the teachers observed;• Individual student interviews; and• Administration o two reading assessments to measure print awareness and basic
literacy skills.
Table 2. Characteristics o sample schools
SCHuehuetenango
ControlHuehuetenango
SCK’iche’
ControlK’iche’
OverallSample
Number o schools 6 1 14 5 26
otal Enrollment 1,699 208 2,708 1,567 6,182Enrollment in Grade 3 368 26 442 258 1,094
Average Class Size(Grade 3)
30 26 38 32 26
Average Distance romUrban Center
43 min. n/a 47 min. n/a 45 min.
Mother ongue Mam Mam K’iche’and Ixil
K’iche’and Ixil
n/a
Years o SC Support 3 years n/a 3 years n/a 3 years
For the student survey and reading tests, the team randomly selected 20 students romGrade 3 at each school in a boy-to-girl ratio refective o the gender balance in the ullclass. Te students were rst asked a number o questions pertaining to their homeenvironment and attendance at school. Te literacy tests included CAP questions toassess pre-reading skills and student amiliarity with printed text and books and EGRA components to assess the number o letters recognized in isolation, the number o words read correctly in isolation, and the number o words read correctly in contextper minute. Te number o words read correctly per minute was used as the measure o reading fuency, a recognized and robust index o reading comprehension that reliably dierentiates between strong and poor readers as demonstrated in Matthew Jukes’ 2006study, Development o Assessments o Reading Ability and Classroom Behavior . Te letter
recognition, reading fuency, and reading comprehension assessments similar to the

7/28/2019 Using Opportunity to Learn and Early Grade Reading Fluency to Measure School Effectiveness in Guatemala
http://slidepdf.com/reader/full/using-opportunity-to-learn-and-early-grade-reading-fluency-to-measure-school 8/36
Measuring School Eectiveness: Guatemala
elements o the EGRA had been developed by a Save the Children Alliance team as parto the our country study o Rewrite the Future (Naylor et al., 2008).
Save the Children sta pilot tested additional passages or this sample by choosing grade-appropriate passages rom past editions o government-issued textbooks (passages were altered slightly to prevent the possibility o children who had seen them previously reading rom memory). Tose students who were able to read at least 40 words in therst minute were asked to nish the passage and answer our reading comprehensionquestions.
Within each school, each Grade 1, 2, and 3 classroom was observed to record time lossand time-on-task data, and a random sample o 20 Grade 3 students rom each o thesample schools was selected to be included in the reading assessments. able 3 presents
the student characteristics or this study.
Table 3. Characteristics o students in the sample
Number o Grade 3 students tested 505
Boys 50%
Girls 50%
Language spoken as mother tongue:
Spanish 11%
K’iche 34%
Mam 30%
Ixil 25%
Average age (years) 10
% over age (older than 10 years) 40%
% who attended kindergarten 73%
% who did not repeat Grade 3 88%
% who live 10 min. or less rom school 51%
% who walk 10 to 30 min. to school 39.7%% who walk more than 30 min. to school 9.5%
Average amily size 7
% o students who earn money or work 29%
% who have in their home:
-a radio 94%
-a toilet 82%
-electricity 79%
-a television 63%-a rerigerator 22%

7/28/2019 Using Opportunity to Learn and Early Grade Reading Fluency to Measure School Effectiveness in Guatemala
http://slidepdf.com/reader/full/using-opportunity-to-learn-and-early-grade-reading-fluency-to-measure-school 9/36
Te study sample consisted o an even 50 percent gender split. Te average age o students in the study was 10 with 40 percent o the sample consisting o overagestudents. Seventy-three percent o students had attended kindergarten and only 12percent o students had previously repeated Grade 3. Approximately 34 percent o students spoke K’iche as their mother tongue with an additional 30 percent speaking Mam at home and 25 percent speaking Ixil. Only 11 percent o the study sample spokeSpanish only as a mother tongue. Tere was no signicant variance in characteristicsbetween the students in the SC schools and those in the control schools. In terms o ageand mother tongue spoken, 92 percent o students ell within the ages o 9-12 regardlesso mother tongue. Moreover, the average age or students was 10 regardless o language.When dierences between gender and mother tongue were examined, the same numbero boys and girls spoke Mam; 16 more boys than girls spoke Ixil; 13 more girls than
boys spoke K’iche; and 8 more girls spoke Spanish. Tese results were statistically signicant at the (0.05) level.
Limitations o the study While the data rom this study are robust and representative o education in these SCsupported schools, there are important limitations to the methodology and data. First,while the study selected 15 percent o SC schools as the sample, the sample remainssmall in comparison to the number o schools in Guatemala. EQUIP2 is unable tomake larger assumptions about the population o schools as a whole in Guatemala.Moreover, the small school sample reduced the applicability o regression results
because small sample sizes reduce the eect. otal number o students tested was 507;100 classrooms were observed across 26 schools. Second, because o resource and timeconstraints, this study included only six control schools, which were matched to the SCschools, but again are not sucient to draw broader conclusions. Finally, many o thecountries where this study will be implemented use mother-tongue instruction to teachearly grades. However, creating reading assessments in mother tongue – particularly incountries where more than one native language exists—is complicated and expensive(i.e., Guatemala has 24 native languages in addition to Spanish, many o which are notwritten languages). All EGRA assessments were applied in Spanish language only. TeCAP was applied in both Spanish and mother tongue.
Findingso look at school-level actors we returned to EQUIP2’s opportunity to learnramework. Tis study used the 12 OL actors both individually and collectively todetermine the eectiveness o each school in the study at maximizing opportunities tolearn.
OTL Factor 1: Percentage o days the school is openTe 2005 Global Monitoring Report proposes that a quality education must start withminimum instructional time o 850-1000 hours per year. In many developing countries,these kinds o target hours are dicult to reach with school days split into shits,
which are required to achieve national coverage with limited inrastructure (Gillies and
7/28/2019 Using Opportunity to Learn and Early Grade Reading Fluency to Measure School Effectiveness in Guatemala
http://slidepdf.com/reader/full/using-opportunity-to-learn-and-early-grade-reading-fluency-to-measure-school 10/36
Measuring School Eectiveness: Guatemala
Quijada, 2008). In Guatemala, the number o ocial schools days is 180 (900 hours)and the school day is ocially ve hours in length.
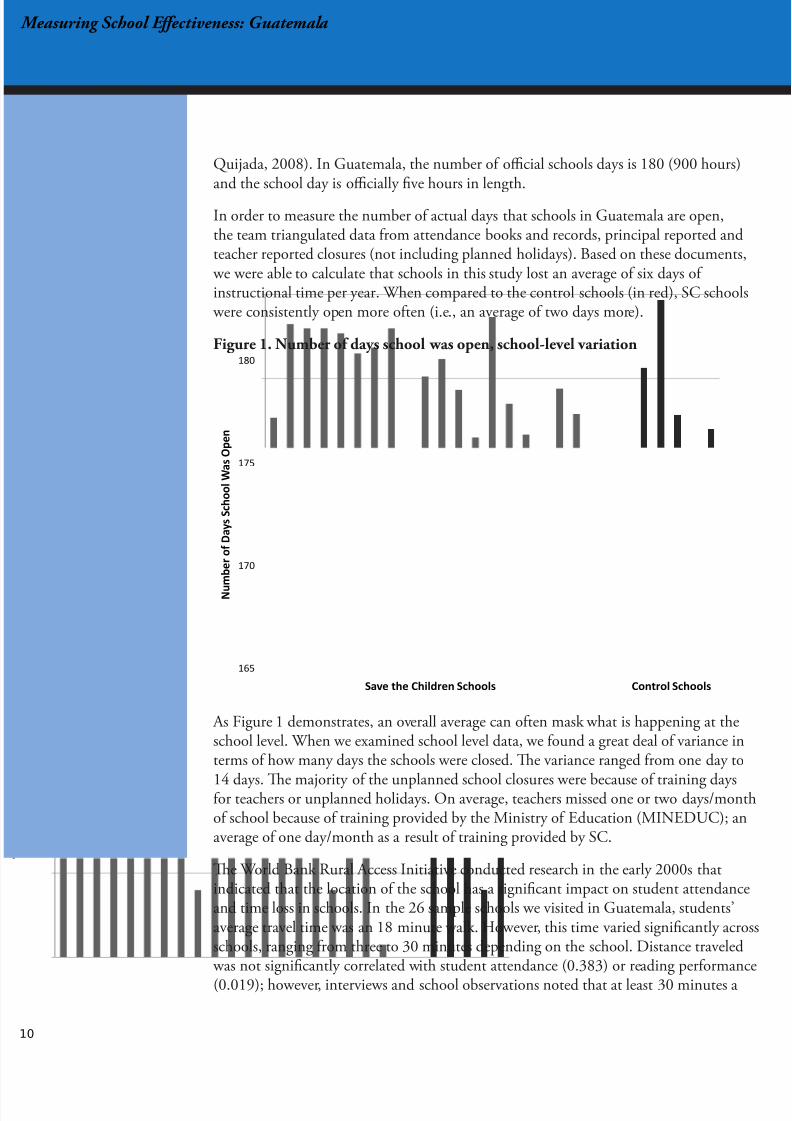
In order to measure the number o actual days that schools in Guatemala are open,the team triangulated data rom attendance books and records, principal reported andteacher reported closures (not including planned holidays). Based on these documents, we were able to calculate that schools in this study lost an average o six days o instructional time per year. When compared to the control schools (in red), SC schools were consistently open more oten (i.e., an average o two days more).
Figure 1. Number o days school was open, school-level variation
175
180
f D a y s S c h o o l W a s O p e n
165
170
N u
m b e r o
Save the Children Schools Control Schools As Figure 1 demonstrates, an overall average can oten mask what is happening at theschool level. When we examined school level data, we ound a great deal o variance interms o how many days the schools were closed. Te variance ranged rom one day to
14 days. Te majority o the unplanned school closures were because o training daysor teachers or unplanned holidays. On average, teachers missed one or two days/montho school because o training provided by the Ministry o Education (MINEDUC); anaverage o one day/month as a result o training provided by SC.
Te World Bank Rural Access Initiative conducted research in the early 2000s thatindicated that the location o the school has a signicant impact on student attendanceand time loss in schools. In the 26 sample schools we visited in Guatemala, students’average travel time was an 18 minute walk. However, this time varied signicantly acrossschools, ranging rom three to 30 minutes depending on the school. Distance traveled was not signicantly correlated with student attendance (0.383) or reading perormance
(0.019); however, interviews and school observations noted that at least 30 minutes a

7/28/2019 Using Opportunity to Learn and Early Grade Reading Fluency to Measure School Effectiveness in Guatemala
http://slidepdf.com/reader/full/using-opportunity-to-learn-and-early-grade-reading-fluency-to-measure-school 11/36 1
day (on average) o instructional time was lost when teachers and students arrived late atthe schools, which delayed the initiation o the school day.
OTL Factor 2: Teacher attendance A measure that is dicult to quantiy, teacher absenteeism is a widely recognizedproblem—particularly in rural areas. High rates o teacher absenteeism is associatedwith a number o actors, including poor, urban communities; limited monitoring anddiscipline by school directors; inrequent school inspections; and distance rom thebranch MINEDUC oce (Rogers, et al., 2004 as cited in Gillies and Quijada, 2008).eacher absenteeism aects the motivation o students, continuity o learning, ability tocover curricula, and the overall quality o learning. I students are to learn, it is criticalthat teachers be in the classroom.
In Guatemala, teacher absenteeism data was dicult to collect and an averageabsenteeism rate had to be triangulated between the principal log book and the teachers’student absenteeism logs across the seven months that the schools had been opened. Onaverage across the 26 schools, teachers were absent two days a month, or approximately 11 percent o the year. Tere was little variance across the schools in terms o teacherabsenteeism (i.e., one to ve days). Tis absentee rate is consistent with a study conducted by Chaudhury (2005), which showed teacher absenteeism rates ranging rom11 to 27 percent in countries such as Bangladesh, Ecuador, India, Indonesia, Peru, andUganda. Tere was no documented dierence in teacher attendance between the SC andcontrol schools.
OTL Factor 3: Student attendance Student attendance is another actor that is critical to improved learning. I the studentis not present and ready to learn, he or she cannot take advantage o opportunitiesto learn. Similar to teacher absenteeism, there are ew studies that have been able toquantiy student absenteeism because school and teacher records tend to be sparse.
An AED project evaluation study in Guatemala ound that children who were promotedrom Grade 1 to 2 had a signicantly higher attendance and punctuality record thanthose who did not pass (Chestereld as cited in Gillies and Quijada, 2008). Te data
collected by this study indicates that across the sample schools, students were presentmore than 98 percent o the school year. Because most students traveled only 15-18minutes to school every day, the high student attendance rate could be because o theclose proximity o the school to the students’ homes.
Te analysis o variance or student absenteeism under the current study showed that thedierence in attendance rates by school was statistically signicant (p<0.01). Te averagenumber o days lost per student over the school year ranged rom three to 31 days whichrepresents between 2 and 17 percent o the total learning time available to them.
OTL Factor 4: Percentage o school day available or instruction
Te ocial school day in Guatemala begins at 7:30 a.m. and ends at 12:30 p.m. Acrossalmost all the schools that were visited, classes did not begin until 8 a.m. Principals and

7/28/2019 Using Opportunity to Learn and Early Grade Reading Fluency to Measure School Effectiveness in Guatemala
http://slidepdf.com/reader/full/using-opportunity-to-learn-and-early-grade-reading-fluency-to-measure-school 12/36
Measuring School Eectiveness: Guatemala
teachers interviewed indicated that classes were not planned to start until 8:00 a.m., andin several cases teachers arrived later than the students. On average, 24 o the 26 schools
lost 30 minutes at the beginning o the day waiting or teachers and/or students to arriveat the school. While there was not a signicant correlation between distance traveledto school and ocial start times, interviews with teachers and school directors clearly indicated that the late start was a result o the distance students had to travel—and thatthey consistently arrived late.
In addition to the late start, recess—normally scheduled or 30 minutes—ran overtime between ve to 30 minutes depending on the school. Te average extra time orrecess across the sample was 20 minutes. When counted together with actual recess, thisrepresents an average loss o 50 minutes o class time. While EQUIP2 is not advocating or removing recess time, it is important to note that recess is lost instructional time
and when it extends beyond its planned 30 minutes, lost instructional time is increased.I the average time taken or recess is then aggregated with a 30 minute late start,and an average 15 minute early close to the school day or the purposes o classroommanagement (i.e., cleaning blackboards, straightening the room) activities, the useableinstructional time has been reduced by more than an hour. Over the course o the year,this daily lost time adds up to an average total loss o 38 instructional days (See AnnexIII or calculations). Again, the variation in time loss ranged rom a low o 23 days to a high o 75 days.
OTL Factor 5: Percentage o student time-on-task
For the purposes o this study, measured time on task reers to the engaged time thatstudents are paying attention to materials with instructional goals; time on specicacademic activities; and academic learning time, compared to the allocated time or eachsubject. In Guatemala, total instructional time in one day is ve hours, 180 days peryear, or a total o 900 hours.
Using the Stallings classroom observation instrument, the EQUIP2 team observed 100Grade 1, 2, and 3 classrooms to document how teachers were using instructional timeand whether teachers and students were engaged in learning activities. It should benoted that the Stallings classroom observation instrument measures the percentage o time the teacher is engaged in a task. However, or students, it measures the percentage
o students that are engaged in activities over the course o the observation period. Teollowing analysis presents the ndings o this study.
Classroom instructional use o timeTe Stallings classroom observation instrument considers both teachers and students as“o task” when they are not engaged in academic learning activities. O-task activitiesinclude discipline, classroom management, socializing, unengaged in the activity, or when out o the room. On-task activities include: reading aloud, demonstration/lecture,discussion/debate, practice/drill, seatwork, verbal instructions, reading silently, andinterpreting text.
When examining variation across the 26 schools, we ound some variance in terms o the percentage o time that teachers were on task, though it was not signicant. Overall

7/28/2019 Using Opportunity to Learn and Early Grade Reading Fluency to Measure School Effectiveness in Guatemala
http://slidepdf.com/reader/full/using-opportunity-to-learn-and-early-grade-reading-fluency-to-measure-school 13/36 1
teachers were on task 70 percent o the time with the range o time-on-task running between 53 and 85 percent. Tere was no statistical dierence between the SC andcontrol schools in terms o teachers and students on task.
Figure 2 demonstrates the variations in time on task by school, teachers and students. In16 schools, teachers were on task more than 70 percent o the time and in ve schoolsteachers were on task at least 80 percent o the time. In these cases, 14 schools hadstudents who were on task at least 50 percent o the time. In ve cases, students wereon task or a larger percentage o time than teachers. While the teacher time-on-task isreasonable, student time-on-task is still low in most o the sample schools, particularly because in many cases students are on task only 50 to 60 percent o the time they are inclass, which is already signicantly reduced because o daily time loss and absenteeism.
By comparison, U.S. teachers reported that only 64 percent or instructional time wasrelated to academics—the remainder being used in maintenance, enrichment and recess.(Massachusetts 2002 Research Digest as cited in Gillies and Quijada, 2008). However,in the United States, daily time loss and absenteeism are less o an issue, which increasesthe number o overall days students have or instruction.
Te result o this analysis indicates that teachers in the sample schools could useadditional support with classroom management as well as use o instructional time oracademic learning.
Figure 2. Percentage o students on task when teacher was on task, by school
o l s
p l e S c h
Student on Task
i d
u a l S a
I n d i
0% 10% 20% 30% 40% 50% 60% 70% 80% 90%
Percentage of Students On Task
Teacher o task and on task
Based on observations in this study, on average when teachers were o task, 68 percento students were also o task (i.e., engaged in social interaction or just not engaged).

7/28/2019 Using Opportunity to Learn and Early Grade Reading Fluency to Measure School Effectiveness in Guatemala
http://slidepdf.com/reader/full/using-opportunity-to-learn-and-early-grade-reading-fluency-to-measure-school 14/36
Measuring School Eectiveness: Guatemala
When the teacher was on task, on average only 32 percent o students were o task.However, while teacher on and o task was positively correlated to student perormance,
the results were not statistically signicant. It is important to note that being on-task does not necessarily mean that quality teaching and learning is occurring in theclassroom. Te category simply implies that teachers and students were engaged inacademic activities. While the team was interested in the correlations among time-on-task and student perormance, it was also critical to document the amount o time being lost in the classroom and understand what the teachers were doing to engage students inacademic activities.
Figure 3 indicates that when teachers were o task, students read silently (2 percent);copied text rom the blackboard (7 percent); or did seatwork (23 percent). Te rest o the students (68 percent) were either engaged in social interaction or some other “non-
academic” activity.
Figure 3. Student activities when teacher was o task
Read Out Loud
Discussion
Demonstration
i v i t y
Seatwork
Practice
d e m i c A c
Verbal Instr
Copying
p e o f A c a
Reading Silently
T y
0% 5% 10% 15% 20% 25%
Interpretation
Percenta e of Students En a ed in Activi t
Figure 4. Student activities when teacher was on task.
Read Out Loud
Discussion
Demonstration
i v i t y
Seatwork
Practice
e m i c A c t
Copying
e o f A c a
Reading Silently
Verbal Inst T y
0% 5% 10% 15% 20%
Interpretation
Percentage of Students Engaged in Activity
When the teacher was on task and working with students to present or oversee academicactivities, there was a greater variation in the types o pedagogical approaches being employed by the teacher, and more students engaged in learning. As Figure 4 indicates,

7/28/2019 Using Opportunity to Learn and Early Grade Reading Fluency to Measure School Effectiveness in Guatemala
http://slidepdf.com/reader/full/using-opportunity-to-learn-and-early-grade-reading-fluency-to-measure-school 15/36 1
students still spend more time doing seatwork than other types o activities; however,there is increased discussion or debate in the classroom that is related to academiccontent as well as reading aloud and demonstration.
Time-on-task by department and subject In an eort to understand whether time on task diered by region, we disaggregatedthe results by areas visited (i.e., Nebaj, Huehuetenango, and K’iche’). able 4 presents a synthesis o the percentage o students on task by subject and geographical area.
Table 4. Percentage o on-task students by subject and department
Department Math Science Reading
Huehuetenango 51% 52% 53%
Nebaj 47% 36% 45%K’iche’ 49% 61% 44%
Students in Huehuetenango had little variation in terms o their time on task acrosssubjects. In Nebaj and K’iche’, there was more variation in the engagement o studentsin science classes. Tere were also dierences in the types o pedagogical activities linkedto each subject. For math, students were engaged in more practice and drill activities. Inscience, the majority o students’ time-on-task was spent in demonstration and lecture.For reading, students spent most o their engaged time doing seatwork or copying.Tese categories did not vary when disaggregated by department.
When researchers examined the total time let or instruction when students wereon task (i.e., accounting or all previous OL indicators); Huehuetenango had themost instructional time let at 66 days compared to 55 days in Nebaj and 48 days inK’iche’. While students in K’iche’ spend more time on task by subject than Nebaj, it isimportant to note that there is greater time loss in K’iche’ accounted or by the otherOL actors, such as absenteeism and daily time loss caused by late starts, recess, andearly close.
Time-on-task by gradeAter examining time-on-task by subject and department, the team wanted to
understand whether there were any dierences in teacher and student time-on-task by grade. As able 5 shows, there is little variation in the types o pedagogical activitiesacross the grades.
As indicated in able 5, the majority o academic learning time is spent copying textrom the blackboard or doing seatwork. Te percentage o engaged students declinesacross all activities (except copying, which increases in Grade 3). Te percentage o students o task also increases as students get urther along in their education. Over theentire sample it was ound that students were o task an average o 41 percent o thetime, which represents a drastic reduction in the time used or learning.

7/28/2019 Using Opportunity to Learn and Early Grade Reading Fluency to Measure School Effectiveness in Guatemala
http://slidepdf.com/reader/full/using-opportunity-to-learn-and-early-grade-reading-fluency-to-measure-school 16/36
Measuring School Eectiveness: Guatemala
Table 5: Percentage o students engaged in academic activities, by grade
Activity Grade 1 Grade 2 Grade 3Reading Out Loud 6% 3% 3%
Demonstration and Lecture 6% 6% 6%
Debate/Discussion 6% 8% 7%
Practice and Drill 6% 4% 4%
Seatwork 24% 22% 18%
Copying 5% 5% 9%
Verbal Instruction 4% 8% 7%
Students Reading 0% 1% 0.4%
Interpreting ext 0% 0% 0%
Students O ask 40% 41% 44%
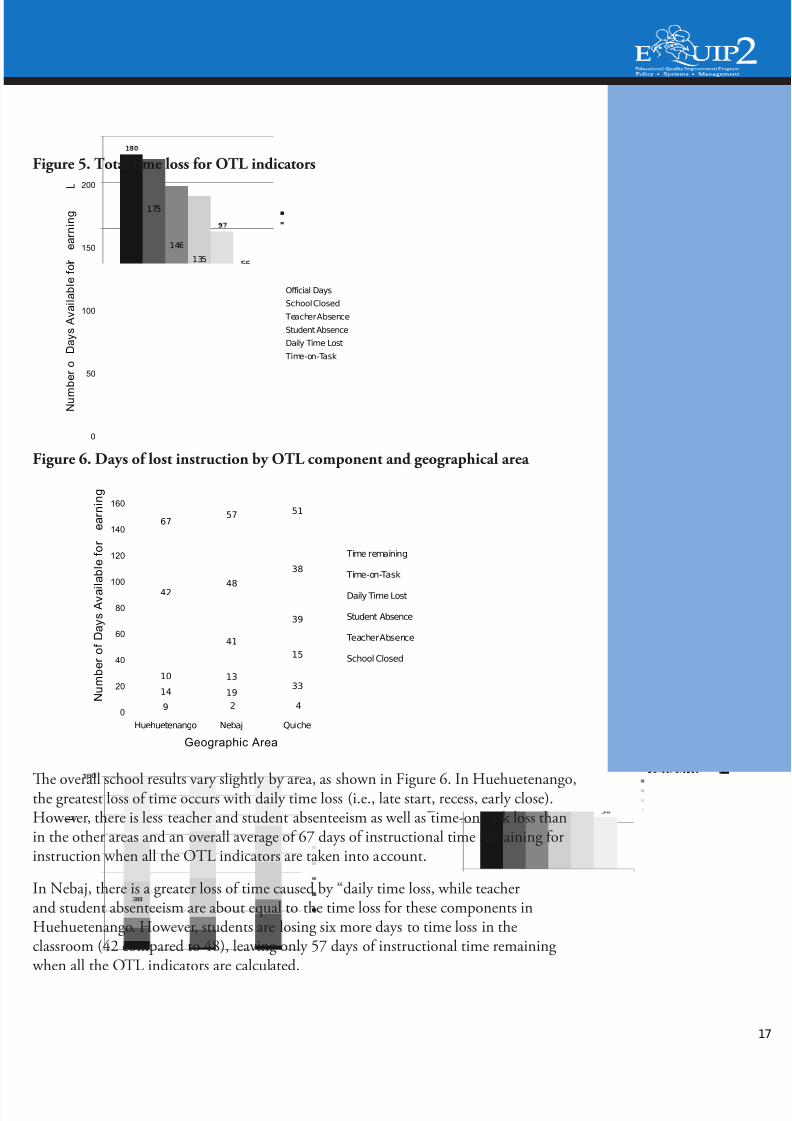
Time loss caused by students and teachers o task Out o the 180 ocial instructional days, students are only receiving an average o 97days o instruction ater accounting or days the school is closed, late start, extendedrecess, early close, and teacher/student absenteeism (44 percent loss o time annually). When the additional time loss within the classroom caused by students and teachers who are o task is calculated, there are approximately 56 days let o instructional timespent on task that students receive annually.
OTL Factor 6: Equivalent percentage o days available or instructionIn this study, researchers combined actors 1-5 into a actor termed “equivalentpercentage o days or instruction” (Factor 6). Te objective was to compare the amounto time actually available or instruction to the amount o time potentially availablebased on the ocial school calendar.
o estimate the number o days available or instruction, researchers subtracted thenumber o days the school was closed, the number o days lost because o teacher andstudent absence, the amount o instructional time lost because o late openings/early
closes/extended recesses, and the number o days lost because students were o task rom the number o days in the school calendar (180 days). Figure 5 shows the totaltime loss or the OL actors in Guatemala.
In Guatemala, the greatest loss o instructional time occurs rom the late start, early close, and extended recess—or daily time loss. Tis was true or both the SC and thecontrol schools in the sample. O the 180 ocial instructional days, students are only receiving an average o 97 days o instruction (44 percent loss o time annually). Whenthe total time was disaggregated by SC and the control schools, SC perormed slightly better with 61 days o total instructional time compared with 51 days in the controlschools.
7/28/2019 Using Opportunity to Learn and Early Grade Reading Fluency to Measure School Effectiveness in Guatemala
http://slidepdf.com/reader/full/using-opportunity-to-learn-and-early-grade-reading-fluency-to-measure-school 17/36 1
Figure 5. Total time loss or OTL indicators200
175
146150 e a r n i n g
135
i l a b l e f o r
Official Days
SchoolClosed100
D a y s A v a
Teacher Absence
Student Absence
Daily Time Lost
Time-on-Task
50
N u m
b e r o
0 Figure 6. Days o lost instruction by OTL component and geographical area
6757 51
140
160
e a r n i n g
48
38
100
120
i l a b l e f o r
Time remaining
Time-on-Task
41
39
42
60
80
D a y s A v a Daily Time Lost
Student Absence
Teacher Absence
14 1933
10 13
15
20
40
N u m b e r o f
School Closed
9 2 40
Huehuetenango Nebaj Quiche
Geographic Area
Te overall school results vary slightly by area, as shown in Figure 6. In Huehuetenango,the greatest loss o time occurs with daily time loss (i.e., late start, recess, early close).However, there is less teacher and student absenteeism as well as time-on-task loss thanin the other areas and an overall average o 67 days o instructional time remaining orinstruction when all the OL indicators are taken into account.
In Nebaj, there is a greater loss o time caused by “daily time loss, while teacherand student absenteeism are about equal to the time loss or these components inHuehuetenango. However, students are losing six more days to time loss in theclassroom (42 compared to 48), leaving only 57 days o instructional time remaining when all the OL indicators are calculated.

7/28/2019 Using Opportunity to Learn and Early Grade Reading Fluency to Measure School Effectiveness in Guatemala
http://slidepdf.com/reader/full/using-opportunity-to-learn-and-early-grade-reading-fluency-to-measure-school 18/36
Measuring School Eectiveness: Guatemala
Te schools in the area o K’iche’ had the highest teacher absenteeism rate o the threeareas and are losing almost 39 days o instruction because o late starts, extended recesses
and early closings o the school. Tis area retains the least number o instructional days:51.
Across the three areas, an increased ocus on ensuring that school started on time andthat recess only ran or 30 minutes (i.e., instead o 15-20 minutes longer) would add anaverage o 4.5 additional hours a week o instructional time, or almost 33 days over theschool year.
At the school level, there was greater variation in the components o the opportunity tolearn. Schools varied in the time remaining or instruction rom 32 to 82 days. Daily time loss and time lost to time-on-task were the two areas where the major losses o time
occurred. Te chart below shows the time loss by school.
As Figure 7 illustrates, schools varied signicantly in time loss or the rst our actors.Instructional time remaining ranged rom a low o 56 days to a high o 129 days, withthe daily time loss generally having the greatest impact on eective time remaining orinstruction.
Figure 7: School-level variation
S c h o o l s
School Closed
Teacher Absence
u a l S a m p l
Student Absence
Daily Time Lost
- -
I n d i v i d
Time remaining
0 20 40 60 80 100 120 140 160 180
Number of Days Available for Learning
In addition to the snapshot tool used to collect inormation on classroom activitiesand time on task, the research team designed a general observation instrument basedon the Guatemalan standards or what teachers and students should be doing in theclassrooms. For example, teachers were rated on their ability to manage time eectively,their classroom management skills, and the manner in which they engage students inlearning. For each activity or competency, teachers were rated on a scale o zero to three:zero meaning the activity was not observed; one i the teacher executed the activity poorly; two or somewhat well, and three or very well.
In terms o the pedagogical skill level o teachers through the overall sample, the averagescore or classroom management skills, time management skills, and or the use o

7/28/2019 Using Opportunity to Learn and Early Grade Reading Fluency to Measure School Effectiveness in Guatemala
http://slidepdf.com/reader/full/using-opportunity-to-learn-and-early-grade-reading-fluency-to-measure-school 19/36 1
dierent instructional resources was 2, or somewhat well. Overall, teachers were rarely observed teachers engaging students in activities to develop problem solving skills or
higher order and critical thinking skills. eachers were also more likely to be observedgiving students eedback, or supervising seatwork. Students are rarely led in reading activities (0.87) or asked to use their reading skills to assimilate inormation in othersubjects (0.23). Te study shows that teachers need more support to build connectionsbetween the dierent subjects they are teaching, and to help students connect theirlearning to their own lie experiences and problems. Te activities with the highestaverages included eective use o dierent instructional resources and strategies (1.74);asking students probing and open-ended questions (1.59); providing students with theopportunity to voice and debate their own opinions (1.03); engaging the teacher inopen-ended discussions and asking questions about content (0.95).
OTL Factor 7: Percentage o Students with a Textbook As Figure 8 demonstrates, classroom observations revealed a great deal o variation inthe percentage o students who have language arts books. Te range went rom 0 to 123percent, indicating the school had more books than students. Nearly 100 percent o students in all the schools had notebooks and pencils. In terms o notebooks, only threeschools indicated less than 95 percent o students with notebooks. In terms o pencils/pens, seven SC schools ell under the 95 percent threshold and could use additionalsupport in the provision o these types o materials to students.
Figure 8: Percentage o reading textbooks by schools
60
80
100
120
140
y s A v a i l a b l e f o r L e a r n i n g
0
20
40
1 2 3 4 5 6 7 8 9 10 11 12 13 14 15 16 17 18 19 20 21 22 23 24 25 N u m b e r o f D
SC Schools Control Schools
Materials, urniture, and school environment Materials relate to a broad category o items such as textbooks, instructional guides,workbooks, audio-visual materials, and supplementary readers in libraries, classrooms,or homes. O these, textbooks are the most commonly utilized, or at least studied anddocumented, input or classroom instruction (Gillies and Quijada, 2008).
As part o this study the team conducted school observations, classroom observations,and interviewed principals about the availability o materials (i.e., textbooks, pencils,
pens, notebooks) and urniture in their school. When principals were asked to reporton the availability o chairs, desks, and reading materials at their schools, 64 percent

7/28/2019 Using Opportunity to Learn and Early Grade Reading Fluency to Measure School Effectiveness in Guatemala
http://slidepdf.com/reader/full/using-opportunity-to-learn-and-early-grade-reading-fluency-to-measure-school 20/36
Measuring School Eectiveness: Guatemala
reported that their schools had enough basic urniture or all o their students. For SCschools, 68 percent o principals reported having enough basic urniture. For the schools without enough urniture, 79 percent had only hal or less than hal o the necessary
amount o chairs and desks needed or their students.
When the schools were disaggregated by SC and control, SC schools were able toprovide 74 percent o students with textbooks compared to 52 percent at the controlschools, though it was not always clear whether the books on the shelves werebeing used. Te better perormance by SC schools is supported by the act that SCinterventions ensure schools have sucient materials to support student learning. able6 provides a summary o the percentage o students who have each o the types o materials available in the classroom.
Table 6. Percentage o students with learning materials, disaggregated by Save the
Children and Control schoolsLanguage Arts
extbooks Notebooks Pencils
Save the Children 74% 98% 95%
Control 52% 99% 96%
Combined Average 70% 98% 95%
OTL Factor 8: Percentage o Observed Textbook Use Few students were observed using textbooks in Guatemala, with a great deal o variation
among schools. Figure 9 combines OL actors 7 and 8 to show how textbook availability and use were interrelated in the schools studied. Te vertical axis plots thepercentage o observations during which textbook use was noted and the horizontalaxis plots the percentage o students with a language arts textbook. Each data pointrepresents a school.
Figure 9. Percentage o students observed using a textbook or a given level o textbook availability
6%
8%
10%
12%
14%
16%
d e n t s O b s e r v e d U s i n g T e x t b o o k s
0%
2%
4%
0% 10% 20% 30% 40% 50% 60% 70% 80% 90% 100%
P e r c e n t a g e o f S t u
Percentage of Students with Textbooks

7/28/2019 Using Opportunity to Learn and Early Grade Reading Fluency to Measure School Effectiveness in Guatemala
http://slidepdf.com/reader/full/using-opportunity-to-learn-and-early-grade-reading-fluency-to-measure-school 21/36 2
It is interesting to note that the majority o data points or schools in Guatemala clusterin the lower-right side o the graph. Tis indicates high textbook availability in a schoolwas associated with relatively low observed textbook use.
OTL Factor 9: Percentage o Time Spent Reading Classroom observations revealed that reading instruction was almost nonexistent.Students were rarely observed reading aloud, reading silently, or interpreting text. Tisoccurred less than 12 percent o the time in Guatemala.
While more than 90 percent o students in the study had access to language artstextbooks, researchers rarely observed textbook use in class. Reading passages and storieswere easy to locate, but were rarely in the mother tongue. In act, the only schoolspossessing Mayan story books were those supported by Save the Children, and eventhen these books were usually locked in the principal’s oce. No structured approach to
reading was observed in any classroom in this study.
OTL Factor 10: Grade 3 Reading Fluency Reading ability is both an outcome o opportunity to learn and is a critical actordetermining whether students can continue to learn and advance through school. I students do not acquire an adequate level o reading ability early on in their schooling,they all urther and urther behind, thus their continued opportunity to learn dependson their level o reading ability.
Given the lack o ocus on reading and reading instruction, it was not surprising to nd
reading perormance among students in Grade 3 was low, averaging 47 wpm. However,approximately 30 percent o students were able to read 60 wpm or better and 19 percento students could read 70 wpm or more; 33 percent were between 41-60 wpm; and only 35 percent were below 40 wpm (see Figure 10). Research conducted by Helen Abadzi(2008) suggests that students learning English or Spanish should be able to read 80–90wpm by Grade 3.
Figure 10. Reading fuency results or all students, percentage o students who canread
Zero wpm
Between 10 and 20 wpm
Up to 10 wpm
l u e n c y
Between 30 and 40 wpm
Between 20 and 30 wpm
R e a d i n g F
Between 50 and 60 wpm
Between 40 and 50 wpm
L e v e l o f
More than 70 wpm
Between 60 and 70 wpm
0% 5% 10% 15% 20%
Percentage of Students
7/28/2019 Using Opportunity to Learn and Early Grade Reading Fluency to Measure School Effectiveness in Guatemala
http://slidepdf.com/reader/full/using-opportunity-to-learn-and-early-grade-reading-fluency-to-measure-school 22/36
Measuring School Eectiveness: Guatemala
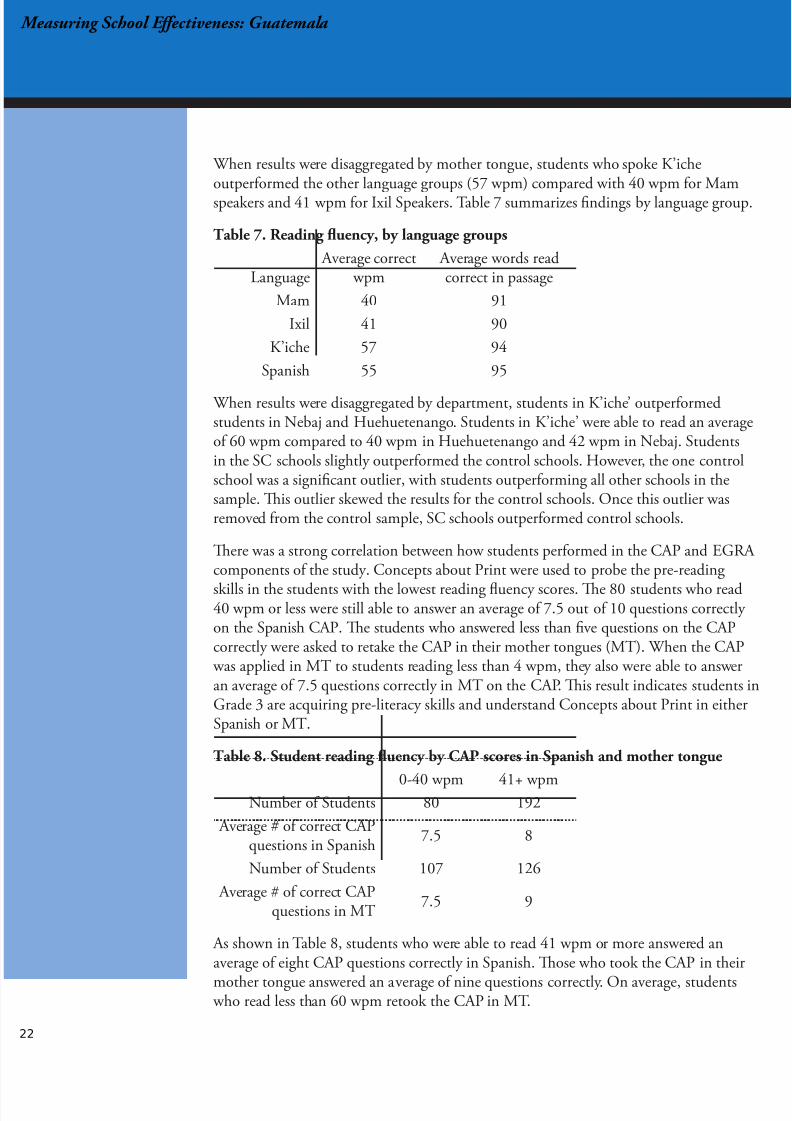
When results were disaggregated by mother tongue, students who spoke K’icheoutperormed the other language groups (57 wpm) compared with 40 wpm or Mamspeakers and 41 wpm or Ixil Speakers. able 7 summarizes ndings by language group.
Table 7. Reading fuency, by language groups
Language Average correct
wpm Average words read
correct in passage
Mam 40 91
Ixil 41 90
K’iche 57 94
Spanish 55 95
When results were disaggregated by department, students in K’iche’ outperormedstudents in Nebaj and Huehuetenango. Students in K’iche’ were able to read an averageo 60 wpm compared to 40 wpm in Huehuetenango and 42 wpm in Nebaj. Studentsin the SC schools slightly outperormed the control schools. However, the one controlschool was a signicant outlier, with students outperorming all other schools in thesample. Tis outlier skewed the results or the control schools. Once this outlier wasremoved rom the control sample, SC schools outperormed control schools.
Tere was a strong correlation between how students perormed in the CAP and EGRA components o the study. Concepts about Print were used to probe the pre-reading
skills in the students with the lowest reading fuency scores. Te 80 students who read40 wpm or less were still able to answer an average o 7.5 out o 10 questions correctly on the Spanish CAP. Te students who answered less than ve questions on the CAPcorrectly were asked to retake the CAP in their mother tongues (M). When the CAP was applied in M to students reading less than 4 wpm, they also were able to answeran average o 7.5 questions correctly in M on the CAP. Tis result indicates students inGrade 3 are acquiring pre-literacy skills and understand Concepts about Print in eitherSpanish or M.
Table 8. Student reading fuency by CAP scores in Spanish and mother tongue
0-40 wpm 41+ wpmNumber o Students 80 192
Average # o correct CAPquestions in Spanish
7.5 8
Number o Students 107 126
Average # o correct CAPquestions in M
7.5 9
As shown in able 8, students who were able to read 41 wpm or more answered anaverage o eight CAP questions correctly in Spanish. Tose who took the CAP in their
mother tongue answered an average o nine questions correctly. On average, students who read less than 60 wpm retook the CAP in M.

7/28/2019 Using Opportunity to Learn and Early Grade Reading Fluency to Measure School Effectiveness in Guatemala
http://slidepdf.com/reader/full/using-opportunity-to-learn-and-early-grade-reading-fluency-to-measure-school 23/36 2
When the team examined the number o reading comprehension questions studentswere able to correctly answer, 52 percent o students who read 40 wpm or less answeredtwo reading comprehension questions correctly. O the students who read more than40 wpm correctly, 46 percent answered two reading comprehension questions correctly and 45 percent answered all three questions correctly. Tese results indicate that whilestudents are reading slowly, they do seem to understand what they read and are thereoreacquiring a basic level o reading fuency.
able 9 identies the best- and lowest-perorming schools. As the table demonstrates, allbut one o the top perorming schools were SC-supported schools with reading fuency scores that ranged rom 59-67 wpm. Students in this group were able to answer two tothree reading comprehension questions correctly, and on average completed reading the
entire paragraph with 94 percent accuracy.
Table 9. Top and lowest perorming schools
opPerorming
Schools Average
wpm% notreading
SC orControl
Yearssupportedby SAVE SC Supporta
11 67 0% C n/a n/a
2 67 0% S 3 1,2,4,5
3 64 0% S 5 1,3,4,5
4 59 0% S 3 1,3,4,5
5 59 0% S 3 1,3,4,5
LowestPerorming
Schools Average
wpm% notreading
SC orControl
Yearssupportedby SAVE SC Supporta
1 25 10% S 3 1,2,4,5
2 26 20% C n/a n/a
3 33 0% S 3 1,2,4,5
4 34 0% S 3 1,2,4,5
15 37 15% S 3 1,2,4,5a. SC interventions are as ollows: 1) pre-primary support (materials, pedagogy, technical Assistance); 2)primary support Grades 1-6 (materials, pedagogy, technical assistance); 3) primary support Grades 1-3(materials, pedagogy, technical assistance; 4) teacher training; 5) community involvement.
Students in the lowest perorming schools were unable to reach the 40 wpm thresholdwith the Grade 3 text and had several students who were unable to read at all. Whenthe students in this group were dropped to an easier text—Grade 2, Unit 4—theirperormance on the reading fuency did not improve, indicating the students werestruggling with the undamentals o reading in general.

7/28/2019 Using Opportunity to Learn and Early Grade Reading Fluency to Measure School Effectiveness in Guatemala
http://slidepdf.com/reader/full/using-opportunity-to-learn-and-early-grade-reading-fluency-to-measure-school 24/36
Measuring School Eectiveness: Guatemala
Understanding variations in student outcomes—individual actorso try and understand the variations in reading perormance both at the aggregate level(i.e., by area) and individual student level, the team examined individual actors such asgender, age, repetition rates, mother tongue language, and socio-economic indicators.
Gender and ageTere was no signicant correlation between the age o the student and perormanceon the reading assessments, though students between the ages o 10-12 tended to havehigher fuency scores. Repetition rates were also generally not statistically signicantagainst reading fuency.
Gender was also not signicantly correlated with reading outcomes. However, girlsoutperormed boys on the reading fuency assessment. On average, girls read 49 wpmcorrectly compared to 46 wpm or boys. wenty-ve percent o girls read up to 32 wpmcorrectly; 50 percent read at least 49 wpm correctly; and 75 percent or more read 67 wpm correctly, compared to 29 wpm, 46 wpm, and 62 wpm, respectively, or boys.
Socioeconomic indicatorsData gathered to determine the children’s socioeconomic status included inormationabout the type o roo, walls, and foors and the number o rooms children had in theirhomes, the number o children and adults living in the home, and whether amilieshad basic utilities such as a radio, electricity, or a toilet. Te dierences ound or eachcategory were minimal. More than 90 percent o the students attending SC schools had
either tile or metal roos, 80 percent had adobe or cinderblock walls, and 60 percenthad dirt foors. Only 22 percent o children had a rerigerator, while the majority o the sample reported having a radio, electricity, a television, and a toilet. Tere was littlevariation across the sample.
Similar to children attending SC schools, 90 percent o children in the control schoolshad tile or metal roos, 75 percent had adobe or cinderblock walls, and 50 percent haddirt foors. Over 80 percent o children reported having electricity, a radio, and a toiletinside their home.
Language
Te language spoken in the students’ homes was the main actor that was correlated with students’ perormance on the reading fuency assessments.
Spanish most oten served as the language o instruction within the Grade 3 classroomsincluded in the sample. However, or many children in this study, Spanish was notthe language spoken in the home. Only 11 percent o students reported that they used Spanish in their homes. Within both the overall sample and the sample o SCschools, the dierences in results or reading fuency between students speaking K’iche’and Mam, K’iche’ and Ixil, Spanish and Mam, and Spanish and Ixil were statistically signicant (see able 10).

7/28/2019 Using Opportunity to Learn and Early Grade Reading Fluency to Measure School Effectiveness in Guatemala
http://slidepdf.com/reader/full/using-opportunity-to-learn-and-early-grade-reading-fluency-to-measure-school 25/36 2
Table 10. Reading fuency o students by language
K’iche’ Mam Ixil SpanishOverall 57 41* 42* 55
Save the Children 53 42* 40* 52
Control 52 42* 41* 53* = average student wpm correct signicantly lower than average among both K’iche’ and Spanish groups.
In the overall sample, on average students who spoke K’iche’ at home had a reading score o 57 wpm. Tose who spoke Spanish scored an average o 55 wpm, whilethose who spoke Ixil and Mam read an average o 41 wpm, respectively. As previously discussed, schools in the K’iche’ area were closer to urban centers, so researchers
speculate that students might have access to more print materials in Spanish than in theother regions.
Te average reading scores by mother tongue or children within SC schools dieredonly slightly rom the overall sample and were also statistically signicant (p<.000). Onaverage K’iche’ and Spanish speakers’ scores were very close: 53 and 52, respectively.Mam speakers scored slightly higher than Ixil speakers: 42 and 40, respectively.
Te dierences in results or the reading fuency scores by mother tongue or the controlschools were also statistically signicant (p<.000). Children who spoke Mam andSpanish at home had the highest average reading score (59), while children who spoke
Ixil and K’iche’ at home had the lowest score. O the children who spoke only Spanish,K’iche’, Mam, or Ixil at home, Spanish speakers’ average reading score was almost thesame as those speaking K’iche’ (53 and 52, respectively). Te average reading score orchildren who spoke Ixil was just below those who spoke Mam (41 and 42, respectively).
AttendanceTere was also a correlation between student absenteeism and perormance on thereading assessments, but the correlation was not statistically signicant. Students whowere absent more oten perormed worse on the reading assessment. While age was notcorrelated with student reading perormance, Grade 2 absentee rates were negatively correlated and signicant at the (.005) level. For each additional day the student missed
in Grade 2, there was a 0.125 drop in correct words per minute.
OTL Factor 11: Class Size While class sizes in the study varied signicantly—ranging rom 10 to 55 in Grades1 through 3—more than two-thirds o classrooms had ewer than 30 students. Teaverage class size across the 26 schools was 27 students per teacher. When the data was correlated with the results or the reading assessment, average class size had norelationship with student reading fuency or perormance on the CAP. However, we didnd that larger schools perormed better on the reading assessment, though it was alsonot statistically signicant. We speculate that larger schools perormed better due to
their proximity to urban areas and thereore, more access to print materials. However,

7/28/2019 Using Opportunity to Learn and Early Grade Reading Fluency to Measure School Effectiveness in Guatemala
http://slidepdf.com/reader/full/using-opportunity-to-learn-and-early-grade-reading-fluency-to-measure-school 26/36
Measuring School Eectiveness: Guatemala
there was also no signicant correlation between class size and distance o schools rom a town district.
OTL Factor 12: School Support In principle, government systems o education provide ongoing training andsupervision/support or teachers. However, as the EQUIP2 complementary educationresearch (2007) demonstrated, regional or district education support personnel rarely i ever visit all the schools in their jurisdictions, especially those in the most remote partso the country.
As able 11 indicates, the schools and teachers in this study are being visited andobserved by either principals or external school support personnel. In terms o ormal
observations, 48 percent o principals indicated they never ormally observed theirteachers. However, nearly 76 percent o principals indicated that they did inormally observe teachers at least once or twice a month. Te nature o these inormalobservations included veriying teachers were ollowing their lesson plans; veriying student attendance; and veriying teachers were ollowing the methodologies they hadbeen asked to use in the training program.
Table 11. Characteristics o school support services
Overall SC
Formal Principal Observations o eachers:
Never 48% 53% Weekly or wice per Month 32% 15%
Inormal Principal Observations o eachers:
Never 8% ---
Weekly or wice per Month 76% 74%
Principal Reviews Lesson Plans Weekly 58% 58%
Principal Meets Individually with eachers:
Never 27% ---
Daily, Weekly, or wice per Month 40% 56%
Principal Meets with Groups o eachers Daily, Weekly, or wice per Month
60% ---
School Support Visits rom External Stakeholders:
Once per Month 45% 100%
wice per Month 19% ---
Once per Year/Never 10% ---
In addition to ormal and inormal observations, 58 percent o principals indicatedthat they reviewed teachers’ lesson plans weekly. Principals also indicated that they met
individually with teachers daily, weekly, or twice a month. Principals in the SC schools

7/28/2019 Using Opportunity to Learn and Early Grade Reading Fluency to Measure School Effectiveness in Guatemala
http://slidepdf.com/reader/full/using-opportunity-to-learn-and-early-grade-reading-fluency-to-measure-school 27/36 2
met with teachers on a more regular basis (56 percent o principals had individualmeetings).
Te total number o visits that schools received by August o 2008 ranged rom zeroto 30 with 50 percent o schools within the overall sample reporting between one andseven visits this year. Forty-ve percent o schools in the overall sample reported thatthey receive support visits rom outside personnel or education ocials once a month,but ew o those visits ocused on supporting teacher’s pedagogic improvement. Another19 percent o schools reported being visited twice a month, while 10 percent said they were only visited once a semester or once a year. All but one school reported they hadbeen visited in the year o 2008; the remaining school was last visited in 2007.
Within the sample o SC schools, 100 percent o the schools reported receiving visitsrom someone rom SC; 47 percent reported an education sta member rom the localmunicipality had visited the school; and 32 percent were visited by someone romMINEDUC. By comparison, 33 percent o control schools were visited by an educationsta member rom the local municipality, 17 percent by MINEDUC, and 33 percent by other organizations. In the majority (65 percent) o cases, these visits were a surprise.
For the overall sample, the length o time that the outside personnel stayed at the schoolranged rom just one hour to a ull day (ve hours), while the majority (64 percent)o visits lasted between three to ve hours. During most visits (63 percent), personnelobserved teachers teaching, but in only about hal o the schools the visitor met with
teachers individually or in groups (50 and 46 percent, respectively). In only about 20percent o the schools did the visitors work with the principal on administration ormanagement issues (26 and 17 percent, respectively). eachers indicated they wouldlike to have the school support personnel spend more time working with them on theirpedagogical approaches because they thought this support was generally lacking.
Finally, all 25 schools reported having a school management committee (SMC), themajority o which met monthly (50 percent) or weekly (29 percent). In 65 percent o schools, the SMC met with the principal weekly or twice a semester but in terms o teachers, in the majority o schools (56 percent) the committee only met with themonce or twice a month. Eighty percent o schools reported their SMC receives specialtraining in how to support schools.
Financial support Te previous complementary education research demonstrated that when communitiescontribute to the nancial aspects o running the schools, there is a higher level o accountability or perormance expected by all stakeholders—especially the community.When researchers examined aspects o nancial support, they ound the ollowing.
• All schools within the sample report receiving nancial support rom the governmentto pay or teachers’ salaries
•
68 percent report receiving unding rom the government or materials• 48 percent report or inrastructure and only 6 percent receive unds or other
expenses

7/28/2019 Using Opportunity to Learn and Early Grade Reading Fluency to Measure School Effectiveness in Guatemala
http://slidepdf.com/reader/full/using-opportunity-to-learn-and-early-grade-reading-fluency-to-measure-school 28/36
Measuring School Eectiveness: Guatemala
• Within the sample o SC schools, 64 percent receive nancial support rom SCor materials and equipment, while only 13 percent receive unding rom SC orinrastructure
• Only nine schools in the entire sample report receiving unding rom thecommunity, support that is provided or inrastructure and other expenses such assnacks
While nancial support provided to the schools comes mostly rom the government,parents played an important role at the schools through donated labor to helpmaintain and improve the schools. Sixty-three percent o principals within the samplereported parents support the school through building and maintaining property andinrastructure. At 25 percent o schools within the sample, parents help to raise or
manage school unds.
In the complementary education research, school support services played a criticalrole in improving the eectiveness o the complementary models when comparedto government schools. While all participants indicated the importance o thissupport—even requesting additional support—none o the actors were correlated withimprovements in student learning.
ConclusionsDeveloping countries and international agencies recognize that gains in access toschooling alone are not sucient to build the human resource base needed or economic
development and are increasingly directing their attention and investment to improving learning outcomes or students. o improve learning, students must be given a basicopportunity to learn—meaning the teacher needs to be in class every day; students needto be present; they need materials to learn; and they need to spend increasing time-on-task. Tis study examined whether a sample o schools in Guatemala provides students with a basic opportunity to learn. Conclusions are presented below.
What variation is there in schools’ provision o opportunity to learnand how does actual opportunity to learn compare to potential opportunity to learn? Te potential opportunity to learn in Guatemala is approximately 180 days or 900hours o instructional time, o which students are entitled to a 30 minute recess during the school day. When the actual levels o opportunity to learn provided by the schools was examined, the team ound that students across the 26 schools were receiving approximately 56 days o solid instructional time on task—a loss o almost 70 percent o instructional time resulting rom actors such as unexpected school closings, daily timeloss, absenteeism, and unocused time-on-task. Te greatest loss o time in all 26 schools was a result o classes starting late – an average o 30 minutes per day; extended recessthat tended to run 15-20 minutes longer than planned; and early close or classroommanagement activities.

7/28/2019 Using Opportunity to Learn and Early Grade Reading Fluency to Measure School Effectiveness in Guatemala
http://slidepdf.com/reader/full/using-opportunity-to-learn-and-early-grade-reading-fluency-to-measure-school 29/36 2
In terms o variations across the schools, the number o instructional days ranged roma high o 82 days (46 percent o total available time) to a low o 32 days (18 percento available instructional time). Te SC schools outperormed the control school,oering approximately 10 days additional instruction per year. Schools in the area o Huehuetenango oered the most instructional days (66) on average.
In terms o the school characteristics that were examined that could infuence OL,the only signicant actor that impacted student learning was the language spoken athome. Overall, students who spoke K’iche—or a combination o K’iche and Spanish—outperormed students who spoke Mam, Spanish, and Ixil in the home. While moreresearch is needed to better understand why students in this language group perormedbetter, EQUIP2 speculates that students in the K’iche’ area were closer to urban areas
and had more access to print material both in school and in the home. Additionally,the schools in K’iche’ were the only schools were researchers ound the presence o theMayan storybooks provided by SC.
What is being done by teachers with the existing opportunity to learn toassist students in building oundational reading skills? As the classroom observations refected, approximately 40 to 44 percent o in-classtime is being lost to teachers and students o task (i.e., discipline, social interaction,unengaged time, and classroom management). O the time spent on task, studentsacross the three grades spend the majority o their time doing seatwork or copying rom
the blackboard. However, when the teacher is ully engaged with the students, there is a wider variety o pedagogical approaches used in the classroom.
Within subjects, results showed teachers spend more time in practice and drill activitiesin math; demonstration-type activities in science; and seatwork when ocused onreading activities. Tese types o pedagogical approaches are consistent with theparticular subject areas. However, it is important to note that across the 26 schoolsand 100 classrooms, researchers observed almost no direct reading instruction, nor didobservations reveal students reading aloud, to themselves, or analyzing/interpreting text.
While the students in this case study were generally able to read at an average o 50
wpm, the fuency speed is still lower than one would expect by the time students reachGrade 3. An increased ocus on reading instruction and time to read would assiststudents in solidiying their oundational reading skills as they ready or the uppergrades o primary school.
Policy implicationsDecades o school improvement work have ocused on assisting children to learn. Yet,school quality still poses a challenge or educators and policy-makers alike (World Bank,2006). As this study has demonstrated, students are losing important instructional timein the classroom; reading at relatively low levels; and in some instances, lack the learning materials to improve or even assist perormance. Te ollowing discussion provides
7/28/2019 Using Opportunity to Learn and Early Grade Reading Fluency to Measure School Effectiveness in Guatemala
http://slidepdf.com/reader/full/using-opportunity-to-learn-and-early-grade-reading-fluency-to-measure-school 30/36
Measuring School Eectiveness: Guatemala
insights into possible interventions that could improve the classroom environment andhelp kids learn.
Tis research brings into question several issues about school eectiveness in a serieso sample schools in three regions o Guatemala. Te ndings show schools vary considerably in the nature and quality o the opportunities to learn provided; vary in thelevel o reading fuency students obtain by Grade 3; and the amount o time teachersand students spend on task. While the variation in Guatemala is at the higher end o thespectrum compared to studies conducted in Nepal and Ethiopia, there is much room orimprovement—particularly in reading and time loss
Te amount o useul instruction in a typical lesson was very limited and instructionin reading was almost non-existent: less than 10 percent o the time remaining orinstruction. Most o the reading that was observed was reading text or particularlessons. Students were not seen reading story books, participating in reading activities,or even reading silently—activities oten associated with reading acquisition. Most o theobserved interaction around text was related to reading simple texts o the blackboardor rom textbooks as it related to other subject matter. Tere appeared to be nostructured approach to the teaching o reading in the schools included in this study.
Given that Save the Children is investing resources to support schools, where andhow can the organization better maximize the impact o that support in terms o bothassuring a more consistent opportunity to learn and contributing to better acquisition
o literacy. Te ollowing issues should be considered as ways to possibly obtain moreimpact.
Teacher and student absenteeism need to be more closely monitored and the actors that impact them addressed While teacher and student absenteeism was less o an issue in Guatemala than inother cases researched by EQUIP2, it is still an area where SC or other school supportproviders can do additional work. Systems or local accountability in other contextshave proven useul in combating teacher absenteeism. In several community schoolmodels such as Bangladesh’s BRAC, Guatemala’s PRONADE, and the Mali Community
Schools use SMCs and parent-teacher associations (PAs) to ensure that teachers andstudents are present in the schools. Guatemala also pilot tested the use o cell phones asa way o collecting and reporting education management inormation system (EMIS)absentee data to MINEDUC on an on-going basis.
In addition to monitoring, policy-makers should explore ways to support absentteachers. In the United States, there is a system to provide substitute teachers toschools when the main teacher is absent. In Guatemala, there are huge numbers o certied teachers without teaching posts. Is there a way to use and deploy these teachersin an eective way to ensure that when teachers are absent, classes can continueuninterrupted? While more costly, this solution might ensure that students spend more
time in school learning than currently occurs in the sample schools.

7/28/2019 Using Opportunity to Learn and Early Grade Reading Fluency to Measure School Effectiveness in Guatemala
http://slidepdf.com/reader/full/using-opportunity-to-learn-and-early-grade-reading-fluency-to-measure-school 31/36 3
Finally, many schools have parent and community committees (i.e., PAs and SMCs).Policy-makers could explore ways to engage the community in improving the “reading culture” around schools. Perhaps communities could explore ater school reading clubs,or reading camps that engage literate community members to support children learning to or improving reading skills.
Tese are a ew o many possible options that would increase the opportunity to learnand help mitigate some o the eects o teacher absenteeism.
More o the school day needs to be eectively used and more time should be devoted to reading Te biggest loss o time is occurs when teachers and students are o task and when the
school starts late and ends early. eachers and principals indicated that school otenbegins at 8:00 a.m. instead o 7:30 a.m. because educators are waiting or students toarrive; they end early because teachers oten need to leave or aternoon shits in otherschools; and recess extends beyond the allocated 15 minutes because o lag time ingetting students back into the classroom. Principals, SMCs, and PAs need to assistschools and teachers to begin and end school on time so students receive the benet o more instructional time.
Investments in teacher training need to do more than assure ocial certifcation
eachers need to learn specic teaching strategies that are ocused on helping studentslearn to read (either as part o or in addition to their certication-based training). Moststudents in this study recognized letters airly well, could complete the CAP pre-literacy tasks successully, and read at an average o 50 wpm. However, many students were stillnot making the transition rom initial oundational reading skills to actually reading with fuency. While there are teacher and student standards in place or the type o teaching that should happen in the classroom, it was not clear that an actual reading curriculum existed in Guatemala. eachers appear to lack techniques such as thosementioned above that build site vocabulary or teach basic decoding. Ensuring teachershave the skills to carry out the ollowing types o reading activities will improve students’reading abilities.
1. Focus on oral language development. Literacy starts with oral language. Childrenin most countries are amiliar with certain local songs. eachers should use localsongs and customs to teach reading and word association.
2. Use o high requency sight words. Sight words are learned through repeatedexposure. eachers should be taught to use word games such as BINGO or fashcards to teach high requency words. eachers should be able to write a sentenceon the chalkboard that has a high requency word (e.g., “here”) and draw students’attention to the word. Students can learn to be word trackers beore they read a pageto see i they recognize any “old riends” in sentences or paragraphs.
3. Picture walk. Most beginning texts carry some sort o illustration. eachers otenrush too quickly to have students ocus on the printed words, but beginning readers

7/28/2019 Using Opportunity to Learn and Early Grade Reading Fluency to Measure School Effectiveness in Guatemala
http://slidepdf.com/reader/full/using-opportunity-to-learn-and-early-grade-reading-fluency-to-measure-school 32/36
Measuring School Eectiveness: Guatemala
rst read the pictures, construct a text in their heads, then reading becomes a processo matching the texts they constructed with the text the writer constructed. Focuson ensuring that teachers can do “picture walks” by showing students the pages o the book they are about to read and talking with them about what is in the pictures.(e.g., “What do you see?” “Does that give you an idea about what the author mightbe saying?”) A picture walk builds motivation and engagement in reading as childrenbecome eager to see whether their ideas are the same as the author’s.
4. Repeated reading. Whether adult competent readers or children just starting out,it is an absolute certainty that all readers improve accuracy and rate with repeatedreading o the same passage. Unortunately in school, teachers seldom give childrenan opportunity to do repeated reading, and almost no repeat reading was observedin the classrooms in this study. eachers should be taught to use techniques such as
reading in pairs, reading in small groups, or even just having time in class to readsilently to encourage a “culture o reading” in the classroom.
5. Use o patterned text. Another way to create instant readers is to use texts that haveclear, strong patterns. Tink about the song “I Know an Old Lady Who Swallowed a Fly.” She swallowed the fy to catch the spider, etc. By the time the student gets to theourth verse they have memorized the pattern. Tey might not be reading letters and words, but this action will get students into the game. It is up to the teacher then tohelp the child match which word is “Lady.”
6. Use o dictated sentences. It is much easier or children to read what they have justsaid. Tese texts can be read by students and become the ocus o instruction.
More reading material needs to be made available eachers oten think o reading as reading books, when in act most reading is not book reading. Tere appears to be an insuciently literate environment to support regularreading. eachers should take an inventory o the print in the school, classroom, orschool community. Even in the poorest communities there are some amazing exampleso literacy: package labels, -shirts, bibles, and billboards. Tese are texts, and teacherscan begin supporting children’s literacy by building on their ability to read them.
Schools need storybooks and other printed materials that oer students a variety o
opportunities and purposes to read. eachers also need to be trained to provide students with a structured environment or reading to occur. Activities such as reading corners,reading silently or some time period, and peer reading are activities that increase theamount o time students read in class and strengthen their reading skills.
Remediation and more individualized instruction should be introduced Given that large numbers o students are not learning to read, schools need to put inplace remediation strategies designed to address this problem. Within any classroomteachers might have students across the ull range o reading abilities, and thereoreshould learn techniques to identiy where students are at and then tailor instruction todierent groups operating at dierent levels. Simple tools or classiying students along a

7/28/2019 Using Opportunity to Learn and Early Grade Reading Fluency to Measure School Effectiveness in Guatemala
http://slidepdf.com/reader/full/using-opportunity-to-learn-and-early-grade-reading-fluency-to-measure-school 33/36 3
logical hierarchy would prove useul – does not know letters, knows letters, able to readsimple words, able to read sentences, able to read connected text.
MINEDUC should also invest in enriching the proessional dialogue around teaching reading and writing. Tis enrichment means creating proessional libraries in schoolsand teacher centers; ensuring teachers have access to journals, web resources, evengovernment circulars on reading and literacy; and continue to build a constructivedialogue with the teacher unions around issues o proessionalizing the teaching workorce. Te teacher union can and must be a partner or promoting excellence.
Ensure there is a strong link between reading and writing Even kindergarten students learn to read and write concurrently. Reading and writing
are mutually inorming and reinorcing, so teachers need to ocus on ways to ensurestudents have an opportunity to write stories and practice writing, and then reading what they have written.
When teachers do teach reading skills, they tend to do so in isolation. Tey generally teach discrete skills as though these were pieces o a giant puzzle and then expect kidsto put the pieces together on their own. Oten students do not understand how thepieces o the puzzle t together. eachers need to teach high-utility reading and writing strategies in the context o authentic reading and writing activities, such as writing a story about a sibling, creating a poem or a parent, reading about a hero, or trying tond out whether the lost kids will make it back home. eaching reading and writing in
authentic contexts provides an opportunity or children to see how the skills o reading and writing can help them read and write better, and it allows them to play with words.
In 2009, AED published Success in First Grade highlighting our principles o success:maximizing opportunities to learn, creating learning communities, providing redundantsupport, and integrating child-oriented systems. Tese principles are at the core o the recommendations above and provide a oundation to engage policy-makers indiscussions on how to ensure that all kids learn to read.

7/28/2019 Using Opportunity to Learn and Early Grade Reading Fluency to Measure School Effectiveness in Guatemala
http://slidepdf.com/reader/full/using-opportunity-to-learn-and-early-grade-reading-fluency-to-measure-school 34/36
Measuring School Eectiveness: Guatemala
Reerences Abadzi, H. (2007). Absenteeism and Beyond: Instructional Time Loss and Consequences. Washington, D.C.: Independent Evaluation Group, World Bank.
Anderson, M. E. (2001). Guatemala: the Education Sector , echnical Paper No. 2. Washington, D.C.: World Bank and ulane University.
Benavot, A. and M. Amadio. (2004). A Global Study o Intended Instructional Time and Ofcial School Curricula, 1980-2000. Geneva, Switzerland: IBE.
Bloom, B.S. 1968. “Learning or Mastery.” UCLA Evaluation Comment , 1(2), 1–8.
CARE. (2009). “CARE’s work in Guatemala.” Available at: http://www.care.org/careswork/countryproles/59.asp
Carrol, J.B. (1963). “A Model o School Learning.” Teachers College Record, 64, 723–733.
CIA. (2009). “Te World Factbook: Guatemala.” Available at: https://www.cia.gov/library/publications/the-world-actbook/geos/gt.html#Intro
Clay, M. (2000). Concepts About Print: What Have Children Learned about the Way We
Print Language? Portsmouth, NH: Heinemann.
EdData II. (2009). EdData II Project. Available at: www.eddataglobal.org.
Edwards, J. (2002). Education and Poverty in Guatemala , echnical Paper No. 3. Washington, D.C.: World Bank and ulane University.
Gettinger, M. (1984). “Individual Dierences in ime Needed or Learning: A Review o the Literature.” Education Psychologist, 19(1), 15–19.
Gillies, J. and J. Jester Quijada. (2008). Opportunity to Learn: A high impact strategy or improving educational outcomes in developing countries. Washington, D.C.: United States Agency or International Development (USAID), Educational Quality ImprovementProgram 2 (EQUIP2), and the Academy or Educational Development (AED).
Save the Children. (2006). Metodología del Programa de Educación. Guatemala City:Save the Children, US.
Save the Children. (2009). “Guatemala.” Available at: http://www.savethechildren.org/countries/latin-america-caribbean/guatemala.html.

7/28/2019 Using Opportunity to Learn and Early Grade Reading Fluency to Measure School Effectiveness in Guatemala
http://slidepdf.com/reader/full/using-opportunity-to-learn-and-early-grade-reading-fluency-to-measure-school 35/36 3
UNESCO. (2009). “Overcoming inequality: why governance matters.” EFA Global Monitoring Report . Paris, France: UNESCO.
UNESCO and Latin American Laboratory or Assessment o the Quality o Education(LLECE). (2008). “Los aprendizajes de los estudiantes de América Latina y el Caribe.Primer Reporte de Resultados del Segundo Estudio Regional Comparativo y Explicativo. Santiago, Chile.: UNESCO and LLECE.
7/28/2019 Using Opportunity to Learn and Early Grade Reading Fluency to Measure School Effectiveness in Guatemala
http://slidepdf.com/reader/full/using-opportunity-to-learn-and-early-grade-reading-fluency-to-measure-school 36/36
AcknowledgementsTis paper was written or EQUIP2 by Audrey-marie Schuh Moore (AED), 2009.Contributors include Elizabeth Adelman (AED), Eva Grajeda (AED), Dr. Conrad
Wesley Snyder, and Amy Jo Dowd (Save the Children). We would like to give specialthanks to the Save the Children eld oce in Guatemala or their support in thedevelopment and completion o this case study.
EQUIP2: Educational Policy, Systems Development, and Management is one o threeUSAID-unded Leader with Associates Cooperative Agreements under the umbrella heading Educational Quality Improvement Program (EQUIP). As a Leader with Associates mechanism, EQUIP2 accommodates buy-in awards rom USAID bureaus andmissions to support the goal o building education quality at the national, sub-national,and cross-community levels.
Te Academy or Educational Development (AED) is the lead organization or theglobal EQUIP2 partnership o education and development organizations, universities,and research institutions. Te partnership includes teen major organizations and anexpanding network o regional and national associates throughout the world: Aga KhanFoundation, American Institutes or Research, CARE, Center or Collaboration and theFuture o Schooling, East-West Center, Education Development Center, InternationalRescue Committee, Joseph P. Kennedy, Jr. Foundation, Michigan State University,Mississippi Consortium or International Development, ORC Macro, Research riangleInstitute, University o Minnesota, University o Pittsburgh Institute o International
Studies in Education, Women’s Commission or Reugee Women and Children.
For more inormation about EQUIP2, please contact:
USAIDPatrick CollinsCO EGA/ED
USAID Washington1300 Pennsylvania Ave., NW
Washington, DC 20532el: 202-712-4151
Email: [email protected]
AED John Gillies
EQUIP2 Project Director1825 Connecticut Ave., NW
Washington, DC 20009el: 202-884-8256
Email: [email protected] Web: www.equip123.net
Measuring School Eectiveness: Guatemala