using neural networks to explore air traffic controller workload · · 2013-04-10workload...
TRANSCRIPT
Source of Acquisition NASA Ames Research Center
Using Neural Networks to Explore Air Traffic Controller Workload
Lynne Martin ([email protected]) Terminal Area ATM Research Branch, NASA Ames Research Center
Moffett Field, CA 94035 USA
Thomas Kozon ([email protected]) Terminal Area ATM Research Branch, NASA Ames Research Center
Moffett Field, CA 94035 USA
Savita Verma ([email protected]) Terminal Area ATM Research Branch, NASA Ames Research Center
Moffett Field, CA 94035 USA
Sandra Lozito ([email protected]) Terminal Area ATM Research Branch, NASA Ames Research Center
Moffett Field, CA 94035 USA
Abstrzct
When a new system, concept, or tool is proposed in the aviation domain, one concern is the impact that this will have on operator workload. As an experience, workload is difficult to measure in a way that will allow comparison of proposed systems with those already in existence. Chatterji and Sridhar (200 1) suggested a method by which airspace parameters can be translated into workload ratings, using a neural network. This approach was employed, and modified to accept input from a non-real time airspace simulation model. The following sections describe the preparations and testing work that will enable comparison of a future airspace concept with a current day baseline in terms of workload levels.
Measuring Workload Workload is notoriously hard to measure. In air traffic control (ATC), workload is related to the number of aircraft in the airspace but other static and dynamic factors influence the workload too, e.g., the complexity of the airspace and the controller’s own preferences.
Traditionally workload has been measured subjectively - asking controllers to rate their experienced level of workload during or after a session. There are a number of workload measures designed specifically for ATC measurement including CARS, an adaptation of the Cooper- Harper Scale, which was described by Lee, Kerns, Bone, & Nickelson (200 1). Other measures designed for the aviation domain are also used, e.g., the NASA TLX (Hart & Staveland, 1988).
Although subjective rating measures yield workload information, they are not concretely related to any parameters that could be predictably changed to modify a system’s workload levels. With the prediction that the number of aviation operations will continue to increase (and possibly double by 2020), one aim of current research in the ’aviation domain is to increase the capacity of the national airspace - i.e., the number of aircraft that can be in service at any one time. This will increase sector loads for
individual controllers, but the goal is to offset the increase in workload by developing new technologicallautomation tools for the controller and flight deck. A greater understanding of the link between ATC variables and workload is essential to the research and deveiopment of such tools operaring in the aviation environment.
A field of research has grown over the last few years to determine measurable factors that, when combined, correlate with rated workload levels. These algorithms aim to determine the complexity of an airspace sector. Using static and dynamic variables from the sector, including traffic counts, combinations of variables are tested against controllers’ subjective workload ratings.
In one study (Kopardekar & Magyarits, 2002), the authors tested four complexity algorithms against controllers and supervisors’ subjective ratings of complexity from four en route center airspaces. Correlations between the complexity algorithms and subjective ratings were highest when the authors combined all the variables from all four algorithms.
One complexity algorithm that performed reasonably well alone was the metric devised by Chatterji and Sridhar (2001). It correlated highly with the complexity ratings from one en route airspace (Denver) and moderately with all the others. Chatterji and Sridhars’ algorithm is comprised of 16 variables, all of which are dynamic. These can be grouped into three categories of variables - traffic count measures, aircraft separation measures, and conflict detection and resolution measures. The variables are listed in table 1. Chatterji and Sridhar have taken the link between subjective workload and complexity calculations one step further by devising a neural network that will translate complexity calculations into a workload rating. The neural network has three layers and is illustrated in Figure 1 (Chatterji & Sridhar, 1999). The sixteen complexity variables are the inputs (on the left side of the figure), although the number of inputs can be varied. There are 30 nodes in the hidden layer at the heart of the neural net, so each input is assigned
https://ntrs.nasa.gov/search.jsp?R=20060022173 2018-06-25T23:05:14+00:00Z

Table 1 : Complexity variabIes identified by Chatterji and Sridhar (200 1).
Traffic count measures r-
cruising aircraft
N u m b e r o f
Separation measures
Mean horizontal separation Separat ion in altitude band
Minimum horizontal separation
Mean vertical separation
Separat ion in altitude band Minimum vertical separation
Conflict detection and
resolution measures
Variance of speed
Ratio of standard devia t ion of speed to average speed Conflict resolution difficulty based on crossing angle Time to go to conflict 1
Time to go to conflict 2 Time to go to conflict 3
30 weights (480 weights in total in this case) by the network to connect it to the hidden layer, and 30 biases are generated
also. There are three nodes in the output from the network, f , -
which indicate a low, medium or high workload rating. ( Ninety weights and three biases, through addition and integration, connect the hidden layer to the output layer. When Chatterji and Sridhar first formed the network, all weights and biases were initialized with random values between -1 and +1 using a uniform random number generator. These values were improved iteratively by training the network using a standard gradient-based back- propagation algorithm. All software modules, which collectively generate the workload and neural network output measures, were originally developed to run on a Unix-based Sun Solaris Computer, and were coded using the C programming language.
Chattterji and Sridhar (2001) collected the data for training the neural network by having two controllers watch nine hours of recorded traffic from sector 48 in ZFW (Fort Worth Center airspace, which covers Texas and parts of the surrounding states in the US) and give workload ratings every two minutes. Both controllers were familiar with the traffic activity, and were qualified air traffic controllers of this sector. A tenth hour-Iong session was a repeat of one of the nine recorded hours to provide a rating consistency check. Controllers did not perform these ratings all at once but worked ten one-hour ‘shifts’ to rate the sector’s workload levels.
Figure 1: A three-Iayer neural network.
host of specialized modules, all written in open source languages, such as C, awk, and csh scripts. It runs on a Sun Solaris Ultra 60 computer using a 450 Mhz UltraSPARC-I1 processor with 1Gb of memory, but is generic enough to be used on a number of different computer configurations, as long as certain key elements are available (e.g., system libraries linked to the application).
In a very general sense, the overall data flow and method is as follows:
Initially, train the neural networks using the sector 48 data collected by Chatterji and Sridhar (2001)(this step needs to be completed only once).
2) Extract the necessary variableddata from the ACES output using the MySQL interface.
3) Apply the workload measures algorithms to the data generated from step #2
4) Apply the neural networks algorithms to the data generated from step #3
5 ) Select, concatenate, and analyze the time- stamped neural networks complexity ratings generated from step $4.
This application implements a variety of algorithms with complexity ratings generated as the final output. These algorithms address issues such as system compatibility of the input data sets, generating new input variables based on the activity of existing variables, s o r t i n g l n e s t i n g p r o c e s s e d d a t a s e t s , separatinglprocessinglanalyzing data within each individual sector, automatically writing and running a specialized analysis program based on the data content read by the application, and automatically keeping track of each set of analysis data as they are formatted and then processed with the original “core” algorithms associated with the workload measures and the neural networks. All software modules are linked to each other in one integrated driver program, which runs all processes automatically. In this way, data can be analyzed on a sector by sector basis with minimum user intervention - i.e., hundreds of separate analysis output files (one for each sector) are typically (and automatically) generated from one ACES data collection set by typing one simple executable file name and one command line argument at the UNIX command line prompt. Likewise, it is also possible to run the automated software in a similar manner, while specifying the analysis of a subset of sectors or even only one sector.
1)
Initial Progress Initially, data for sector 48 only will be processed through this newly developed application, since data from this sector was used as the basis for training the neural networks. Also, initially, only a one-hour traffic segment will be selected - 1200-1300 local time (est). The complexity metric will be applied to the data and the neural network output will be evaluated for its consistency and correspondence with Chatterji and Sridhars’ (200 1) workload ratings.
After examining the results of this one-hour one-sector analysis, two-houl- t h e segmeiits will be analyzed for two separate ACES runs where baseline parameters, such as the level of traffic and weather, have been manipulated. The workload calculations will be compared between these runs with the hypotheses that higher traffic and less than ideal weather lead to higher workload for the controller. Based on the findings from this analysis, comparisons couid then be made with results from other sectors.
At the time of writing this paper, step one in the process outlined above is complete. The neural network took two hours to train with the original sector 48 data. The software has been tested for robustness using data generated from older versions of ACES. Since then, the most recent version of ACES was released, and study runs from this version, using the baseline inputs set up to test and compare various aspects of the concept, are currently being prepared. The raw data sets from these model runs are expected to become available prior to the end of the 2005 calendar year, and will then be analyzed using the comprehensive workload measures and neural networks application described in this paper, to test and compare various aspects of the concept.
Summary and Discussion A method and accompanying software application has been developed that addresses Air Traffic Controller work!oad by usiEg data collectior, oxtpat from a fast time model of the airspace (ACES). Within this application, a previously validated set of objective workload measures and a trained neural network are two of the essential cornerstones that are employed to generate final workload ratings. Algorithms are consistent with a subset of current VAMS blending metrics, FAA plans, and Joint Project Development Office priorities.
To this point, obtaining data from ACES and deriving required complexity variables from these data seems to be a viable approach for estimating workload in a sector. For the most part, the process of calculating workload ratings from the model data will just require exercising the process, since the vast majority of the involved sub- processes have been directly linked together, and have also been fully automated.
The software application described in this paper has been verified for robustness using test data from earlier versions of the ACES simulationlmodeling system. Study data from the recently released version of ACES is in preparation, and once generated, will be processed and fully analyzed using this software application.
Having shown that the data from a fast time modeling tool can be used to determine a complexity metric and then drive a neural network to estimate workload for a sector, the next step will be to try to estimate future workloads for a sector when new equipment or boundaries have been set. The hardest part of this work will be to devise a method for training the neural network for a future state that cannot be directly observed, and which is likely to entail more automation and new tools.
Eighty percent of the ratings collected were used to train the neural network. Chattterji and Sridhar (2001) used the remaining fifth of the data to assess the trained neural network’s performance. After training, the network was able to classify 92.7% of the low workload ratings, 98% of the medium ratings and 86.7% of the high workload ratings. For the validation test, when all 16 variables were used, the network correctly classified 80.9% of the low workload samples, 38.1% of the medium workload samples, and 100% of the high workload samples. The network’s inability to adequately classify the medium workload sample was attributed to the low number of medium and high ratings in the samples’.
An earlier version of Chatterji and Sridhars’ complexity algorithm (Chatterji & Sridhar, 1997), was compared to data from a human-in-the-loop (HITL) simulation by Baart (2001). The HITL simulation was focused on two sectors in the Memphis Center airspace and collected subjective workload ratings from both Radar and Data controllers. In general, calculations from Chatterji and Sridhars’ 1997 algorithm followed the trend of the mean subjective workload ratings by R-side and D-side controllers, although it tended to over predict the level of workload. This study demonstrates not only that a method using simulated data is possible, but also shows that a similar complexity algorithm is sensitive to changes in demand and task levels that are reported by controller participaits.
In summary, Chatterji and Sridhar have a method by which to estimate controller subjective workload from objective data related to an airspace sector, via a compiexity rating and a trained neurai network.
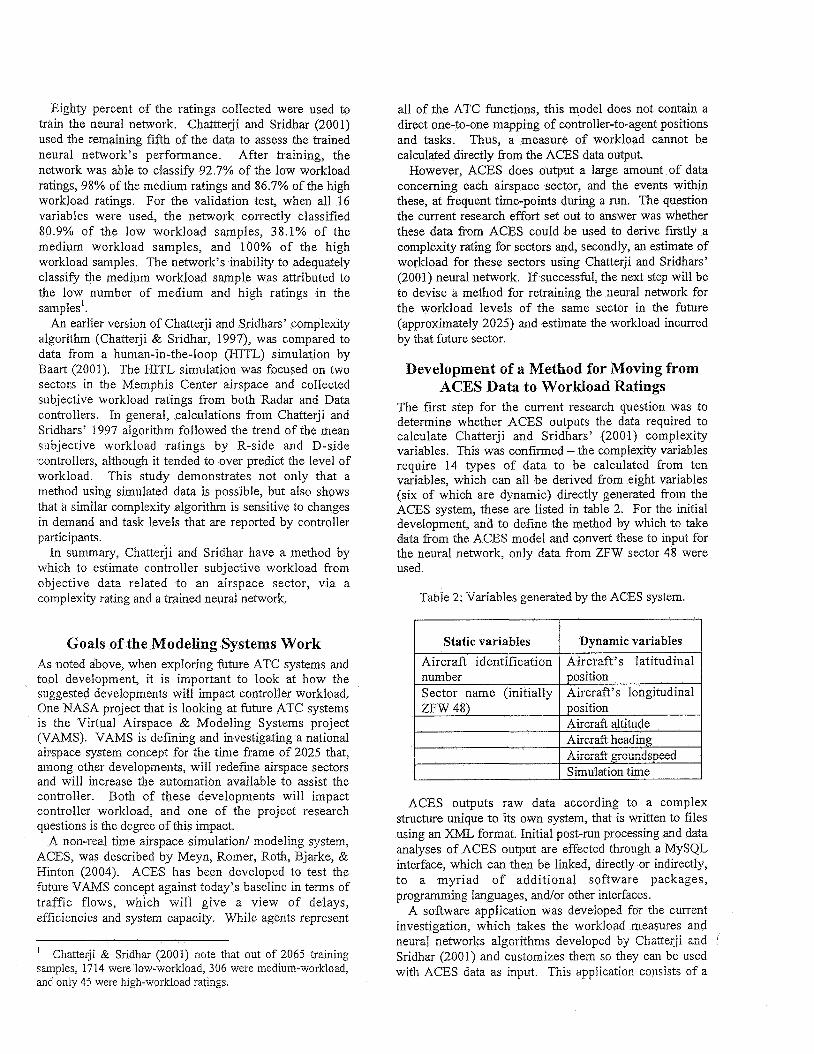
Static variables Aircraft identification
Goals of the Modeling Systems Work As noted above, when exploring future ATC systems and tool development, it is important to look at how the suggested developments will impact controller workload. One NASA project that is looking at future ATC systems is the Virtual Airspace & Modeling Systems project (VAMS). VAMS is defining and investigating a national airspace system concept for the time frame of 2025 that, among other developments, will redefine airspace sectors and will increase the automation available to assist the controller. Both of these developments will impact controller workload, and one of the project research questions is the degree of this impact.
A non-real time airspace simulation/ modeling system, ACES, was described by Meyn, Romer, Roth, Bjarke, & Hinton (2004). ACES has been developed to test the future VAMS concept against today’s baseline in terms of traffic flows, which will give a view of delays, efficiencies and system capacity. While agents represent
’ Chatterji & Sridhar (2001) note that out of 2065 training samples, 1714 were low-workload, 306 were medium-workload, and only 45 were high-workload ratings.
Dynamic variables Aircraft’s latitudinal
all of the ATC functions, this model does not contain a direct one-to-one mapping of controller-to-agent positions and tasks. Thus, a measure of workload cannot be calculated directly from the ACES data output.
However, ACES does output a large amount of data concerning each airspace sector, and the events within these, at frequent time-points during a run. The question the current research effort set out to answer was whether these data from ACES could be used to derive firstly a complexity rating for sectors and, secondly, an estimate of workload for these sectors using Chatterji and Sridhars’ (2001) neural network. If successhl, the next step will be to devise a method for retraining the neural network for the workload levels of the same sector in the future (approximately 2025) and estimate the workload incurred by that hture sector.
’ number Sector name (initially
Development of a Method fcr Moving from ACES Data to Workload Ratings
The first step for the current research question was to determine whether ACES outputs the data required to calculate Chatterji and Sridhars’ (200 1) complexity variables. This was confirmed -the complexity variables require 14 types of data to be calculated from ten variables, which can all be derived from eight variables (six of which are dynamic) directly generated from the ACES system, these are listed in table 2. For the initial development, and to define the method by which to take data f o m the ACES model and convert these to input for the neural network, only data from ZFW sector 48 were used.
Tabie 2: Variables generated by the ACES system.
position Aircraft’s longitudinal
I
ZFW 48) I position I Aircraft altitude
Aircraft heading Aircraft gzundspee:! Simulation time
ACES outputs raw data according to a complex structure unique to its own system, that is written to files using an XML format. Initial post-run processing and data analyses of ACES output are effected through a MySQL interface, which can then be linked, directly or indirectly, to a myriad of additional software packages, programming languages, and/or other interfaces.
A software application was developed for the current investigation, which takes the workload measures and neural networks aIgorithms developed by Chatterji and Sridhar (2001) and customizes them so they can be used with ACES data as input. This appIication consists of a

Tentative plans are to set up a simulation of a future ,zirspace ttsing =they tools avai!ab!e at hTASA Ames Research Center and have controllers rate the level of workload. Through Ames' simulators, generated traffic can be made to look identical to live recorded traffic and so controller rathgs would be made and collected under the same conditions that the initial ratings were collected by Chatterji and Sridhar (2001).
Acknowledgments The authors would like to thank Gano Chatterji for his assistance in resurrecting his neural network and his support of our work.
Tiis research was compieted through funding from the VAMS project at NASA Ames Research Center.
References Baart, D. (2001). Evaluation of Dynamic Densiiy (DO)
Metrics using RAMS. DOT/FAA/CT-TN, Atlantic City, NJ: FAA William J. Hughes Technical Center, ACT-540.
Chatterji, G. & Sridhar, B. (1997). Measures of Airspace Complexiiy, Preliminary Draji. Unpublished work, NASA Ames Research Center, Moffett Field, CA.
Chatterji, G. & Syidhar, B. (1999). Neural network based Air Traffic Controller workload prediction. In the
proceedings of the American Control Conference (pp. 2629-26241, S z L Diego, California: M C C , h i e 1999. Chatterji, G. & Sridhar, B. (2001). Measures for Air
Traffic Controller workload prediction. Proceedings of the First AIAA Aircraft Technology, Integration, and Operations Forum, Los Angeles, CA.
Hart, S. & Staveland, L. (1988). Development of the NASA-TLX (task load index): Results of empirical and theoretical research. in P. A. Hancock & N. Meshkati (Eds.), Human Mental Workload (pp. 239-250). Amsterdam: North Holland Press.
Dynamic density: Measuring and predicting sector complexity. Proceedings of the 21'' Digital Avionics Systems Conference (pp 2.C.4-1 - 2.C.4-9).
Lee, K., Kerns, K., Bone, R., & Nickelson, M. (2001). Development and validation of the controller acceptance rating scale (CARS): Results of empirical research. In the Proceedings of the 41h USMEurope Air Trafic Management R&D Seminar, Santa Fe, NM, December 3-7.
Meyn, L. A., Romer, T. F., Roth, K., Bjarke, L. J., & Hinton, S. E. (2004). Preliminary assessment of future operational concepts using the Airspace Concept Evaluation System. 4th AIAA Modeling and Simulation Conference and Exhibit. ANA-2004-6508, Chicago, T l
Kopardekar, P. and Magyarits, S. (2002).