using isotopic ratios and major minerals data to indentify ... · 24/06/2008 · introductiion . 5...
TRANSCRIPT

Final ReportJune 2008
CALIFORNIA ENVIRONMENTAL PROTECTION AGENCYEnvironmental Monitoring Branch
California Department of Pesticide Regulation1001 I Street Sacramento, California 95812
Using Isotopic Ratios and Major Minerals Data to Identify The Sources of Ground Water and
Ground Water Nitrate In Relation to Pesticide Residues
The Nitrogen Cycle

USING ISOTOPIC RATIOS AND MAJOR MINERALS DATA TO IDENTIFY THE SOURCES OF GROUND WATER AND GROUND WATER NITRATE IN
RELATION TO PESTICIDE RESIDUES
Final Report Submitted to California Department of Pesticide Regulation
Environmental Monitoring Branch
for
Agreement No. 05-0102C (Isotope Ratios of Nitrate in Ground Water)
June 24, 2008
by
C. John Suen, Sc.D., P.G.
California Water Institute, California State University, Fresno
CWI-GEOL-08-DPR001
TABLE OF CONTENTS List of Figures 3 List of Tables
3
EXECUTIVE SUMMARY 4 1. INTRODUCTIION 5 1.1 Background
5
1.2 Study Objectives
6
1.3 Study Area and Locations
6
2. METHODOLOGY 9 2.1 Stable Isotope Technique
9
2.2 Isotope Analytical Procedure
9
2.3 Nitrate and Major Mineral Concentrations
10
2.4 Herbicide Residues ands Degradates
10
3. RESULTS AND DISCUSSIONS 11 3.1 δ15N and δ18O in Dissolved Nitrate
11
3.2 Relationship Between Nitrate and Herbicide Concentrations
17
4. CONCLUSIONS AND RECOMMENDATIONS 21 5. LIST OF REFERENCES 22 Acknowledgements 23 APPENDIX A: Procedure for Isotope Ratio Analyses (USGS) 24 APPENDIX B: Scientific Convention for Stable Isotope Ratios 25 APPENDIX C: Table of Major Mineral Compositions 27
2

LIST OF FIGURES
1. Well locations 8 2a. Dual isotope plot of δ18O versus δ15N 14 2b. Typical ranges of nitrate sources 14 3. Plot of nitrate versus sulfate concentrations 15 4. Piper diagram 16 5. Plot of nitrate concentrations versus δ15N values 18 6. Plot of simazine residue concentrations vs. nitrate
concentrations 19
7. Plot of diuron residue concentrations vs. nitrate
concentrations 19
8. Plot of DACT concentrations vs. nitrate concentrations 20 9. Plot of ACET concentrations vs. nitrate concentrations 20
LIST OF TABLES
Table 1: Oxygen and Nitrogen Isotopic Compositions of Dissolved Nitrate 12
APPENDIX C: Table of Major Mineral Compositions 27
3

EXECUTIVE SUMMARY Sixty-nine groundwater samples were collected by the California
Department of Pesticide Regulation in Fresno and Tulare Counties of eastern
San Joaquin Valley as part of their groundwater monitoring program. To identify
the main source of nitrate contamination, the samples were also analyzed for
their δ15N and δ18O isotopic ratios in dissolved as well as their major mineral
concentrations, in addition to analyses of herbicide residues and metabolites. To
delineate groundwater components and mixing trends, major mineral analyses
were also conducted by a commercial laboratory.
The nitrate isotope ratios and the anionic mixing trend are consistent with
the interpretation that the main source of nitrate is from fertilizer application in the
form of ammonium sulfate, and that nitrate from animal or human wastes may be
secondary. Although nitrate concentrations do not correlate significantly with
herbicide residues in the samples, they do exhibit a moderately significant
positive trend with herbicide metabolites, such as ACET and DACT. Hence, the
concentrations of groundwater nitrate and other agrichemicals may provide a
reasonably significant proxy for determining travel pathways for the movement of
herbicide residues and metabolites in the vadose zone, thus provide additional
data for groundwater transport model development and calibration.
These preliminary results look promising. It is therefore recommended
that this work should be followed by more detailed multivariate and spatial data
analyses. Other related data such as land-use patterns and sampling depths will
also be useful.
4
USING ISOTOPIC RATIOS AND MAJOR MINERALS DATA TO IDENTIFY THE SOURCES OF GROUND WATER AND GROUND WATER
NITRATE IN RELATION TO PESTICIDE RESIDUES
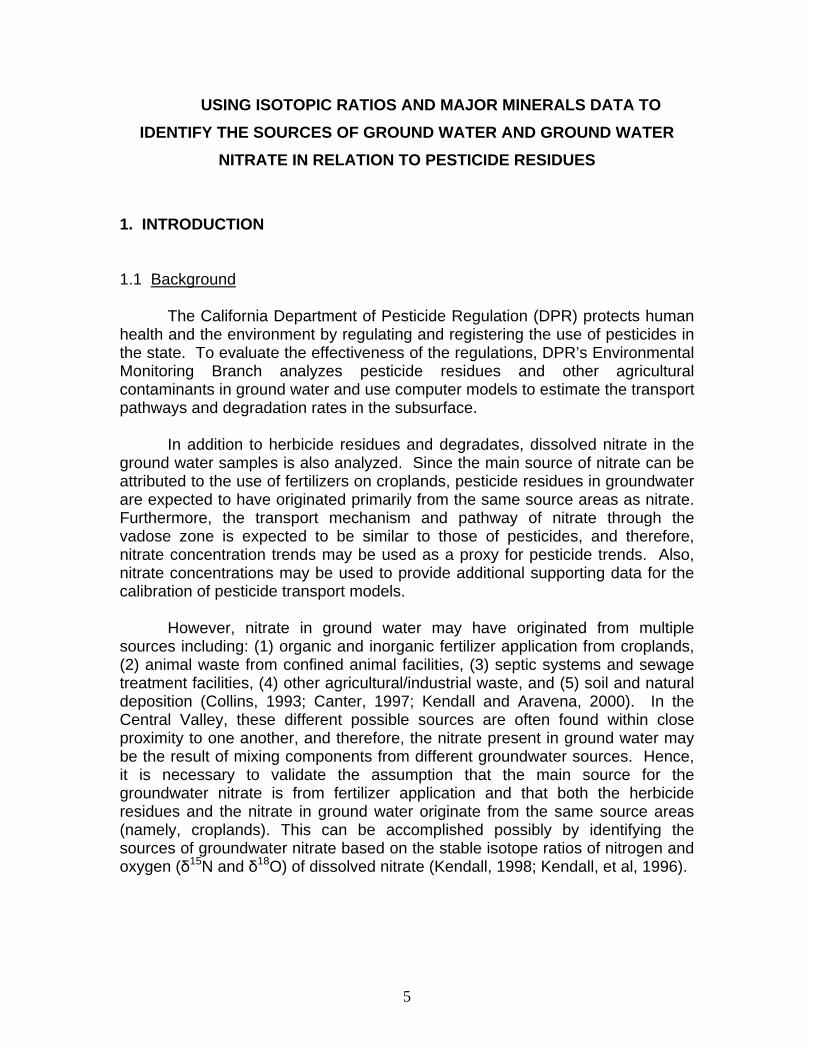
1. INTRODUCTION 1.1 Background
The California Department of Pesticide Regulation (DPR) protects human health and the environment by regulating and registering the use of pesticides in the state. To evaluate the effectiveness of the regulations, DPR’s Environmental Monitoring Branch analyzes pesticide residues and other agricultural contaminants in ground water and use computer models to estimate the transport pathways and degradation rates in the subsurface.
In addition to herbicide residues and degradates, dissolved nitrate in the ground water samples is also analyzed. Since the main source of nitrate can be attributed to the use of fertilizers on croplands, pesticide residues in groundwater are expected to have originated primarily from the same source areas as nitrate. Furthermore, the transport mechanism and pathway of nitrate through the vadose zone is expected to be similar to those of pesticides, and therefore, nitrate concentration trends may be used as a proxy for pesticide trends. Also, nitrate concentrations may be used to provide additional supporting data for the calibration of pesticide transport models.
However, nitrate in ground water may have originated from multiple sources including: (1) organic and inorganic fertilizer application from croplands, (2) animal waste from confined animal facilities, (3) septic systems and sewage treatment facilities, (4) other agricultural/industrial waste, and (5) soil and natural deposition (Collins, 1993; Canter, 1997; Kendall and Aravena, 2000). In the Central Valley, these different possible sources are often found within close proximity to one another, and therefore, the nitrate present in ground water may be the result of mixing components from different groundwater sources. Hence, it is necessary to validate the assumption that the main source for the groundwater nitrate is from fertilizer application and that both the herbicide residues and the nitrate in ground water originate from the same source areas (namely, croplands). This can be accomplished possibly by identifying the sources of groundwater nitrate based on the stable isotope ratios of nitrogen and oxygen (δ15N and δ18O) of dissolved nitrate (Kendall, 1998; Kendall, et al, 1996).
5

1.2 Study Objectives
This project is to provide data survey on the potential sources of nitrate in the domestic well system as determined from measurements of the nitrogen and oxygen isotopic compositions of dissolved nitrate in the sampled well water. It is expected that pesticide concentrations originate from surface applications, and they are dissolved or mixed with percolating irrigation water. They follow similar pathways as the dissolved nitrate and reach ground water by advection. If the sole source of nitrate was determined to be from fertilizer applications, then this would indicate that surface water percolation would be a major component of recharge of groundwater aquifers. On the other hand, if the isotope data indicate for other sources of nitrate, such as from septic systems, that would imply that nitrate concentrations may not have a significant statistical correlation for herbicides residues and degradates, and therefore, they may not be used as a statistical proxy.
These data are important for validating models currently used to determine movement of herbicide residues in the subsurface. Up to date, DPR models assume that all water for recharge originates from surface additions. The presence of other significant recharge component would suggest the necessity to revisit this assumption used in or modeling procedure and most likely result in a revision of the procedure.
Accordingly, the objectives of this study are:
1. to identify the main source of nitrate present in the ground water, 2. to examine the relationship between the concentrations of herbicide
residues and the concentrations of nitrate in ground water, 3. to delineate the components of ground water mixing so that the
contribution to ground water from deep percolation of farm irrigation can be estimated by their major mineral compositions, and
4. to generate additional data to help understand the pathway for the
movement of agricultural chemicals in the subsurface which is important in the interpretation of the herbicide concentrations in ground water.
1.3. Study Area and Locations
Since 1999, seventy domestic wells located in Fresno and Tulare counties for the presence of agricultural chemicals. The data from these wells are intended to be used to evaluate the effectiveness of pesticide regulations to
6
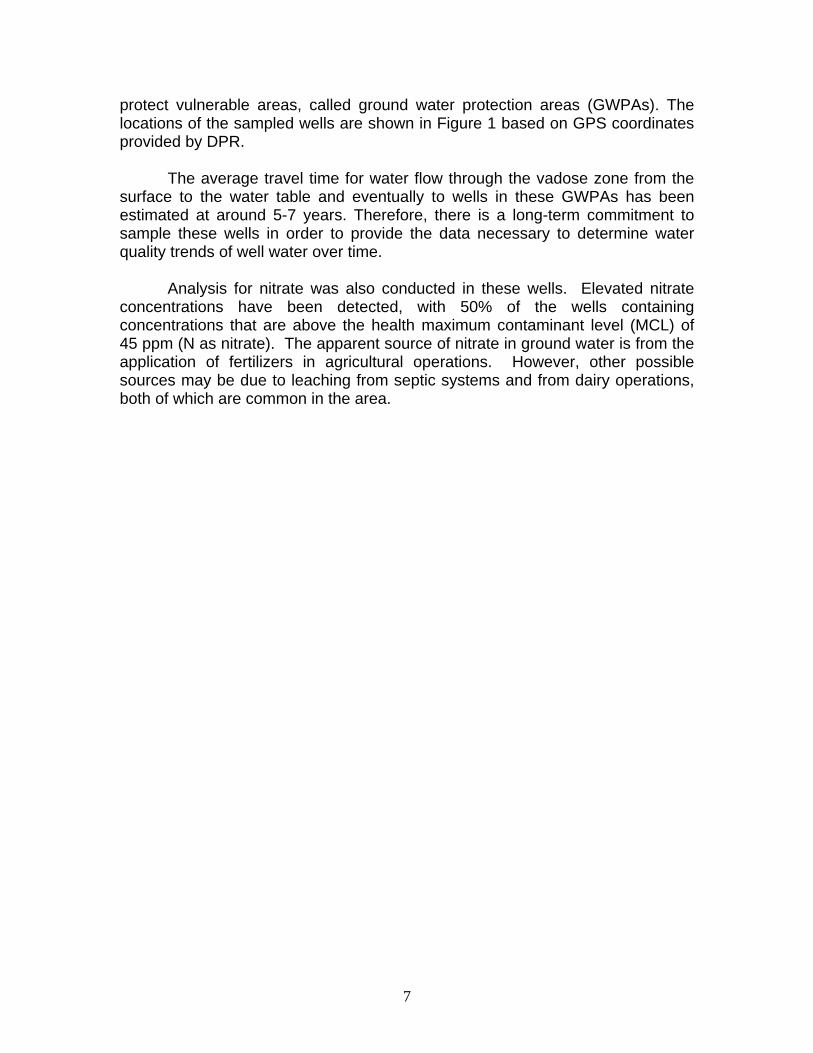
protect vulnerable areas, called ground water protection areas (GWPAs). The locations of the sampled wells are shown in Figure 1 based on GPS coordinates provided by DPR.
The average travel time for water flow through the vadose zone from the surface to the water table and eventually to wells in these GWPAs has been estimated at around 5-7 years. Therefore, there is a long-term commitment to sample these wells in order to provide the data necessary to determine water quality trends of well water over time.
Analysis for nitrate was also conducted in these wells. Elevated nitrate
concentrations have been detected, with 50% of the wells containing concentrations that are above the health maximum contaminant level (MCL) of 45 ppm (N as nitrate). The apparent source of nitrate in ground water is from the application of fertilizers in agricultural operations. However, other possible sources may be due to leaching from septic systems and from dairy operations, both of which are common in the area.
7

Figure 1: Well locations
8

2. METHODOLOGY 2.1 Stable Isotopes Technique
Recent research has indicated that analysis of the ratio of isotopes of nitrogen and oxygen (δ15N and δ18O) in dissolved nitrate can provide a method to distinguish various sources of nitrate contamination. Researchers at the USGS and other research universities recently reported on the use of this method to determine potential sources of nitrate where higher and found that high δ15N ratios were due to animal waste and/or sewage (for example, Wassenaar, 1995; Kendall, 1998; Kendall, et al, 1996; Steffy and Kilham, 2004). This study uses the same methodology and is based on the same isotope hydrological principle and earlier findings of similar studies (Kendall and Aravena, 2000; Suen, et al, 2005; Glowacki and Suen, 2004; Fogg, et al, 1998).
The latest developed mass spectrometry method was used for analyzing nitrogen and oxygen isotopic ratios in dissolved nitrates. This new and more efficient method is currently being adopted by isotope laboratories across the country, including Harvard, Woods Holes, UGGS, Menlo Park and USGS, Reston. It adds denitrifying bacteria strains (Pseudomonas chlororaphis and Pseudomonas Aureofaciens) to the samples in sealed vials and incubated overnight to convert all the nitrate into N2O. The headspace of the vials are sampled by an automatically by an on-line sampler and the gas is purified on-line by cold traps, drying agents, and a GC column. (Sigman et al., 2001).
This method can be applied to measure both δ15N and δ18O ratios (Casciotti et al., 2002). However, δ18O ratio does require comparison to a known nitrate standard to correct for possible fractionation of oxygen. 2.2 Isotope Analytical Procedure
Water samples (71) from wells were collected by DPR personnel. The samples were collected with one-liter desterilized High-density polyethylene (HDPE) bottles and the bottles were kept cool in the field by using an ice chest. They were transported to the laboratory on the same day and were kept at about 4°C. The water was filtered after collection with a 0.45 µm paper filter to remove any suspended sediments. The bottles were then frozen before they were transferred to the isotope analytical laboratory of the United State Geological Survey’s Menlo Park campus.
The samples subsequently thawed completely before aliquots were taken in order to avoid isotope fractionation effect. Approximately, 20 ml. of the samples were used to measure δ15N and δ18O ratios of dissolved nitrate using the latest bacterial denitrifier method as described above in conjunction with a
9

GV Isoprime mass spectrometer in continuous flow mode. All samples were prepared according to the standard denitrifier procedure used by the USGS and analyzed by mass spectrometry. A brief description of the USGS procedure is given in Appendix A. 2.3 Nitrate and Major Mineral Concentrations
In order to set up the mass spectrometer gain, concentrations of nitrate for the sample were required. They were analyzed by a commercial laboratory (Dellavalle Laboratory, Fresno) and supplied by Ms. Cindy Garretson of DPR. In addition, major mineral concentrations were also obtained at the same time. They include the following: chloride, total alkalinity (as CaCO3), Sulfate, calcium, magnesium, sodium, potassium, and iron. Electrical conductivity and pH were also recorded in the laboratory. These data provide additional information for data interpretation and analysis. 2.4 Herbicide Residues and Degradates
Concentrations of herbicides, such as simazine, diuron, bromacil, norflurazon, and propazine, as well as herbicide degradates, such as demethyl-norflurazon, ACET and DACT were analyzed with standard procedures and supplied by DPR.
10

3. RESULTS AND DISCUSSIONS 3.1 δ15N and δ18O in Dissolved Nitrate
The analytical results for δ15N and δ18O in dissolved nitrate of 69 samples are presented in Table 1. Based on the dual isotope ratios approach (Kendall, 1998; Kendall, et al, 1996), the δ18O values are plotted against the δ15N values in Figure 2a. (Appendix B describes the scientific convention for stable isotope ratio measurements). The δ18O values range from -2 to +8‰ (per mil) and the δ15N values from +2 to +8‰ (per mil), except two samples which have δ15N values at about +10‰. When compared with the typical ranges of different nitrate sources compiled by Kendall (1998) as shown in Figure 2b, the isotope ratio values fall in the typical range of mineralized fertilizers (NH4 in inorganic fertilizer) also overlapping the typical range of nitrogen in soil organic matter. These values also lie in the same range of ground water samples collected from eastern San Joaquin Valley in Fresno County in a previous study (Suen, et al, 2005; Marrero, 2008), which finds groundwater nitrate attributing to mainly fertilizer applications. Also similar to the previous study (Suen, et al, 2005; Marrero, 2008), there is no evidence for any significant contribution from animal or human waste components.
This finding is further supported by a significant positive correlation shown in Figure 3 between sulfate concentrations and nitrate concentrations. This observation can be attributed to the common application of sulfate fertilizers and soil amendments in the form of ammonium sulfate ((NH4)2SO4) in areas with alkaline soils in eastern San Joaquin Valley. The sulfate ion (SO4
2-) helps lower the pH of the soil and the ammonia provides nitrogen for plant growth.
To further examine the molal proportions of sulfate among the anions, a
Piper diagram is constructed using the major mineral compositions (Figure 4). (major mineral data are included in Appendix C). The pristine ground water in eastern San Joaquin, which originates mostly from recharge from the Sierra mountains, is expected to have a carbonate-type water composition plotted close to the (HCO3 + CO3) low-left corner of the triangular anionic components plot. It can be seen that most ground water samples are plotted on a linear trend close to the (HCO3
-+ CO32-) – SO4
2- (carbonate-sulfate) side of the triangle with only few samples whose points are displaced towards the chloride (Cl-) corner. These data suggest that the original ground water is contaminated with an addition of a sulfate component more than with a chloride component, which is typically associated with wastewater.
11
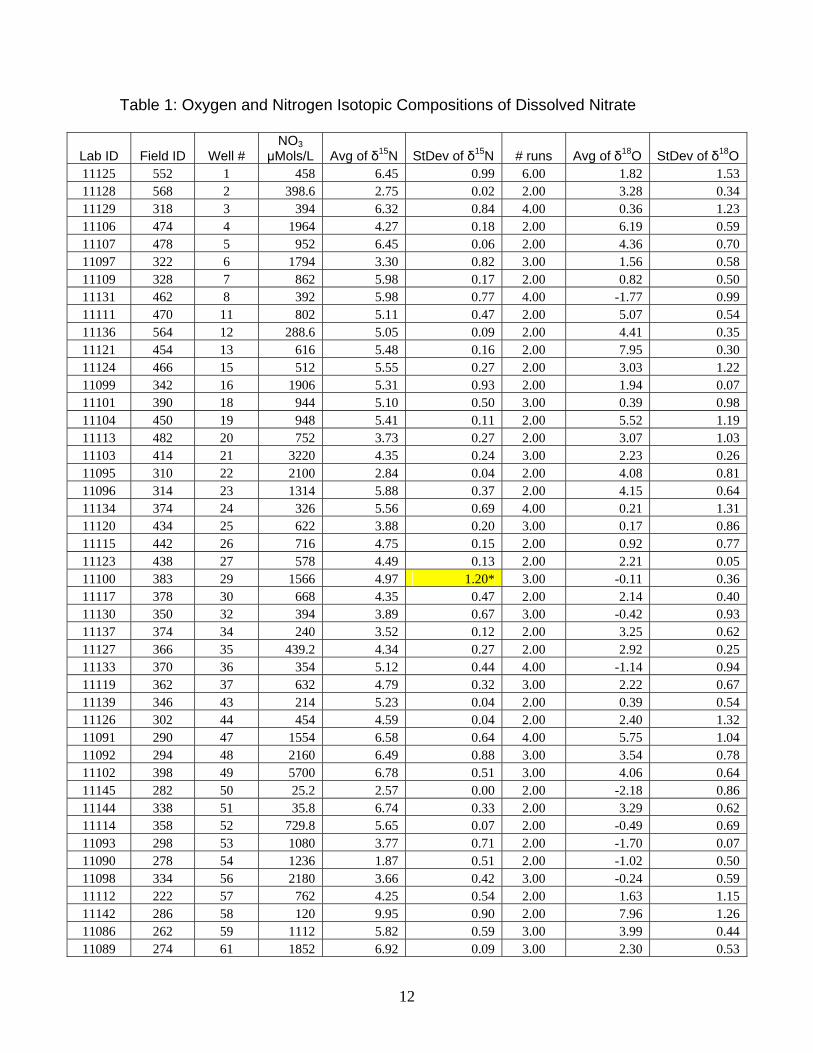
Table 1: Oxygen and Nitrogen Isotopic Compositions of Dissolved Nitrate
Lab ID Field ID Well # NO3
μMols/L Avg of δ15N StDev of δ15N # runs Avg of δ18O StDev of δ18O 11125 552 1 458 6.45 0.99 6.00 1.82 1.53 11128 568 2 398.6 2.75 0.02 2.00 3.28 0.34 11129 318 3 394 6.32 0.84 4.00 0.36 1.23 11106 474 4 1964 4.27 0.18 2.00 6.19 0.59 11107 478 5 952 6.45 0.06 2.00 4.36 0.70 11097 322 6 1794 3.30 0.82 3.00 1.56 0.58 11109 328 7 862 5.98 0.17 2.00 0.82 0.50 11131 462 8 392 5.98 0.77 4.00 -1.77 0.99 11111 470 11 802 5.11 0.47 2.00 5.07 0.54 11136 564 12 288.6 5.05 0.09 2.00 4.41 0.35 11121 454 13 616 5.48 0.16 2.00 7.95 0.30 11124 466 15 512 5.55 0.27 2.00 3.03 1.22 11099 342 16 1906 5.31 0.93 2.00 1.94 0.07 11101 390 18 944 5.10 0.50 3.00 0.39 0.98 11104 450 19 948 5.41 0.11 2.00 5.52 1.19 11113 482 20 752 3.73 0.27 2.00 3.07 1.03 11103 414 21 3220 4.35 0.24 3.00 2.23 0.26 11095 310 22 2100 2.84 0.04 2.00 4.08 0.81 11096 314 23 1314 5.88 0.37 2.00 4.15 0.64 11134 374 24 326 5.56 0.69 4.00 0.21 1.31 11120 434 25 622 3.88 0.20 3.00 0.17 0.86 11115 442 26 716 4.75 0.15 2.00 0.92 0.77 11123 438 27 578 4.49 0.13 2.00 2.21 0.05 11100 383 29 1566 4.97 1.20* 3.00 -0.11 0.36 11117 378 30 668 4.35 0.47 2.00 2.14 0.40 11130 350 32 394 3.89 0.67 3.00 -0.42 0.93 11137 374 34 240 3.52 0.12 2.00 3.25 0.62 11127 366 35 439.2 4.34 0.27 2.00 2.92 0.25 11133 370 36 354 5.12 0.44 4.00 -1.14 0.94 11119 362 37 632 4.79 0.32 3.00 2.22 0.67 11139 346 43 214 5.23 0.04 2.00 0.39 0.54 11126 302 44 454 4.59 0.04 2.00 2.40 1.32 11091 290 47 1554 6.58 0.64 4.00 5.75 1.04 11092 294 48 2160 6.49 0.88 3.00 3.54 0.78 11102 398 49 5700 6.78 0.51 3.00 4.06 0.64 11145 282 50 25.2 2.57 0.00 2.00 -2.18 0.86 11144 338 51 35.8 6.74 0.33 2.00 3.29 0.62 11114 358 52 729.8 5.65 0.07 2.00 -0.49 0.69 11093 298 53 1080 3.77 0.71 2.00 -1.70 0.07 11090 278 54 1236 1.87 0.51 2.00 -1.02 0.50 11098 334 56 2180 3.66 0.42 3.00 -0.24 0.59 11112 222 57 762 4.25 0.54 2.00 1.63 1.15 11142 286 58 120 9.95 0.90 2.00 7.96 1.26 11086 262 59 1112 5.82 0.59 3.00 3.99 0.44 11089 274 61 1852 6.92 0.09 3.00 2.30 0.53
12

Lab ID Field ID Well # NO3
μMols/L Avg of δ15N StDev of δ15N # runs Avg of δ18O StDev of δ18O 11088 270 63 1086 4.97 0.62 2.00 4.92 1.44 11132 556 65 368 6.51 0.47 4.00 0.44 1.28 11143 238 68 70 6.70 0.33 2.00 5.11 2.89* 11087 266 69 1254 6.40 0.66 3.00 5.97 1.14 11081 230 71 1156 4.97 0.00 2.00 4.76 0.12 11080 226 72 1558 5.00 0.27 2.00 6.60 0.04 11108 254 73 904 6.23 0.16 4.00 3.34 0.22 11082 234 74 1456 6.89 0.62 2.00 5.43 0.54 11083 246 75 1270 5.44 0.64 2.00 4.75 1.13 11135 218 79 310 10.47 0.75 3.00 6.35 1.59 11079 206 80 2620 6.93 0.81 2.00 5.20 0.52 11084 250 84 1698 7.80 0.40 3.00 3.33 0.87 11085 258 85 1478 5.30 0.44 4.00 6.13 1.28 11078 202 86 1842 6.53 0.42 2.00 4.70 1.15 11141 210 88 152 6.95 0.01 2.00 -2.12 0.45 11138 410 89 216 4.41 0.05 2.00 0.67 0.79 11122 386 90 606 5.11 0.23 2.00 2.07 0.18 11116 330 92 688 7.25 0.32 2.00 3.53 1.18 11094 306 94 1606 6.05 0.52 2.00 6.32 0.56 11140 394 95 192 4.21 0.28 2.00 1.36 0.01 11105 458 101 1144 5.61 0.19 3.00 0.75 0.30 11118 446 102 648 4.39 0.21 4.00 1.73 0.36 11147 103 103 93.9 6.54 0.22 2.00 1.28 0.39 11110 426 105 860 2.58 0.34 2.00 -0.96 0.35
* Higher than normal
13

Delta 18O and Delta 15N
R2 = 0.1834
-4.00
-2.00
0.00
2.00
4.00
6.00
8.00
10.00
0.00 2.00 4.00 6.00 8.00 10.00 12.00
Delta 15N in per mil
Delta
18O
in p
e r
Delta 18O and Delta 15NLinear (Delta 18O and Delta 15N)
Figure 2a: Dual isotope plot of δ18O versus δ15N.
-10
0
10
20
30
40
50
60
70
-15 -10 -5 0 5 10 15 20 25 30 35 40
Manure and septic waste Soil N
NH4 in Fertilizer and rain
desert NO3 deposits
NO3 fertilizer
denitrification
NO3 in precipitation
Figure 2b: Sample data in relation to the typical ranges of nitrate sources
(Kendall, 1998). The denitrification trend is shown by the arrow.
14

NO3 and SO4
R2 = 0.6295
0
50
100
150
200
250
300
0 100 200 300 400
SO4 (mg/L)
NO
3 (m
g/
SO4 and NO3Linear (SO4 and NO3)
Figure 3: Plot of nitrate concentrations versus sulfate concentrations. A
significant correlation is shown by the linear regression line.
15

Piper Diagram
20%
20%
20%
40%
40%
40%
60%
60%
60%
80%
80%
80%
16
Mg
Ca
20%
20%
20%
40%
40%
40%
60%
60%
60%
80%
80%
80%
SO4
Cl
SO4 +
Cl Ca + M
g
Na + K
HCO 3
+ CO
3
80%
80%60
%
60%40
%
40%20
%
20%
ABH
H
CC
C
A
A
B
B
B
E
E
E
K
K
E
E
A
A
DD
D
L
L
L
G
A
A
C
C
C
H
K
K
A
A
A
O
O
O
A
A
A
K
K
K
G
G
A
A
A
P
P
BB
B
M
OO
O
C
C
GG
G
O
O
O
K
K
K
O
O
O
AA
A
G
G
G
B
B
B
L L
L
PH
H
H
J
J
J
P
P
P
CC
C
B B
B
AA
A
L
L
I
I
I
P
P
P
G
G
G
D
D
D
D
D
E
E
E
O O
J
J
J
H
H
H
M
M
M
O
O
C
C
C
O
O
O
J
J
J
G
G
G
M
M
M
H
H
H
M
M
M
K K
K
C
C
C
E
E
E
AA
A
H
H
H
DD
D
D
D
D
BG
G
B
K
O
O
K
E
PI
I
I
A
G
C
D
OP
P
P
A
M
M
L
O
O
P
P
OO
O
Figure 4: Piper diagram showing molal proportions of major cations and anions.

In addition, the δ15N values have not been significantly affected by the denitrification process in the soil with the possible exception of two high-end δ15N values (Well No. 58 and No. 79). The typical denitrification trend is also shown in Figure 2. If the original δ15N values have been widely affected by the process, a correlation between δ15N values and nitrate concentrations is expected. However, Figure 5 shows no significant correlation between δ15N values and nitrate concentrations, and therefore, the ground water samples have retained the nitrogen isotope signature without subsequent modification by denitrification in the soil. 3.2 Relationship Between Nitrate and Herbicide Concentrations Figures 6 and 7 show the relations between nitrate concentrations and the concentrations of simazine and diuron in the ground water samples. No significant correlations are observed.
However, the herbicides most likely have undergone considerable degradation during movement through the vadose zone where they are subjected to chemical decomposition and biological degradation processes, such as hydrolysis, aerobic, or anaerobic bacterial degradation. To examine the relation of herbicide and fertilizer applications, the concentration of herbicide degradates, DACT (diamino chlorotriazine) and ACET (2-amino-4-chloro-6-ethylamino-s-triazine) are plotted against nitrate concentrations in Figures 8 and 9. Moderate correlations are observed. Although the correlations are moderately significant, they do show positive trends indicating a general relationship between the herbicide and fertilizer applications. Therefore, the movement of herbicide residues and degradations most probably follows similar subsurface pathways as other widely used agrichemicals such as inorganic fertilizers, and they are found in ground water in the same general areas.
Hence, for the purpose of model calibration and for indentifying the
vulnerability in ground water protection areas, a survey of nitrate concentrations and nitrate isotope ratios in ground water may be used as statistical proxy. However, it is important to point out that this study only represents a preliminary analysis with limited data and data controls. Therefore, more detailed analyses of the available data and expanded spatial coverage and sampling control are desirable and recommended. Other useful data may also include sampling depths, land use (crop patterns), subsurface geology and soil types, water-table depths, amounts of fertilizer and herbicide usage, and estimates of nitrate loading.
17

Delta N-15 isotopic ratios and nitrate concentration
R2 = 0.0289
0.0
50.0
100.0
150.0
200.0
250.0
300.0
0.00 5.00 10.00
Delta N-15 isotopic ratios in per mil
Nitr
ate
Con
cent
ratio
n (m
g/L
as N
)
Delta N-15 isotopic ratiosand nitrate concentration
Linear (Delta N-15 isotopicratios and nitrateconcentration )
Figure 5: Plot of nitrate concentrations versus the values of δ15N. No
significant correlation is observed. δ15N of residual nitrate increases with denitrification. A negative correlation would indicate that the samples have undergone significant denitrification process.
18

Simazine and NO3
R2 = 0.009
0.000
0.050
0.100
0.150
0.200
0.250
0.0 50.0 100.0 150.0 200.0 250.0 300.0
NO3 in mg/L
Sim
azin
e in
ug/
L
Simazine and NO3Linear (Simazine and NO3)
Figure 6: Plot of simazine residue concentrations versus nitrate
concentrations. No significant correlation is observed.
Figure 7: Plot of diuron residue concentrations versus nitrate
concentrations. No significant correlation is observed.
19

DACT and NO3
R2 = 0.2696
0.0001.0002.0003.0004.0005.0006.0007.000
0.0 50.0 100.0 150.0 200.0 250.0 300.0
NO3 in mg/L
DAC
T in
ug/
L
DACT and NO3Linear (DACT and NO3)
Figure 8: Plot of DACT (diamino chlorotriazine) concentrations versus nitrate concentrations. They are moderately correlated as shown by the linear regression line.
ACET and NO3
R2 = 0.237
0.000
0.500
1.000
1.500
2.000
0.0 50.0 100.0 150.0 200.0 250.0 300.0
NO3 in mg/L
AC
ET in
ug/
L
ACET and NO3Linear (ACET and NO3)
Figure 9: Plot of ACET (2-amino-4-chloro-6-ethylamino-s-triazine) concentrations versus nitrate concentration. They are moderately correlated as shown by the linear regression line.
20

4. CONCLUSIONS AND RECOMMENDATIONS Based on this preliminary data survey, the following are the initial conclusions and recommendations for further studies: 1. Stable isotope ratios (δ15N and δ18O) of dissolved nitrate in ground water
samples from eastern San Joaquin valley lies within the typical range of isotopic values from mineralized fertilizers. The range of values from this study is similar to those from a previous ground water study in the same region. These values are consistent with the assumption that the main source of nitrate in the ground water is from the application of fertilizers and soil amendments.
2. The predominant fertilizer and soil amendment component is ammonium
sulfate which is a commonly applied in the region. 3. Although nitrate contributions from animal or human waste are possible, the
results indicate that they are probably not the predominant source of nitrate in the ground water samples.
4. There is no evidence of significant denitrification. Thus, the isotope ratios
provide a reasonably reliable signature with regard to nitrogen sources. 5. The concentrations of nitrate do not show a strong correlation with the
concentrations of the herbicide residues. However, nitrate concentrations do exhibit moderately significant positive trends with the concentrations of herbicide degradates (DACT and ACET). They probably follow similar pathways and are controlled by the same advective transport process through the vadose zone. Therefore, ground water nitrate and other agrichemicals could provide a statistical proxy for herbicide movement in the subsurface environment.
6. More detailed multivariate, spatial data analyses, for example, multiple
regression and principal components analysis using major minerals and other related data are highly recommended. In additional, other data sets, such as land-use data, sampling depths, and fertilizer and herbicide application, should also be included so that a more thorough understanding of their interrelationships could be obtained.
21

5. LIST OF REFERENCES
Canter, L.W., 1997, Nitrates in groundwater: Boca Raton, FL, CRC Press, 263 p. Casciotti, K.L., D. M. Sigman, M. Galanter Hastings, J. K. Bo1hlke, and A.
Hilkert, 2002. Measurement of the Oxygen Isotopic Composition of Nitrate in Seawater and Freshwater Using Denitrifier Method, Anal. Chem., 74, 4905-4912
Collins, J.J., 1993, Reconnaissance of water quality at four swine farms in Jackson County, Florida: U.S. Geological Survey Open File Report 95-770, 33 p.
Fogg, F.E., Collins, J.J., 1993, Reconnaissance of water quality at four swine farms in Jackson County, Florida: U.S. Geological Survey Open File Report 95-770, 33 p.
Fogg, F.E., Rolston, D.E., Decker, D.L., Louie, D.T., and Grismer, M.E., 1998b, Spatial variation in nitrogen isotope values beneath nitrate contamination sources: Ground Water, v. 36, no. 3, p. 418-425.
Glowacki, S.D. and Suen, C.J., 2004, A Survey of δ18O and δ15N Ratios in
Ground Water from an Agricultural Community in the San Joaquin Valley, California, Eos Trans. AGU, 85(46), Fall Meet. Suppl.
Kendall, C., and Aravena, R., 2000, Nitrate isotopes in groundwater systems, in Cook, P.G., and Herczeg, A.L., eds., Environmental tracers in subsurface hydrology: Boston, Kluwer Academic Publishers, p. 261-297.
Kendall, C., 1998, Tracing nitrogen sources and cycling in catchments, in
Kendall, C., and McDonnell, J.J., eds., Isotope tracers in catchment hydrology. Elsevier Science B.V., Amsterdam, 839 p.
Kendall, C., Silva, S.R., Chang, C.C.Y., Burns, D.A., Campbell, D.H., and
Shanley, J.B., 1996, Use of the d18O and d15N of nitrate to determine sources of nitrate in early spring runoff in forested catchments: International Atomic Energy Agency, Symposium on Isotopes in Water Resources Management, Vienna, Austria, March 20-24, 1995, v. 1, p. 167-176.
Marrero-Cuebas, R., 2008, Nitrate loading in ground water from Eastern San
Joaquin Valley, California using δ15N and δ18O isotopic ratios, M.S. thesis, California State University, Fresno.
Sigman, D.M., Casciotti, K.L., Andreani, M., Barford, C., Galanter, M., and
Bohike, J.K., 2001, A Bacterial Method for the Nitrogen Isotopic Analysis
22
of Nitrate in Seawater and Freshwater in Analytical Chemistry, v. 73 p. 4145 –4153
Steffy, L.Y. and Kilham, S.S., 2004. Elevated δ15N in stream biota in areas with
septic tank systems in an urban watershed, Ecological Applications, 14(3), pp. 634-641.
Suen, C. John, Marrero-Cuebas, Rosenelsy, and Glowacki, Susan D., 2005,
Groundwater Quality and Isotopic Studies of the Kings River Alluvial Aquifer, Geological Society of America, Abstract with Programs, Vol. 37, No.4
Wassenaar, L.I., 1995. Evaluation of the origin and fate of nitrate in the
Abbotsford Aquifer using the isotopes of 15N and 18O in NO3-. Applied
Geochemistry, v.10, p. 391-405. Acknowledgements
The isotope analyses were carried out using the isotope laboratory of the United State Geological Survey in Menlo Park, California. The author would like to thank Carol Kendall and Steve Silva of USGS for their generous help. Cindy Garretson of the Department of Pesticide Regulation provided the ground water samples and the associated data for each samples. Major mineral analyses were performed by Dallevalle Laboratory, Inc. in Fresno, California, and they were submitted by Ms. Garretson. The author appreciates very much her kind assistance. The author is also grateful to John Troiano of DPR for his support for this work. This study was conducted under the auspices of the California Department of Pesticide Regulation (Agreement No. 05-0102C).
23

APPENDIX A
Procedure for Isotope Ratio Analyses (United States Geological Survey laboratory, Menlo Park)
Collection Pre-Field Preparation 50 mL Nalgene bottles are rinsed and allowed to dry for nitrate collection. Collection During collection, a 60 mL syringe is triple rinsed with sample water then filled with sample and a 0.2 or 0.45 um syringe filter is attached. Sample bottles are filled approximately 80% full and stored chilled in the field and frozen in the lab. Samples may be stored frozen for 6 months. Samples are logged into the nitrate database (referred to as the N Database) and receive a unique lab ID which is affixed to each sample bottle. Analysis Laboratory Preparation Nitrate concentration will be determined by the collaborating project or by arrangement with a USGS lab. Procedures for the preparation of the bacterial cultures are described in detail in Sigman et al. (2001) and Casciotti et al. (2002). 80 vials are inoculated with a sample volume to yield 60nmoles NO3-N. Solutions of working standard #9707 and international standards IAEA N3, USGS 34, and USGS 35 are added between every 10 samples. The sample sequence is recorded on the nitrate sample sequence form. After lysing the cells (Sigman et al., 2001 and Casciotti et al. 2002) samples are loaded into the nitrate auto analyzer. Analysis Following analysis and before corrections are applied, a preliminary inspection of sample size, standard values, blanks and duplicates is conducted to confirm proper instrument function during the run. Raw data are stored (1) in hard copy in the IsoPrime file cabinet, (2) in electronic file format on indexed zip disks, and (3) electronically copied to the data correction lab for final correction. δ15N and δ18O data are corrected for bacterial isotopic fractionation, exchange, and linearity, and entered in the nitrate database.
24

APPENDIX B Scientific Convention for Stable Isotope Ratios
Isotopes are different kinds of atoms of the same element. They have different masses because they have different numbers of neutrons in their atomic nuclei. However, isotopes of the same element have the same number of protons and electrons, and therefore, have similar chemical properties and exhibit same behaviors in chemical reactions. Nevertheless, due to their slight difference in atomic masses and bonding energies, isotopes are fractionated by natural biogeochemical processes. Hence, some elements from different sources and reservoirs in the natural environment exhibit different “isotopic signatures”. Nitrogen
In nature, nitrogen has two common stable isotopes: 14N and 15N. 14N is most abundant in the atmosphere. The percent abundance of 14N in air is 99.63%, and for 15N, it is only 0.37 %. The ratio of 15N /14N helps to differentiate among different nitrogen sources, such as mineral fertilizers, human waste, and animal waste. By convention, the 15N /14N ratio is compared to a standard and reported by using the delta value as defined in the equation below (expressed in “per mil” with the symbol “‰”). Air is used as the standard for nitrogen stable isotope ratios. 15 14 15 14
Sample Standard15 000 15 14
Standard
( N/ N) - ( N/ N)δ N ( ) = ×1000
( N/ N) If the delta ratio is positive the sample was enriched in 15N with respect to air. Oxygen
The two most abundant isotopes are 18O and 16O. The atmospheric abundance for 16O is 99.763 % and for 18O, it is 0.1995 %. The standard ratio for oxygen is VSMOW, Vienna Standard Mean Ocean Water. The delta value expressed in ‰ is given by the equation:
18 16 18 16Sample Standard18 0
00 18 16Standard
( O/ O) - ( O/ O)δ O ( ) = ×1000
( O/ O)
25

26
About the δ value
The δ value is a measurement compared to a standard and it can be positive or negative. If a sample ratio is higher than the standard’s, then the δ value is positive; if lower than the standard’s, than δ is negative.
For example,
The ratio of 15N /14N in air is approximately 1/250 (i.e. 0.004). If a sample has 1% more 15N than Air, its ratio would be:
1.01 × (1/250) = 0.00404. This 1% relative enrichment corresponds to (positive) +10‰ (the ‰ symbol means per mil). If a sample has 1% less 15N than Air, then:
0.99 × (1/250) = 0.00396 This 1% relative depletion corresponds to (negative) −10‰.

APPENDIX C: Major Mineral Compositions
unit μmhos/cm -------------------------------------------------------------------------- ----mg/L---- ---------------------------------------------------------- pH EC Total Cl Ca Mg Na Fe Total NO3 K SO4
Alkalinity Hardness Well No. as CACO3 as CACO3
MCL 900 250 0.3 45 250 MDL 0.03 0.1 0.1 0.2 0.004 0.7 0.04 0.3 0.03 RL 1.0 +/- 10 10 0.1 0.1 0.1 1 0.01 0.7 0.45 0.5 0.2 SM 4500H-B 2510B 2320B 4500CL C 3120B 3120B 3120B 3120B 2340B 4500NO3E 3120B EPA 300.0 200.7 200.7 200.7 200.7 300.0 200.7 300.0 1 8.1 603 265 28.4 42.9 34.1 31.3 <0.01 247 22.85 2.4 13.9 2 7.9 298 109 6.2 16.1 17.9 13.5 <0.01 114 19.93 1.5 21.3 3 7.0 388 107 10 27.6 21.3 17.9 <0.01 156 19.67 1.7 59.9 4 8.0 581 190 13.3 29.1 12.7 70 <0.01 125 98.19 1.6 10.1 5 7.7 959 383 24.5 70 51.3 61.6 <0.01 386 47.56 4.2 85.9 6 7.7 1052 374 30.9 94.3 53 59.6 <0.01 454 89.71 4.9 100 7 7.6 682 264 14.1 57.3 26.5 48.8 <0.01 252 43.06 4.0 50.6 8 8.0 288 87 6.4 21.4 9.3 19.6 <0.01 91.8 19.59 2.0 29.4 11 7.9 500 138 8.6 25.9 35.9 15.9 <0.01 212 40.11 2.7 75.2 12 7.5 223 82 4.3 13.3 13.8 9.7 <0.01 89.8 14.43 1.4 14.1 13 7.7 398 115 7.0 23.3 21.6 18.3 <0.01 147 30.79 1.9 49.9 14 7.6 60 27 1.5 4.3 2.4 2.9 <0.01 20.8 <0.45 0.6 0.5 15 7.7 570 200 9.0 40.2 29.6 27.5 <0.01 222 25.58 3.1 70.9 16 7.2 1080 313 21 91.7 65.3 43.7 <0.01 498 95.26 4.8 189 18 8.0 1050 339 46.1 67.8 15 133 <0.01 231 47.21 4.6 118 19 7.7 434 103 11.8 44.7 14.7 14.3 <0.01 172 47.36 2.4 55.6 20 7.4 258 73.5 3.8 25 6.4 13.7 <0.01 88.8 37.59 1.3 13.3
27

unit μmhos/cm -------------------------------------------------------------------------- ----mg/L---- ---------------------------------------------------------- pH EC Total Cl Ca Mg Na Fe Total NO3 K SO4
Alkalinity Hardness Well No. as CACO3 as CACO3
MCL 900 250 0.3 45 250 MDL 0.03 0.1 0.1 0.2 0.004 0.7 0.04 0.3 0.03 RL 1.0 +/- 10 10 0.1 0.1 0.1 1 0.01 0.7 0.45 0.5 0.2 SM 4500H-B 2510B 2320B 4500CL C 3120B 3120B 3120B 3120B 2340B 4500NO3E 3120B EPA 300.0 200.7 200.7 200.7 200.7 300.0 200.7 300.0
21 7.4 1355 246 35.6 160 59.2 47 <0.01 643 161 5.1 346 22 7.4 891 176 21.1 93.2 39.6 33.2 <0.01 396 105 5.4 185 23 8.0 729 242 14.4 71.7 26 40.3 <0.01 286 65.67 4.2 78 24 7.8 168 50.5 3.4 14.4 6.2 8.0 <0.01 61.7 16.29 1.6 11 25 7.9 196 57 2.5 18.3 7.2 5.4 <0.01 75.4 31.14 1.8 8.9 26 7.8 406 108 12.3 38.5 11.7 19.8 <0.01 144 35.75 2.8 49.9 27 7.9 688 229 36.2 72.8 19.4 33.8 <0.01 262 28.91 4.5 66 29 7.6 540 104 20.8 46.2 21 24.6 <0.01 202 78.31 3.8 69.8 30 7.4 446 132 13 35.8 17.2 26.1 <0.01 160 33.44 2.6 50.5 32 8.0 234 74.5 4.4 23.5 6.0 12 <0.01 83.3 19.72 2.9 17.6 34 7.4 148 47 3.9 14.7 4.5 5.0 <0.01 55.2 12.03 1.2 9.6 35 7.9 175 51 4.1 17.5 4.5 8.2 <0.01 62.2 21.96 2.4 8.1 36 7.9 161 47 3.9 16.6 4.6 6.5 <0.01 60.3 17.72 1.6 7.7 37 8.0 331 110 7.5 33.9 8.2 22.1 <0.01 119 31.61 2.8 21.1 43 7.9 434 186 11.6 39.7 14.9 24.2 <0.01 161 10.26 2.2 22.5 44 8.0 399 162 7.0 37.5 14.3 25.4 <0.01 152 22.66 2.3 19.8 47 7.5 741 191 34.9 68.8 21 48.6 <0.01 258 77.66 4.9 73.6 48 7.6 1089 270 40.2 137 42.4 41.4 <0.01 517 108 3.3 178 49 7.2 2284 311 243 174 60.3 160 <0.01 682 285 4.1 228
28

unit μmhos/cm -------------------------------------------------------------------------- ----mg/L---- ---------------------------------------------------------- pH EC Total Cl Ca Mg Na Fe Total NO3 K SO4
Alkalinity Hardness Well No. as CACO3 as CACO3
MCL 900 250 0.3 45 250 MDL 0.03 0.1 0.1 0.2 0.004 0.7 0.04 0.3 0.03 RL 1.0 +/- 10 10 0.1 0.1 0.1 1 0.01 0.7 0.45 0.5 0.2 SM 4500H-B 2510B 2320B 4500CL C 3120B 3120B 3120B 3120B 2340B 4500NO3E 3120B EPA 300.0 200.7 200.7 200.7 200.7 300.0 200.7 300.0
50 7.8 132 61.5 1.7 15.2 3.8 3.0 <0.01 53.8 1.26 0.9 1.5 51 8.0 140 68 1.7 17.4 3.6 4.8 <0.01 58.3 1.79 0.7 1.7 52 8.0 458 171 8.8 52.1 9.7 28.5 <0.01 170 36.49 2.1 28.3 53 7.9 924 352 31.1 87.2 17 86.3 <0.01 288 54 3.9 65.7 54 7.8 675 245 13.1 64 14.0 48.8 <0.01 218 61.83 2.7 40.7 56 7.7 1096 349 45.6 114 34.3 68.3 <0.01 427 109 4.6 103 57 7.6 586 247 12.5 67.4 19.4 25 <0.01 248 38.09 3.4 25.7 58 7.7 192 87 2.1 19.3 6.9 4.9 <0.01 76.5 6.02 1.4 2.7 59 7.9 670 225 21.8 68.6 24.9 24.4 <0.01 274 55.57 2.7 59 61 7.9 952 272 28.8 90.2 40.0 37.2 <0.01 390 92.6 3.7 124 63 8.0 496 142 12.8 45.5 20.2 13.5 <0.01 197 54.34 1.4 48 65 7.7 441 167 18.9 44 15.2 24.1 <0.01 173 18.4 <0.5 17.2 68 7.9 185 83 5.4 19.8 6.4 5.1 <0.01 75.7 3.5 1.0 2.8 69 7.8 991 333 45.9 95.1 37.8 44.1 <0.01 393 62.72 2.8 96.3 71 7.7 846 285 39.4 74.1 32.4 51.9 <0.01 319 57.8 3.2 68.2 72 7.6 709 185 39.5 63.5 20.5 36.2 <0.01 243 77.89 4.4 59.2 73 7.6 784 249 54 62.5 26.8 48.4 <0.01 266 45.18 4.7 50.8 74 7.8 729 213 31.1 61.3 23.8 41.9 <0.01 251 72.8 2.5 70.3 75 7.8 938 296 71.1 72.8 35.4 52.6 <0.01 327 63.48 3.3 53.9
29

unit μmhos/cm -------------------------------------------------------------------------- ----mg/L---- ---------------------------------------------------------- pH EC Total Cl Ca Mg Na Fe Total NO3 K SO4
Alkalinity Hardness Well No. as CACO3 as CACO3
MCL 900 250 0.3 45 250 MDL 0.03 0.1 0.1 0.2 0.004 0.7 0.04 0.3 0.03 RL 1.0 +/- 10 10 0.1 0.1 0.1 1 0.01 0.7 0.45 0.5 0.2 SM 4500H-B 2510B 2320B 4500CL C 3120B 3120B 3120B 3120B 2340B 4500NO3E 3120B EPA 300.0 200.7 200.7 200.7 200.7 300.0 200.7 300.0
79 7.7 1428 369 131 84.9 44.2 125.7 <0.01 394 15.53 3.7 26.9 80 7.8 1202 322 95.9 99.2 39.8 79 <0.01 412 131 6.0 77.1 84 8.0 663 152 45.6 39.1 18.3 54.7 <0.01 173 84.85 4.3 48.5 85 8.0 791 205 68.5 55.9 23.6 51.5 <0.01 237 73.91 4.0 35.8 86 7.6 2024 231 441 175 67.4 101.9 <0.01 714 92.08 6.4 67.3 88 8.0 353 172 7.2 19.5 15.4 30.8 <0.01 112 7.61 1.7 5.6 89 8.0 211 82 2.9 12 11.7 11.8 <0.01 77.3 10.8 <0.5 11.2 90 8.0 501 166 13.7 40.9 19.1 30.7 <0.01 181 30.25 3.5 48.6 92 8.0 375 106 9.2 38.7 10.7 13.8 <0.01 141 34.43 2.8 41.1 94 7.8 818 243 27.9 83.8 33.6 37.7 <0.01 347 80.3 3.5 87.8 95 7.6 155 53 2.6 13.8 5.1 7.2 <0.01 55.5 9.59 1.5 9.4
101 7.4 673 208 15.2 62.1 23.1 38.3 <0.01 250 57.16 2.9 76.5 102 8.1 394 141 5.6 31.9 12.6 23.8 <0.01 131 32.37 2.3 30.8 103 7.9 1775 400 201 136 35.6 188 <0.01 487 94.48 7.1 152 104 8.0 131 57 2.6 7.7 1.5 17 <0.01 25.5 1.68 1.4 3.4 105 8.0 603 238 18.1 54 25.7 34.9 <0.01 241 43 <0.5 22.3
MCL= Maximum Contaminant Level according to the California Domestic Water Quality and Monitoring Regulations (Title 22) MDL= Method Detection Limit
30

31
unit μmhos/cm -------------------------------------------------------------------------- ----mg/L---- ---------------------------------------------------------- pH EC Total Cl Ca Mg Na Fe Total NO3 K SO4
Alkalinity Hardness Well No. as CACO3 as CACO3
MCL 900 250 0.3 45 250 MDL 0.03 0.1 0.1 0.2 0.004 0.7 0.04 0.3 0.03 RL 1.0 +/- 10 10 0.1 0.1 0.1 1 0.01 0.7 0.45 0.5 0.2 SM 4500H-B 2510B 2320B 4500CL C 3120B 3120B 3120B 3120B 2340B 4500NO3E 3120B EPA 300.0 200.7 200.7 200.7 200.7 300.0 200.7 300.0 RL= Reporting Limit SM= Standard Methods for the Examination of Water and Wastewater, 19th ed., 1995 EPA= Environmental Protection Agency methods unless otherwise indicated.