using groundwater transit times determined from
TRANSCRIPT

USING GROUNDWATER TRANSIT TIMES DETERMINED FROM
ENVIRONMENTAL TRACER CONCENTRATIONS TO
ASSESS STORAGE WITHIN A WATERSHED
by
Jennifer Lynn Georgek
A thesis submitted to the faculty of The University of Utah
in partial fulfillment of the requirements for the degree of
Master of Science
in
Geology
Department of Geology and Geophysics
The University of Utah
May 2016

Copyright © Jennifer Lynn Georgek 2016
All Rights Reserved

T h e U n i v e r s i t y o f U t a h G r a d u a t e S c h o o l
STATEMENT OF THESIS APPROVAL
The thesis of Jennifer Lynn Georgek
has been approved by the following supervisory committee members:
Douglas Kip Solomon , Chair 3/10/16
Date Approved
Victor Michael Heilweil , Member 3/10/16
Date Approved
Paul Jewell , Member 3/14/16
Date Approved
and by John M. Bartley , Chair/Dean of
the Department/College/School of Geology and Geophysics
and by David B. Kieda, Dean of The Graduate School.

ABSTRACT
Previous watershed assessments have relied on annual baseflow estimates to
provide an improved, albeit limited, understanding of the groundwater contribution to
surface water bodies. In order to quantify the volume of groundwater in storage, additional
information such as groundwater mean transit time (MTT) is needed. In this study, several
approaches were evaluated for determining the groundwater MTT in the West Fork
Duchesne River watershed in northeastern Utah. The most promising result was obtained
with lumped-parameter modeling (LPM) of environmental tracers (SF6 , CFCs,
and 3H/3He) from 21 springs within the catchment. Approximately 30% of the springs
exhibited an exponential transit time distribution (TTD); the remaining ~ 70% were best
characterized by a piston-flow TTD. The flow-weighted groundwater MTT for the West
Fork watershed is about 40 years with approximately 20 years spent in the unsaturated
zone. A cumulative distribution of these ages revealed that a majority of the groundwater
within the catchment is between 30 and 50 years old. As a result, the West Fork is
considered a fairly stable catchment; it is hypothesized that short-term changes in recharge
brought about by 5-10 year droughts are unlikely to have as profound effect on this
watershed as compared to systems with shorter MTTs. A chemical hydrograph separation
of West Fork stream flow estimated the average annual baseflow to be ~ 1.7 x 10⁷ m3/year,
which was assumed to be a proxy for groundwater discharge from the watershed. Using
this MTT and baseflow estimation, the volume of mobile groundwater stored in the West
Fork watershed was calculated to be ~ 6.5 x 10⁸ m3. This volume translates to an average
saturated zone thickness of ~ 20 m, or a recharge rate of ~ 0.09 m/year over the area of the
watershed. In addition to spring sampling, several nonvolatile tracers (major ions,
dissolved silica, and tritium) were evaluated in stream water. Over the scale of the
watershed studied, there was no apparent correlation between major ions, or silica, and
groundwater age. Furthermore, the usefulness of baseflow tritium (3H) was significantly
limited given the fact that atmospheric 3H records in the region have only recently
stabilized. Future watershed-scale assessments should evaluate groundwater MTT, in
addition to annual baseflow, in order to quantify groundwater storage and more accurately
assess watershed susceptibility to development and climate variability.
iv

TABLE OF CONTENTS
ABSTRACT ....................................................................................................................... iii
LIST OF TABLES ............................................................................................................ vii
LIST OF FIGURES ......................................................................................................... viii
ACKNOWLEDGEMENTS ............................................................................................... ix
1 INTRODUCTION .........................................................................................................1
1.1 Groundwater Mean Transit Time .......................................................................1 1.2 Groundwater Dating...........................................................................................2
2 STUDY SETTING..........................................................................................................5
2.1 Geography and Climate .....................................................................................5 2.2 Geology ..............................................................................................................8 2.3 Hydrogeology ..................................................................................................10
3 METHODS ..................................................................................................................13
3.1 Sample Collection ............................................................................................13 3.2 Laboratory Analysis .........................................................................................16 3.3 Chemical Hydrograph Separation ....................................................................17 3.4 Lumped Parameter Modeling ..........................................................................19
4 RESULTS AND DISCUSSION ................................................................................23
4.1 Chemical Hydrograph Separation ....................................................................23 4.2 Volatile Tracer Results ....................................................................................25 4.3 West Fork Groundwater Assessment ...............................................................35
4.4 Nonvolatile Tracer Results ...............................................................................40

5 CONCLUSIONS...........................................................................................................47
5.1 West Fork Watershed Susceptibility ..............................................................47 5.2 Determining MTT Using Nonvolatile Tracers ...............................................48
Appendices
A SUPPLEMENTAL DATA FROM WEST FORK SPRING AND STREAM SAMPLING, GAGE, AND VAT DIVERSION..........................................................49
B SUPPLEMENTAL DATA FOR THE EVALUATION OF ADDITIONAL NONVOLATILE TRACERS .....................................................................................87
REFERENCES ..................................................................................................................97
vi

LIST OF TABLES
1 SF6 , CFCs, and 3H/3He Data for West Fork Springs………………………...…….26
2 Selected LPM Data for West Fork Springs………………………...………………28
3 TracerLPM Analysis of West Fork Stream Samples…..……………………….…..45
4 Field Parameters for West Fork Springs………..……………………………….....51
5 Major-ion Chemistry of West Fork Springs..……………………………...............53
6 Field Parameters for West Fork Stream Samples...……………………………......56
7 Major-ion Chemistry of West Fork Stream Samples……………………………...57
8 SF6 , CFCs, and 3H/3He Data for West Fork Stream Samples……….…….............59
9 Continuous Stream Data from the West Fork Gage: March 2014 – March 2015…………………………………………………………60
10 Vat Diversion Records: March 2014 – March 2015……………………………….73

LIST OF FIGURES
1 Shaded relief map of the West Fork watershed………………………………..……6
2 Geologic map of the West Fork watershed……………………………….….…......9
3 Continuous stream specific conductivity as a function of discharge………….…...18
4 Box models of primary LPMs……………………………………………….….….21
5 Chemical hydrograph separation analysis…………………………………….…...24
6 Tracer-tracer plots of CFC-12 versus 3H and SF6 versus 3H……………………....30
7 Tracer-tracer plots of SF6 versus CF-12 for 0 and 18 years UZ travel time…….....34
8 The cumulative age distribution for the West Fork watershed according to West Fork springs…………………………………………………………….……39
9 Piper diagram displaying West Fork spring major-ion chemistry in comparison to location within the watershed……………..………………….……41
10 The relationship between TracerLPM EPM-derived ages and measured dissolved silica at West Fork springs ...…………………………………...………43
11 The relationship between West Fork spring ages and ion chemistry...…...……….89
12 The relationship between West Fork spring ages and specific conductivity.…...…96

ACKNOWLEDGEMENTS
Completion of this project would not have been possible without the support and
expertise of my advisor, Dr. Kip Solomon and committee members, Vic Heilweil and Paul
Jewell. Thank you.
I am also indebted to numerous employees at the United States Geological Survey
(USGS) Utah Water Science Center who provided funding, and aided in fieldwork,
planning, and project development - especially David Susong, Matt Miller, John Solder,
John Carricabaru, Christine Rumsey, Tom Marston, and Chris Shope.
And to my peers, and superiors, at the University of Utah - thank you for your
patience, guidance, and most of all, your friendship. It’s been a pleasure working with you,
Wil Mace, Alan Rigby, Cedar Coleman, Stewart Gubler, Olivia Miller, and Nora Nelson.
And finally, thank you to my parents and brothers whose immeasurable amount of
love and support has given me the determination to pursue my dreams in lieu of all of life’s
obstacles.

1 INTRODUCTION
1.1 Groundwater Mean Transit Time
Groundwater can be a significant fraction of stream discharge, especially in arid to
semiarid regions like the western U.S. where runoff depends predominantly on wintertime
precipitation. Miller et al. (2014) determined the average annual baseflow for 14 streams
and rivers in the Upper Colorado River Basin to be 21-58% of stream discharge. During
periods of low-flow (not including spring snowmelt), this percentage of baseflow as part
of total stream flow was as great as 86% (Miller et al., 2014). Similar results were reported
by Frisbee et al. (2011) for the Saguache Creek watershed in the San Juan Mountains, in
which the maximum groundwater component was 78% of stream discharge during
baseflow conditions. These results stress the importance of understanding the groundwater
within a watershed, but baseflow alone does not provide any information about the volume
of groundwater in storage.
Groundwater mean transit time (MTT), or the amount of time water travels
through the subsurface from a recharge location to a discharge location, is defined as
follows (Cook and Böhlke, 2000):
𝜏𝜏 = 𝑉𝑉𝑄𝑄
( 1)

2
where, τ is MTT, V is the volume of groundwater in storage, and Q is the rate at which the
water is discharging. Assuming that baseflow is representative of groundwater discharge
(Q), we postulate that baseflow estimates can be used in conjunction with groundwater age
determinations to calculate the volume of groundwater stored within a watershed, and
assess groundwater susceptibility to water withdrawals, changes in climate, and (or)
changes in land use that could affect recharge rates in a given region.
1.2 Groundwater Dating
Groundwater age has commonly been determined using environmental tracer
concentrations in groundwater (e.g., Busenberg and Plummer, 1992; Cook and Solomon,
1997; Koh et al., 2007). Atmospheric concentrations of sulfur hexafluoride (SF6 ) and
chlorofluorocarbons (CFCs) have been well-recorded throughout the past 60 years.
Because these tracers are present in infiltration, their air-equivalent concentrations can be
used for groundwater dating. Similarly, thermonuclear testing from 1952 to 1963 created
a spike in atmospheric tritium concentrations that resulted in another useful method for
evaluating groundwater age based on ratios of tritium (3H) to helium-3 (3He) - the
radioactive decay product of 3H (Solomon and Cook, 2000). This study utilizes all of these
tracers in order to evaluate the groundwater age distribution within the West Fork
watershed.
However, because some of these tracers are volatile, their usefulness for dating
groundwater depends on the accuracy to which infiltration, and subsurface transit, is
characterized in order to account for gas exchange with the atmosphere. For example, CFC
and SF6 ages are sensitive to recharge temperature, recharge elevation (e.g., barometric

3
pressure), excess air, and a number of other factors including the potential for
contamination, microbial degradation, and sorption (Solomon and Cook, 2000). These
factors not only necessitate careful sampling, but also require a number of correction
factors, each of which contributes additional uncertainty to age results.
1.2.1 Nonvolatile Tracers
Use of a nonvolatile dissolved constituent for determining groundwater mean
transit time within a watershed would allow data collection to be done in-stream. As a
result, future large-scale watershed assessments could be more comprehensive with only a
minimal expenditure of time and resources. Peters et al. (2014) compared dissolved silica
content to 3H/3He ages in groundwater within the Panola Mountain Research Watershed
(PMRW) in Georgia - a small (0.41 km2) catchment dominated by granitic bedrock. Greater
concentrations of dissolved silica generally correlated to older groundwater ages, a result
attributed to the more prolonged interaction of this water with the subsurface environment,
i.e., longer MTTs (Peters et al., 2014). Morgenstern et al. (2010) reported similar results
for the Toenapi catchment in New Zealand, in which the lowest 3H concentrations -
representative of the oldest waters - correlated to higher dissolved silica (SiO2 )
concentrations. In the West Fork watershed, groundwater silica concentrations were
compared to groundwater ages from springs within the watershed in order to assess the
applicability of this silica-age relationship to yet another hydrogeologic setting. A variety
of major anions and cations were also assessed for a potential correlation between
concentrations and groundwater age.
Another nonvolatile method, relying solely on groundwater 3H concentrations, was

4
investigated in the West Fork watershed. Measurement of 3H in groundwater, in
combination with 3He, is a well-established method for determining groundwater transit
times (e.g., Schlosser et al., 1988; Solomon et al., 1993; Kralik et al., 2014). For many
locations, enough time has passed since initial bomb-testing to allow for sufficient decay
of this 3H, and the stabilization of atmospheric 3H back to natural cosmogenic levels
(Eastoe et al., 2012). This is especially the case in the Southern Hemisphere which received
only about 5% of the nuclear-test 3H released into the atmosphere (Morgenstern et al.,
2010). As a result, this thermonuclear-sourced 3H has not been detectable for nearly 20
years at southern latitudes. This has allowed for the assessment of groundwater transit
times for several watersheds in New Zealand based on 3H concentrations (Stewart et al.,
2007; Morgenstern et al., 2010). Even for a variety of locations in the southwestern United
States, average 3H levels in precipitation have been relatively constant since ~2005
(Morgenstern et al., 2010). This recent stabilization in atmospheric 3H levels may provide
an unambiguous age-dating method for relatively young (<10 year old) groundwater.

2 STUDY SETTING
2.1 Geography and Climate
The West Fork Duchesne River watershed was selected for this study as a result of
elevated 222Rn measured in West Fork stream water by the United States Geological Survey
(USGS) Utah Water Science Center in November 2013 (Chris Shope, written
communication, November 2013); higher in-stream concentrations of 222Rn can be
indicative of groundwater inflow (Genereux and Hemond, 1990; Cook et. al., 2003). This
headwater catchment (~ 181 km2) is located in northeastern Utah within the northern Uinta
Basin of the larger Upper Colorado River Basin (UCRB) (Figure 1) (Utah AGRC, 2016).
Stream flow is from west to east, and extends nearly 29 km before joining the North Fork
and the main channel of the Duchesne River. West Fork elevations range from nearly 2,900
m above sea level (MASL) at the uppermost headwaters to approximately 2,100 MASL at
the North Fork confluence. The main channel is meandering and varies from ~3 to ~12 m
in width. A substantial number of beaver dams have been constructed throughout the
downstream extent of the West Fork and are responsible for diverting flow into multiple
channels where the valley widens. Mean annual air temperature within the watershed is
between ~ 4 to 6 °C (PRISM Climate Group, 2015), and annual precipitation varies from
~ 0.38 - 0.64 m/year at lower elevations, to ~ 0.64 -0.89 m/year in the upper, headwater
locations (PRISM Climate Group, 2014).

6
Figure 1. Shaded relief map of the West Fork watershed (Utah AGRC, 2016). The watershed is highlighted in blue. A total of twenty-one spring sampling locations are denoted by the red circles. Springs A-D lie along a headwater tributary called the Little West Fork. Letters on the map correspond to the following sampling location names: A = LWFDS01, B = LWFDS05, C = New Spring #4, D = LWFDS07, E = WFDS09, F = WFDS08, G = WFDS10, H = WFDS12, I = West Fork (W.F.) Upper Spring, J = Upper Spring B, K = New Spring #1, L = New Spring #2, M = New Spring #3, N = West Fork (W.F.) Lower Spring, O = WFDS13, P = WFDS14, Q = Five Suns Spring, R = South (S.) Side Spring #1, S = WFDS19, T = FR050 Spring, U = North (N.) Side Spring #1. The star denotes the approximate location of the West Fork Gage site, and the “X” gives the approximate location of the stream sampling site above the Vat Dam.

Wes
t f
or
k
A
B
D
E
I-N
O
R S
T
I
N
G
U
J
Q
K
L
M
F H
P
C
U T
A H
Vat D
am
~ 0.
25 m
i ×
3 m
i
7

8
The Vat Dam, located mid-reach along the West Fork, diverts a substantial amount
of West Fork stream flow each year (Figure 1) (CUWCD, 2015). Daily diversion records
were provided by the Central Utah Water Conservancy District (CUWCD) in
Duchesne, Utah for March 2014 to March 2015 (Appendix A). These data were used in
the chemical hydrograph separation analysis for estimating annual baseflow upstream of
the dam. Diversions typically begin at the end of April with approximately 0.14 - 0.57
m3/s (5 to 20 cfs), and then gradually increase to a maximum of about 4.25 m3/s in mid-
to late-May. Diversions decrease throughout the beginning of June, and remain relatively
low, or at 0 m3/s, for the remaining months of the year. At the Vat Dam, discharge
typically ranges between 0.14 - 0.28 m3/s (5-10 cfs) during baseflow conditions, to
upwards of 560 m3/s (~200 cfs) during late spring and early summer.
2.2 Geology
Higher elevations within the West Fork watershed are dominated by the coarse
clastic units of the Uinta Formation (~ 150 - 275 m thick). This unit is comprised of
conglomerates interbedded with mudstone, and to a lesser degree, coarse-grained
sandstones; cement containing bentonite clay is present primarily to the southeast of the
West Fork watershed (Constenius et al., 2011).
In the upper half of the catchment, the north slope of the watershed exposes several
other principal lithologic units, including: the upper Eocene Keetley Volcanics, the lower
members of the Middle Jurassic Twin Creek Limestone, the Nugget (Navajo) Sandstone,
and the mudstones and sandstones of the Upper and Lower Triassic Ankareh Formation
(Figure 2). Unit thicknesses in this region are approximately 0 – 430 m, or more, for the

Rel
evan
t Map
Uni
ts
3 m
i E
AST
HA
LF
OF
TH
E S
ALT
LA
KE
C
ITY
1°x
2° Q
UA
DR
AN
GL
E
PRO
VO
30’
x 60
’ QU
AD
RA
NG
LE
, SA
LT L
AK
E,
UTA
H, A
ND
, WA
SAT
CH
CO
UN
TIE
S, U
TAH
N
G
A
B C
D
E
F H
I-N
O
P Q
R
U
S T
Figu
re 2
. Geo
logi
c m
ap o
f th
e W
est F
ork
wat
ersh
ed (
outli
ned
in b
lack
) (U
tah
AG
RC
, 201
0; C
onst
eniu
s et
al.,
201
1; B
ryan
t, 20
10).
Sprin
g sa
mpl
ing
loca
tions
are
den
oted
by
red
circ
les.
Lette
r ref
eren
ces t
o si
te n
ames
can
be
foun
d in
Fig
ure
1.
Qa
Allu
vium
Qm
c M
ass-
mov
emen
t and
col
luvi
al d
epos
ts
Qm
g M
ass-
mov
emen
t and
gla
cial
dep
osits
Tk
Kee
tley
Volc
anic
s
Ced
ar M
ount
ain
Form
atio
n K
cm
Twin
Cre
ek L
imes
tone
Jt
w
Nug
get S
ands
tone
Jn
Ank
areh
For
mat
ion
T Ra
Thay
nes L
imes
tone
T Rt
Jp
Preu
ss F
orm
atio
n
Twin
Cre
ek L
imes
tone
Jt
rsg
Uin
ta F
orm
atio
n Tu
cb
Pp
Park
City
For
mat
ion
Web
er S
ands
tone
PP
w
9

10
Keetley Volcanics, ~240 m for the Twin Creek, ~400 m for the Nugget, and ~500 m for
the Ankareh. In general, beds dip between 20 - 30 degrees to the S-SW; as a result, several
(younger) units are present in outcrop on the south slope of the watershed that are not
present on the north slope. These include the upper members of the Twin Creek Limestone,
as well as the Middle Jurassic sandstones of the Preuss Formation (~230 m thick in this
region) (Constenius et al., 2011).
The lower half of the catchment reveals several older bedrock units. Lower Permian
to Middle Pennsylvanian Weber Sandstone (~300-500 m thick), the Permian Park City
Formation that is comprised of limestone, siltstone, sandstone, and phosphatic shale (~100
m thick), and the Lower Ankareh Formation dominate lower elevation north-slope geology
(Bryant, 2010). The Nugget Sandstone, Twin Creek Limestone, and the sandstones of the
Cedar Mountain Formation (~355 - 810 m thick) are exposed on the corresponding south
slope (Bryant, 2010).
2.3 Hydrogeology
In general, the geologic units in the West Fork watershed are fairly permeable. Gee
(1994) reported groundwater inflow rates of more than 545 m3/day (100 gal/min) in mines
and tunnels in Park City, Utah, that penetrate the Thaynes Limestone, the Park City
Formation, and the Weber Sandstone. Freeze and Cherry (1979) provide porosity ranges
of 0.00 – 0.20 for limestone and 0.05 – 0.30 for sandstone. More specifically, for the
Nugget Sandstone – one of the primary units in the upper reaches of the West Fork - mean
total porosity (η) has been determined to average ~0.19 in Utah and southwestern
Wyoming, with values as high as 0.35 in some locations (Uygur and Picard, 1984).

11
Additionally, Freethey and Cordy (1991) analyzed over 100 laboratory samples
of the Nugget and concluded that nearly 60% of the samples had hydraulic
conductivities (K) of 0.03 -0.3 m/day (0.1 - 1 ft/day), with nearly 26% having K values
between 0.3 - 3 m/day (1 - 10 ft/day). The estimated transmissivity (T) of the Nugget
aquifer (~465 m2/day or ~5,000 ft2/day) is also fairly high as a result of its considerable
thickness (Freethey and Cordy, 1991). Freethey and Cordy (1991) estimated that the
storage coefficient (S) of the (confined) Nugget aquifer ranges from 0.0003 – 0.008, and
the estimated specific yield (Sy ) is ~0.05 – 0.10 (unconfined aquifer percent).
Despite the dominance of highly permeable sandstone and limestone within the
watershed, there are several confining layers within these geologic units. These include
shales in the Preuss Formation, shales and siltstones in the Gypsum Spring Member and
Boundary Ridge Members of the Twin Creek Limestone, mudstones in the Mahogany
Member and upper member of the Ankareh Formation, as well as phosphatic shales in the
Park City Formation (Ashland et al., 2001).
The presence of these confining units, and the overall geologic heterogeneity within
the West Fork, provide the possibility for a wide range of hydrologic characteristics which
control the apparent groundwater age distribution within the watershed. For example,
unconfined regions – those dominated by the Thaynes, Nugget, and Twin Creek
Formations – are likely characterized by more uniform recharge to the water table.
Groundwater discharge from these units could be a mix of both young and old water that
has recharged from both near and far. Contrary to this unconfined conceptual model is a
more heterogeneous model in which confining layers result in significant spatial variability
for the rate at which recharge, and discharge, occurs throughout the catchment. In this case,

12
recharge is considerably more localized, and as a result, discharging water likely reveals a
more narrow age distribution. Both of these conceptual models are considered in this study.

3 METHODS
3.1 Sample Collection
3.1.1 Stream Sampling
Continuous and discrete stream sampling were necessary for the chemical
hydrograph separation to estimate West Fork baseflow, and for the evaluation of
nonvolatile dating methods. In March 2014, a multiparameter sonde (YSI 600R) was
installed along the lower reaches of the West Fork Duchesne River in order to provide a
continuous record of temperature, specific conductance (SC), and stream stage (via
a pressure transducer) (Figure 1). Continuous stream data are provided in Appendix A. In
addition to these continuous data, SF6 , CFCs, and general chemistry samples were
collected every 6-8 weeks at this gage site, and at a location just upstream of the Vat
diversion (Figure 1).
General chemistry samples were collected for major cation and anion
concentrations including: lithium (Li+), ammonium (NH4+), calcium (Ca2
+), magnesium
(Mg+), sodium (Na+), potassium (K+), bicarbonate (HCO3-), nitrite (NO2
-), bromide (Br-),
nitrate (NO3-), phosphate (PO4
3-), sulfate (SO42-), chloride (Cl-), and fluoride (F-), as well
as dissolved silica (SiO2 ). During each sampling visit, temperature and SC were also
measured using a Hydrolab Multiprobe. Stream SF6 samples were collected in 1-liter
amber glass bottles with polyseal cone-lined caps, and CFCs were collected in 125-mL

14
glass bottles with aluminum lined caps. For stream sampling, SF6 and CFCs were collected
as grab samples in which the bottles were rinsed three times before being completely filled
and then sealed underwater. Two SF6 samples and at least three CFC samples were
collected during each site visit. Stream chemistry samples were collected in 250 mL
polyethylene bottles in the same manner as SF6 and CFCs; however, capping underwater
was not necessary. Stream SF6 , CFC, and chemistry data are provided in Appendix A.
Several stream 3H samples were also collected (as grab samples) primarily during
baseflow conditions in October 2014, and in January and February of 2015 (Table 3;
Appendix A). Once collected, samples were stored in coolers and transported to the
University of Utah for analysis.
3.1.2 Spring (Groundwater) Sampling
USGS topographic quadrangles, and field reconnaissance of the West Fork
watershed, led to the identification and sampling of 21 springs for this study (Figure 1).
These were located both near-channel, and at higher elevations off-channel, and were
assumed to provide an accurate representation of the groundwater age distribution within
the watershed.
Off-channel or high-elevation springs are defined in this study as springs located
outside of the main channel of the West Fork at, or above, an elevation of 2,541 m – the
median elevation of all springs sampled. The dataset includes 9 high-elevation springs
which were mainly sampled in July 2014. The remaining 12 springs are categorized as
near-channel given their proximity to the West Fork Duchesne River. Most near-channel
springs were sampled during baseflow conditions in November 2013, or October 2014.

15
Temperature, SC, pH, dissolved oxygen (DO), barometric pressure, and total dissolved gas
pressure (TDG) were measured at each spring using a Hydrolab Multiprobe. Field
parameters for West Fork springs are provided in Appendix A.
SF6 and CFC samples were collected following United States Geological Survey
(USGS) sampling procedures provided on the USGS Reston Groundwater Dating
Laboratory website (USGS, 2015). Spring samples for major cation and anion
concentrations (including dissolved silica) were collected in the same manner as the stream
samples described in Section 3.1.1. Chemistry samples were either filtered in-field using a
0.45-µm polypropylene membrane filter and then acidified with 2-mL of nitric acid for
preservation, or were transported to the lab within several days of collection and filtered
prior to analysis. Tritium samples were collected as grab samples, and noble gases were
sampled with diffusion samplers, or inline copper tubes, according to the methods
described on the University of Utah’s Dissolved and Noble Gas Lab website (The
University of Utah, 2015). Diffusion samplers were collected 1-7 days after initial
deployment.
Discharge measurements were also made at a majority of the springs. Where
necessary, earthen dams were constructed in order to divert spring discharge into a single
channel. At most sites, a 3 in. Parshall flume was used to measure the depth of the diverted
water which was later converted to discharge using the tables provided by the flume
manufacturer. Several sampling locations were not suitable for the Parshall flume owing
to inability to properly level the flume at the site. Instead, a stopwatch was used to
determine the amount of time required for discharging water to fill a 3.5 gal bucket. Repeat
measurements were made 3-5 times at each of these sites and the average of these trials

16
was taken to be the spring discharge. At the largest spring in the dataset – Five Suns Spring
- discharge was measured using a SonTek FlowTracker Handheld Flow Meter. Discharge
measurements were not made at 3 of the 21 springs due to multiple discharge locations
making a totalized measurement impractical, and/or other site characteristics which
resulted in the inability to level the Parshall flume, or fill the 3.5 gal bucket.
3.2 Laboratory Analysis
SF6 and CFCs were stripped from water samples and measured using a purge-and-
trap gas chromatograph with electron capture detection (ECD) method in the University of
Utah Environmental Tracers Laboratory. Tritium samples were first degassed in stainless
steel flasks under high-vacuum using the extraction line in the University’s Dissolved and
Noble Gas Lab. Extracted samples were sealed and stored for approximately 3 months to
allow for sufficient in-growth of 3He which was then measured using a Helix magnetic
sector-field mass spectrometer.
Copper tube samples were also extracted in the Dissolved and Noble Gas Lab.
Water was transferred from the copper tubes to 500 cc stainless steel flasks under high-
vacuum. While still under vacuum, gases were extracted, collected, and sealed in 60 cc
stainless steel flasks for analysis on the mass spectrometer line consisting of a Stanford
Research System (SRS) – Model RGA 300 quadrupole mass spectrometer for the
measurement of Ne, Ar, Kr, and Xe, and a Mass Analyzers Products – Model 215-50
Magnetic Sector Mass Spectrometer to measure 3He and 4He. Recharge temperature and
excess air were computed for each site using the closed-system equilibration model (CE)
described in Aeschbach-Hertig and Solomon (2013).

17
Carbonate alkalinity (as CaCO3 ) was measured at the University of Utah using a
Metrohm 905 Titrando titrator automated with the 814 USB Sample Processor. Remaining
ions were analyzed using a Metrohm 883 Basic IC plus ion chromatograph (IC). Prior to
analysis on the IC, samples that were not filtered during collection, were filtered in the
laboratory using a 0.45 µm polypropylene membrane filter. For dissolved silica analysis, 3
mL of each filtered sample was placed into a separate vial with 75 µL of Trace Metal Grade
(TMG) hydrochloric acid. These were analyzed by Inductively Coupled Plasma Mass
Spectrometry (ICP-MS), also at the University of Utah.
3.3 Chemical Hydrograph Separation
The West Fork Gage – the site of the continuous discharge and SC record – was
located downstream of the Vat Diversion (Figure 1). The percent difference between this
continuous SC record and several discrete SC measurements made at a site just upstream
of the dam was compared to the continuous discharge record at the West Fork Gage (Figure
3). The resulting relationship was used to estimate the continuous SC record above the
diversion using daily Vat Diversion records obtained from the Central Utah Water
Conservancy District (CUWCD) for the period from March 14, 2014 – March 13, 2015
(Appendix A). In April 2014, several snowmelt samples were collected along the West
Fork between these two stream sampling locations in order to characterize the runoff end-
member SC. Ultimately, daily baseflow discharge was estimated for 2014 to 2015 at
each of the two stream locations using the chemical mass balance approach described in
Miller et al. (2014).

18
Figure 3. Continuous stream specific conductivity as a function of discharge. The percent difference in discrete SC measurements made above the diversion and the continuous SC at the West Fork Gage is presented on the y-axis. The continuous discharge at the gage (Qg) is on the x-axis. This was used in the chemical hydrograph separation analysis to estimate the continuous SC record for the stream above the Vat Diversion.

19
3.4 Lumped Parameter Modeling
3.4.1 Groundwater Transport Models
Measured tracer concentrations were evaluated using TracerLPM – a USGS-
developed Excel workbook for groundwater transport modeling. TracerLPM allows
multiple environmental tracer concentrations to be analyzed simultaneously in order to
determine the age distribution that most appropriately fits the chosen lumped parameter
model (LPM) (Jurgens et al., 2012). Initially, two different LPMs were used to evaluate
the transit time distributions of West Fork springs; these were the piston-flow model
(PFM) and the exponential mixing model (EMM).
The PFM is the simplest LPM and assumes tracer concentrations are confined to a
single flowpath from recharge to discharge, both of which are treated as distinct, point
locations relative to the overall length of subsurface transit (Jurgens et al., 2012).
Therefore, this model does not account for the possibility of mixing or dispersion (Jurgens
et al., 2012). Exit age distributions are calculated from tracer concentrations that are
assumed to only represent the amount of time the tracer was confined to the subsurface,
i.e., the transit time of the water contained in that individual flowpath. The EMM assumes
that recharge is uniformly distributed across the areal extent of the water table up to the
discharge location (Jurgens et al., 2012). In this case, young and old water – entering the
system from both near, and far – are mixed when flowpaths converge upon discharging the
system.
A third LPM – the exponential piston-flow model (EPM) - was also assessed in this
study in order to account for the possibility of recharge being more concentrated at higher
elevations, and less water infiltrating to the depth of the water table near the main channel.

20
The EPM has an additional parameter referred to as the EPM ratio, which is defined as the
ratio of the water table (length) directly recharged by infiltrating water to the extent of the
water table (length) that is not being recharged (Figure 4) (Jurgens et al., 2012). As a result,
this ratio controls the degree to which the age distribution varies between being purely
exponential (EPM ratio = 0), and predominantly piston-flow (EPM ratio > 5) (Jurgens et
al., 2012). The EPM provides the most objective characterization of the age distribution at
each site.
3.4.2 Unsaturated Zone Travel Time
In order for age-dating with environmental tracers to be accurate, factors affecting
gas exchange with the atmosphere must be addressed appropriately. One of these factors is
travel time through the unsaturated zone (UZ). The degree to which 3H, 3He, SF6 , and
CFCs record transit in the unsaturated zone is not the same. However, the default in
TracerLPM is to assume that all tracers start recording time at the water table; therefore, it
neglects the effect that UZ transport may have had on certain tracer input concentrations.
For 3He and SF6 , the default in TracerLPM is reasonable; we can assume that these
tracer concentrations only provide a record of saturated zone transport. Helium-3 has low
solubility and it is likely that any 3He produced in the UZ from 3H-decay is lost to the
atmosphere (Rueedi et al., 2005). SF6 also has a relatively low solubility; as a result SF6
concentrations may remain close to equilibrium with the atmospheric concentration prior
to penetrating the water table (Plummer et al., 2006).
Tritium and CFCs behave differently than 3He and SF6 . As a hydrogen isotope, 3H
is part of the water molecule and infiltrates the ground surface with precipitation

PFM
E
MM
Figu
re 4
. Box
mod
els o
f prim
ary
LPM
s (Ju
rgen
s et a
l., 2
012)
. The
PFM
(upp
er le
ft) d
escr
ibes
the
mos
t sim
plis
tic v
iew
of
grou
ndw
ater
tran
spor
t in
whi
ch w
ater
trav
els
from
a r
echa
rge
loca
tion
to a
dis
char
ge lo
catio
n w
ithou
t the
pot
entia
l for
m
ixin
g, o
r di
sper
sion
(Ju
rgen
s et
al.,
201
2).
The
EMM
(up
per
right
) ac
coun
ts f
or t
he p
ossi
bilit
y of
mor
e sp
atia
lly
dist
ribut
ed r
echa
rge
and
the
mix
ing
betw
een
youn
g an
d ol
d w
ater
that
occ
urs
upon
dis
char
ging
the
syst
em. T
he E
PM
(low
er)
desc
ribes
a s
yste
m t
hat
is s
ome
frac
tion
of p
isto
n-flo
w a
nd e
xpon
entia
l m
ixin
g (J
urge
ns e
t al
., 20
12).
This
va
riabi
lity
betw
een
PFM
, and
EM
M, d
omin
ance
is c
ontro
lled
by th
e EP
M ra
tio (X
’/X).
Whe
n X
’/X >
5, p
isto
n-flo
w is
co
nsid
ered
to b
e th
e re
pres
enta
tive
trans
port
mod
el. P
urel
y ex
pone
ntia
l mix
ing
is re
pres
ente
d by
an
EPM
ratio
of 0
.
EPM
X
X’
21

22
(Zoellmann et al., 2001; Schwientek et al., 2009). Therefore, it records both unsaturated
and saturated zone transport. CFCs also record time in the UZ, perhaps to a lesser extent
than 3H but more than SF6 or 3He (Cook and Solomon, 1995). Similar to SF6 , diffusion
dominates CFC transport through the vadose zone (Schwientek et al., 2009), but CFCs are
more soluble than SF6 , and are therefore less likely to exchange with surrounding
atmospheric gases (Plummer et al., 2006). Cook and Solomon (1995) reported that for a
thicker UZ (~ 30 m thick), CFC apparent ages may be as great as 20 years older than those
estimated by other tracer methods such as 3H/3He. Furthermore, the turnover in the
atmospheric curves for CFCs creates an additional apparent lag time that does not exist for
SF6 because its concentration in the atmosphere is still increasing. The fact that SF6 and
CFCs have different solubilities and diffusion coefficients, as well as dissimilar
atmospheric curves, is presumed to give rise to differences in the transit times determined
from each of these tracers.
When modeling each individual spring, an UZ travel time of 0 years was initially
assigned to each of the tracers (3H, 3He, SF6 , CFC-11, CFC-12, CFC-113). For each
subsequent model run, the UZ travel time assigned to 3H and CFCs was increased by 2-5
years; the UZ travel time for 3He and SF6 was set to 0 years for all model runs with the
assumption that the UZ lag time for these two tracers is minimal. For most sites, 10 to 20
different UZ travel times were tested for 3H and CFCs, ranging from 0 to 35 years.

4 RESULTS AND DISCUSSION
4.1 Chemical Hydrograph Separation
The estimated baseflow end-member SC was ~ 520 µS/cm at the West Fork Gage
and ~500 µS/cm above the Vat Dam. A value of 33 µS/cm was determined to be
representative of the runoff component at both sites. For the duration of the year when no
water was being diverted, baseflow discharge was determined to be slightly higher at the
West Fork Gage than at the site above the diversion (Figure 5). However, during snowmelt
conditions, when Vat diversions were actively occurring, baseflow discharge was
considerably greater at the upstream location than at the gage site (Figure 5).
The annual volume of total discharge measured at the gage was ~2.00 x 10⁷ m3.
Approximately 83% of this total volume, or 1.66 x 10⁷ m3 (18.6 cfs), was estimated to be
baseflow. The annual volume of discharge measured above the diversion was ~2.09 x 10⁷
m3, with 73% of this volume (1.52 x 10⁷ m3) estimated to be baseflow. The annual baseflow
discharge value at the West Fork Gage was used as the representative baseflow volume for
the watershed as a whole since this value was obtained using measured discharge and SC,
rather than estimated values.

Figu
re 5
. C
hem
ical
hyd
rogr
aph
sepa
ratio
n an
alys
is.
The
tota
l st
ream
dis
char
ge (
dotte
d bl
ack
line)
and
the
co
ntin
uous
SC
reco
rd (s
olid
red
line)
mea
sure
d at
the
Wes
t For
k G
age
is s
how
n on
the
abov
e pl
ot. T
he fr
actio
n of
this
tota
l mea
sure
d di
scha
rge
at th
e G
age
that
was
est
imat
ed to
be
base
flow
was
cal
cula
ted
usin
g th
e ch
emic
al
mas
s bal
ance
app
roac
h de
scrib
ed in
Mill
er e
t al.
(201
4) a
nd is
pro
vide
d by
the
solid
bla
ck li
ne.
24

25
4.2 Volatile Tracer Results
4.2.1 Laboratory Analysis
Raw tracer data and dissolved gas results for West Fork springs are presented in
Table 1. All sites have relatively high 3H, SF6, and CFC concentrations, indicating
predominantly modern-aged (post-1950) water. Recharge temperatures determined from
dissolved gas analysis are between 0 and ~3°C for high-elevation springs and range from
~2 to nearly 9°C at lower elevation, near channel, springs. These results are consistent with
expectations - colder water is recharging higher elevation springs, whereas lower-elevation
locations have the potential to receive either lower-elevation recharge or higher-elevation
recharge that has been warmed by more prolonged subsurface transit.
4.2.2 TracerLPM Analysis
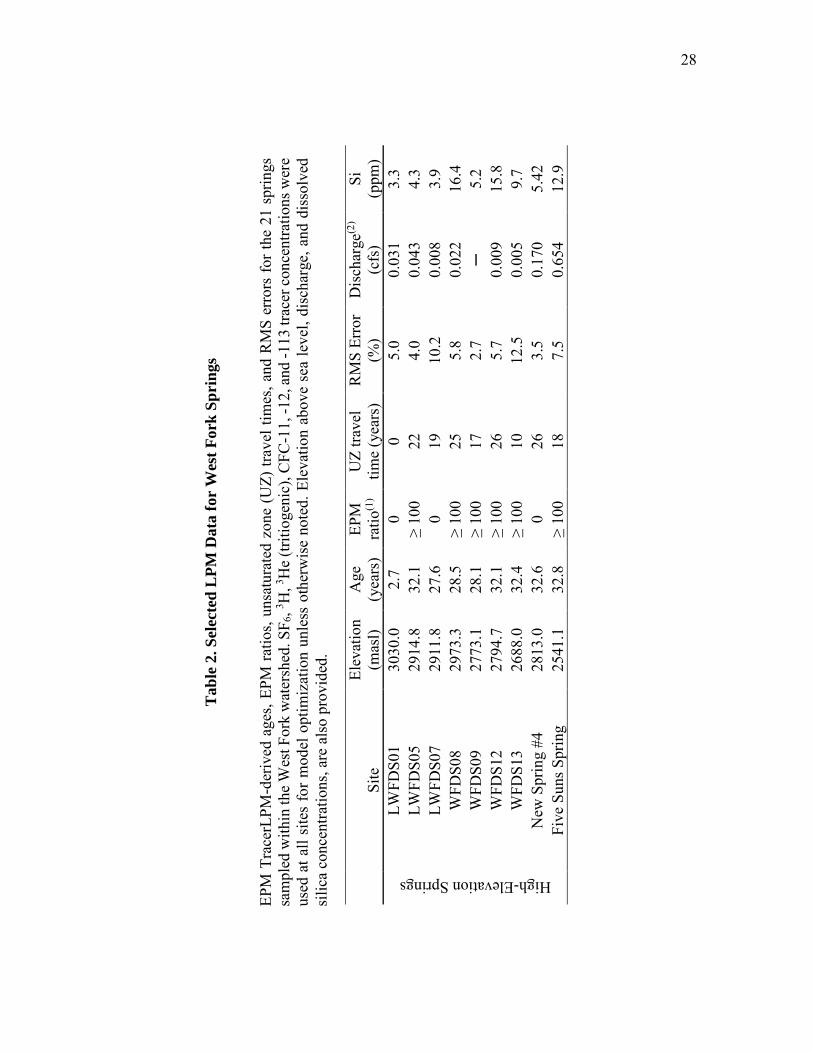
TracerLPM EPM-derived ages, UZ travel times, RMS errors, and EPM ratios are
provided in Table 2. The decision to rely on the EPM results (rather than PFM, or EMM
results) was made as a result of the preliminary tracer-tracer plots provided in Figure 6 that
revealed the age distribution at some West Fork springs was more likely exponential
mixing, while at other sites age distributions were more appropriately modeled by piston-
flow.
Most of the high-elevation, and low-elevation, spring discharge dated in this study
were determined to be approximately 30 years old (Table 2). The exceptions were two low-
elevation, near-channel, springs with ages of 59 ± 16 years (South Side Spring #1) and 115
± 29 years (North Side Spring #1), as well as one low-elevation spring (LWFDS01) and
one high-elevation spring (Upper Spring B) each with a mean age of ~3 years. The

Tab
le 1
. SF
6, C
FCs,
and
3 H/3 H
e D
ata
for
Wes
t For
k Sp
ring
s
Rec
harg
e te
mpe
ratu
re a
nd e
xces
s ai
r w
ere
com
pute
d fr
om n
oble
gas
con
cent
ratio
ns u
sing
the
clo
sed-
syst
em e
quili
brat
ion
(CE)
m
odel
(A
esch
bach
-Her
tig a
nd S
olom
on,
2013
). Sa
linity
was
mea
sure
d us
ing
a H
ydro
lab
Mul
tipro
be.
Triti
um (
3 H),
tritio
geni
c he
lium
(3 H
e),
SF6
, an
d C
FCs
wer
e us
ed f
or
lum
ped-
para
met
er
mod
elin
g to
de
term
ine
appa
rent
ag
es.
The
appr
oxim
ate
unce
rtain
ties
are
prov
ided
for
3 H a
nd 3 H
e. U
ncer
tain
ties i
n re
char
ge te
mpe
ratu
re a
nd e
xces
s air
wer
e no
t exp
licitl
y ev
alua
ted
for e
ach
sam
ple
but a
re a
ppro
xim
atel
y ±
1.5
°C a
nd ±
0.5
mL/
kg, r
espe
ctiv
ely.
The
mea
sure
men
t unc
erta
inty
for s
alin
ity is
~ 5
%, a
nd fo
r SF 6
an
d C
FCs i
t is ~
3%
.
Site
Rec
h.
Tem
p.
(°C
)
Exce
ss
Air
(mL/
kg)
Salin
ity
(‰)
χ2 *
3 H (T
U)
Trit.
3 He
(TU
) SF
6 (p
ptv)
(2)
CFC
-11
(ppt
v) (2
) C
FC-1
2 (p
ptv)
(2)
CFC
-113
(p
ptv)
(2)
High-Elevation Springs
LWFD
S01
2.0
1.7
0.16
0.
07
7.0
± 0.
2 1.
1 ±
0.2
6.8
283.
2 44
5.0
66.6
LW
FDS0
5 0.
9 1.
1 0.
16
0.05
6.
8 ±
0.2
5.2
± 0.
3 5.
2 18
3.2
424.
2 32
.3
LWFD
S07
0.0
2.6
0.23
0.
20
6.3
± 0.
2 11
.5 ±
0.4
4.
6 37
4.9
326.
4 69
.5
WFD
S08
2.0
0.5
0.09
0.
19
7.2
± 0.
3 1.
5 ±
0.3
6.1
201.
3 42
1.7
49.4
W
FDS0
9 0.
0 1.
2 0.
29
0.00
6.
2 ±
0.2
5.4
± 0.
3 5.
5 24
1.4
383.
4 51
.2
WFD
S12
0.0
0.0
0.20
0.
24
7.5
± 0.
4 2.
5 ±
2.0
5.7
156.
5 33
8.0
37.4
W
FDS1
3 0.
0 1.
0 0.
31
0.01
7.
2 ±
0.3
23.7
± 6
.4
3.5
307.
1 24
0.7
43.7
N
ew S
prin
g #4
2.
7 1.
4 ─
2.
86
7.1
± 0.
3 6.
8 ±
0.4
7.0
170.
5 40
8.1
32.6
Fi
ve S
uns S
prin
g 0.
0 1.
2 ─
2.
09
6.7
± 0.
3 9.
0 ±
3.3
4.7
128.
2 30
2.6
33.0
26

Tab
le 1
. con
tinue
d
Site
Rec
h.
Tem
p.
(°C
)
Exce
ss
Air
(mL/
kg)
Salin
ity
(‰)
χ2 *
3 H (T
U)
Trit.
3 He
(TU
) SF
6 (p
ptv)
(2)
CFC
-11
(ppt
v) (2
) C
FC-1
2 (p
ptv)
(2)
CFC
-113
(p
ptv)
(2)
Low-Elevation Springs
W.F
. Low
er S
prin
g 4.
9 0.
8 0.
33
9.80
6.
4 ±
0.2
2.5
± 0.
3 6.
4 20
0.7
462.
1 45
.5
FR05
0 Sp
ring
6.2
1.1
0.44
9.
27
5.0
± 0.
2 7.
6 ±
0.4
2.8
117.
2 25
9.5
26.0
W
.F. U
pper
Spr
ing
4.3
1.1
0.29
10
.85
6.5
± 0.
2 1.
4 ±
0.2
6.2
215.
9 50
7.1
48.2
W
FDS1
0 4.
7 0.
0 0.
10
1.84
8.
6 ±
0.4
0.7
± 0.
2 7.
2 20
6.6
395.
7 46
.6
WFD
S14
4.1
0.2
0.26
0.
02
4.4
± 0.
2 3.
0 ±
0.2
5.7
203.
5 41
3.8
48.2
W
FDS1
9 3.
9 2.
9 0.
45
0.27
5.
4 ±
0.2
11.0
± 4
.3
2.4
101.
4 20
6.1
20.9
W
FDS1
9 R
EP(1
) ─
─
─
─
─
2.
3 13
5.7
291.
3 30
.4
New
Spr
ing
#1
7.7
1.5
─
15.9
4 6.
5 ±
0.3
17.2
± 0
.6
3.7
95.5
27
1.3
24.7
N
ew S
prin
g #2
7.
8 1.
8 ─
19
.31
6.5
± 0.
4 15
.6 ±
0.7
3.
5 10
1.8
291.
9 27
.0
New
Spr
ing
#3
7.8
1.5
─
3.25
7.
0 ±
0.3
15.5
± 0
.5
6.8
206.
0 50
7.4
47.7
N
. Sid
e Sp
ring
#1
2.5
0.4
─
0.20
6.
1 ±
0.2
-0.1
± 1
.3
8.4
23.6
30
3.5
9.1
S. S
ide
Sprin
g #1
2.
4 0.
7 ─
1.
94
1.0
± 0.
1 7.
6 ±
1.8
0.8
36.1
10
7.8
8.0
Upp
er S
prin
g B
8.
7 1.
0 ─
6.
97
6.5
± 0.
2 -1
.8 ±
1.2
8.
8 19
4.0
548.
3 62
.6
(1) W
FDS1
9 RE
P is
the f
ield
dup
licat
e of W
FDS1
9. T
he W
FDS1
9 RE
P tri
tium
sam
ple f
aile
d du
ring
anal
ysis
on
the m
ass s
pect
rom
eter
an
d a
WFD
S19
REP
diss
olve
d ga
s sam
ple
was
not
col
lect
ed.
(2) S
F 6 a
nd C
FC c
once
ntra
tions
are
giv
en in
equ
ival
ent a
ir co
ncen
tratio
ns (p
arts
per
trill
ion
by v
olum
e).
*χ2
is th
e su
m o
f the
(err
or w
eigh
ted)
diff
eren
ces b
etw
een
mod
elle
d an
d m
easu
red
nobl
e ga
s con
cent
ratio
ns (A
esch
bach
-Her
tig a
ndSo
lom
on, 2
013)
27
Site
El
evat
ion
(mas
l) A
ge
(yea
rs)
EPM
ra
tio(1
) U
Z tra
vel
time
(yea
rs)
RM
S Er
ror
(%)
Dis
char
ge(2
) (c
fs)
Si
(ppm
)
High-Elevation Springs
LWFD
S01
3030
.0
2.7
0 0
5.0
0.03
1 3.
3 LW
FDS0
5 29
14.8
32
.1
≥ 10
0 22
4.
0 0.
043
4.3
LWFD
S07
2911
.8
27.6
0
19
10.2
0.
008
3.9
WFD
S08
2973
.3
28.5
≥
100
25
5.8
0.02
2 16
.4
WFD
S09
2773
.1
28.1
≥
100
17
2.7
─
5.2
WFD
S12
2794
.7
32.1
≥
100
26
5.7
0.00
9 15
.8
WFD
S13
2688
.0
32.4
≥
100
10
12.5
0.
005
9.7
New
Spr
ing
#4
2813
.0
32.6
0
26
3.5
0.17
0 5.
42
Five
Sun
s Spr
ing
2541
.1
32.8
≥
100
18
7.5
0.65
4 12
.9
Tab
le 2
. Sel
ecte
d L
PM D
ata
for
Wes
t For
k Sp
ring
s
EPM
Tra
cerL
PM-d
eriv
ed a
ges,
EPM
ratio
s, un
satu
rate
d zo
ne (U
Z) tr
avel
tim
es, a
nd R
MS
erro
rs fo
r the
21
sprin
gs
sam
pled
with
in th
e W
est F
ork
wat
ersh
ed. S
F 6, 3 H
, 3 He
(triti
ogen
ic),
CFC
-11,
-12,
and
-113
trac
er c
once
ntra
tions
wer
e us
ed a
t all
site
s fo
r mod
el o
ptim
izat
ion
unle
ss o
ther
wis
e no
ted.
Ele
vatio
n ab
ove
sea
leve
l, di
scha
rge,
and
dis
solv
ed
silic
a co
ncen
tratio
ns, a
re a
lso
prov
ided
.
28

Tab
le 2
. con
tinue
d
Site
El
evat
ion
(mas
l) A
ge
(yea
rs)
EPM
ra
tio(1
) U
Z tra
vel
time
(yea
rs)
RM
S Er
ror
(%)
Dis
char
ge(2
) (c
fs)
Si
(ppm
)
Low-Elevation Springs
W.F
. Low
er S
prin
g 24
43.3
27
.4
≥ 10
0 21
3.
1 ─
12
.47
FR05
0 Sp
ring
2327
.8
33.9
≥
100
15
8.7
─
14.4
W
. F. U
pper
Spr
ing
2445
.4
27.5
≥
100
23
5.3
0.01
3 ─
W
FDS1
0 25
36.9
28
.2
≥ 10
0 26
5.
7 0.
016
6.7
WFD
S14
2472
.2
28.5
≥
100
19
1.8
0.05
7 6.
9 W
FDS1
9 23
54.0
38
.6
≥ 10
0 17
8.
8 0.
144
7.4
New
Spr
ing
#1
2436
.6
33.4
≥
100
15
9.6
0.42
4 9.
47
New
Spr
ing
#2
2436
.9
36.8
≥
100
16
10.2
0.
017
9.53
N
ew S
prin
g #3
24
63.1
29
.8
0 20
4.
8 0.
040
7.09
N
. Sid
e Sp
ring
#1*
2249
.4
115.
0 0
25
25.6
0.
069
8.4
S. S
ide
Sprin
g #1
22
69.2
59
.0
≥ 10
0 23
26
.4
0.32
2 6.
9 U
pper
Spr
ing
B*
2449
.4
2.7
0 0
6.6
0.01
3 7.
91
*3 H
e (tr
itiog
enic
) was
not
use
d in
mod
el o
ptim
izat
ion
beca
use
nega
tive
valu
es w
ere
retu
rned
from
nob
le g
as a
naly
sis.
(1) A
n EP
M ra
tio ≥
5 is
repr
esen
tativ
e of
pur
ely
pist
on-f
low
. EPM
ratio
s w
ere
gene
rally
far g
reat
er th
an 1
00 (r
angi
ng
from
100
to 5
.5 x
1013
). O
nly
six
site
s yie
lded
EPM
ratio
s of 0
, whi
ch is
cha
ract
eris
tic o
f pur
ely
expo
nent
ial m
ixin
g.
(2) D
isch
arge
mea
sure
men
ts w
ere
mad
e us
ing
a 3
in. P
arsh
all F
lum
e, a
buc
ket a
nd st
opw
atch
or f
low
met
er. D
isch
arge
w
as n
ot m
easu
red
at W
FDS0
9, W
est F
ork
(W.F
.) Lo
wer
Spr
ing,
and
FR0
50 S
prin
g; th
ese
site
s w
ere
not s
uita
ble
for
thes
e m
easu
ring
tech
niqu
es.
29

Figu
re 6
. Tra
cer-
trace
r plo
ts o
f CFC
-12
vers
us 3 H
(lef
t) an
d SF
6 ver
sus
3 H (r
ight
). W
est F
ork
sprin
g co
ncen
tratio
ns a
re d
enot
ed
by b
lack
circ
les
and
gene
rally
plo
t be
twee
n th
e PF
M a
nd E
MM
mod
eled
con
cent
ratio
ns p
rovi
ded
by t
he b
lue
and
red
lines
, re
spec
tivel
y. V
alue
s nex
t to
each
LPM
repr
esen
t the
age
s (in
yea
rs) c
orre
spon
ding
to m
odel
ed c
once
ntra
tions
for t
hat g
iven
LPM
.
30
31
geographic distribution of recharge and hydrogeologic factors affecting the rate of
infiltration and transport through the subsurface provide possible explanations for why
these outliers exist. However, a limited understanding of the precipitation patterns and
geology in the region make it difficult to draw definitive conclusions.
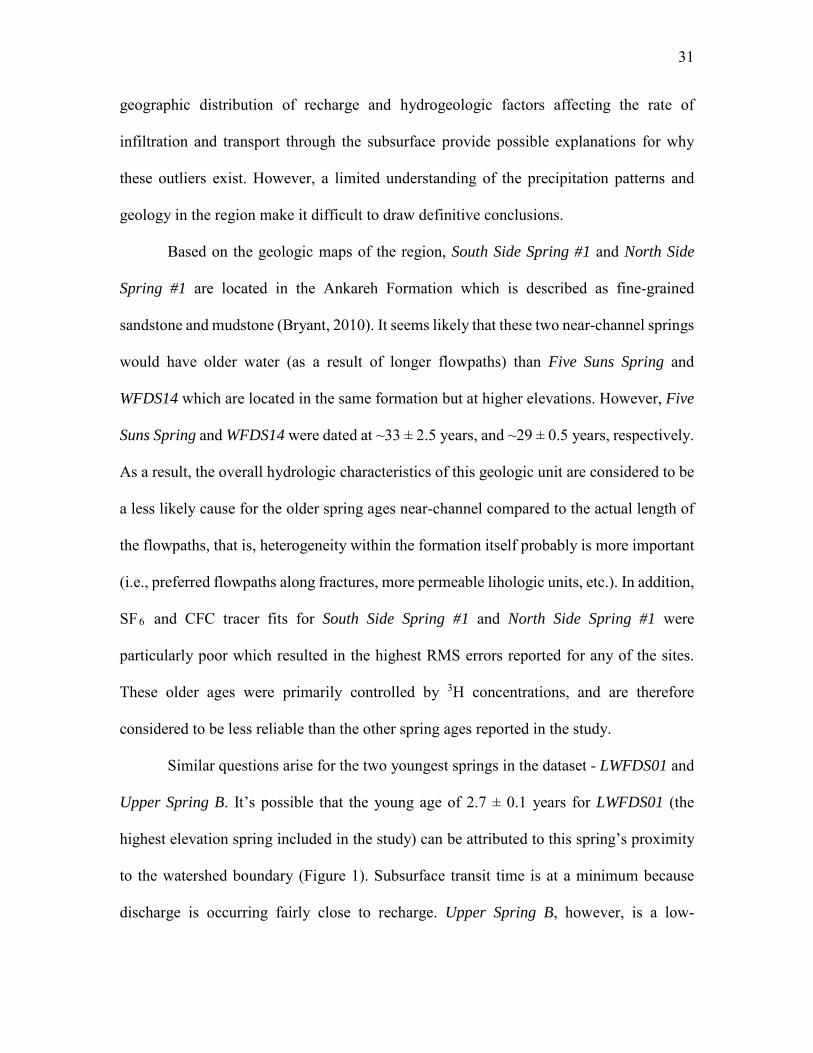
Based on the geologic maps of the region, South Side Spring #1 and North Side
Spring #1 are located in the Ankareh Formation which is described as fine-grained
sandstone and mudstone (Bryant, 2010). It seems likely that these two near-channel springs
would have older water (as a result of longer flowpaths) than Five Suns Spring and
WFDS14 which are located in the same formation but at higher elevations. However, Five
Suns Spring and WFDS14 were dated at ~33 ± 2.5 years, and ~29 ± 0.5 years, respectively.
As a result, the overall hydrologic characteristics of this geologic unit are considered to be
a less likely cause for the older spring ages near-channel compared to the actual length of
the flowpaths, that is, heterogeneity within the formation itself probably is more important
(i.e., preferred flowpaths along fractures, more permeable lihologic units, etc.). In addition,
SF6 and CFC tracer fits for South Side Spring #1 and North Side Spring #1 were
particularly poor which resulted in the highest RMS errors reported for any of the sites.
These older ages were primarily controlled by 3H concentrations, and are therefore
considered to be less reliable than the other spring ages reported in the study.
Similar questions arise for the two youngest springs in the dataset - LWFDS01 and
Upper Spring B. It’s possible that the young age of 2.7 ± 0.1 years for LWFDS01 (the
highest elevation spring included in the study) can be attributed to this spring’s proximity
to the watershed boundary (Figure 1). Subsurface transit time is at a minimum because
discharge is occurring fairly close to recharge. Upper Spring B, however, is a low-

32
elevation, near-channel spring located in the vicinity of New Spring #1, #2, and #3, and
West Fork Lower Spring, and the approximate age for these springs is 32 ± 5 years. Once
again, the limited geologic understanding of the region does not provide a clear explanation
for why Upper Spring B is significantly younger than these neighboring sites, but it is
reasonable to assume that preferential groundwater flowpaths are responsible for faster
transit times even within the same lithologic unit. Another possibility is that Upper Spring
B is simply a lower elevation discharge location of groundwater that was initially
discharged at a higher elevation, thus permitting gas reequilibration before reinfiltrating
the subsurface.
EPM ratios for 6 of the West Fork springs is 0, signifying exponential mixing,
whereas the remaining 15 sites have EPM ratios ≥ 100 which indicate a purely piston-flow
transport model. It is understandable that a majority of the higher-elevation springs are
more appropriately modeled by piston-flow as a result of the limited area over which
recharge likely occurs. However, for the lower-elevation springs, the PFM lumped-
parameter model also best fits the tracer data. This result is somewhat unexpected given
the much greater length of water table available for recharging water to infiltrate prior to
discharging at these lower-elevation locations. The oldest spring in the study (North Side
Spring #1 at ~115 years) is more appropriately modeled by exponential mixing which is
understandable given its proximity to the main channel. However, it seems more likely that
115 year old water would have been recharged from a distant, and more confined, recharge
area represented by piston flow transport. As previously mentioned, the higher RMS error
associated with tracer fits for this site make it a less reliable result in general. This overall
lack in correlation between lumped-parameter models and spring locations is consistent
33
with EPM-determined ages which also show minimal correlation with spring location.
Again, lithologic heterogeneity, and the possibility for preferential flowpaths existing as a
result of subsurface geology, are likely most responsible for controlling groundwater
transport in the West Fork watershed.
On the contrary, there are several exceptions for which lumped-parameter model
and spring location (and recharge temperature) are comparable. Of the springs included in
this study, New Spring #3 and Upper Spring B have the warmest recharge temperatures
(7.8 and 8.7°C, respectively). As expected, these are low-elevation springs which have
purely exponential mixing. Similarly, the fact that the two youngest springs in the study
(LWFDS01 and Upper Spring B) are modeled by exponential mixing is also consistent with
expectations; recharge from nearby is contributing a significant fraction of younger water
to spring discharge in addition to the older water recharged at more distant locations.
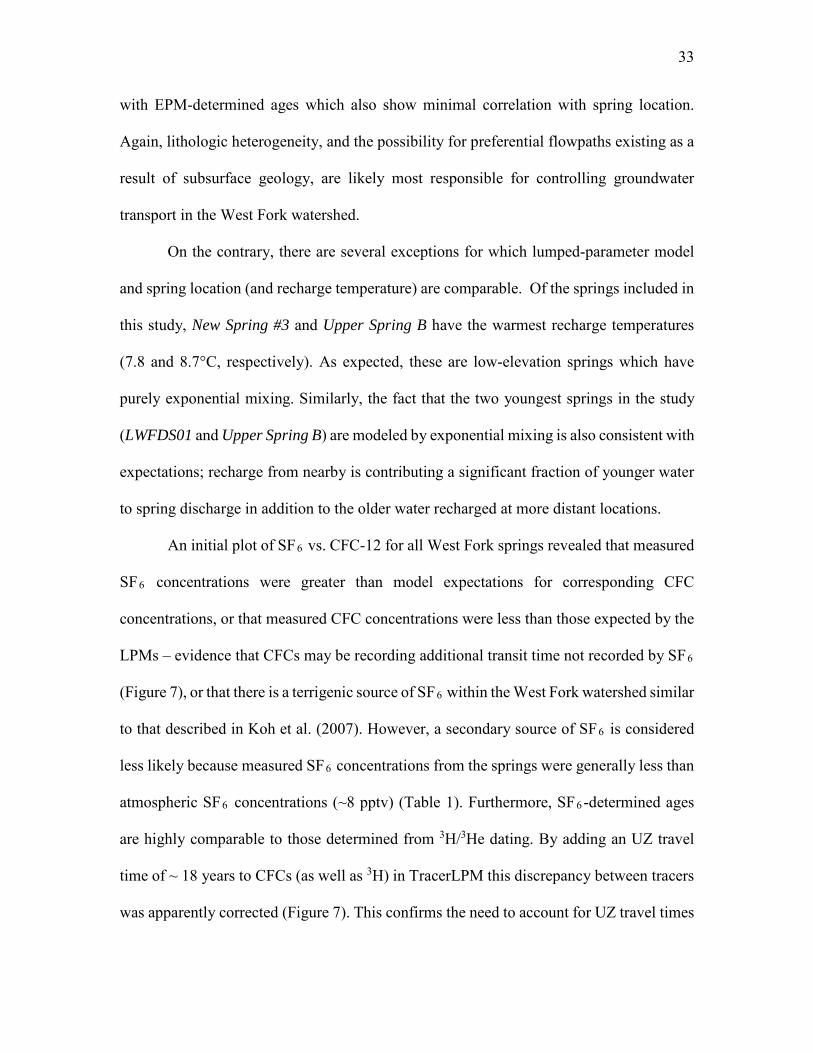
An initial plot of SF6 vs. CFC-12 for all West Fork springs revealed that measured
SF6 concentrations were greater than model expectations for corresponding CFC
concentrations, or that measured CFC concentrations were less than those expected by the
LPMs – evidence that CFCs may be recording additional transit time not recorded by SF6
(Figure 7), or that there is a terrigenic source of SF6 within the West Fork watershed similar
to that described in Koh et al. (2007). However, a secondary source of SF6 is considered
less likely because measured SF6 concentrations from the springs were generally less than
atmospheric SF6 concentrations (~8 pptv) (Table 1). Furthermore, SF6 -determined ages
are highly comparable to those determined from 3H/3He dating. By adding an UZ travel
time of ~ 18 years to CFCs (as well as 3H) in TracerLPM this discrepancy between tracers
was apparently corrected (Figure 7). This confirms the need to account for UZ travel times

Figu
re 7
. Tra
cer-
trace
r pl
ots
of S
F 6 v
ersu
s C
F-12
for 0
(lef
t) an
d 18
yea
rs (r
ight
) UZ
trave
l tim
e. T
he P
FM a
nd E
MM
mod
eled
co
ncen
tratio
ns a
re p
rovi
ded
by t
he b
lue
and
red
lines
, re
spec
tivel
y. V
alue
s ne
xt t
o ea
ch L
PM r
epre
sent
the
age
s (in
yea
rs)
corr
espo
ndin
g to
mod
eled
con
cent
ratio
ns fo
r tha
t giv
en L
PM. W
est F
ork
sprin
g co
ncen
tratio
ns (d
enot
ed b
y bl
ack
circ
les)
gen
eral
ly
have
gre
ater
SF 6
conc
entra
tions
than
mod
eled
exp
ecta
tions
with
0 y
ears
UZ
trave
l tim
e. T
race
r fits
are
impr
oved
whe
n it
is a
ssum
ed
that
CFC
-12
is re
cord
ing
addi
tiona
l tim
e in
the
subs
urfa
ce (~
18
year
s in
the
UZ)
.
34

35
separately for each tracer included in model parameterization. The UZ travel times reported
in Table 2 are those that resulted in the lowest root mean squared (RMS) error for a given
model output. For two of the West Fork springs it was determined that an UZ transit time
of 0 years provided the best-fit between measured, and modeled, tracer values (Table 2).
For all other springs, the average UZ travel time was ~ 20 ± 6 years.
4.3 West Fork Groundwater Assessment
4.3.1 Study Assumptions
Several assumptions were made in this study that deserve careful consideration
before assessing groundwater storage within the West Fork watershed: (1) Is the baseflow
estimate obtained from the chemical hydrograph separation truly representative of
groundwater discharge within the watershed? (2) Can springs provide an accurate
characterization of the discharging groundwater in terms of age and chemistry?; (3) If so,
what fraction of total baseflow volume needs to be sampled from spring sites in order to
characterize watershed groundwater as a whole?
In regards to the first question, baseflow estimates do not necessarily equate to total
groundwater discharge. In reality, baseflow is simply a measure of the groundwater
component that contributes to streamflow. As seen in the West Fork watershed, the river
channel is not the only groundwater discharge location. Using baseflow as a direct proxy
for groundwater discharge fails to account for the discharge occurring at seeps and springs.
However, it is considered to be a decent approximation because, during cool dry baseflow
conditions, discharge at seeps and springs eventually reaches the main West Fork channel.
The answer to question two is largely related to question three. Springs are locations

36
where groundwater flowpaths converge and intersect the land surface. As a result, it can
be assumed that spring water provides a good representation of discharging groundwater
within (at least) a portion of the total watershed area – the area over which that groundwater
was recharged. Therefore, spatially representative spring sampling may be more important
than maximizing the total volume of spring water sampled. In this study, the combined
discharge from the 18 springs with discharge measurements only accounts for
approximately 11% of the total annual estimated baseflow of the stream, but these springs
are distributed throughout the watershed – both close to, and far from, the West Fork, and
ranging from headwater to down-channel locations. Also, the flow-weighted average 3H
concentration of these 18 springs is 5.7 TU. This compares quite closely to the average of
the five baseflow stream 3H measurements (5.6 TU), indicating that the selected springs
adequately represent groundwater in the watershed.
4.3.2 MTT and Storage
The flow-weighted mean age was calculated based on all sites at which discharge
was measured (Table 2). This provided an approximate groundwater MTT of 40 years for
the West Fork watershed. Using Eq. (1), and assuming that the annual average baseflow
value estimated from the chemical hydrograph separation analysis (1.66 x 10⁷ m3/year) is
representative of groundwater discharge rates, the volume of stored groundwater (V) was
was determined to be ~6.5 x 10⁸ m3. Using an estimated porosity of 0.15 - the mean for the
range of porosities provided by Freeze and Cherry (1979) for limestone and sandstone -
the total volume of the saturated zone containing this mobile water is ~4.4 x 10⁹ m3. This
translates to an approximate saturated zone thickness of 24 m, or ~ 0.09 m/year of water

37
recharging the groundwater system that ultimately discharges as West Fork streamflow. It
is important to note that this saturated zone thickness is particularly sensitive to the
assigned value for porosity. For example, if the porosity within the West Fork watershed
is considerably lower at 0.05, then the saturated zone thickness could be as great as ~ 70
m; if the average porosity is significantly higher, around 0.30, then the saturated thickness
could be closer to ~12 m.
Nevertheless, the active circulation depth of groundwater throughout the watershed
is fairly shallow at 24 m (or 12-72 m) in comparison to the thicknesses of the permeable
geologic units within the watershed (i.e., ~230 m-thick Preuss Sandstone, ~240 m-thick
Twin Creek Limestone, ~400 m-thick Nugget Sandstone, and ~500 m-thick Ankareh). This
is attributed to the presence of less permeable shales and siltstones in the more shallow
geologic units, especially in the Preuss and Twin Creek Formations.
The calculated equivalent recharge rate of 0.09 m/year ranges between ~10% of the
annual precipitation falling on the uppermost headwaters to nearly 24% of the annual
precipitation reported for the lower half of the West Fork. For comparison, McMahon et
al. (2011) determined that the median recharge rate for the Basin and Range aquifer system
in western Utah and Nevada is approximately 0.19 m/year; this was based on 24 different
sites at which recharge rates ranged from ~ 0.04 m/year to as much as 1.2 m/year. Average
precipitation in the more mountainous regions of the Basin and Range varies from ~ 0.5 to
0.8 m/year (Robson and Banta, 1995). The recharge rate provided by Mahon et al. (2011),
is ~ 24 – 38% of this annual average precipitation. Robson and Banta (1995), however,
suggest a considerably lower value; according to their study, only 5% of precipitation
replenishes the Basin and Range aquifer each year since most of the precipitation is lost to

38
evapotranspiration. Nonetheless, these results for the Basin and Range are in good
agreement with those determined for the West Fork watershed, especially considering the
variability in characteristics such as, the rate of evaporation, fracture density, hill slope,
and vegetation density between these two sites.
4.3.3 Cumulative Age Distribution
By utilizing the mean age from each spring (as determined by TracerLPM) an
estimate of the cumulative age distribution for the entire watershed was obtained (Figure
8). This cumulative age distribution was constructed by sorting 18 of the 21 springs (the
sites at which discharge was measured) by mean age. Discharge measurements from each
spring were used to calculate the fraction of total flow from each spring, and plotted as the
fraction of flow younger versus the TracerLPM-determined mean age.
Assuming that the sampled volume of spring discharge accurately characterizes the
groundwater within the watershed, the cumulative age distribution plot provides a
representation of the relative volume of old, versus young, water contained therein. For the
West Fork watershed, nearly 80% of the groundwater plots within a narrow age band
ranging from 30 to 50 years (Figure 8). For reference, Figure 8 also shows the theoretical
curve for an exponential distribution, and for piston flow, for a mean age of 40 years. The
observed values plot between these end-member distributions, which is consistent with an
exponential piston flow distribution being representative of the entire watershed.

39
Figure 8. The cumulative age distribution for West Fork watershed according to West Fork springs. The x-axis provides the TracerLPM EPM-derived spring ages, and the y-axis represents the fraction of the total discharge from these springs that is less than a given age (only springs at which discharge was measured is included in this age distribution – WFDS09, West Fork Lower Spring, and FR050 are excluded). As expected, the EPM-derived age results plot between the theoretical exponential and piston flow curves. Both of these theoretical curves are displayed with a mean age of 40 years – the groundwater MTT determined for the West Fork.

40
4.4 Nonvolatile Tracer Results
4.4.1 Major-ion Geochemistry
Major cation and anion concentrations from West Fork springs are provided
in Appendix A. Measured spring ion concentrations as related to TracerLPM EPM-
determined ages are shown in Appendix B; a correlation to spring age is not apparent for
any of the major ions analyzed.
The relationship between spring major-ion geochemistry and location within the
watershed (high- versus low-elevation) was also evaluated. Little, or no, correlation exists
between spring location and concentrations of magnesium, calcium, sodium plus
potassium, or chloride, fluoride, and nitrite plus nitrate (Figure 9). However, the location
of the higher elevation springs on the main diamond of the Piper diagram in Figure 9
reveals that these sites generally contain more carbonate and bicarbonate and less sulfate
(and chloride) than the lower elevation springs visited in this study. Less chemically
evolved water is discharging at higher elevations, which is expected given the proximity
of this discharging water to the area over which recharge occurred.
The average age of the West Fork springs (not flow-weighted) is approximately 30
years. Several low elevation piston-flow springs have ages greater than this mean,
including FR050, WFDS19, New Spring #2, and South Side Spring #1 (North Side Spring
#1 was not included in the geochemical analysis due the potential inaccuracy in measured
concentrations as indicated by its particularly high percent error in charge balance). As
expected, three of these springs have noticeably higher sulfate (and chloride)
concentrations than the presumed-to-be younger higher elevation springs. This concept of
chemical evolution is also consistent with the LPM interpretation discussed in Section 4.2.2

Figu
re 9
. Pip
er d
iagr
am d
ispl
ayin
g W
est F
ork
sprin
g m
ajor
-ion
chem
istry
in co
mpa
rison
to lo
catio
n w
ithin
the w
ater
shed
. H
igh-
elev
atio
n sp
rings
are
con
cent
rate
d in
the
regi
on re
pres
entin
g hi
gher
con
cent
ratio
ns o
f car
bona
te a
nd b
icar
bona
te a
nd
min
imal
am
ount
s of
sul
fate
(and
chl
orid
e). T
he m
ean
(not
flow
-wei
ghte
d) a
ge o
f the
spr
ings
is ~
30 y
ears
; low
-ele
vatio
n sp
rings
old
er th
an th
is m
ean
are
deno
ted
by th
e gr
een
diam
onds
. The
lette
rs c
orre
spon
d to
the
follo
win
g sa
mpl
ing
loca
tion
nam
es: A
= L
WFD
S01,
B =
LW
FDS0
5, C
= N
ew S
prin
g #4
, D =
LW
FDS0
7, E
= W
FDS0
9, F
= W
FDS0
8, G
= W
FDS1
0,
H =
WFD
S12,
J =
Upp
er S
prin
g B,
K =
New
Spr
ing
#1, L
= N
ew S
prin
g #2
, M =
New
Spr
ing
#3, N
= W
est F
ork
Low
er
Spri
ng, O
= W
FDS1
3, P
= W
FDS1
4, Q
= F
ive
Suns
Spr
ing,
R =
Sou
th S
ide
Spri
ng #
1, S
= W
FDS1
9, T
= F
R050
Spr
ing.
41

42
in which piston-flow recharge from higher elevations is ultimately discharging to older,
lower-elevation springs. In contrast, younger, lower-elevation springs dominated by
exponential mixing, e.g., Upper Spring B, are less chemically evolved which is consistent
with more local recharge (Figure 9). New Spring #2 (~37 years of age) plots within the
cluster of higher elevation sites suggesting that age is not the only factor affecting the extent
to which discharging water has chemically evolved. The heterogeneity of the subsurface
geology within the West Fork watershed is also an important factor affecting the
geochemistry of the discharging water.
4.4.2 Dissolved Silica
Dissolved silica concentrations from each spring (Table 1) were plotted against the
age determined using TracerLPM (Figure 10). At this watershed-scale, there is no
correlation between dissolved silica (SiO2 ) and age. This is contrary to the results reported
in Peters et al. (2014) and Morgenstern et al. (2010), suggesting that variations in bedrock
lithology within some watersheds is likely too significant to make this silica-age
relationship universally applicable. For example, in this study, WFDS08 and WFDS12 have
relatively high SiO2 concentrations given their fairly average age. This can at least partly
be explained by the proximity of these two springs to the Keetley Volcanics (Figure 2), a
silica-rich lithologic unit within the West Fork watershed through which groundwater
likely flows prior to discharging at these two sites.

43
Figure 10. The relationship between TracerLPM EPM-derived ages and measured dissolved silica at West Fork springs. Note: dissolved silica was not analyzed for West Fork Upper Spring, and is therefore not included on the above plot. In general, there is no apparent correlation between Si and age within the West Fork watershed – a result attributed to the geologic heterogeneity in a catchment of this size.

44
4.4.3 Stream Tritium
Baseflow 3H concentrations, TB , were calculated using the following mass
balance relationship:
𝑇𝑇𝑠𝑠𝑄𝑄𝑠𝑠 = 𝑇𝑇𝐵𝐵𝑄𝑄𝐵𝐵 + 𝑇𝑇𝑀𝑀𝑄𝑄𝑀𝑀 (2)
where TS and QS refer to measured stream 3H concentrations and total stream discharge,
respectively; QB refers to estimated baseflow discharge from the hydrograph separation
analysis; and TM and QM refer to modern 3H concentrations and the remaining fraction of
stream discharge derived from runoff. Calculated TB values are reported in Table 3 and
range between ~4.9 and ~6.6 TU. These calculated values are similar to measured stream
concentrations, which is consistent with the high percentage of discharge that was
estimated to be baseflow during these sampling times. In general, 3H values are greater at
the upstream site relative to the downstream location, indicating that there is a substantial
amount of older water (groundwater) gained throughout the lower reaches of the watershed.
Age determinations from estimated baseflow 3H concentrations were particularly
sensitive to the transit time distribution modeled in TracerLPM (Table 3). The average
EMM output age was approximately 98 years, but the PFM output age was significantly
less – only 16 years. This discrepancy is attributed to the nonlinear relationship between
atmospheric (input) 3H concentrations and time, and also the fact that present-day
atmospheric 3H has only stabilized in the Northern Hemisphere within the past ~ 10 years.
Additionally, stream 3H ages were flow-weighted based on the resulting EPM ratios
of the TracerLPM analysis of West Fork springs. The MTT for the West Fork watershed

Site
Sa
mpl
e D
ate
Stre
am 3 H
(T
U)
Stre
am
Dis
char
ge(1
) (c
fs)
Est
imat
ed
Bas
eflo
w
Dis
char
ge(2
) (c
fs)
Bas
eflo
w 3 H
(3)
(TU
)
Bas
eflo
w
EMM
Age
(y
ears
)
Bas
eflo
w
PFM
Age
(y
ears
)
Wes
t For
k G
age
(b
elow
Wol
f Cre
ek)
10/9
/201
4 5.
6 ±
0.4
19.0
3 17
.56
5.31
10
7.0
25.5
1/
5/20
15
5.3
± 0.
4 15
.00
14.1
7 5.
12
111.
0 27
.0
2/23
/201
5 5.
1 ±
0.4
13.0
0 12
.39
4.92
11
6.8
18.1
W
est F
ork
abov
e
V
at D
iver
sion
10
/9/2
014
6.7
± 0.
7 10
.00
9.27
6.
55
73.2
5.
0 2/
23/2
015
6.1
± 0.
4 6.
00
5.73
5.
99
84.1
6.
6
Tab
le 3
. Tra
cerL
PM A
naly
sis o
f Wes
t For
k St
ream
Sam
ples
Mea
sure
d tri
tium
con
cent
ratio
ns a
nd d
isch
arge
at t
he tw
o st
ream
sam
plin
g si
tes
is p
rovi
ded.
Bas
eflo
w tr
itium
and
ba
seflo
w d
isch
arge
wer
e es
timat
ed fr
om th
e ch
emic
al h
ydro
grap
h se
para
tion
anal
ysis
. Bas
eflo
w a
ges w
ere
mod
eled
us
ing
Trac
erLP
M.
(1) D
isch
arge
bel
ow W
olf C
reek
was
pro
vide
d by
the
mul
tipro
be m
eter
inst
alle
d at
the
Wes
t For
k G
age
site
. Stre
am
disc
harg
e ab
ove
the
dive
rsio
n w
as ta
ken
from
CU
WC
D d
iver
sion
reco
rds.
(2
) Dis
char
ge a
nd S
C m
easu
red
at t
he W
est
Fork
Gag
e si
te w
ere
used
to
estim
ate
base
flow
bel
ow W
olf
Cre
ek.
Dis
cret
e SC
mea
sure
men
ts m
ade a
bove
the d
iver
sion
wer
e com
pare
d to
mea
sure
d SC
at th
e Wes
t For
k G
age i
n or
der
to e
stim
ate
cont
inuo
us S
C, a
nd a
lso
base
flow
dis
char
ge, a
bove
the
dive
rsio
n.
(3) B
asef
low
triti
um c
once
ntra
tions
wer
e ca
lcul
ated
usi
ng th
e re
latio
nshi
p, T
sQs =
TbQ
b + T
mQ
m, w
here
T re
fers
to
tritiu
m c
once
ntra
tions
and
Q re
fers
to d
isch
arge
for t
he st
ream
(s),
for b
asef
low
(b),
and
for t
he m
oder
n (m
) fra
ctio
n of
stre
am d
isch
arge
that
doe
s not
incl
ude
base
flow
. A v
alue
of 8
.67
TU w
as u
sed
for T
m.
45

46
that resulted from this attempt to correct for the variability in transit time distribution was
~ 34 years. While this is in considerably better agreement with the West Fork MTT (40
years) obtained from lumped-parameter modeling of SF6 , CFCs, 3H, and 3He (tritiogenic),
it would not have been possible without the LPM analysis because the ratio of EMM to
PFM groundwater transport would not have been independently discernable. As a result, 3H
alone is currently not a useful nonvolatile tracer for determining groundwater MTT within
watersheds with groundwater ages greater than 20 years, at least at similar Northern
Hemisphere latitudes where the stabilization of atmospheric tritium has been more recent
compared to the Southern Hemisphere.

5 CONCLUSIONS
5.1 West Fork Watershed Susceptibility
SF6 , CFCs, 3H, and 3He (tritiogenic) concentrations of 21 springs within the West
Fork watershed were analyzed with lumped-parameter models in order to determine the
groundwater MTT for the catchment. Spring ages ranged from ~ 3 to 115 years, with the
majority of springs dating around 30 years. Lithologic heterogeneity within the watershed,
as well as more local variations in the geohydrologic environment, are most likely
responsible for the contribution of both young and old water to the system. A MTT for the
West Fork watershed of ~ 40 years was calculated as the flow-weighted average of 18 of
these 21 spring ages. A chemical hydrograph separation of West Fork streamflow estimated
the average annual baseflow volume to be ~1.7 x 10⁷ m3/year. Assuming steady-state
conditions, this proxy for the rate of groundwater discharge within the watershed was used
in conjunction with MTT to calculate the volume of mobile stored groundwater within the
West Fork Duchesne River watershed. This volume was ~6.5 x 10⁸ m3, or ~0.09 m/year
of recharge over the entire watershed.
From a water resources point of view, the 40-year MTT of groundwater in the West
Fork watershed indicates its resiliency to drought. In this region of the U.S, droughts in
recent years have typically been less than 10 years in duration (Wilkowske et al., 2003).
The expected impact of such droughts on West Fork baseflow is much less than if the MTT

48
was an order of magnitude lower (i.e., years versus decades). In contrast, lasting changes
in the rate of groundwater withdrawals, land use, and climate would likely have a profound
effect on the West Fork watershed even though these consequences may not be
immediately evident.
5.2 Determining MTT Using Nonvolatile Tracers
Under the conditions present in this study, nonvolatile tracers (in-stream major-ion
chemistry, dissolved silica, and 3H) were determined to be ineffective for assessing
groundwater MTT. A correlation between chemistry (major-ion concentrations and
dissolved silica content) and groundwater age was not apparent, a result attributed to
variations in bedrock lithology in the watershed. Additionally, ages determined from
stream 3H concentrations were considerably sensitive to the transit time distribution
employed during analysis. This is likely a consequence of both the nonlinear relationship
between input 3H and time at more northern latitudes, as well as the variability in present-
day atmospheric inputs.
For these reasons, watershed-scale assessments conducted in the near-future should
employ lumped-parameter modeling of multiple environmental tracers to determine
groundwater MTT. However, the usefulness of stream 3H concentrations should be re-
evaluated in future decades assuming that atmospheric 3H continues to stabilize in the
Northern Hemisphere. For watersheds like the West Fork in which the majority of the
groundwater is approximately 30 years old, stream 3H sampling (a simpler and less-costly
approach than sampling multiple environmental tracers in springs) might provide a viable
estimate of groundwater MTT 20-30 years from the present.
APPENDIX A
SUPPLEMENTAL DATA FROM WEST FORK
SPRING AND STREAM SAMPLING,
GAGE, AND VAT DIVERSION

50
Appendix A contains supplemental data from springs, and stream locations,
sampled within the West Fork watershed. Field parameters and major ion chemistry data
from spring sites can be found in the initial pages. Continuous stream data from the West
Fork Gage for the period of March 14, 2014 to March 13, 2015 is also included. The final
pages present the Vat Diversion records obtained from Central Utah Water Conservancy
District (CUWCD) for the March 2014-March 2015 time period.

51
Table 4. Field Parameters for West Fork Springs Temperature, specific conductivity (SC), pH, dissolved oxygen (DO), and total dissolved gas pressure (TDG) were recorded during sampling using a Hydrolab Multiprobe. Below, are the final readings taken once all parameters stabilized. A Garmin GPSmap 62s was used to measure elevation. Discharge measurement methods included B = bucket and stopwatch, PF = Parshall flume, or FM = SonTek FlowTracker Handheld Flow Meter.

Site
Sa
mpl
e D
ate
Elev
atio
n (M
ASL
) Te
mpe
ratu
re
(°C
) SC
(µ
S/cm
) pH
D
O
(mg/
L)
TDG
(m
mH
g)
Dis
char
ge (c
fs)
and
Mea
sure
men
t M
etho
d LW
FDS0
1 7/
16/2
014
3030
.0
3.41
23
9 6.
85
9.71
58
2 0.
031
B
LWFD
S05
7/16
/201
4 29
14.8
4.
92
249
6.62
7.
00
607
0.04
3 PF
LW
FDS0
7 7/
16/2
014
2911
.8
3.67
35
2 6.
86
3.75
60
8 0.
008
B
WFD
S08
7/18
/201
4 29
73.3
4.
00
138
5.88
6.
35
546
0.02
2 B
W
FDS0
9 7/
16/2
014
2773
.1
4.75
43
7 6.
66
6.24
62
1 ─
─
W
FDS1
2 7/
15/2
014
2794
.7
4.05
30
7 6.
77
7.28
55
9 0.
009
PF
WFD
S13
7/15
/201
4 26
88.0
4.
02
477
6.76
2.
82
537
0.00
5 B
N
ew S
prin
g #4
10
/17/
2014
28
13.0
4.
72
390
6.95
5.
76
611
0.17
0 PF
Fi
ve S
uns S
prin
g 10
/28/
2014
25
41.1
3.
83
261
7.79
7.
67
613
0.65
4 FM
W
.F. L
ower
Spr
ing
11/2
6/20
13
2443
.3
5.17
50
1 7.
16
6.09
56
5 ─
─
FR
050
Sprin
g 11
/26/
2013
23
27.8
6.
53
668
7.10
5.
92
616
─
─
W.F
. Upp
er S
prin
g 11
/27/
2013
24
45.4
4.
51
442
7.21
5.
84
559
0.01
3 PF
W
FDS1
0 7/
18/2
014
2536
.9
5.93
15
2 6.
25
8.25
56
7 0.
016
PF
WFD
S14
7/18
/201
4 24
72.2
5.
52
392
6.84
7.
17
578
0.05
7 PF
W
FDS1
9 7/
18/2
014
2354
.0
6.72
68
5 6.
95
6.67
67
3 0.
144
PF
New
Spr
ing
#1
10/1
4/20
14
2436
.6
5.79
31
4 6.
77
6.16
60
4 0.
424
PF
New
Spr
ing
#2
10/1
4/20
14
2436
.9
5.67
32
0 6.
75
6.51
60
5 0.
017
PF
New
Spr
ing
#3
10/1
7/20
14
2463
.1
4.82
66
6 7.
00
5.01
57
0 0.
040
PF
N. S
ide
Sprin
g #1
10
/28/
2014
22
49.4
8.
70
440
7.00
1.
20
602
0.06
9 PF
S.
Sid
e Sp
ring
#1
10/2
8/20
14
226
9.2
8
.70
440
7
.00
7.50
60
2 0
.322
PF
Upp
er S
prin
g B
10
/17/
2014
2
449.
4
4.17
43
4
7.0
1 4.
40
532
0.0
13
PF
52

53
Table 5. Major-ion Chemistry of West Fork Springs
Major cation and anion concentrations were analyzed at the University of Utah using a Metrohm 883 IC Basic Plus ion chromatograph. A Metrohm 905 Titrando titrator was used to measure alkalinity as CaCO3. Charge balance error (%) is defined as ∑𝑐𝑐𝑐𝑐𝑐𝑐𝑐𝑐𝑐𝑐𝑐𝑐𝑠𝑠−∑𝑐𝑐𝑐𝑐𝑐𝑐𝑐𝑐𝑐𝑐𝑠𝑠∑𝑐𝑐𝑐𝑐𝑐𝑐𝑐𝑐𝑐𝑐𝑐𝑐𝑠𝑠+∑𝑐𝑐𝑐𝑐𝑐𝑐𝑐𝑐𝑐𝑐𝑠𝑠
× 100. Ion chemistry was also compared to age to evaluate additional nonvolatile methods for evaluating groundwater MTT. Results of this analysis are presented in Appendix B.

Site
Li
+ (m
g/L)
N
H4+
(mg/
L)
Ca2+
(mg/
L)
Mg2+
(m
g/L)
N
a+ (m
g/L)
K
+
(mg/
L)
LWFD
S01
─
─
53.2
53
1.51
6 1.
116
0.44
7 LW
FDS0
5 ─
─
48
.573
9.
319
1.41
1 0.
488
LWFD
S07
0.01
0 ─
56
.424
15
.834
3.
686
2.25
8 W
FDS0
8 ─
─
25
.456
1.
328
3.21
7 1.
094
WFD
S09
0.00
5 ─
77
.272
16
.333
3.
895
0.75
4 W
FDS1
2 ─
─
58
.809
3.
890
3.09
4 1.
599
WFD
S13
0.00
9 ─
54
.914
18
.496
27
.752
1.
025
New
Spr
ing
#4
0.00
1 ─
60
.678
16
.016
1.
839
0.80
7 Fi
ve S
uns S
prin
g ─
─
40
.527
9.
228
3.03
3 1.
457
W.F
. Low
er S
prin
g ─
─
75
.160
24
.620
6.
052
1.18
0 FR
050
Sprin
g ─
─
99
.450
34
.030
5.
691
1.03
6 W
.F. U
pper
Spr
ing
─
─
─
─
─
─
WFD
S10
0.00
1 ─
25
.543
4.
247
2.66
6 0.
943
WFD
S14
─
─
60.6
16
16.7
59
2.95
1 0.
585
WFD
S19
0.00
5 ─
10
4.60
0 33
.516
5.
517
0.98
7 N
ew S
prin
g #1
0.
002
─
52.3
82
7.55
6 3.
258
1.24
0 N
ew S
prin
g #2
─
─
53
.671
7.
789
3.30
6 1.
255
New
Spr
ing
#3
0.01
0 ─
97
.961
28
.195
6.
577
1.08
8 N
. Sid
e Sp
ring
#1
0.00
3 ─
41
.979
29
.928
8.
651
0.90
3 S.
Sid
e Sp
ring
#1
0.00
4 ─
34
.553
20
.737
9.
552
1.35
0 U
pper
Spr
ing
B
0.00
2 ─
69
.748
14
.425
5.
142
1.00
6
54

Site
H
CO
3- (m
g/L)
N
O2-
(mg/
L)
Br-
(mg/
L)
NO
3- (m
g/L)
PO
43-
(mg/
L)
SO42-
(m
g/L)
C
l- (m
g/L)
F-
(m
g/L)
Cha
rge
Bal
ance
Err
or
(%)
LWFD
S01
180.
072
─
0.68
5 3.
953
-0.0
14
1.00
2 0.
838
0.05
4 -3
.9
LWFD
S05
202.
520
─
0.95
6 3.
797
0.00
5 1.
587
1.02
4 0.
098
-2.9
LW
FDS0
7 26
9.27
8 ─
1.
073
3.53
2 ─
3.
575
1.15
0 0.
127
-2.9
W
FDS0
8 95
.343
0.
303
0.40
4 0.
521
0.03
4 1.
421
0.60
9 0.
127
-3.0
W
FDS0
9 33
3.19
4 ─
1.
086
1.66
1 -0
.133
7.
688
1.65
4 0.
092
-2.9
W
FDS1
2 21
4.02
5 ─
1.
109
1.38
5 -0
.045
1.
705
1.01
6 0.
077
-2.6
W
FDS1
3 31
5.43
1 0.
309
1.03
5 1.
735
-0.1
22
22.6
46
2.68
6 0.
135
-2.5
N
ew S
prin
g #4
22
6.48
0 ─
1.
204
2.60
8 -0
.032
1.
880
1.28
2 0.
071
7.2
Five
Sun
s Spr
ing
136.
670
0.30
6 ─
2.
652
0.01
1 11
.365
2.
607
0.07
2 6.
1 W
.F. L
ower
Spr
ing
254.
513
─
─
─
─
76.7
71
1.89
9 0.
099
2.0
FR05
0 Sp
ring
234.
867
─
─
─
─
192.
757
2.96
3 0.
084
0.5
W.F
. Upp
er S
prin
g 23
9.33
5 ─
─
─
─
48
.312
1.
664
0.08
4 ─
W
FDS1
0 10
5.73
7 ─
0.
351
3.91
7 0.
168
2.02
8 1.
181
0.07
1 -3
.3
WFD
S14
282.
418
─
1.27
0 3.
281
-0.0
60
6.39
3 1.
334
0.08
7 -3
.4
WFD
S19
240.
377
─
1.38
2 1.
779
-0.1
22
192.
358
2.11
2 0.
106
1.2
New
Spr
ing
#1
187.
400
─
0.85
9 2.
492
0.11
0 11
.217
1.
620
0.08
0 0.
0 N
ew S
prin
g #2
17
0.01
0 ─
─
2.
451
0.10
2 11
.322
1.
656
0.08
2 5.
7 N
ew S
prin
g #3
23
2.27
0 ─
1.
416
1.15
5 ─
14
3.93
6 2.
347
0.10
7 4.
2 N
. Sid
e Sp
ring
#1
328.
140
─
─
─
─
119.
598
6.05
2 0.
074
-23.
7 S.
Sid
e Sp
ring
#1
202.
490
0.32
4 ─
1.
467
─
53.9
61
4.17
8 0.
072
-8.5
U
pper
Spr
ing
B
212.
180
─
1.17
0 0.
467
─
36.4
88
1.90
0 0.
090
6.5
Tab
le 5
. con
tinue
d
55

Site
Sa
mpl
e D
ate
Sam
ple
Tim
e Te
mpe
ratu
re
(°C
) SC
(μ
S/cm
) Sa
linity
(‰)
Wes
t For
k G
age
(bel
ow W
olf C
reek
)
3/13
/201
4 12
:30
3.1
531
0.35
0 4/
17/2
014
11:0
0 4.
5 44
8 0.
296
5/12
/201
4 13
:55
5.3
395
0.26
1 5/
23/2
014
13:4
7 8.
3 34
3 0.
226
5/27
/201
4 12
:00
12.1
31
8 0.
210
5/30
/201
4 9:
52
9.9
346
0.22
8 6/
6/20
14
12:4
5 14
.2
359
0.23
7 6/
19/2
014
11:4
5 11
.5
399
0.26
3 7/
7/20
14
10:4
5 16
.4
430
0.28
4 9/
3/20
14
12:3
5 14
.4
473
0.31
2 10
/9/2
014
14:1
0 11
.1
478
0.31
6 10
/28/
2014
─
2.
1 51
5 0.
340
1/5/
2015
13
:30
0.0
500
0.33
0 2/
23/2
015
11:1
5 0.
1 52
3 0.
345
Wes
t For
k ab
ove
Vat
Div
ersi
on
5/27
/201
4 11
:00
6.2
238
0.15
7 6/
6/20
14
10:3
5 6.
9 30
5 0.
201
6/19
/201
4 10
:40
7.0
349
0.23
0 7/
7/20
14
10:0
0 ─
─
0.
254
9/3/
2014
13
:20
14.0
41
5 0.
274
10/9
/201
4 15
:35
8.6
420
0.27
7 2/
23/2
015
13:0
0 0.
2 45
1 0.
298
Tab
le 6
. Fie
ld P
aram
eter
s for
Wes
t For
k St
ream
Sam
ples
Tem
pera
ture
, SC
, and
salin
ity w
ere
reco
rded
dur
ing
each
site
vis
it to
the
Wes
t For
k G
age,
and
the
stre
am
site
abo
ve t
he V
at D
iver
sion
. Th
ese
wer
e ne
cess
ary
for
the
chem
ical
hyd
rogr
aph
sepa
ratio
n in
ord
er
iden
tify
any
disc
repa
ncie
s be
twee
n th
ese
disc
rete
mea
sure
men
ts m
ade
usin
g a
Mul
tipro
be H
ydro
lab,
and
th
e co
ntin
uous
dat
a fr
om th
e W
est F
ork
Gag
e, a
nd to
est
imat
e th
e co
ntin
uous
SC
at t
he u
pstre
am lo
catio
n.
56

Site
Sa
mpl
e D
ate
Sam
ple
Tim
e Li
+ (m
g/L)
N
H4+
(mg/
L)
Ca2+
(mg/
L)
Mg2+
(m
g/L)
N
a+ (m
g/L)
K
+
(mg/
L)
Wes
t For
k G
age
(bel
ow W
olf C
reek
)
3/13
/201
4 12
:30
0.00
2 ─
67
.252
18
.508
5.
164
0.85
3 4/
17/2
014
11:0
0 0.
001
0.00
3 67
.925
16
.738
5.
652
0.94
3 5/
12/2
014
13:5
5 0.
001
─
61.0
50
14.2
48
4.56
4 0.
900
5/23
/201
4 13
:47
0.00
1 0.
005
52.8
07
11.6
35
4.15
6 0.
924
5/27
/201
4 12
:00
0.00
1 0.
003
49.2
96
10.7
27
3.83
5 0.
917
5/30
/201
4 9:
52
0.00
1 ─
53
.870
11
.863
4.
151
0.86
4 6/
6/20
14
12:4
5 0.
002
─
54.9
06
13.0
06
4.50
6 0.
854
6/19
/201
4 11
:45
0.00
1 0.
007
61.4
74
14.6
44
4.93
2 0.
839
7/7/
2014
10
:45
0.00
3 ─
65
.098
16
.771
5.
772
0.99
1 9/
3/20
14
12:3
5 0.
002
─
69.8
70
18.8
47
6.44
9 0.
968
10/9
/201
4 14
:10
0.00
2 ─
70
.498
18
.514
6.
205
1.03
2 10
/28/
2014
─
0.
003
─
34.9
79
19.2
09
6.43
0 1.
015
1/5/
2015
13
:30
0.00
4 ─
35
.501
18
.145
6.
097
0.93
6 2/
23/2
015
11:1
5 0.
002
0.03
2 73
.308
19
.455
5.
925
0.88
1
Wes
t For
k ab
ove
Vat
Div
ersi
on
5/27
/201
4 11
:00
0.00
1 0.
083
40.0
52
6.93
0 2.
192
0.84
1 6/
6/20
14
10:3
5 0.
002
─
50.3
46
9.60
7 2.
887
0.75
6 6/
19/2
014
10:4
0 0.
001
─
57.4
76
11.8
91
3.66
5 0.
747
7/7/
2014
10
:00
0.00
3 0.
004
54.1
47
14.5
89
4.71
1 0.
880
9/3/
2014
13
:20
0.00
3 ─
63
.472
15
.209
5.
461
1.02
2 10
/9/2
014
15:3
5 0.
002
─
64.3
88
14.5
07
5.16
3 1.
046
2/23
/201
5 13
:00
0.00
3 0.
004
66.9
08
14.4
88
5.71
9 0.
998
Tab
le 7
. Maj
or-io
n C
hem
istry
of W
est F
ork
Stre
am S
ampl
es
Maj
or c
atio
n an
d an
ion
conc
entra
tions
wer
e an
alyz
ed a
t the
Uni
vers
ity o
f Uta
h us
ing
a M
etro
hm 8
83 IC
Bas
ic P
lus
ion
chro
mat
ogra
ph. A
Met
rohm
905
Titr
ando
titra
tor w
as u
sed
to m
easu
re a
lkal
inity
as C
aCO
3. C
harg
e ba
lanc
e er
ror (
%) i
s de
fined
as
∑𝑐𝑐𝑐𝑐𝑐𝑐𝑐𝑐𝑐𝑐𝑐𝑐𝑠𝑠−∑𝑐𝑐𝑐𝑐
𝑐𝑐𝑐𝑐𝑐𝑐𝑠𝑠
∑𝑐𝑐𝑐𝑐𝑐𝑐𝑐𝑐𝑐𝑐𝑐𝑐𝑠𝑠+∑𝑐𝑐𝑐𝑐
𝑐𝑐𝑐𝑐𝑐𝑐𝑠𝑠
×10
0.
57
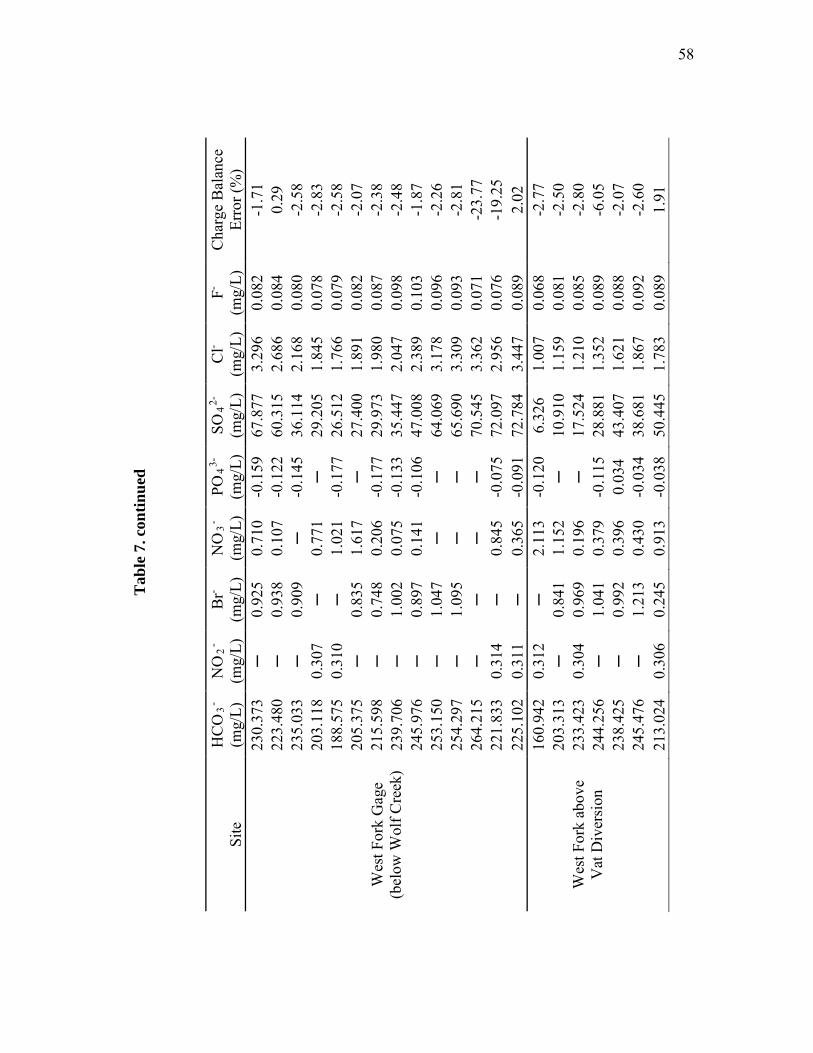
Site
H
CO
3- (m
g/L)
N
O2-
(mg/
L)
Br-
(mg/
L)
NO
3- (m
g/L)
PO
43-
(mg/
L)
SO42-
(m
g/L)
C
l- (m
g/L)
F-
(m
g/L)
C
harg
e B
alan
ce
Erro
r (%
)
Wes
t For
k G
age
(bel
ow W
olf C
reek
)
230.
373
─
0.92
5 0.
710
-0.1
59
67.8
77
3.29
6 0.
082
-1.7
1 22
3.48
0 ─
0.
938
0.10
7 -0
.122
60
.315
2.
686
0.08
4 0.
29
235.
033
─
0.90
9 ─
-0
.145
36
.114
2.
168
0.08
0 -2
.58
203.
118
0.30
7 ─
0.
771
─
29.2
05
1.84
5 0.
078
-2.8
3 18
8.57
5 0.
310
─
1.02
1 -0
.177
26
.512
1.
766
0.07
9 -2
.58
205.
375
─
0.83
5 1.
617
─
27.4
00
1.89
1 0.
082
-2.0
7 21
5.59
8 ─
0.
748
0.20
6 -0
.177
29
.973
1.
980
0.08
7 -2
.38
239.
706
─
1.00
2 0.
075
-0.1
33
35.4
47
2.04
7 0.
098
-2.4
8 24
5.97
6 ─
0.
897
0.14
1 -0
.106
47
.008
2.
389
0.10
3 -1
.87
253.
150
─
1.04
7 ─
─
64
.069
3.
178
0.09
6 -2
.26
254.
297
─
1.09
5 ─
─
65
.690
3.
309
0.09
3 -2
.81
264.
215
─
─
─
─
70.5
45
3.36
2 0.
071
-23.
77
221.
833
0.31
4 ─
0.
845
-0.0
75
72.0
97
2.95
6 0.
076
-19.
25
225.
102
0.31
1 ─
0.
365
-0.0
91
72.7
84
3.44
7 0.
089
2.02
Wes
t For
k ab
ove
V
at D
iver
sion
160.
942
0.31
2 ─
2.
113
-0.1
20
6.32
6 1.
007
0.06
8 -2
.77
203.
313
─
0.84
1 1.
152
─
10.9
10
1.15
9 0.
081
-2.5
0 23
3.42
3 0.
304
0.96
9 0.
196
─
17.5
24
1.21
0 0.
085
-2.8
0 24
4.25
6 ─
1.
041
0.37
9 -0
.115
28
.881
1.
352
0.08
9 -6
.05
238.
425
─
0.99
2 0.
396
0.03
4 43
.407
1.
621
0.08
8 -2
.07
245.
476
─
1.21
3 0.
430
-0.0
34
38.6
81
1.86
7 0.
092
-2.6
0 21
3.02
4 0.
306
0.24
5 0.
913
-0.0
38
50.4
45
1.78
3 0.
089
1.91
Tab
le 7
. con
tinue
d
58

Site
Sa
mpl
e D
ate
Sam
ple
Tim
e 3 H
(T
U)
Triti
ogen
ic 3 H
e (T
U)
SF6
(ppt
v)
CFC
-11
(ppt
v)
CFC
-12
(ppt
v)
CFC
-113
(p
ptv)
Wes
t For
k G
age
(bel
ow W
olf C
reek
)
3/13
/201
4 12
:30
─
─
7.74
26
5.34
53
3.04
59
.73
4/17
/201
4 11
:00
─
─
8.35
24
3.98
51
4.43
61
.92
5/12
/201
4 13
:55
─
─
8.13
21
6.77
47
4.48
49
.61
5/27
/201
4 12
:00
─
─
8.37
17
9.46
41
6.16
40
.91
6/6/
2014
12
:45
─
─
9.62
22
5.70
52
3.89
54
.44
6/19
/201
4 11
:45
─
─
7.40
19
8.22
45
5.43
46
.00
7/7/
2014
10
:45
─
─
6.97
20
8.29
49
5.89
51
.33
9/3/
2014
12
:35
5.51
6.
34E-
14
8.63
21
7.35
51
0.55
56
.92
10/9
/201
4 14
:10
5.57
6.
31E-
14
8.22
21
7.81
49
9.17
54
.89
1/5/
2015
13
:30
5.32
5.
65E-
14
7.35
18
5.68
85
411.
6348
44
.056
02
2/23
/201
5 11
:15
5.10
3.
44E-
14
8.06
65
.96
386.
80
128.
58
Wes
t For
k ab
ove
Vat
Div
ersi
on
6/6/
2014
10
:35
─
─
8.62
15
9.07
36
6.66
36
.21
6/19
/201
4 10
:40
─
─
7.86
19
4.94
41
8.68
46
.26
7/7/
2014
10
:00
─
─
7.71
26
2.35
58
7.08
64
.60
9/3/
2014
13
:20
6.65
7.
74E-
14
8.16
21
6.13
50
7.50
59
.31
10/9
/201
4 15
:35
6.71
7.
80E-
14
8.02
21
8.06
49
0.91
55
.14
2/23
/201
5 13
:00
6.11
4.
11E-
14
7.60
91
.21
354.
80
73.3
5
Tab
le 8
. SF 6
, CFC
s, an
d 3 H
/3 He
Dat
a fo
r W
est F
ork
Stre
am S
ampl
es
Triti
um s
ampl
es w
ere
only
col
lect
ed a
t sev
eral
stre
am s
ite v
isits
dur
ing
low
-flo
w c
ondi
tions
. Tab
le 3
, in
the
mai
n te
xt,
cont
ains
the
spe
cific
3 H v
alue
s us
ed f
or t
he e
valu
atio
n of
3 H a
s a
nonv
olat
ile a
ge-d
atin
g tra
cer.
SF6
and
CFC
s ar
e pr
esen
ted
as e
quiv
alen
t air
conc
entra
tions
; val
ues
are
gene
rally
at p
rese
nt-d
ay a
tmos
pher
ic le
vels
con
firm
ing
that
the
gas
exch
ange
/loss
ass
ocia
ted
with
the
se v
olat
ile a
ge-d
atin
g m
etho
ds i
s to
o si
gnifi
cant
to
pres
erve
the
gro
undw
ater
si
gnat
ure
in th
e st
ream
.
59
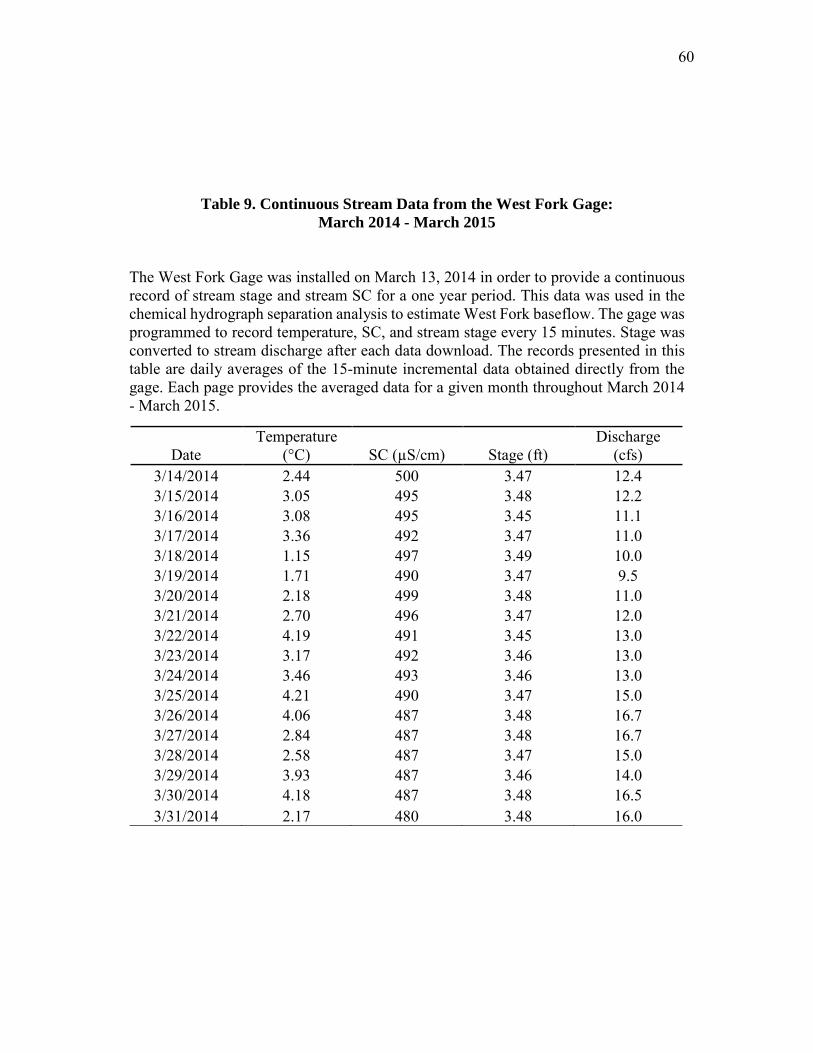
60
Date Temperature
(°C) SC (µS/cm) Stage (ft) Discharge
(cfs) 3/14/2014 2.44 500 3.47 12.4 3/15/2014 3.05 495 3.48 12.2 3/16/2014 3.08 495 3.45 11.1 3/17/2014 3.36 492 3.47 11.0 3/18/2014 1.15 497 3.49 10.0 3/19/2014 1.71 490 3.47 9.5 3/20/2014 2.18 499 3.48 11.0 3/21/2014 2.70 496 3.47 12.0 3/22/2014 4.19 491 3.45 13.0 3/23/2014 3.17 492 3.46 13.0 3/24/2014 3.46 493 3.46 13.0 3/25/2014 4.21 490 3.47 15.0 3/26/2014 4.06 487 3.48 16.7 3/27/2014 2.84 487 3.48 16.7 3/28/2014 2.58 487 3.47 15.0 3/29/2014 3.93 487 3.46 14.0 3/30/2014 4.18 487 3.48 16.5 3/31/2014 2.17 480 3.48 16.0
Table 9. Continuous Stream Data from the West Fork Gage: March 2014 - March 2015
The West Fork Gage was installed on March 13, 2014 in order to provide a continuous record of stream stage and stream SC for a one year period. This data was used in the chemical hydrograph separation analysis to estimate West Fork baseflow. The gage was programmed to record temperature, SC, and stream stage every 15 minutes. Stage was converted to stream discharge after each data download. The records presented in this table are daily averages of the 15-minute incremental data obtained directly from the gage. Each page provides the averaged data for a given month throughout March 2014 - March 2015.

61
Table 9. continued
Date Temperature
(°C) SC (µS/cm) Stage (ft) Discharge
(cfs) 4/1/2014 3.07 479 3.49 17.3 4/2/2014 3.51 484 3.48 15.0 4/3/2014 3.56 488 3.46 15.0 4/4/2014 4.20 488 3.47 15.0 4/5/2014 5.40 485 3.47 16.2 4/6/2014 5.12 484 3.47 16.4 4/7/2014 5.47 485 3.48 16.8 4/8/2014 6.70 486 3.50 19.6 4/9/2014 7.25 476 3.57 24.1 4/10/2014 7.02 466 3.63 28.4 4/11/2014 7.20 455 3.67 31.4 4/12/2014 7.19 444 3.72 36.1 4/13/2014 5.75 435 3.75 35.7 4/14/2014 4.45 443 3.66 27.0 4/15/2014 5.81 452 3.64 25.0 4/16/2014 6.35 454 3.63 25.2 4/17/2014 6.66 446 3.64 24.7 4/18/2014 7.81 442 3.70 30.1 4/19/2014 7.21 431 3.75 33.3 4/20/2014 7.75 418 3.80 38.6 4/21/2014 7.35 407 3.84 41.1 4/22/2014 7.95 400 3.86 42.1 4/23/2014 5.98 393 3.87 42.9 4/24/2014 5.37 393 3.86 42.3 4/25/2014 6.84 397 3.86 42.7 4/26/2014 5.51 397 3.89 46.4 4/27/2014 3.60 398 3.90 44.3 4/28/2014 4.44 401 3.88 43.9 4/29/2014 4.21 406 3.87 42.0 4/30/2014 6.05 408 3.85 39.9

62
Table 9. continued
Date Temperature
(°C) SC (µS/cm) Stage (ft) Discharge
(cfs) 5/1/2014 7.04 413 3.81 37.0 5/2/2014 8.61 415 3.80 36.9 5/3/2014 8.97 409 3.84 41.0 5/4/2014 9.46 398 3.86 42.4 5/5/2014 9.52 383 3.87 43.9 5/6/2014 8.09 374 3.89 44.7 5/7/2014 5.54 377 3.89 44.6 5/8/2014 5.89 382 3.89 44.7 5/9/2014 6.22 386 3.89 45.1 5/10/2014 5.85 390 3.88 43.8 5/11/2014 6.09 392 3.87 43.1 5/12/2014 4.79 395 3.87 43.2 5/13/2014 4.02 396 3.87 43.4 5/14/2014 7.54 398 3.87 42.8 5/15/2014 9.13 394 3.86 42.1 5/16/2014 9.57 388 3.85 41.9 5/17/2014 9.69 375 3.87 44.2 5/18/2014 10.38 366 3.90 46.2 5/19/2014 9.56 332 4.07 61.9 5/20/2014 9.72 337 4.00 55.4 5/21/2014 9.00 357 3.90 44.9 5/22/2014 9.02 351 3.91 47.1 5/23/2014 8.38 349 3.94 49.4 5/24/2014 8.47 358 3.96 51.4 5/25/2014 9.75 354 3.89 45.7 5/26/2014 10.98 320 4.06 64.9 5/27/2014 11.73 311 4.07 59.6 5/28/2014 12.17 339 3.90 45.7 5/29/2014 11.57 342 3.90 45.4 5/30/2014 11.36 346 3.90 45.4 5/31/2014 11.03 351 3.89 44.5

63
Table 9. continued
Date Temperature
(°C) SC (µS/cm) Stage (ft) Discharge
(cfs) 6/1/2014 11.28 353 3.88 43.7 6/2/2014 11.51 354 3.87 43.2 6/3/2014 13.23 355 3.87 42.5 6/4/2014 12.44 358 3.86 42.2 6/5/2014 12.16 361 3.86 41.8 6/6/2014 12.29 364 3.86 42.1 6/7/2014 12.08 367 3.86 41.5 6/8/2014 12.47 371 3.85 40.9 6/9/2014 11.84 374 3.84 40.4 6/10/2014 12.69 376 3.84 40.3 6/11/2014 12.61 382 3.84 40.2 6/12/2014 12.63 382 3.84 40.2 6/13/2014 12.99 389 3.83 39.6 6/14/2014 12.70 388 3.83 39.4 6/15/2014 10.90 393 3.83 39.7 6/16/2014 9.52 398 3.84 40.1 6/17/2014 9.14 403 3.84 40.1 6/18/2014 9.09 403 3.84 40.0 6/19/2014 11.04 399 3.83 39.4 6/20/2014 12.32 399 3.82 38.8 6/21/2014 13.60 400 3.82 38.6 6/22/2014 13.16 401 3.82 38.6 6/23/2014 12.98 406 3.82 38.5 6/24/2014 13.34 406 3.82 38.2 6/25/2014 14.41 407 3.81 37.3 6/26/2014 14.08 410 3.80 37.4 6/27/2014 12.87 415 3.82 38.7 6/28/2014 12.75 414 3.82 37.6 6/29/2014 13.87 415 3.79 34.9 6/30/2014 14.77 418 3.76 33.9

64
Table 9. continued
Date Temperature
(°C) SC (µS/cm) Stage (ft) Discharge
(cfs) 7/1/2014 14.09 422 3.75 31.9 7/2/2014 14.87 423 3.73 30.7 7/3/2014 14.82 426 3.72 30.4 7/4/2014 15.15 425 3.73 30.8 7/5/2014 16.43 426 3.69 27.8 7/6/2014 15.88 431 3.68 26.9 7/7/2014 16.80 430 3.67 25.4 7/8/2014 16.95 432 3.64 23.9 7/9/2014 16.82 436 3.64 24.4 7/10/2014 16.26 443 3.66 26.7 7/11/2014 15.82 439 3.71 29.2 7/12/2014 16.37 437 3.68 26.6 7/13/2014 18.01 436 3.65 24.3 7/14/2014 18.21 438 3.63 22.9 7/15/2014 17.93 441 3.62 22.1 7/16/2014 17.60 443 3.60 21.2 7/17/2014 16.58 444 3.60 20.7 7/18/2014 16.68 446 3.59 20.2 7/19/2014 16.60 448 3.59 19.5 7/20/2014 15.56 455 3.57 19.1 7/21/2014 14.94 458 3.59 19.6 7/22/2014 15.99 456 3.56 18.2 7/23/2014 16.05 461 3.55 17.4 7/24/2014 15.83 467 3.55 17.5 7/25/2014 16.15 461 3.55 16.8 7/26/2014 17.06 458 3.54 16.6 7/27/2014 17.23 457 3.53 16.4 7/28/2014 16.32 462 3.54 17.7 7/29/2014 14.64 469 3.60 22.6 7/30/2014 15.07 464 3.64 22.9 7/31/2014 15.98 465 3.58 19.0

65
Table 9. continued
Date Temperature
(°C) SC (µS/cm) Stage (ft) Discharge
(cfs) 8/1/2014 15.78 467 3.57 18.4 8/2/2014 15.19 466 3.56 17.9 8/3/2014 15.70 463 3.56 18.5 8/4/2014 14.50 470 3.59 20.3 8/5/2014 14.38 465 3.60 22.5 8/6/2014 14.39 456 3.65 24.2 8/7/2014 15.37 454 3.61 20.7 8/8/2014 14.77 456 3.58 19.0 8/9/2014 14.71 457 3.57 18.3 8/10/2014 14.37 459 3.55 17.7 8/11/2014 14.05 461 3.57 18.4 8/12/2014 14.34 461 3.56 18.4 8/13/2014 13.87 463 3.57 18.8 8/14/2014 13.88 461 3.58 19.1 8/15/2014 15.34 452 3.57 18.5 8/16/2014 15.21 455 3.54 15.9 8/17/2014 15.22 452 3.51 14.5 8/18/2014 15.01 453 3.50 14.1 8/19/2014 14.55 469 3.51 17.2 8/20/2014 14.07 460 3.61 21.0 8/21/2014 14.02 460 3.60 20.9 8/22/2014 13.28 463 3.57 18.9 8/23/2014 13.41 460 3.67 29.8 8/24/2014 12.00 456 3.69 25.2 8/25/2014 12.81 458 3.65 27.2 8/26/2014 12.88 460 3.68 26.2 8/27/2014 12.20 471 3.65 23.5 8/28/2014 12.47 467 3.65 24.3 8/29/2014 13.44 465 3.60 19.9 8/30/2014 12.92 471 3.56 18.2 8/31/2014 13.65 469 3.55 17.4

66
Table 9. continued
Date Temperature
(°C) SC (µS/cm) Stage (ft) Discharge
(cfs) 9/1/2014 12.58 471 3.54 16.4 9/2/2014 12.92 473 3.52 15.3 9/3/2014 13.53 477 3.51 14.5 9/4/2014 13.81 477 3.50 13.7 9/5/2014 13.31 481 3.50 14.5 9/6/2014 12.94 484 3.51 14.4 9/7/2014 13.08 485 3.51 14.8 9/8/2014 13.45 483 3.53 17.6 9/9/2014 12.67 479 3.68 31.8 9/10/2014 11.43 463 3.72 26.9 9/11/2014 11.42 462 3.62 21.4 9/12/2014 10.79 465 3.58 19.5 9/13/2014 10.54 468 3.57 18.7 9/14/2014 11.13 469 3.56 17.7 9/15/2014 11.43 471 3.55 17.2 9/16/2014 11.48 473 3.54 16.9 9/17/2014 12.12 473 3.54 16.6 9/18/2014 12.16 473 3.53 16.3 9/19/2014 12.88 472 3.53 15.9 9/20/2014 12.56 472 3.52 15.3 9/21/2014 11.81 476 3.54 19.0 9/22/2014 11.40 473 3.65 24.6 9/23/2014 12.23 472 3.60 20.0 9/24/2014 12.21 472 3.57 18.3 9/25/2014 12.58 477 3.54 16.5 9/26/2014 12.48 478 3.53 16.3 9/27/2014 11.78 484 3.56 25.5 9/28/2014 9.94 439 4.07 65.1 9/29/2014 9.39 441 3.90 41.8 9/30/2014 9.27 458 3.72 27.3

67
Table 9. continued
Date Temperature
(°C) SC (µS/cm) Stage (ft) Discharge
(cfs) 10/1/2014 8.47 472 3.67 25.6 10/2/2014 7.15 475 3.65 24.4 10/3/2014 7.71 486 3.63 23.0 10/4/2014 8.18 494 3.63 22.6 10/5/2014 8.59 491 3.62 22.3 10/6/2014 9.06 496 3.61 20.9 10/7/2014 9.00 502 3.55 17.3 10/8/2014 9.22 490 3.56 18.8 10/9/2014 8.91 482 3.57 19.0 10/10/2014 8.17 484 3.57 19.0 10/11/2014 8.24 482 3.58 19.2 10/12/2014 7.36 479 3.60 21.0 10/13/2014 5.94 482 3.59 19.6 10/14/2014 6.31 484 3.57 19.0 10/15/2014 6.85 483 3.57 18.9 10/16/2014 6.95 491 3.57 18.6 10/17/2014 6.65 498 3.57 18.4 10/18/2014 7.20 495 3.56 18.3 10/19/2014 6.81 502 3.56 17.7 10/20/2014 6.82 496 3.55 17.0 10/21/2014 7.29 495 3.55 17.4 10/22/2014 6.13 494 3.55 16.7 10/23/2014 5.58 489 3.53 16.4 10/24/2014 5.92 490 3.54 16.5 10/25/2014 5.92 490 3.54 16.7 10/26/2014 6.71 488 3.54 16.9 10/27/2014 4.53 491 3.54 16.5 10/28/2014 3.44 494 3.53 15.7 10/29/2014 3.36 498 3.51 14.8 10/30/2014 4.17 496 3.50 14.2 10/31/2014 4.33 494 3.50 15.1

68
Table 9. continued
Date Temperature
(°C) SC (µS/cm) Stage (ft) Discharge
(cfs) 11/1/2014 4.76 490 3.57 19.6 11/2/2014 4.96 485 3.57 18.5 11/3/2014 3.48 487 3.55 17.0 11/4/2014 1.57 493 3.52 12.0 11/5/2014 2.93 495 3.49 13.6 11/6/2014 3.17 489 3.50 14.3 11/7/2014 3.54 486 3.49 13.6 11/8/2014 3.20 488 3.50 13.9 11/9/2014 3.19 487 3.50 14.2 11/10/2014 3.14 486 3.52 13.0 11/11/2014 0.85 478 3.58 11.0 11/12/2014 0.30 488 3.56 10.0 11/13/2014 -0.01 494 3.73 9.0 11/14/2014 0.18 492 3.92 10.0 11/15/2014 0.81 487 3.52 13.0 11/16/2014 0.02 472 3.70 12.0 11/17/2014 -0.01 492 3.90 12.0 11/18/2014 0.01 478 3.75 14.0 11/19/2014 0.03 500 3.76 16.0 11/20/2014 0.45 489 3.58 18.0 11/21/2014 0.32 488 3.64 17.0 11/22/2014 0.25 484 3.62 17.0 11/23/2014 0.31 490 3.57 18.9 11/24/2014 0.10 485 3.64 17.0 11/25/2014 0.11 479 3.71 16.0 11/26/2014 0.96 484 3.55 16.6 11/27/2014 0.38 481 3.60 16.0 11/28/2014 0.65 476 3.56 15.0 11/29/2014 0.55 488 3.58 15.0 11/30/2014 1.74 481 3.53 16.0

69
Table 9. continued
Date Temperature
(°C) SC (µS/cm) Stage (ft) Discharge
(cfs) 12/1/2014 1.47 483 3.52 15.0 12/2/2014 0.57 490 3.58 15.0 12/3/2014 1.55 488 3.54 15.9 12/4/2014 2.60 483 3.53 16.1 12/5/2014 1.24 489 3.53 15.0 12/6/2014 1.98 487 3.52 15.6 12/7/2014 1.16 492 3.52 14.0 12/8/2014 0.61 496 3.51 14.0 12/9/2014 0.26 496 3.63 13.0 12/10/2014 0.16 482 3.62 13.0 12/11/2014 0.14 490 3.64 12.0 12/12/2014 0.91 496 3.53 14.0 12/13/2014 1.97 487 3.50 14.1 12/14/2014 0.69 490 3.52 14.0 12/15/2014 -0.01 506 3.72 13.0 12/16/2014 -0.01 511 3.97 14.0 12/17/2014 0.09 478 3.62 14.0 12/18/2014 0.04 485 3.70 14.0 12/19/2014 -0.01 509 3.68 13.0 12/20/2014 0.20 499 3.66 14.0 12/21/2014 0.45 493 3.51 14.5 12/22/2014 0.55 471 3.56 14.0 12/23/2014 0.01 495 3.60 13.0 12/24/2014 -0.01 511 3.96 13.0 12/25/2014 -0.01 499 4.15 14.0 12/26/2014 -0.01 504 4.27 13.0 12/27/2014 -0.01 523 4.46 12.0 12/28/2014 -0.01 516 4.57 13.0 12/29/2014 -0.01 505 4.55 13.0 12/30/2014 -0.01 505 4.53 12.0 12/31/2014 -0.01 522 4.50 10.0

70
Table 9. continued
Date Temperature
(°C) SC (µS/cm) Stage (ft) Discharge
(cfs) 1/1/2015 -0.01 530 4.52 11.0 1/2/2015 -0.01 518 4.48 12.0 1/3/2015 -0.01 507 4.16 14.0 1/4/2015 -0.01 497 4.18 13.0 1/5/2015 -0.01 494 4.21 15.0 1/6/2015 0.01 490 3.87 16.0 1/7/2015 0.03 496 3.69 15.0 1/8/2015 0.08 501 3.69 16.0 1/9/2015 0.09 502 3.58 15.0 1/10/2015 0.21 502 3.54 16.0 1/11/2015 0.77 495 3.50 14.1 1/12/2015 0.76 489 3.50 14.1 1/13/2015 0.62 489 3.50 14.0 1/14/2015 0.09 501 3.59 13.0 1/15/2015 -0.01 512 4.06 14.0 1/16/2015 -0.01 513 4.07 13.0 1/17/2015 0.01 503 3.83 12.0 1/18/2015 0.06 504 3.81 12.0 1/19/2015 0.35 502 3.55 13.0 1/20/2015 0.33 498 3.51 14.0 1/21/2015 0.01 510 3.65 12.0 1/22/2015 -0.01 531 4.02 11.0 1/23/2015 -0.01 514 4.07 13.0 1/24/2015 0.00 514 3.66 12.0 1/25/2015 0.15 501 3.53 12.0 1/26/2015 0.46 497 3.50 13.0 1/27/2015 0.44 499 3.52 14.0 1/28/2015 1.01 490 3.50 13.9 1/29/2015 0.50 493 3.51 14.0 1/30/2015 1.04 489 3.49 13.6 1/31/2015 1.07 487 3.50 13.6

71
Table 9. continued
Date Temperature
(°C) SC (µS/cm) Stage (ft) Discharge
(cfs) 2/1/2015 0.17 497 3.53 14.0 2/2/2015 0.84 496 3.50 14.1 2/3/2015 1.59 489 3.49 13.4 2/4/2015 2.21 483 3.50 14.5 2/5/2015 1.29 486 3.50 14.3 2/6/2015 1.17 493 3.50 14.4 2/7/2015 1.62 494 3.50 14.1 2/8/2015 2.18 491 3.50 14.5 2/9/2015 1.92 492 3.50 14.4 2/10/2015 2.14 496 3.51 14.9 2/11/2015 1.11 499 3.51 15.0 2/12/2015 1.22 500 3.50 14.4 2/13/2015 1.65 498 3.48 13.1 2/14/2015 1.96 497 3.49 13.5 2/15/2015 2.42 494 3.50 14.3 2/16/2015 2.08 492 3.51 14.9 2/17/2015 0.71 504 3.52 14.0 2/18/2015 0.51 505 3.57 13.0 2/19/2015 1.40 498 3.52 15.0 2/20/2015 1.73 495 3.51 14.0 2/21/2015 1.46 494 3.50 13.0 2/22/2015 0.80 499 3.49 13.0 2/23/2015 0.42 506 3.56 13.0 2/24/2015 0.21 496 3.60 11.0 2/25/2015 0.79 502 3.52 12.0 2/26/2015 1.11 484 3.51 13.0 2/27/2015 0.48 490 3.53 12.0 2/28/2015 0.58 501 3.51 12.0

72
Table 9. continued
Date Temperature
(°C) SC (µS/cm) Stage (ft) Discharge
(cfs) 3/1/2015 1.28 496 3.48 12.7 3/2/2015 1.53 492 3.48 13.2 3/3/2015 1.31 482 3.49 13.0 3/4/2015 0.41 504 3.55 13.0 3/5/2015 0.28 508 3.60 12.0 3/6/2015 0.82 500 3.53 12.0 3/7/2015 1.86 500 3.50 13.0 3/8/2015 2.51 492 3.50 13.0 3/9/2015 2.58 495 3.50 13.0 3/10/2015 3.00 487 3.49 13.0 3/11/2015 2.81 487 3.49 13.2 3/12/2015 3.92 484 3.49 14.4 3/13/2015 4.24 477 3.53 15.9

73
Table 10. Vat Diversion Records: March 2014 - March 2015
The following pages contain daily Vat Diversion records provided by the Central Utah Water Conservancy District (CUWCD) for March 2014 through March 2015. The column labeled, Releases, gives the volume of water (per second) that is allowed to flow past the diversion structure and return into the main channel of the West Fork. Diversions signifies the rate at which water is being taken from the West Fork and transported into Currant Creek Reservoir via the West Fork Pipeline. Inflow is a measure of the water flowing down the West Fork above the Diversion Dam.

74
Date
Reservoir Elevation
(ft) Total Storage
(AF)
Change in Reservoir
(AF) Releases
(cfs) Diversions
(cfs) Inflow (cfs)
01-Mar-14 7,810.77 35 0 6 0 6 02-Mar-14 7,810.63 34 -1 6 0 5 03-Mar-14 7,810.47 33 -1 6 0 5 04-Mar-14 7,810.32 32 -1 6 0 5 05-Mar-14 7,810.17 31 -1 6 0 5 06-Mar-14 7,810.04 31 0 6 0 6 07-Mar-14 7,810.02 31 0 6 0 6 08-Mar-14 7,809.89 30 -1 6 0 5 09-Mar-14 7,809.73 29 -1 6 0 5 10-Mar-14 7,809.94 30 1 6 0 7 11-Mar-14 7,810.09 31 1 6 0 7 12-Mar-14 7,809.85 30 -1 6 0 5 13-Mar-14 7,809.91 30 0 6 0 6 14-Mar-14 7,809.93 30 0 6 0 6 15-Mar-14 7,810.12 31 1 6 0 7 16-Mar-14 7,810.15 31 0 6 0 6 17-Mar-14 7,810.35 33 2 6 0 7 18-Mar-14 7,810.17 31 -2 6 0 5 19-Mar-14 7,809.99 30 -1 6 0 5 20-Mar-14 7,809.93 30 0 6 0 6 21-Mar-14 7,810.06 31 1 6 0 7 22-Mar-14 7,810.24 32 1 6 0 7 23-Mar-14 7,810.08 31 -1 6 0 5 24-Mar-14 7,810.22 32 1 6 0 7 25-Mar-14 7,810.45 33 1 6 0 7 26-Mar-14 7,810.90 36 3 6 0 8 27-Mar-14 7,810.97 36 0 6 0 6 28-Mar-14 7,810.91 36 0 6 0 6 29-Mar-14 7,810.90 36 0 6 0 6 30-Mar-14 7,810.97 36 0 6 0 6 31-Mar-14 7,810.90 36 0 6 0 6
AVERAGE IN CFS 6 0 6 TOTALS IN ACRE FEET 369 0 369

75
Table 10. continued
Date
Reservoir Elevation
(ft) Total Storage
(AF)
Change in Reservoir
(AF) Releases
(cfs) Diversions
(cfs) Inflow (cfs)
01-Apr-14 7,810.98 36 0 6 0 6 02-Apr-14 7,810.88 36 0 6 0 6 03-Apr-14 7,810.86 36 0 6 0 6 04-Apr-14 7,810.86 36 0 6 0 6 05-Apr-14 7,810.96 36 0 6 0 6 06-Apr-14 7,810.96 36 0 6 0 6 07-Apr-14 7,810.96 36 0 6 0 6 08-Apr-14 7,810.90 36 0 7 0 7 09-Apr-14 7,810.77 35 -1 10 0 9 10-Apr-14 7,810.82 35 0 13 0 13 11-Apr-14 7,810.90 36 1 15 0 16 12-Apr-14 7,810.88 36 0 18 0 18 13-Apr-14 7,810.39 33 -3 17 0 15 14-Apr-14 7,810.33 32 -1 14 0 13 15-Apr-14 7,810.32 32 0 13 0 13 16-Apr-14 7,810.34 32 0 14 0 14 17-Apr-14 7,810.36 33 1 15 0 16 18-Apr-14 7,810.42 33 0 19 0 19 19-Apr-14 7,810.46 33 0 21 0 21 20-Apr-14 7,810.51 33 0 23 0 23 21-Apr-14 7,810.42 33 0 25 4 29 22-Apr-14 7,810.18 31 -2 25 10 34 23-Apr-14 7,810.22 32 1 25 14 40 24-Apr-14 7,810.06 31 -1 25 4 28 25-Apr-14 7,810.16 31 0 25 9 34 26-Apr-14 7,810.18 31 0 25 12 37 27-Apr-14 7,809.98 30 -1 25 2 26 28-Apr-14 7,809.79 29 -1 25 0 24 29-Apr-14 7,808.55 23 -6 24 0 21 30-Apr-14 7,807.37 17 -6 22 0 19
AVERAGE IN CFS 16 2 18 TOTALS IN ACRE FEET 966 109 1,053

76
Table 10. continued
Date
Reservoir Elevation
(ft) Total Storage
(AF)
Change in Reservoir
(AF) Releases
(cfs) Diversions
(cfs) Inflow (cfs)
01-May-14 7,807.78 29 17 21 0 30 02-May-14 7,809.33 27 -2 22 3 24 03-May-14 7,809.79 29 2 24 17 42 04-May-14 7,810.20 32 3 24 44 70 05-May-14 7,810.28 32 0 24 73 97 06-May-14 7,810.07 31 -1 23 76 98 07-May-14 7,809.69 29 -2 24 44 67 08-May-14 7,809.71 29 0 24 34 58 09-May-14 7,809.63 28 -1 25 29 53 10-May-14 7,809.60 28 0 24 26 50 11-May-14 7,809.56 28 0 24 23 47 12-May-14 7,809.63 28 0 24 19 43 13-May-14 7,809.70 29 1 25 15 41 14-May-14 7,809.81 29 0 25 18 43 15-May-14 7,810.02 31 2 25 36 62 16-May-14 7,810.10 31 0 25 68 93 17-May-14 7,810.52 34 3 27 104 133 18-May-14 7,810.14 31 -3 38 132 168 19-May-14 7,810.87 36 5 48 148 199 20-May-14 7,810.43 33 -3 30 166 194 21-May-14 7,809.85 30 -3 26 163 187 22-May-14 7,810.08 31 1 31 171 203 23-May-14 7,810.14 31 0 27 165 192 24-May-14 7,809.54 28 -3 31 154 183 25-May-14 7,807.95 20 -8 39 170 205 26-May-14 7,811.22 38 18 52 193 254 27-May-14 7,810.01 30 -8 31 208 235 28-May-14 7,808.96 25 -5 25 188 210 29-May-14 7,808.94 25 0 25 165 190 30-May-14 7,808.94 25 0 25 141 166 31-May-14 7,808.96 25 0 24 123 147
AVERAGE IN CFS 28 94 122 TOTALS IN ACRE FEET 1,710 5,784 7,505

77
Table 10. continued
Date
Reservoir Elevation
(ft) Total Storage
(AF)
Change in Reservoir
(AF) Releases
(cfs) Diversions
(cfs) Inflow (cfs)
01-Jun-14 7,808.99 25 0 24 106 130 02-Jun-14 7,808.98 25 0 24 94 118 03-Jun-14 7,808.98 25 0 24 86 110 04-Jun-14 7,808.97 25 0 24 77 101 05-Jun-14 7,808.97 25 0 24 73 97 06-Jun-14 7,808.92 25 0 24 59 83 07-Jun-14 7,809.05 25 0 24 42 66 08-Jun-14 7,809.13 26 1 24 33 58 09-Jun-14 7,809.80 29 3 24 35 61 10-Jun-14 7,808.79 24 -5 24 32 53 11-Jun-14 7,808.98 25 1 25 26 52 12-Jun-14 7,809.31 27 2 24 23 48 13-Jun-14 7,809.44 27 0 24 21 45 14-Jun-14 7,809.43 27 0 24 18 42 15-Jun-14 7,809.47 28 1 24 16 41 16-Jun-14 7,809.49 28 0 24 14 38 17-Jun-14 7,809.47 28 0 24 14 38 18-Jun-14 7,809.50 28 0 24 14 38 19-Jun-14 7,809.43 27 -1 24 10 33 20-Jun-14 7,809.45 27 0 24 5 29 21-Jun-14 7,809.43 27 0 24 2 26 22-Jun-14 7,809.44 27 0 24 1 25 23-Jun-14 7,809.41 27 0 24 0 24 24-Jun-14 7,809.33 27 0 24 0 24 25-Jun-14 7,808.90 24 -3 23 0 21 26-Jun-14 7,808.19 21 -3 23 0 21 27-Jun-14 7,807.25 17 -4 24 0 22 28-Jun-14 7,806.19 13 -4 24 0 22 29-Jun-14 7,804.89 9 -4 23 0 21 30-Jun-14 7,803.54 5 -4 23 0 21
AVERAGE IN CFS 24 27 50 TOTALS IN ACRE FEET 1,422 1,589 2,991

78
Table 10. continued
Date
Reservoir Elevation
(ft) Total Storage
(AF)
Change in Reservoir
(AF) Releases
(cfs) Diversions
(cfs) Inflow (cfs)
01-Jul-14 7,802.95 4 -1 20 0 19 02-Jul-14 7,802.94 4 0 20 0 20 03-Jul-14 7,802.94 4 0 20 0 20 04-Jul-14 7,802.94 4 0 20 0 20 05-Jul-14 7,802.95 4 0 20 0 20 06-Jul-14 7,802.94 4 0 20 0 20 07-Jul-14 7,802.95 4 0 18 0 18 08-Jul-14 7,802.94 4 0 18 0 18 09-Jul-14 7,802.93 4 0 18 0 18 10-Jul-14 7,802.92 4 0 18 0 18 11-Jul-14 7,802.93 4 0 18 0 18 12-Jul-14 7,802.92 4 0 18 0 18 13-Jul-14 7,802.92 4 0 18 0 18 14-Jul-14 7,802.93 4 0 18 0 18 15-Jul-14 7,802.93 4 0 18 0 18 16-Jul-14 7,802.93 4 0 18 0 18 17-Jul-14 7,802.94 4 0 18 0 18 18-Jul-14 7,802.95 4 0 17 0 17 19-Jul-14 7,802.95 4 0 17 0 17 20-Jul-14 7,802.94 4 0 17 0 17 21-Jul-14 7,802.94 4 0 17 0 17 22-Jul-14 7,802.96 4 0 16 0 16 23-Jul-14 7,802.94 4 0 16 0 16 24-Jul-14 7,802.93 4 0 16 0 16 25-Jul-14 7,802.94 4 0 16 0 16 26-Jul-14 7,802.93 4 0 16 0 16 27-Jul-14 7,802.93 4 0 16 0 16 28-Jul-14 7,802.92 4 0 14 0 14 29-Jul-14 7,803.17 4 0 11 0 11 30-Jul-14 7,804.97 9 5 12 0 15 31-Jul-14 7,807.31 17 8 11 0 15
AVERAGE IN CFS 17 0 17 TOTALS IN ACRE FEET 1,051 0 1,063

79
Table 10. continued
Date
Reservoir Elevation
(ft) Total Storage
(AF)
Change in Reservoir
(AF) Releases
(cfs) Diversions
(cfs) Inflow (cfs)
01-Aug-14 7,808.58 23 6 10 0 13 02-Aug-14 7,809.44 27 4 10 0 12 03-Aug-14 7,809.82 29 2 11 0 12 04-Aug-14 7,810.47 33 4 10 0 12 05-Aug-14 7,811.17 38 5 16 0 19 06-Aug-14 7,811.20 38 0 15 0 15 07-Aug-14 7,811.18 38 0 13 0 13 08-Aug-14 7,811.17 38 0 12 0 12 09-Aug-14 7,811.17 38 0 12 0 12 10-Aug-14 7,811.18 38 0 13 0 13 11-Aug-14 7,811.19 38 0 14 0 14 12-Aug-14 7,811.19 38 0 14 0 14 13-Aug-14 7,811.19 38 0 14 0 14 14-Aug-14 7,811.20 38 0 15 0 15 15-Aug-14 7,811.19 38 0 14 0 14 16-Aug-14 7,811.17 38 0 12 0 12 17-Aug-14 7,811.16 38 0 11 0 11 18-Aug-14 7,811.15 37 -1 10 0 9 19-Aug-14 7,811.17 38 1 12 0 13 20-Aug-14 7,811.19 38 0 15 0 15 21-Aug-14 7,811.20 38 0 15 0 15 22-Aug-14 7,811.19 38 0 14 0 14 23-Aug-14 7,811.28 38 0 25 0 25 24-Aug-14 7,811.21 38 0 16 0 16 25-Aug-14 7,811.23 38 0 19 0 19 26-Aug-14 7,811.20 38 0 16 0 16 27-Aug-14 7,811.20 38 0 15 0 15 28-Aug-14 7,811.21 38 0 17 0 17 29-Aug-14 7,811.19 38 0 13 0 13 30-Aug-14 7,811.18 38 0 13 0 13 31-Aug-14 7,811.17 38 0 12 0 12
AVERAGE IN CFS 14 0 14 TOTALS IN ACRE FEET 849 0 871

80
Table 10. continued
Date
Reservoir Elevation
(ft) Total Storage
(AF)
Change in Reservoir
(AF) Releases
(cfs) Diversions
(cfs) Inflow (cfs)
01-Sep-14 7,811.16 38 0 11 0 11 02-Sep-14 7,811.16 38 0 10 0 10 03-Sep-14 7,811.15 37 -1 10 0 9 04-Sep-14 7,811.14 37 0 9 0 9 05-Sep-14 7,811.15 37 0 10 0 10 06-Sep-14 7,811.16 38 1 10 0 11 07-Sep-14 7,811.15 37 -1 10 0 9 08-Sep-14 7,811.17 38 1 12 0 13 09-Sep-14 7,811.27 38 0 24 0 24 10-Sep-14 7,811.21 38 0 16 0 16 11-Sep-14 7,811.18 38 0 13 0 13 12-Sep-14 7,811.17 38 0 12 0 12 13-Sep-14 7,811.16 38 0 12 0 12 14-Sep-14 7,811.16 38 0 11 0 11 15-Sep-14 7,811.16 38 0 10 0 10 16-Sep-14 7,811.15 37 -1 10 0 9 17-Sep-14 7,811.15 37 0 10 0 10 18-Sep-14 7,811.15 37 0 10 0 10 19-Sep-14 7,811.15 37 0 10 0 10 20-Sep-14 7,811.14 37 0 9 0 9 21-Sep-14 7,811.19 38 1 14 0 15 22-Sep-14 7,811.21 38 0 16 0 16 23-Sep-14 7,811.18 38 0 13 0 13 24-Sep-14 7,811.16 38 0 12 0 12 25-Sep-14 7,811.16 38 0 11 0 11 26-Sep-14 7,811.15 37 -1 10 0 9 27-Sep-14 7,811.26 38 1 23 0 24 28-Sep-14 7,811.44 39 1 50 0 51 29-Sep-14 7,811.07 37 -2 25 4 28 30-Sep-13 7,810.12 31 -6 12 0 9
AVERAGE IN CFS 14 0 14 TOTALS IN ACRE FEET 823 8 825
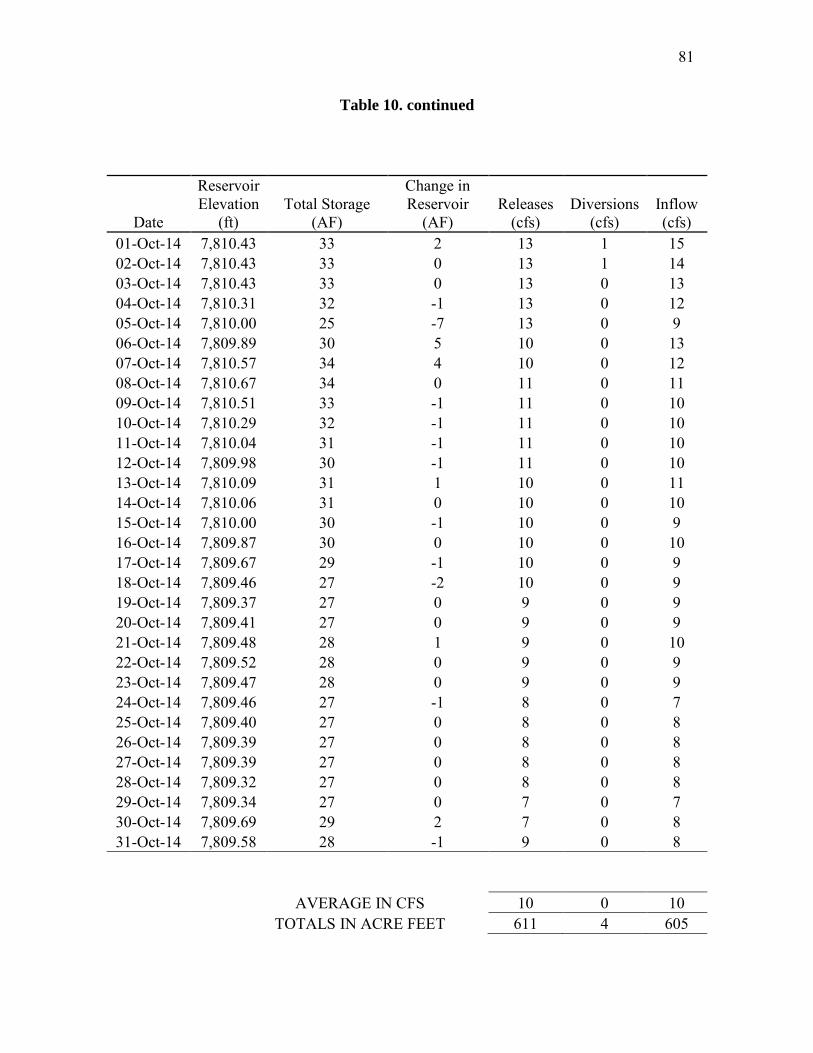
81
Table 10. continued
Date
Reservoir Elevation
(ft) Total Storage
(AF)
Change in Reservoir
(AF) Releases
(cfs) Diversions
(cfs) Inflow (cfs)
01-Oct-14 7,810.43 33 2 13 1 15 02-Oct-14 7,810.43 33 0 13 1 14 03-Oct-14 7,810.43 33 0 13 0 13 04-Oct-14 7,810.31 32 -1 13 0 12 05-Oct-14 7,810.00 25 -7 13 0 9 06-Oct-14 7,809.89 30 5 10 0 13 07-Oct-14 7,810.57 34 4 10 0 12 08-Oct-14 7,810.67 34 0 11 0 11 09-Oct-14 7,810.51 33 -1 11 0 10 10-Oct-14 7,810.29 32 -1 11 0 10 11-Oct-14 7,810.04 31 -1 11 0 10 12-Oct-14 7,809.98 30 -1 11 0 10 13-Oct-14 7,810.09 31 1 10 0 11 14-Oct-14 7,810.06 31 0 10 0 10 15-Oct-14 7,810.00 30 -1 10 0 9 16-Oct-14 7,809.87 30 0 10 0 10 17-Oct-14 7,809.67 29 -1 10 0 9 18-Oct-14 7,809.46 27 -2 10 0 9 19-Oct-14 7,809.37 27 0 9 0 9 20-Oct-14 7,809.41 27 0 9 0 9 21-Oct-14 7,809.48 28 1 9 0 10 22-Oct-14 7,809.52 28 0 9 0 9 23-Oct-14 7,809.47 28 0 9 0 9 24-Oct-14 7,809.46 27 -1 8 0 7 25-Oct-14 7,809.40 27 0 8 0 8 26-Oct-14 7,809.39 27 0 8 0 8 27-Oct-14 7,809.39 27 0 8 0 8 28-Oct-14 7,809.32 27 0 8 0 8 29-Oct-14 7,809.34 27 0 7 0 7 30-Oct-14 7,809.69 29 2 7 0 8 31-Oct-14 7,809.58 28 -1 9 0 8
AVERAGE IN CFS 10 0 10 TOTALS IN ACRE FEET 611 4 605

82
Table 10. continued
Date
Reservoir Elevation
(ft) Total Storage
(AF)
Change in Reservoir
(AF) Releases
(cfs) Diversions
(cfs) Inflow (cfs)
01-Nov-14 7,808.22 21 -7 10 0 6 02-Nov-14 7,807.03 16 -5 10 0 7 03-Nov-14 7,806.20 13 -3 8 0 6 04-Nov-14 7,805.77 12 -1 6 0 5 05-Nov-14 7,807.07 16 4 6 0 8 06-Nov-14 7,808.25 21 5 5 0 8 07-Nov-14 7,809.41 27 6 5 0 8 08-Nov-14 7,810.21 32 5 5 0 8 09-Nov-14 7,810.79 35 3 6 0 8 10-Nov-14 7,810.97 36 1 7 0 8 11-Nov-14 7,810.12 31 -5 7 0 4 12-Nov-14 7,809.42 27 -4 7 0 5 13-Nov-14 7,809.11 26 -1 6 0 5 14-Nov-14 7,809.86 30 4 5 0 7 15-Nov-14 7,810.83 35 5 6 0 9 16-Nov-14 7,811.11 37 2 6 0 7 17-Nov-14 7,811.23 38 1 6 0 7 18-Nov-14 7,810.80 35 -3 7 0 5 19-Nov-14 7,810.53 34 -1 7 0 6 20-Nov-14 7,810.33 32 -2 7 0 6 21-Nov-14 7,810.10 31 -1 7 0 6 22-Nov-14 7,809.91 30 -1 7 0 6 23-Nov-14 7,809.89 30 0 7 0 7 24-Nov-14 7,809.90 30 0 7 0 7 25-Nov-14 7,810.10 31 1 7 0 8 26-Nov-14 7,810.38 33 2 7 0 8 27-Nov-14 7,810.54 34 1 7 0 8 28-Nov-14 7,810.67 34 0 7 0 7 29-Nov-14 7,810.75 35 1 7 0 8 30-Nov-14 7,810.79 35 0 7 0 7
AVERAGE IN CFS 7 0 7 TOTALS IN ACRE FEET 401 0 407

83
Table 10. continued
Date
Reservoir Elevation
(ft) Total Storage
(AF)
Change in Reservoir
(AF) Releases
(cfs) Diversions
(cfs) Inflow (cfs)
01-Dec-14 7,810.81 35 1 7 0 8 02-Dec-14 7,810.68 34 -1 7 0 6 03-Dec-14 7,810.76 35 1 7 0 8 04-Dec-14 7,810.82 35 0 7 0 7 05-Dec-14 7,810.84 35 0 8 0 8 06-Dec-14 7,810.81 35 0 7 0 7 07-Dec-14 7,810.68 34 -1 7 0 6 08-Dec-14 7,810.46 33 -1 8 0 7 09-Dec-14 7,810.24 32 -1 8 0 7 10-Dec-14 7,810.23 32 0 7 0 7 11-Dec-14 7,810.12 31 -1 7 0 6 12-Dec-14 7,810.30 32 1 7 0 8 13-Dec-14 7,810.34 32 0 7 0 7 14-Dec-14 7,810.35 33 1 7 0 8 15-Dec-14 7,809.99 30 -3 7 0 5 16-Dec-14 7,809.98 30 0 7 0 7 17-Dec-14 7,810.09 31 1 7 0 8 18-Dec-14 7,810.01 30 -1 7 0 6 19-Dec-14 7,809.81 29 -1 7 0 6 20-Dec-14 7,809.88 30 1 7 0 8 21-Dec-14 7,809.91 30 0 7 0 7 22-Dec-14 7,810.03 31 1 7 0 8 23-Dec-14 7,809.73 29 -2 7 0 6 24-Dec-14 7,809.88 30 1 7 0 8 25-Dec-14 7,810.27 32 2 7 0 8 26-Dec-14 7,810.37 33 1 7 0 8 27-Dec-14 7,810.22 32 -1 7 0 6 28-Dec-14 7,810.20 32 0 7 0 7 29-Dec-14 7,810.19 32 0 7 0 7 30-Dec-14 7,810.14 31 -1 7 0 6 31-Dec-14 7,809.87 30 -1 7 0 6
AVERAGE IN CFS 7 0 7 TOTALS IN ACRE FEET 436 0 430

84
Table 10. continued
Date
Reservoir Elevation
(ft) Total Storage
(AF)
Change in Reservoir
(AF) Releases
(cfs) Diversions
(cfs) Inflow (cfs)
01-Jan-15 7,809.80 29 0 7 0 7 02-Jan-15 7,809.74 29 0 7 0 7 03-Jan-15 7,809.68 29 0 7 0 7 04-Jan-15 7,809.59 28 -1 7 0 6 05-Jan-15 7,809.51 28 0 7 0 7 06-Jan-15 7,809.45 27 -1 7 0 6 07-Jan-15 7,809.40 27 0 7 0 7 08-Jan-15 7,809.33 27 0 7 0 7 09-Jan-15 7,809.21 26 -1 7 0 6 10-Jan-15 7,809.23 26 0 7 0 7 11-Jan-15 7,809.26 26 0 7 0 7 12-Jan-15 7,809.28 26 0 7 0 7 13-Jan-15 7,809.34 27 1 7 0 8 14-Jan-15 7,808.88 24 -3 7 0 5 15-Jan-15 7,808.96 25 1 6 0 7 16-Jan-15 7,809.89 30 5 6 0 9 17-Jan-15 7,810.57 34 4 6 0 8 18-Jan-15 7,811.00 30 -4 9 0 7 19-Jan-15 7,810.97 30 0 8 0 8 20-Jan-15 7,810.97 30 0 7 0 7 21-Jan-15 7,810.26 32 2 8 0 9 22-Jan-15 7,809.91 30 -2 7 0 6 23-Jan-15 7,810.18 31 1 6 0 7 24-Jan-15 7,810.20 32 1 6 0 7 25-Jan-15 7,810.20 32 0 6 0 6 26-Jan-15 7,810.53 34 2 7 0 8 27-Jan-15 7,810.34 32 -2 7 0 6 28-Jan-15 7,810.17 31 -1 7 0 6 29-Jan-15 7,809.95 30 -1 7 0 6 30-Jan-15 7,809.80 29 -1 7 0 6 31-Jan-15 7,809.71 29 0 7 0 7
AVERAGE IN CFS 7 0 7 TOTALS IN ACRE FEET 426 0 424

85
Table 10. continued
Date
Reservoir Elevation
(ft) Total Storage
(AF)
Change in Reservoir
(AF) Releases
(cfs) Diversions
(cfs) Inflow (cfs)
01-Feb-15 7,809.39 27 0 7 0 7 02-Feb-15 7,809.40 27 0 7 0 7 03-Feb-15 7,809.32 27 0 7 0 7 04-Feb-15 7,809.31 27 0 7 0 7 05-Feb-15 7,809.26 26 -1 7 0 6 06-Feb-15 7,809.00 25 -1 7 0 6 07-Feb-15 7,809.12 26 1 7 0 8 08-Feb-15 7,809.26 26 0 7 0 7 09-Feb-15 7,809.31 27 1 7 0 8 10-Feb-15 7,809.53 28 1 7 0 8 11-Feb-15 7,809.20 26 -2 6 0 5 12-Feb-15 7,809.58 28 2 6 0 7 13-Feb-15 7,810.24 32 4 6 0 8 14-Feb-15 7,810.75 35 3 6 0 8 15-Feb-15 7,810.87 36 1 7 0 8 16-Feb-15 7,810.59 34 -2 8 0 7 17-Feb-15 7,809.62 28 -6 7 0 4 18-Feb-15 7,809.65 28 0 7 0 7 19-Feb-15 7,809.86 30 2 7 0 8 20-Feb-15 7,809.91 30 0 7 0 7 21-Feb-15 7,809.75 29 -1 7 0 6 22-Feb-15 7,809.35 27 -2 7 0 6 23-Feb-15 7,809.08 25 -2 7 0 6 24-Feb-15 7,808.64 23 -2 7 0 6 25-Feb-15 7,809.14 26 3 7 0 9 26-Feb-15 7,809.04 25 -1 7 0 6 27-Feb-15 7,809.02 25 0 7 0 7 28-Feb-15 7,809.09 25 0 7 0 7
AVERAGE IN CFS 7 0 7 TOTALS IN ACRE FEET 383 0 383
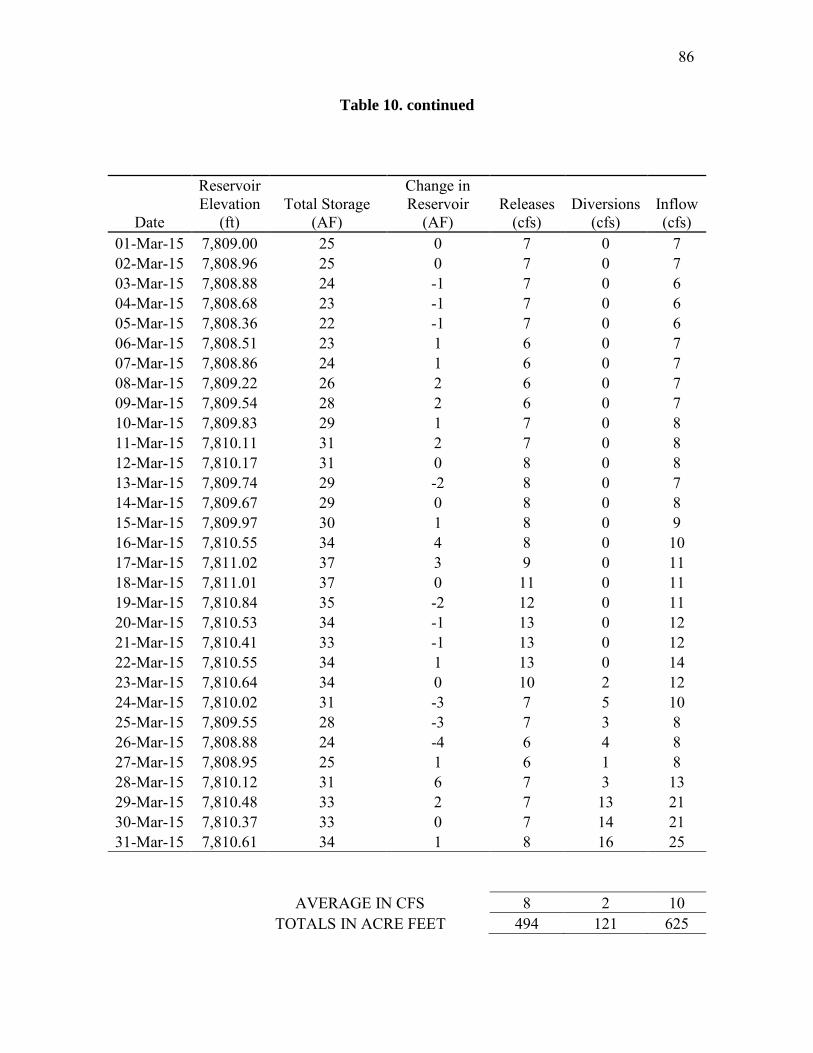
86
Table 10. continued
Date
Reservoir Elevation
(ft) Total Storage
(AF)
Change in Reservoir
(AF) Releases
(cfs) Diversions
(cfs) Inflow (cfs)
01-Mar-15 7,809.00 25 0 7 0 7 02-Mar-15 7,808.96 25 0 7 0 7 03-Mar-15 7,808.88 24 -1 7 0 6 04-Mar-15 7,808.68 23 -1 7 0 6 05-Mar-15 7,808.36 22 -1 7 0 6 06-Mar-15 7,808.51 23 1 6 0 7 07-Mar-15 7,808.86 24 1 6 0 7 08-Mar-15 7,809.22 26 2 6 0 7 09-Mar-15 7,809.54 28 2 6 0 7 10-Mar-15 7,809.83 29 1 7 0 8 11-Mar-15 7,810.11 31 2 7 0 8 12-Mar-15 7,810.17 31 0 8 0 8 13-Mar-15 7,809.74 29 -2 8 0 7 14-Mar-15 7,809.67 29 0 8 0 8 15-Mar-15 7,809.97 30 1 8 0 9 16-Mar-15 7,810.55 34 4 8 0 10 17-Mar-15 7,811.02 37 3 9 0 11 18-Mar-15 7,811.01 37 0 11 0 11 19-Mar-15 7,810.84 35 -2 12 0 11 20-Mar-15 7,810.53 34 -1 13 0 12 21-Mar-15 7,810.41 33 -1 13 0 12 22-Mar-15 7,810.55 34 1 13 0 14 23-Mar-15 7,810.64 34 0 10 2 12 24-Mar-15 7,810.02 31 -3 7 5 10 25-Mar-15 7,809.55 28 -3 7 3 8 26-Mar-15 7,808.88 24 -4 6 4 8 27-Mar-15 7,808.95 25 1 6 1 8 28-Mar-15 7,810.12 31 6 7 3 13 29-Mar-15 7,810.48 33 2 7 13 21 30-Mar-15 7,810.37 33 0 7 14 21 31-Mar-15 7,810.61 34 1 8 16 25
AVERAGE IN CFS 8 2 10 TOTALS IN ACRE FEET 494 121 625

APPENDIX B
SUPPLEMENTAL DATA FOR THE EVALUATION OF
ADDITIONAL NONVOLATILE TRACERS

88
This Appendix contains additional nonvolatile data that was evaluated for
determining groundwater MTT. Figure 11 contains plots showing the relationship between
West Fork spring ages and individual ion concentrations. Figure 12 shows the relationship
between spring ages and specific conductivity (SC).

89
R² = 0.0115
0
20
40
60
80
100
120
140
0 0.005 0.01 0.015
Trac
erLP
M E
PM A
ge (y
ears
)
Li+ (mg/L)
Figure 11. The relationship between West Fork spring ages and ion chemistry. The ages used in this analysis are from TracerLPM EPM results, and are presented in Table 2 in the main text. Ion concentrations are provided in Table 5, Appendix A. Note: the x-axis on the following charts is not uniform; each one is scaled according to the range of concentrations it represents. There is no plot for ammonium (NH4
+) since this cation was not detected in any of the West Fork spring samples. Most of the ions investigated show no apparent correlation to West Fork spring ages. Although the most elevated chloride (Cl-) concentrations do relate nicely to the oldest ages, chloride concentrations for younger water are not uniquely related to age. Therefore, it is unlikely that Cl- would be widely applicable for determining groundwater MTT since many watersheds, like the West Fork, likely contain a significant fraction of water < 50 years old. Also note, the relationship between age and NO2
- is based on only four springs at which NO2- was
measureable, and is therefore considered unreliable.

90
R² = 0.0466
0
20
40
60
80
100
120
140
0 20 40 60 80 100 120
Trac
erLP
M E
PM A
ge (y
ears
)
Ca2+ (mg/L)
R² = 0.1778
0
20
40
60
80
100
120
140
0 10 20 30 40
Trac
erLP
M E
PM A
ge (y
ears
)
Mg2+ (mg/L)
Figure 11. continued

91
Figure 11. continued
R² = 0.0498
0
20
40
60
80
100
120
140
0 5 10 15 20 25 30
Trac
erLP
M E
PM A
ge (y
ears
)
Na+ (mg/L)
R² = 0.001
0
20
40
60
80
100
120
140
0 0.5 1 1.5 2 2.5
Trac
erLP
M E
PM A
ge (y
ears
)
K+ (mg/L)
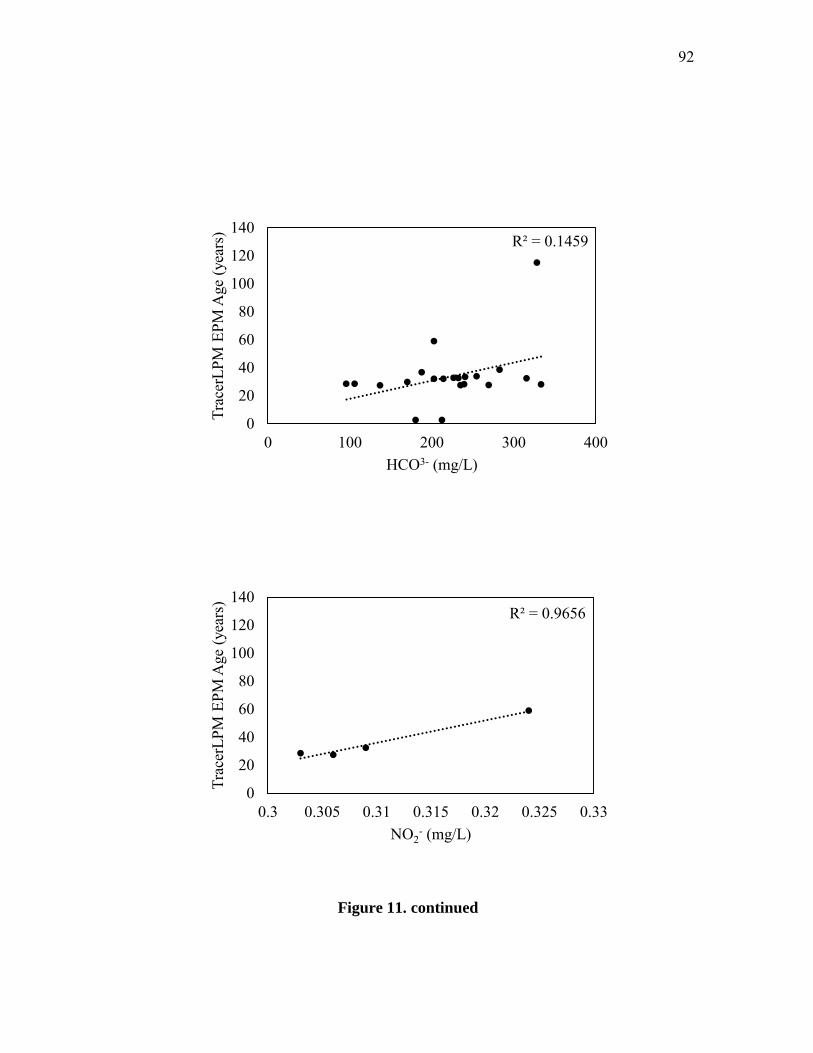
92
Figure 11. continued
R² = 0.1459
0
20
40
60
80
100
120
140
0 100 200 300 400
Trac
erLP
M E
PM A
ge (y
ears
)
HCO3- (mg/L)
R² = 0.9656
0
20
40
60
80
100
120
140
0.3 0.305 0.31 0.315 0.32 0.325 0.33
Trac
erLP
M E
PM A
ge (y
ears
)
NO2- (mg/L)

93
Figure 11. continued
R² = 0.0451
0
20
40
60
80
100
120
140
0 0.5 1 1.5
Trac
erLP
M E
PM A
ge (y
ears
)
Br- (mg/L)
R² = 0.005
0
20
40
60
80
100
120
140
0 1 2 3 4 5
Trac
erLP
M E
PM A
ge (y
ears
)
NO3- (mg/L)

94
Figure 11. continued
R² = 0.0017
0
20
40
60
80
100
120
140
-0.2 -0.1 0 0.1 0.2
Trac
erLP
M E
PM A
ge (y
ears
)
PO43- (mg/L)
R² = 0.0849
0
20
40
60
80
100
120
140
0 50 100 150 200 250
Trac
erLP
M E
PM A
ge (y
ears
)
SO42- (mg/L)

95
Figure 11. continued
R² = 0.6384
0
20
40
60
80
100
120
140
0 2 4 6 8
Trac
erLP
M E
PM A
ge (y
ears
)
Cl- (mg/L)
R² = 0.0088
0
20
40
60
80
100
120
140
0 0.05 0.1 0.15
Trac
erLP
M E
PM A
ge (y
ears
)
F- (mg/L)

96
Figure 12. The relationship between West Fork spring ages and specific conductivity. SC was measured with a Hydrolab Multiprobe during each sampling visit; values are presented in Table 4, Appendix A. There is no apparent correlation between West Fork spring ages determined from lumped-parameter modeling of environmental tracer concentrations and West Fork spring SC.
R² = 0.0262
0
20
40
60
80
100
120
140
0 100 200 300 400 500 600 700 800
Trac
erLP
M E
PM A
ge (y
ears
)
SC (µS/cm)

97
REFERENCES
Aeschbach-Hertig, W., and D.K. Solomon, 2013, Noble gas thermometry in groundwater hydrology, in P. Burnard, ed., The noble gases as geochemical tracers: Berlin Heidelberg, Springer, p. 81-122.
Ashland, F.X., C.E. Bishop, M. Lowe, and B.H. Mayes, 2001, The geology of the Synderville Basin, Western Summit County, Utah, and its relation to groundwater conditions, Utah Geological Survey Open-File Report 337: Utah Department of Natural Resources Water Resources, Salt Lake City, 59 p.
Busenberg, E., and L.N. Plummer, 1992, Use of chlorofluorocarbons (CCl3 F and CCl2 F2 ) as hydrologic tracers and age-dating tools: The alluvium and terrace system of central Oklahoma: Water Resources Research., v. 28, p. 2257–2283.
Bryant, B., 2010, Geologic map of the east half of the Salt Lake City 1° x 2° quadrangle (Duchesne and Kings Peak 30' x 60' quadrangles), Duchesne, Summit, and Wasatch Counties, Utah, and Uinta County, Wyoming: U.S. Geological Survey Miscellaneous Investigation Series Map I-1997, 1992, Miscellaneous Publication 10-1DM, scale 1:125,000, 3 sheets.
Central Utah Water Conservancy District (CUWCD), 2015, Vat diversion dam operation, central Utah project, diversion records March 2013- March 2014.
Constenius, K.N., D.L. Clark, J.K. King, and J.B. Ehler, 2011, Interim geologic map of the Provo 30’ x 60’ quadrangle, Utah, Wasatch and Salt Lake Counties, Utah: Utah Geological Survey Open-File Report 586DM, scale 1:62,500.
Cook, P.G., and J.K. Böhlke, 2000, Determining timescales for groundwater flow and solute transport, in P.G. Cook, and A.L. Herczeg, ed., Environmental tracers in subsurface hydrology: Norwell, Kluwer Academic Publishers, p. 1-30.
Cook, P.G., G. Favreau, J.C. Dighton, and S. Tickell, 2003, Determining natural groundwater influx to a tropical river using radon, chlorofluorocarbons and ionic environmental tracers: Journal of Hydrology, v. 227, p. 74-88, doi 10.1016/S0022-1694(03)00087-8.
Cook, P. G., and D.K. Solomon, 1995, Transport of atmospheric trace gases to the water table: Implications for groundwater dating with chlorofluorocarbons and krypton 85: Water Resources Research, v. 31, p. 263–270.

98
Cook, P.G., and D.K. Solomon, 1997, Recent advances in dating young groundwater: chlorofluorocarbons, 3H/3He and 85Kr: Journal of Hydrology, v. 191, p. 245–265, doi 10.1016/S0022-1694(96)03051-X.
The University of Utah, 2015, Dissolved and noble gas lab, http://www.noblegaslab.utah.edu/index.html (accessed November 2015).
Eastoe, C.J., C.J. Watts, M. Ploughe, and W.E. Wright, 2012, Future use of tritium in mapping pre-bomb groundwater volumes: Ground Water, v. 50, p. 87–93, doi 10.1111/j.1745-6584.2011.00806.x.
Freethey, G.W., and G.E. Cordy, 1991, Geohydrology of the Mesozoic rocks in the Upper Colorado River Basin in Arizona, Colorado, New Mexico, Utah, and Wyoming: USGS Professional Paper 1411-C, 130 p.
Freeze, R.A., and J.A. Cherry, 1979, Groundwater: Englewood Cliffs, Prentice-Hall, p. 604.
Frisbee, M.D., F.M. Phillips, A.R. Campbell, F. Liu, and S.A. Sanchez, 2011, Streamflow generation in a large, alpine watershed in the southern Rocky Mountains of Colorado: Is streamflow generation simply the aggregation of hillslope runoff responses?: Water Resources Research, v. 47, p. 1–18, doi 10.1029/2010WR009391.
Gee, K., 1994, Flagstaff Mountain at Deer Valley - an expansion of the Deer Valley Resort and the hydrogeology of the Judge Tunnel, Park City, Utah: Park City, Utah unpublished consultant’s report, p. 6.
Genereux, D.P., and H.F. Hemond, 1990, Naturally occurring radon 222 as a tracer for streamflow generation: steady state methodology and field example: Water Resources Research, v. 26, iss. 12, p. 3065-3075, doi 10.1029/WR026i012p03065.
Jurgens, B.C., J.K. Böhlke, and S.M. Eberts, 2012, TracerLPM (Version 1): An Excel® workbook for interpreting groundwater age distributions from environmental tracer data: U.S. Geological Survey Techniques and Methods Report 4-F3, 60 p.
Koh, D.C., L.N. Plummer, E. Busenberg, and Y. Kim, 2007, Evidence for terrigenic SF6 in groundwater from basaltic aquifers, Jeju Island, Korea: Implications for groundwater dating: Journal of Hydrology, v. 339, p. 93–104.
Kralik, M., F. Humer, J. Fank, T. Harum, G. Klammler, D. Gooddy, J. Sültenfuß, C. Gerber, and R. Purtschert, 2014, Using 18O/2H, 3H/3He, 85Kr and CFCs to determine mean residence times and water origin in the Grazer and Leibnitzer Feld groundwater bodies (Austria): Applied Geochemistry, v. 50, p. 150–163.

99
McMahon, P.B., L.N. Plummer, J.K. Bölke, S.D. Shapiro, and S.R. Hinkle, 2011, A comparison of recharge rates in aquifers of the United States based on groundwater-age data: Hydrogeology Journal, v. 19 no. 4, p. 779 – 800, doi 10.1007/s10040-0110722-5.
Miller, M.P., D.D. Susong, C.L Shope, V.M. Heilweil, and B.J. Stolp, 2014, Continuous estimation of baseflow in snowmelt-dominated streams and rivers in the Upper Colorado River Basin: A chemical hydrograph separation approach: Water Resources Research, v. 50, p. 6986–6999, doi 10.1002/2013WR014939.
Morgenstern, U., M.K. Stewart, and R. Stenger, 2010, Dating of streamwater using tritium in a post nuclear bomb pulse world: Continuous variation of mean transit time with streamflow: Hydrology and Earth System Science, v. 14, p. 2289–2301, doi 10.5194/hess-14-2289-2010.
Peters, N.E., D.A. Burns, and B.T. Aulenbach, 2014, Evaluation of high-frequency mean streamwater transit-time estimates using groundwater age and dissolved silica concentrations in a small forested watershed: Aquat. Geochemistry, v. 20, p. 183–202 doi 10.1007/s10498-013-9207-6.
Plummer, L.N., E. Busenberg, and L.F. Han, 2006, CFCs in binary mixtures of young and old groundwater, use of chlorofluorocarbons in hydrology: A guidebook, International Atomic Energy Agency (IAEA), v .5, chapt. 5, p. 59-72.
PRISM Climate Group, 2014, Average annual precipitation (1981-2010): Utah, http://prism.oregonstate.edu (accessed November 2015).
PRISM Climate Group, 2015, Average annual mean temperature: 2014, http://prism.oregonstate.edu (accessed November 2015).
Robson, S.G., and E.R. Banta, 1995, Ground water atlas of the United States: segment 2, Arizona, Colorado, New Mexico, Utah: Hydrologic atlas 730-C U.S. Geological Survey, C1-C32.
Rueedi, J., M.S. Brennwald, R. Purtschert, U. Beyerle, M. Hofer, R. Kipfer, J.V. Turner, and P.K. Aggarwal, 2005, Estimating amount and spatial distribution of groundwater recharge in the Iullemmeden basin (Niger) based on 3H, 3He and CFC-11 measurements: Hydrological Processes, v. 19, p. 3285–3298.
Schlosser, P., M. Stute, H. Dörr, C. Sonntag, and K.O. Münnich, 1988, Tritium/3He dating of shallow groundwater: Earth and Planetary Science Letters, v. 89, p. 353–362.
Schwientek, M., P. Maloszewski, and F. Einsiedl, 2009, Effect of the unsaturated zone thickness on the distribution of water mean transit times in a porous aquifer: Journal of Hydrology, v. 373, p. 516–526.

100
Solomon, D.K., and P.G. Cook, 2000, 3H and 3He, in P.G. Cook, and A.L. Herczeg, ed., Environmental tracers in subsurface hydrology, Norwell, Kluwer Academic Publishers, p. 397-424, doi 10.1007/978-1-4615-4557-6_13.
Solomon, D.K., S.L. Schiff, R.J. Poreda, and W.B. Clarke, 1993, A validation of the 3H/3He method for determining groundwater recharge: Water Resources Research, v. 29, p. 2951–2962, doi 10.1029/93WR00968.
Stewart, M.K., J. Mehlhorn, and S. Elliott, 2007, Hydrometric and natural tracer (oxygen- 18, silica, tritium and sulphur hexafluoride) evidence for a dominant groundwater contribution to Pukemanga Stream, New Zealand: Hydrological Processes, v. 21, p. 3340-3356, doi 10.1002/hyp.6557.
Uygur,K., and M.D. Picard, 1984, Implications to exploration of porosity relationships and paragenitic sequences, Jurassic Navajo (Nugget) Sandstone, Utah and Southwestern Wyoming: AAPG Bulletin, v. 01/1984: p. 68, doi 10.1306/AD461656.
USGS, 2015, Reston groundwater dating laboratory, http://water.usgs.gov/lab (accessed November 2015).
Utah AGRC, 2016, Base map and imagery, http://gis.utah.gov (accessed November 2015).
Wilkowske, C.D., D.V. Allen, and J.V. Phillips, 2003, Drought conditions in Utah during 1999-2002: a historical perspective, USGS fact sheet 037-03: United States Geological Survey Reston, VA, 6 p.
Zoellmann, K., W. Kinzelbach, and C. Fulda, 2001, Environmental tracer transport (3H and SF6 ) in the saturated and unsaturated zones and its use in nitrate pollution management: Journal of Hydrology, v. 240, p. 187–205.