groundwater quality assessment in lower tamirabharani ... · groundwater quality assessment in...
TRANSCRIPT

International Research Journal of Earth Sciences______________________________________ ISSN 2321–2527
Vol. 2(10), 8-15, November (2014) Int. Res.J. Earth Sci.
International Science Congress Association 8
Groundwater Quality Assessment in Lower Tamirabharani River Basin
Tamil Nadu, India
Senthilkumar M. and Jeyavel Rajakumar T. Department of Earth Sciences, Annamalai University, Tamil Nadu, INDIA
Available online at: www.isca.in, www.isca.me Received 8th September 2014, revised 12th October 2014, accepted 23th November 2014
Abstract
For analyzing the multiple thematic maps at a time, GIS is a prevailing tool. GIS investigation is carried out in the present
study area to locate the best quality of groundwater zones in Lower Tamirabharani River basin. Totally 48 Groundwater
samples have been collected from various places of Lower Tamirabharani river basin. Groundwater study of the area, water
samples were collected in an area of 1255.26 km2 and analyzed for major cations and anions. The values of analyzed
Groundwater samples are compared with WHO water quality standards. It is observed that, most of the groundwater quality
values are not suitable for drinking purpose. ArcGIS was employed, to understand the spatial distribution of incompatible
zones. Attributes were linked in ArcGIS and spatial interpolation mapping was done. To locate the best quality groundwater
domain, GIS analyses are supportive. The final integrated map reveals that good for groundwater quality zones covered in area
about 113.73 Km2. Moderate class combinations cover an area of 702.30 Km
2. Bad and very bad class of groundwater is not
suitable for the drinking purpose and covers an area of 335.26 Km2 and 103.97 Km
2. The saline area is differentiating using
the EC groundwater quality data. Totally 72.92% of the samples are suitable for irrigation purposes. Compare to SAR and
sodium percentage, 91.67% of the samples are within the acceptable limit and the groundwater is suitable for irrigation
purpose.
Keywords: GIS (Geographic Information System); spatial distribution Map; SAR (Sodium Adsorption Ratio).
Introduction
Groundwater is an essential natural resource. Depending upon
its usage and consumption it can be a renewable or a non
renewable resource. Groundwater is the world’s most extracted
raw material with withdrawal rate currently in the estimated
range of 982km3/year1. In many nations, more than half of the
groundwater withdrawn is for domestic water supplies and
globally it provides 25% to 40% of the world’s drinking water.
Among the various reasons, the most important are non-
availability of potable water in surface and a general belief that
groundwater is purer and safer than the surface water due to the
soil cover protective qualities2.
The quality of groundwater is the resulting the processes and
reaction that act on the water from the moment it squeeze in the
atmosphere to the time it is discharged by a well. Therefore,
determination of groundwater quality is important to observe the
suitability of water for a particular utilize. The problems of
ground water quality are more acute in areas of which dense
populated and thick industrialized area have shallow
groundwater tube wells3. Geochemical studies of groundwater
provide information about the possible changes in quality as
development progress. With help of groundwater geochemistry
the Suitability of groundwater for domestic and irrigation
purposes is determined. Anthropogenic activities can alter the
relative contributions of the natural causes and also introduce
the effects of pollution4.
Geochemical processes in groundwater involve the interaction
of country rocks with water, leading to the development of
secondary mineral phases. The principles governing the
chemical characteristics of groundwater were well documented
in many parts of the world5-12,
. This paper examines the possible
chemical processes of groundwater interaction in hard rock
terrain.
GIS has come out as a powerful technology for instruction, for
research, and for building the stature of programs13-17
have
conducted GIS based study and interpretation of groundwater
quality data.
The present study of groundwater samples have been collected
and analyzed for various parameters such as, EC, pH, TDS, Ca,
Mg, HCO3, Cl, Na and K etc., the analyzed results were in use
into GIS environment. Spatial distribution maps were prepared
for the above parameters in GIS. Analysis of multiple thematic
maps overlay carried out to find the bat suitable zone with
respect to all elements.
Study Area: The major portion of the study area falls in
Tuticorin district and parts of Tirunelveli District in Tamil
Nadu. It lies between 8°26’35” and 8°54’09” N latitudes, and
77°38’50” and 78°8’22” E longitudes covering an area of
1255.26 Sq km (Fig.1). Eastern part of the study area is coastal

International Research Journal of Earth Sciences____________________________________________________ ISSN 2321–2527
Vol. 2(10), 8-15, November (2014) Int. Res. J. Earth Sci.
International Science Congress Association 9
Figure-1
Study area of Lower Tamirabharani River basin and Sample locations
zone of the Bay of Bengal. The coastal zone includes recent age
of coastal sand, calcareous sandstone with and without shells,
clay, and kankar. The calcareous sandstone is seen at Kurumbur,
Kayamoli, Ammanpuram and a few other places. Western part
of the study area is underline by the Archaean crystalline rocks.
The Archaean complex includes ridges of quartzite, charnockite,
calc-granulite and the basement peninsular gneiss.
Methodology
48 groundwater samples from open and bore wells of various
locations which are extensively used for drinking and also
irrigation purposes in the Lower Tamirabharani river basin area
were collected during pre-monsoon season (May 2013). Power
of Hydrogen (pH) and Electrical conductivity (EC) were
calculated within a few hours of collection by using Elico pH
meter and conductivity meter. Calcium (Ca), Magnesium (Mg)
and Chloride (Cl) were determined using standard EDTA and
silver nitrate in volumetric analysis18
. Carbonate, Bicarbonate
and sulfate were determined with standard sulphuric acid and
gravimetrically by precipitating Barium Sulfate (BaSO4) from
Barium Chloride (BaCl2). By using Elico flame photometer
Sodium (Na) and Potassium (K) was determined and Iron (Fe),
Fluoride (F) and Nitrate (NO3) were determined by standard
processor19
. The base map was prepared with help of toposheet
number 58 L/1, L/2, and 58 H/13, H/14 on 1:50,000 scale. Their
points are added and analyzed in ArcGIS software. The maps
prepared in ArcGIS are correlated one over the other to find the
best combination for groundwater quality.
Results and Discussion
Water Quality Analysis for Drinking Purpose: Groundwater
hydro-chemical analysis data of samples for the pre-monsoon
season are represented in table-1. The pH values of water
sample for pre-monsoon are in the range of 6.28 - 7.74
representing an acidic to alkaline in nature. The same as per
the20
standards, all samples fall within the recommended limit
except 1, 22 samples (6.5 - 8.5) for human utilize. The
conductivity value of the samples varies from 196 - 9360
µScm1. The TDS value varies from 137.2 - 6552 mg/l during the
pre-monsoon season. Most of the Samples showed abnormal
values of Conductivity and TDS (samples no: 1, 2, 10, 17, 20,
22) falling within the permitted limits. The alkalinity value
varies from 52 - 2520 mg/l during the pre-monsoon season in
2013. The presence of carbonates (Ca), bicarbonates (HCo3) and
hydroxides (OH-) are the most common parameters of alkalinity
in natural water.
Bicarbonates signify the major form since they are formed in
extensive amounts from the action of carbonates upon the basic
resources in the soil.
The groundwater sodium concentration in the study area varies
between 22 - 942 mg/l. It can be observed from the tables, that
sodium concentrations are very high in the groundwater of pre-
monsoon season and unsuitable for some of the domestic
applications. The parameters such as Calcium, magnesium,
nitrate, total dissolved solids and total hardness in the
groundwater are inter-related. Most of the samples are indicate
for normal values of calcium, magnesium and total hardness
within permissible l imi ts and thus the groundwater is not much
hard. Based on the WHO standard 1, 2, 10, 17, 22, 26 and 30
samples are high concentration or contamination of groundwater
for calcium, magnesium, nitrate, total dissolved solids and total
hardness ions. The content chloride value range from 24 - 1560
mg/I. 81.25% of samples falls within the permissible limit for
drinking purpose20
. Iron (Fe) concentration of the groundwater
ranging from 0 to 4.2 mg/l, but most of the samples fell in not
potable category. Fluoride ionic concentration of the present

International Research Journal of Earth Sciences____________________________________________________ ISSN 2321–2527
Vol. 2(10), 8-15, November (2014) Int. Res. J. Earth Sci.
International Science Congress Association 10
investigation reveals that 56% of the samples fell in potable
zone.
Spatial Analysis of Groundwater Quality for Drinking Use:
It is an analytical technique associated with the location study and
their associated attributes (like table analysis, classification,
polygon classification and weight classification). The Parameters
of pH, TDS, Ca, Mg, Na, K, Cl, SO4, Fe, F and NO3 are
prepared as thematic maps to describe. These were reclassified and
assigned suitable weightages for the spatial distribution map
preparation are given results (table-2).
Data and Maps Analysis for drinking purpose: Each thematic
map such as power of hydrogen (pH) figure.2, total dissolved
solids (TDS) figure-3, calcium (Ca) figure-4, magnesium (Mg)
figure-5, sodium (Na) figure-6, potassium (K) figure-7, chloride
(Cl) figure-8, sulfate (SO4) figure-9, iron (Fe) figure-10, fluoride
(F) Figure-11 and nitrate (NO3) figure-12 provides certain clues
for the quality of groundwater. In order to collect all these
information unified, it is important to combine these data with
appropriate factor. Therefore, numerically this information is
integrated through the application of GIS. Various thematic maps
are reclassified on the basis of their weightage assigned, and
brought into the "Raster Calculator" purpose of Spatial Analyses
tool for integration. A simple arithmetical model has been
adopted to combine various thematic maps. The final (Domestic
quality) map (figure-13) expose that 113.73 Km2 area fall under
good category and 335.26 Km2, 103.97 Km
2 areas fallowed by
bad and very bad category, the rest of the portion in moderate
quality of groundwater Table 3. This methodology it is highly
helpful to assessing the best quality groundwater zone in the
study area.
Table-1
Chemical Composition of Groundwater (Ionic concentrations are expressed in mg/L and EC in µScm-1
) Station Ca Mg Na K Fe HCO3 CO3 SO4 Cl F pH EC* TDS K. Ratio RSC* SAR* Na% TH
Pullaveli 716 178 880 90 3.5 2817.26 0.00 280 1380 3.2 6.28 8740 6118 0.76 -4.18 7.63 44.62 3580
Pazhayakayal 182 50 254 27 1.8 638.03 0.00 120 424 1.2 6.92 2480 1736 0.84 -2.71 4.30 47.14 910
Agaram 95 29 151 17 1.5 493.57 0.00 52 176 2.5 7.34 1452 1016 0.92 0.97 3.48 49.61 476
Arasankulam 49 18 78 10 0.3 305.25 0.00 36 64 2.8 7.56 719 503 0.86 1.08 2.42 48.13 246
Sakkamalpuram 58 20 90 11 0.3 299.19 0.00 64 88 3.5 7.58 844 591 0.87 0.40 2.62 48.33 288
Siruthondanallur 71 23 112 13 3.8 458.34 0.00 27 92 1.6 7.47 1062 743 0.89 2.06 2.95 48.90 356
Sethukkuvaithan 27 13 48 7 0.2 222.08 0.00 6 32 0.4 7.64 424 297 0.88 1.25 1.93 48.84 136
MelaAuthoor 48 17 70 9 4.2 285.86 0.00 28 64 0.4 7.59 638 447 0.80 0.88 2.20 46.16 238
Kattalankulam 62 21 96 12 0.3 386.81 0.00 28 84 0.6 7.44 896 627 0.86 1.50 2.67 47.92 312
Pandaravilai 220 59 359 38 2.5 712.18 0.00 150 624 2.2 6.89 3530 2471 0.99 -4.14 5.55 51.18 1100
Perunkulam 53 19 77 10 1.6 317.46 0.00 36 64 1.2 7.52 708 496 0.80 1.03 2.31 46.24 264
Petmanagaram 54 19 85 11 1.4 325.41 0.00 32 80 1.0 7.46 792 554 0.87 1.05 2.53 48.13 272
Srivaikundam 51 18 81 10 0.5 284.09 0.00 40 84 2.0 7.53 754 528 0.87 0.60 2.48 48.34 256
Mottachikudiyiruppu 47 17 71 9 1.8 282.74 0.00 32 64 1.4 7.42 651 456 0.82 0.85 2.25 46.79 236
Tholappanpannai 38 15 75 9 0.3 247.33 0.00 28 72 1.8 7.47 689 482 1.03 0.89 2.59 52.49 192
Sivaganapuram 78 25 112 13 0.3 433.21 0.00 65 96 0.2 7.33 1060 742 0.82 1.15 2.82 46.66 392
Manakkadu 184 50 266 29 2.4 717.79 0.00 90 424 2.8 7.02 2598 1819 0.87 -1.54 4.48 48.01 920
Piramayapuram 51 18 74 9 0 349.24 0.00 22 48 1.6 7.48 684 479 0.80 1.66 2.27 46.13 256
Varatharajapuram 51 18 75 10 3.0 292.86 0.00 30 76 1.4 7.54 691 484 0.80 0.74 2.29 46.36 256
Sivakalai 10 6 22 4 0 76.56 0.00 6 24 0.4 7.29 196 137 0.96 0.26 1.36 51.74 48
Therikudiyiruppu 11 9 32 5 0 101.52 0.00 12 32 0.6 7.35 264 185 1.11 0.39 1.77 54.78 56
Pitchivilai 842 208 942 96 1.8 3166.26 0.00 320 1560 1.2 6.35 9360 6552 0.69 -7.24 7.53 42.34 4210
Vellamadam 71 23 130 15 0.3 333.75 0.00 24 196 1.0 7.42 1242 869 1.04 0.02 3.43 52.58 356
Punnaiyadi 73 23 127 15 0.2 434.68 0.00 90 88 0.2 7.36 1214 850 1.00 1.56 3.32 51.54 364
Mookuperi 85 26 125 14 0.3 454.01 0.00 76 112 2.2 7.44 1185 830 0.85 1.04 3.03 47.47 424
Sundapuram 224 60 305 33 1.5 774.97 0.00 130 524 1.0 6.85 2990 2093 0.82 -3.39 4.67 46.69 1120
Thoppur 74 24 110 13 0.2 359.48 0.00 40 144 1.2 7.41 1039 727 0.84 0.22 2.84 47.39 372
Kulathukudiyiruppu 72 23 113 13 0.2 385.52 0.00 40 128 2.6 7.3 1070 749 0.89 0.81 2.96 48.82 360
Athinathapuram 54 19 89 11 0 343.06 0.00 85 36 1.4 7.28 825 578 0.90 1.34 2.63 49.07 272
Athalikulam 118 34 193 21 0.6 521.01 0.00 60 280 1.0 7.06 1872 1310 0.96 -0.20 4.02 50.58 592
Kuppapuram 94 28 166 19 0.2 314.16 0.00 68 288 1.2 7.42 1596 1117 1.03 -1.86 3.85 52.26 468
Serakulam 138 39 212 23 1.2 522.62 0.00 90 336 1.6 7.01 2060 1442 0.91 -1.54 4.10 49.27 690
Udayarkulam 144 41 230 25 0.8 566.39 0.00 110 340 0.4 6.94 2240 1568 0.95 -1.24 4.36 50.28 720
Vallakulam 50 18 76 10 0 291.28 0.00 27 76 1.8 7.67 696 487 0.83 0.83 2.34 47.22 248
Makilchipuram 66 22 89 11 0 408.98 0.00 29 68 0.2 7.42 833 583 0.77 1.64 2.44 45.12 328
Ariyanayagipuram 54 19 85 11 3.6 293.07 0.00 36 96 1.8 7.42 793 555 0.87 0.52 2.53 48.16 272
Kalvi 82 26 128 15 0.3 425.11 0.00 56 144 2.8 7.44 1224 857 0.90 0.74 3.16 48.90 412
Athichanallur 49 18 72 9 0 327.93 0.00 25 48 1.8 7.28 658 461 0.80 1.48 2.24 46.31 244
Achimadam 87 27 122 14 0.2 436.94 0.00 80 120 2.2 7.35 1155 809 0.80 0.59 2.92 46.23 436
Saithunganallur 118 34 196 22 1.4 558.89 0.00 40 276 2.6 7.37 1904 1333 0.98 0.48 4.10 51.15 588
Maruthakulam 69 23 96 12 0 438.26 0.00 36 64 1.2 7.42 896 627 0.79 1.90 2.56 45.73 344
Ulakudi 40 16 63 8 0 248.69 0.00 22 60 1.6 7.54 569 398 0.83 0.80 2.14 47.33 200
Karaimanakkadu 52 18 76 10 0 332.08 0.00 30 56 0.8 7.48 696 487 0.80 1.33 2.29 46.19 260
Nanalkadu 45 17 69 9 0.3 309.14 0.00 22 48 0.6 7.35 632 442 0.83 1.43 2.23 47.06 226
Kaliyavoor 65 22 92 11 0 362.07 0.00 90 52 1.8 7.4 856 599 0.80 0.93 2.52 46.02 324
Fatimakovai 26 12 47 7 0 204.47 0.00 6 36 0.2 7.62 410 287 0.90 1.07 1.92 49.32 128
Keelanatham 28 13 52 7 0 218.58 0.00 9 40 0.2 7.74 462 323 0.93 1.14 2.05 50.11 140
Palayanchettikulam 45 17 72 9 0.2 266.10 0.00 28 72 1.0 7.38 659 461 0.87 0.75 2.33 48.19 224
EC* – Electrical conductivity, RSC* – Residual Sodium Carbonate, SAR* – Sodium Adsorption, Ratio, TH* - Total Hardness

International Research Journal of Earth Sciences____________________________________________________ ISSN 2321–2527
Vol. 2(10), 8-15, November (2014) Int. Res. J. Earth Sci.
International Science Congress Association 11
Table-2-Chemical Quality – GIS Spatial Distribution Results
Elements Acceptable Area in Km2 Allowable Area in Km
2 Not Potable Area in Km
2
Power of Hydrogen (pH) 1251.17 - 4.10
Total Dissolved Solids (TDS) 137.51 933.90 183.86
Calcium (Ca) 648.49 502.47 104.31
Magnesium (Mg) 876.88 253.91 124.47
Sodium (Na) 1122.14 - 133.14
Potassium (K) 160.19 - 1095.08
Chloride (Cl) 972.46 - 282.81
Sulphate (SO4) 1255.28 - -
Iron (Fe) 316.27 - 939.01
Fluoride (F) 754.53 - 500.75
Nitrate (NO3) 1118.45 - 136.82
Figure-2
pH Quality – Spatial Distribution Map
Figure-3
TDS Quality – Spatial Distribution Map
Figure-4
Calcium Quality – Spatial Distribution Map
Figure-5
Magnesium Quality – Spatial Distribution Map

International Research Journal of Earth Sciences____________________________________________________ ISSN 2321–2527
Vol. 2(10), 8-15, November (2014) Int. Res. J. Earth Sci.
International Science Congress Association 12
Figure-6
Sodium Quality – Spatial Distribution Map
Figure-7
Potassium Quality – Spatial Distribution Map
Figure-8
Chloride Quality – Spatial Distribution Map
Figure-9
Sulphate Quality – Spatial Distribution Map
Figure-10
Fe Quality – Spatial Distribution Map
Figure-11
F Quality – Spatial Distribution Map

International Research Journal of Earth Sciences____________________________________________________ ISSN 2321–2527
Vol. 2(10), 8-15, November (2014) Int. Res. J. Earth Sci.
International Science Congress Association 13
Table-3
Result of Final Groundwater Quality Zones
Sl.No. Class Area in Km2
1 Good 113.73
2 Moderate 702.30
3 Bad 335.26
4 Very bad 103.97
Figure-12
NO3 Quality – Spatial Distribution Map
Water Quality Analysis for the purpose of Irrigation:
Groundwater always contains assessable quantities of dissolved
substances, which are called salts. The salts present in the water,
besides affecting the growth of the plants directly, affect the soil
structure, permeability and aeration, which indirectly affect the
plant growth. The total concentration of soluble salts in
irrigation water can be expressed for the purpose of
classification (Table 4) as follows: less than 250 µ Scm-1
were
classified as low salinity area. These area’s crops yield is low.
Second and third categories of groundwater are suitable for all
crop cultivation and respectable yield. Final class of the
groundwater must be not suitable for irrigational purposes due to
very high salinity.
The sodium or alkali hazard limit for irrigation is determined by
the absolute and relative concentration of cations and is
expressed in terms of sodium adsorption ratio (SAR). There is a
significant relationship between SAR values of irrigation water
and the extent to which sodium is absorbed by the soil. If
groundwater used for irrigation is high in sodium and low in
calcium, the cation-exchange complex may become saturated
with sodium. This can destroy the soil structure owing to
dispersion of the clay particles21
.
SAR =Na
Ca+Mg
2
(1)
A simple method of evaluating high sodium water is the SAR.
Calculating the SAR for given water provides a useful index of
the sodium hazard of that water for soils and crops. A low SAR
value (2 - 10) indicates little danger from sodium; 10-18
indicating medium hazards; high hazards are between 18 - 26 and
very high hazards more than 26. The lower the ionic strength of
the solution is greater the sodium hazards for a given SAR. The
value of SAR in the groundwater samples of the study area ranges
from 1.36 - 7.63 during pre-monsoon seasons (Table 5). Based
on the table, the groundwater of the study area falls under the
category of small danger except four samples (7, 20, 21, and
46). Water which have high sodium may produce harmful levels
of exchangeable sodium in most soils and will require special
soil management like good drainage, high leaching, and organic
matter additions21
.
Calculating the Sodium Percentage;
Na% = Na+K
×100Ca+Mg+Na+K
(2)
All ionic concentrations are expressed in Millieqivalent per litre.
The sodium percentage in the study area varies from 52.04 -
56.85. As per the Bureau of Indian Standards, 1991 standards, a
sodium percentage of 60 is the maximum recommended limit for
water in irrigation. The high value sodium saturation in the water
samples directly causes calcium deficiency.
Table-4
Groundwater Electrical Conductivity Classification for Irrigational Purpose
Sl. No. Conductivity (µScm-1
) Class No. of Samples Total No. of Sample Percentage
1 < 250 Low Salinity Zone 20 1 2.08
2 250-750 Medium Salinity Zone 4,7,8,11,14,15,18,19,21,34,
38,42,43,44,46,47,48 17 35.42
3 750-2250 High Salinity Zone 5,6,9,12,13,16,23,24,25,27,
28,29,35,36,37,39,41,45 18 37.50
4 2250-5000 Very High Salinity Zone 1,2,3,10,17,22,26,30,31,
32,33,40 12 25.00
International Research Journal of Earth Sciences____________________________________________________ ISSN 2321–2527
Vol. 2(10), 8-15, November (2014) Int. Res. J. Earth Sci.
International Science Congress Association 14
Table-5
Groundwater Classification for Irrigational Purpose
Sl.No. SAR
Value Class No. of Samples
Total No. of
Sample Percentage
1 < 2 Good 7,20,21,46 4 8.33
2 - 10 Little danger
1,2,3,4,5,6,8,9,10,11,12,13,14,15,16,17,18,19,
22,23,24,25,26,27,28,29,30,31,32,33,34,35,36,37,
38,39,40,41,42,43,44,45,47,48
44 91.67
2 10 - 18 Medium hazards - - -
3 18 - 26 High hazards - - -
4 > 26 Very high
hazards - - -
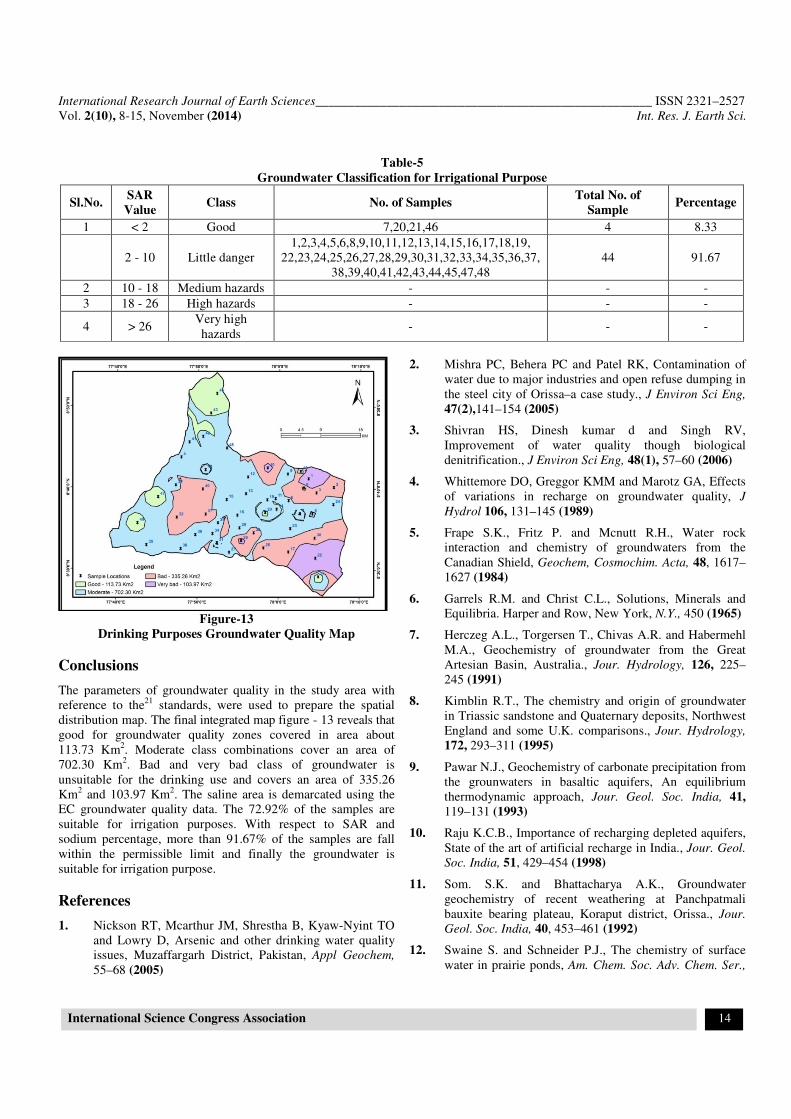
Figure-13
Drinking Purposes Groundwater Quality Map
Conclusions
The parameters of groundwater quality in the study area with
reference to the21
standards, were used to prepare the spatial
distribution map. The final integrated map figure - 13 reveals that
good for groundwater quality zones covered in area about
113.73 Km2. Moderate class combinations cover an area of
702.30 Km2. Bad and very bad class of groundwater is
unsuitable for the drinking use and covers an area of 335.26
Km2 and 103.97 Km
2. The saline area is demarcated using the
EC groundwater quality data. The 72.92% of the samples are
suitable for irrigation purposes. With respect to SAR and
sodium percentage, more than 91.67% of the samples are fall
within the permissible limit and finally the groundwater is
suitable for irrigation purpose.
References
1. Nickson RT, Mcarthur JM, Shrestha B, Kyaw-Nyint TO
and Lowry D, Arsenic and other drinking water quality
issues, Muzaffargarh District, Pakistan, Appl Geochem,
55–68 (2005)
2. Mishra PC, Behera PC and Patel RK, Contamination of
water due to major industries and open refuse dumping in
the steel city of Orissa–a case study., J Environ Sci Eng,
47(2),141–154 (2005)
3. Shivran HS, Dinesh kumar d and Singh RV,
Improvement of water quality though biological
denitrification., J Environ Sci Eng, 48(1), 57–60 (2006)
4. Whittemore DO, Greggor KMM and Marotz GA, Effects
of variations in recharge on groundwater quality, J
Hydrol 106, 131–145 (1989)
5. Frape S.K., Fritz P. and Mcnutt R.H., Water rock
interaction and chemistry of groundwaters from the
Canadian Shield, Geochem, Cosmochim. Acta, 48, 1617–
1627 (1984)
6. Garrels R.M. and Christ C.L., Solutions, Minerals and
Equilibria. Harper and Row, New York, N.Y., 450 (1965)
7. Herczeg A.L., Torgersen T., Chivas A.R. and Habermehl
M.A., Geochemistry of groundwater from the Great
Artesian Basin, Australia., Jour. Hydrology, 126, 225–
245 (1991)
8. Kimblin R.T., The chemistry and origin of groundwater
in Triassic sandstone and Quaternary deposits, Northwest
England and some U.K. comparisons., Jour. Hydrology,
172, 293–311 (1995)
9. Pawar N.J., Geochemistry of carbonate precipitation from
the grounwaters in basaltic aquifers, An equilibrium
thermodynamic approach, Jour. Geol. Soc. India, 41,
119–131 (1993)
10. Raju K.C.B., Importance of recharging depleted aquifers,
State of the art of artificial recharge in India., Jour. Geol.
Soc. India, 51, 429–454 (1998)
11. Som. S.K. and Bhattacharya A.K., Groundwater
geochemistry of recent weathering at Panchpatmali
bauxite bearing plateau, Koraput district, Orissa., Jour.
Geol. Soc. India, 40, 453–461 (1992)
12. Swaine S. and Schneider P.J., The chemistry of surface
water in prairie ponds, Am. Chem. Soc. Adv. Chem. Ser.,

International Research Journal of Earth Sciences____________________________________________________ ISSN 2321–2527
Vol. 2(10), 8-15, November (2014) Int. Res. J. Earth Sci.
International Science Congress Association 15
106, 99–104 (1971)
13. Wicks C.M. and Herman J.S., The effect of a confining
unit on the geochemical evolution of groundwater in the
Upper Floridan aquifer system, Jour. Hydrology, 153,
139–155 (1994)
14. Baker Thomas R. and Case Steven B., Let GIS be your
guide, The Science Teacher, 67(7), 24-26,
http://kangis.org/ learning/publications/ science_teacher/
print/tst 0010_24. Pdf, (2000)
15. Longley Paul A., The academic success of GIS in
geography: Problems and prospects, Journal of
Geographical Systems, 2(1), 37–42 (2000)
16. Openshaw S.A., view on the crisis in geography, or using
GIS to put humpty-dumpty back together again,
Environment and Planning, 23(5), 621-628 (1991)
17. Saraf A.K., Gupta R.P., Jain R.K. and Srivastava N.K.,
GIS based processing and interpretation of ground water
quality data, Proceedings of Regional workshop on
Environmental Aspects of Ground water Development,
17-19, Kurukshetra, India, (1994)
18. Volgel A.I., A Text Book of Quantitative Inorganic
Analysis including Elementary Instrumental Analysis. 3rd
Edn., Elbs/Longman, 121 (1968)
19. Apha (American Public Health Association) Standard
methods for the Examination of water and wastewater,
19th eds. Public Health Association, Washington, DC,
(1996)
20. WHO, Guideline for drinking water quality. Vol.1.
Recommendation, WHO, Genero, 1-4 (2010)
21. Raghunath H.M., Ground Water. 2nd
ed. New Age
International (P) Limited, Publishers, New Delhi, (1987)