using building simulation to create marginal abatement cost curves … · using building simulation...
TRANSCRIPT

USING BUILDING SIMULATION TO CREATEMARGINAL ABATEMENT COST CURVES OF INDIVIDUAL BUILDINGS
Adam Rysanek, Ruchi ChoudharyEnergy Efficient Cities initative (EECi), Department of Engineering
University of CambridgeCambridge, United Kingdom
ABSTRACTThis paper explores a technique for generatingmarginal abatement cost curves for individual build-ings. It makes use of sequential optimisation andexhaustive search of building refurbishment optionsbased on a custom building energy model developedpreviously by the authors.
INTRODUCTIONIn the energy efficiency and carbon-reduction sectors,there have been long-standing and well-studied driversand barriers to investments in building retrofit projects(Urge Vorsatz et al., 2009). It was also towards theend of the last decade that widespread building refur-bishments were becoming one of the more prominentfocus areas of government actions in these sectors, par-ticularly in Europe and North America (EU, 2010; TheWhite House; Office of the Press Secretary, 2011).This momentum has only recently been tempered bythe realities of the post-Kyoto, post-Copenhagen, andpost-financial crisis world. Though energy costs andemissions have continued to increase in many coun-tries, adding to the long-term financial drivers forretrofits, so too have building owners’ and investors’fears of short-term risks and low rates of returns.
Some of these risks also rest on the shoulders of con-sulting companies and retrofit providers. These enti-ties are tasked with soliciting consumers (e.g., build-ing owners) who may request preliminary assessmentsto be undertaken for very little, or negligible, initialcosts. Responding to this, a consulting engineer mustbalance the cost of providing analysis to the prospec-tive client against the intrinsic value of that analysis.In other words, does it warrant an engineer to spendconsiderable time modelling a building if there is lim-ited chance that the client will continue pursuit of theproject? Does it warrant the engineer to spend lit-tle time in developing simple recommendations, giventhat the client may feel considerable analysis is re-quired to alleviate his/her perceived risks? Acknowl-edging that this a complex issue, and not completelyaddressable by a single discipline or paper, this partic-ular study proposes only a partial solution to the infor-mation cost barrier. We suggest that building-tailoredmarginal abatement cost curves (MACCs) may be auseful way to visualize investment costs/benefits at
early project design stages. We also suggest that exist-ing dynamic building simulation tools can be adaptedto generate optimised MACCs in a relatively shorttime-frame. Whilst the focus here will be principallyon non-domestic buildings, the discussed methodol-ogy is applicable to domestic buildings as well.
MARGINAL COST CURVESFOR BUILDING RETROFITSThe combined modelling of the cost and GHG-mitigation potential of building technologies is nolonger an emerging field. In addition to being a spe-cialized practise in the consulting sector, it has alsobeen taken-up by governments seeking macro-levelanalyses of building stocks (Weiner, 2009), by variousinternational organizations (OECD/IEA, 2009), and -of course - by the research community at large (Har-vey, 2009; Urge Vorsatz and Novikova, 2006; Mar-nay et al., 2007; Anderson et al., 2006; Ren and Gao,2010)1. In the UK, one of the most visible outputsof macro-level studies has been the marginal abate-ment cost curve for the reduction of GHG emissions inthe country’s entire domestic and non-domestic build-ings stocks (Pye et al., 2008). Illustrated in figure 1for the non-domestic building stock, the MACC de-picts the total, national-level GHG mitigation poten-tial of key emissions-reduction measures against theirmarginal abatement cost (£ per tonne-CO2 saved).Negative costs reflect positive returns-on-investmentand are thus the most favourable technologies to sup-port.
The MACC in figure 1 also seemingly depicts thecost and GHG-mitigation potential of a large num-ber of technologies in a very simple format, relevantparticularly for policy-makers. Using such a curve,analysts can presumably assess the approximate soci-etal costs of meeting carbon reduction targets as wellas provide benchmarking for carbon pricing schemes.They can identify which measures work best towardsachieving a set target (e.g., emissions reductions) andwhich measures may require further financial incen-tives. For similar reasons, a MACC developed at theindividual building-level may be helpful during initialretrofit planning stages. Just as a policy-maker woulddo so, individual building managers could use a tai-lored MACC to pinpoint the specific retrofit measures
1These are only to name a few. The authors recognize many others have contributed to this field but cannot all be named here.
Proceedings of BS2013: 13th Conference of International Building Performance Simulation Association, Chambéry, France, August 26-28
- 1877 -

Figure 1: Marginal GHG abatement cost curve of the UK’s non-domestic buildings sector, 2008 data, 20 year timehorizon (Produced by Committee on Climate Change (Weiner, 2009))
that would meet targeted investment returns and GHGemissions reductions. In addition, a MACC wouldshow the decision-maker the potential impacts of pur-suing more or less ambitious interventions, a particu-larly useful feature. So far, there seems little evidenceof MACCs being developed and used effectively forsuch purposes.
This may be due particularly to one factor. As willbe discussed in the following sections, generating atrue MACC requires extensive engineering modellingof numerous retrofit options as well as cost optimiza-tion to some degree. It is only recently that advances inbuilding simulation optimizers and reductions in com-putational costs have made this feasible. It is also theresult of this issue that existing methodologies for de-vising macro-level MACCs, which pre-date these re-cent advances, have required far-reaching engineeringand cost assumptions that would not be appropriate fora single building study (Weiner, 2009).
GENERATING TRUE MARGINAL COSTCURVES: AN OPTIMIZATION PROBLEMIn this work, we distinguish between the creation of- what we call - true and illustrative marginal abate-ment cost curves. For a discrete decisions problem,true MACCs are created by sequential optimisation ofeach step along a curve, as depicted by the example infigure 2. Starting from the zero-investment point, eachstep reflects the least-cost additional measure whencombined with all preceding steps. The depicted costsfrom this process are truly marginal because their ad-ditionality to prior measures is explicitly considered.
The figure also provides some explanation as to whysuch MACCs require larger simulation datasets to con-struct; one may need the modelling capability to sim-ulate nearly all combinations of retrofit measures.Illustrative MACCs differ in that they simplify inter-actions between measures in order to circumvent anyrequirement for large-scale optimisation and/or phys-ical simulation. The UK MACCs, such as the oneshown previously in figure 1, are an example of suchcurves. They were developed by assuming that theaccepted marginal abatement cost of each plausibleretrofit measure would be the most pessimistic valueof two cases: 1) when no other measures would beinstalled; or 2) when all other measures would be in-stalled. Because the additionality of measures alongthe MACC is not explicitly assessed, the costs andGHG mitigation potentials on such curves cannot beconsidered truly marginal.
TARGET-ORIENTED MARGINAL COSTCURVES
Whilst the true MACC of figure 2 may be more accu-rate than any illustrative MACC, it may not be sensi-ble, from the retrofit decision-maker’s point of view,to generate a true MACC in such a manner only. Gen-erating a MACC without establishing key investmenttargets, or economic constraints, may be either unwiseor ineffective. For instance, an investor may be princi-pally concerned with determining the best retrofit op-tion2 which meets some pre-established capital costconstraints and energy- or cost-reduction targets. Thebest (or optimum) option to achieve these goals may
2a combination of one or more measures
Proceedings of BS2013: 13th Conference of International Building Performance Simulation Association, Chambéry, France, August 26-28
- 1878 -

Step (1): Energy-efficient lighting
Step (2):(1) + draught-proofing
Path to individual retrofit measures (e.g., particular demand -side measures or energy supply systems)
Chosen measure (1) + path to additional measure
Chosen measures (1) + (2) + path to additional measure
Accepted steps of marginal cost curve
Marg
ina
l ab
ate
men
t co
st
(£/t
on
-CO
2)
GHG emissions reduction potential (%)
LegendOrigin (0)No investment made+ve
-ve
Figure 2: Process of creating true marginal abatement curves through sequential optimisation
`
Step (-1): (0) - CHP
Origin (0)Chosen 'global optimum' investment option
Path to chosen 'optimum' retrofit option minus an individual measure
Path to: chosen measures (1) + (2) + additional retrofit measure
Accepted steps of marginal cost curve
Marg
ina
l ab
ate
men
t co
st
(£/t
on
-CO
2)
GHG emissions reduction potential (%)
Legend
Step (-2): (0) - (1) - Energy-efficient lighting fixtures
Step (1): (0) + ASHP
Path to chosen 'optimum' retrofit option plus an individual measure
Candidate retrofit option
+ve
-ve
Figure 3: Process of creating true marginal abatement curves based on known targets
not necessarily include retrofit measures that would beidentified using the sequential process described aboveand shown in figure 2.
The reason for this stems largely from the technicalinteractions between various retrofit measures. Forinstance, one may estimate that retrofitting a partic-ular building’s lighting fixtures with more efficientequipment would be a good individual measure from acost perspective, though maybe not the best. Perhapsdraught-proofing would be predicted as the single-bestretrofit measure. However, one of the technical im-pacts of both measures - though to differing degrees -would be a change to the building’s transient ratio ofheating-to-electricity demand. This would impact thefeasibility of a co-generation energy supply system,for better or worse. It could turn out, for instance, thata CHP system, when combined with energy-efficientlighting fixtures, would be more cost-effective thanany option which includes draught-proofing.
Given this possibility, we propose an alternative ap-proach to generating a MACC for constrained opti-misation problems. Shown in figure 3, the processstarts by first determining the best retrofit option that
would meet the decision-maker’s targets and then es-tablishing this option as the origin data point of theMACC. Upon this step, the downstream and upstreamportions of the cost curve would be found by removingand adding installed measures, repeating the sequen-tial search process described earlier. The output curvewould illustrate the marginal contribution of all retrofitmeasures required to meet the target, and would allowthe decision-maker to view the impact of investing inmeasures beyond the target.
We will explore in the following sections how the var-ious types of MACCs discussed in this paper compareto one another for a single building.
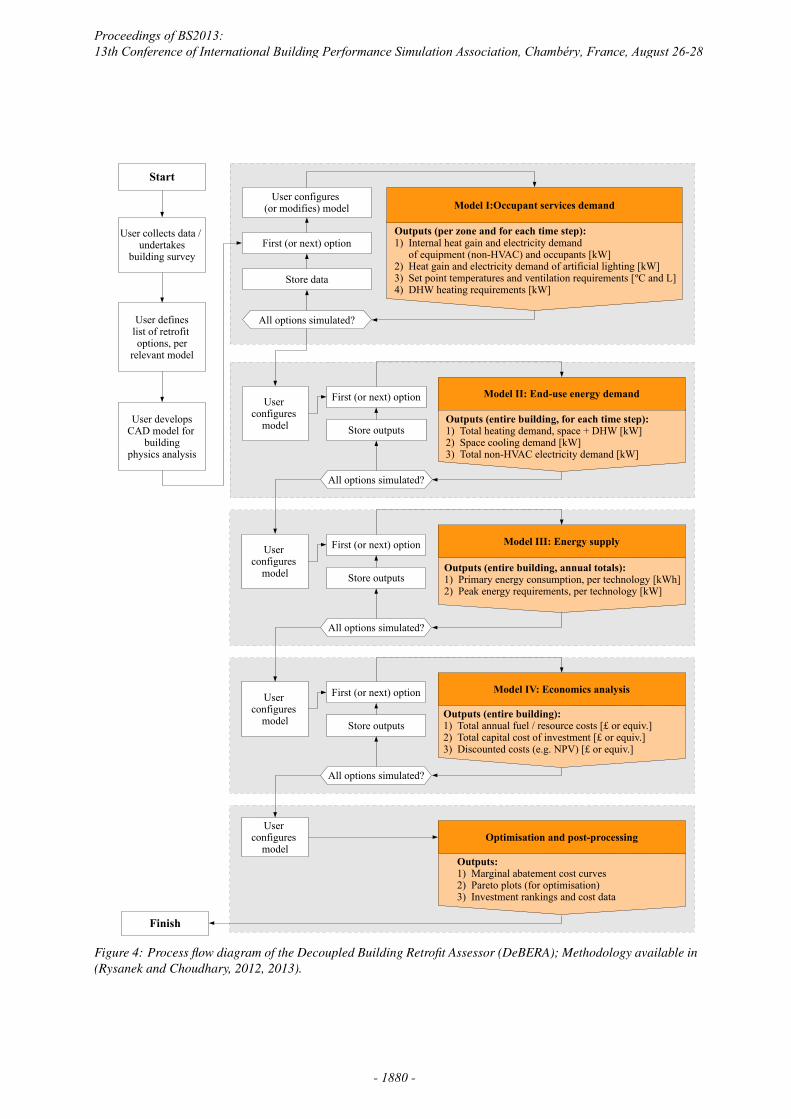
ENGINEERING AND COSTOPTIMISATION MODELThe energy and cost modelling undertaken for this pa-per has been done using the Decoupled Building En-ergy Retrofit Assessor (DeBERA), developed previ-ously by the authors (Rysanek and Choudhary, 2012,2013). The tool represents a set of sequential mod-els designed to exhaustively simulate building retrofitoptions using dynamic building simulation software.
Proceedings of BS2013: 13th Conference of International Building Performance Simulation Association, Chambéry, France, August 26-28
- 1879 -
Model I:Occupant services demand
Outputs (per zone and for each time step):1) Internal heat gain and electricity demand
of equipment (non-HVAC) and occupants [kW]2) Heat gain and electricity demand of artificial lighting [kW]3) Set point temperatures and ventilation requirements [ºC and L]4) DHW heating requirements [kW]
Outputs (entire building, for each time step):1) Total heating demand, space + DHW [kW]2) Space cooling demand [kW]3) Total non-HVAC electricity demand [kW]
First (or next) option
Store data
All options simulated?User defineslist of retrofit options, per
relevant model
User developsCAD model for
buildingphysics analysis
User configures
model
User collects data / undertakes
building survey
User configures (or modifies) model
First (or next) option
Store outputs
All options simulated?
Model II: End-use energy demand
User configures
model
First (or next) option
Store outputs
All options simulated?
Model III: Energy supply
User configures
model
First (or next) option
Store outputs
All options simulated?
Model IV: Economics analysis
User configures
modelOptimisation and post-processing
Start
Finish
Outputs (entire building, annual totals):1) Primary energy consumption, per technology [kWh]2) Peak energy requirements, per technology [kW]
Outputs (entire building):1) Total annual fuel / resource costs [£ or equiv.]2) Total capital cost of investment [£ or equiv.]3) Discounted costs (e.g. NPV) [£ or equiv.]
Outputs:1) Marginal abatement cost curves2) Pareto plots (for optimisation)3) Investment rankings and cost data
Figure 4: Process flow diagram of the Decoupled Building Retrofit Assessor (DeBERA); Methodology available in(Rysanek and Choudhary, 2012, 2013).
Proceedings of BS2013: 13th Conference of International Building Performance Simulation Association, Chambéry, France, August 26-28
- 1880 -

The tool separates the simulation of occupant be-haviour, energy supply, and economics from the con-ventional building energy modelling environment, es-sentially reducing the number of simulation runs re-quired by the multi-zone building physics engine (themost computational expensive component of the sim-ulation process). A simulation flow diagram for De-BERA is provided in figure 4. DeBERA’s develop-ment has been greatly influenced by a number of otherresearch projects which have explored simulation andeconomic optimisation of building retrofit and designoptions in a similar manner. We highlight particularlythe work of Horowitz et al. (2008) and their develop-ment of the BEopt and Opt-E-Plus packages.
EXAMPLE OF BUILDING-TAILOREDMARGINAL COST CURVESIn the following pages, we will illustrate varioustypes of MACCs generated for a particular, real-worldbuilding. The building, representing an ageing non-domestic office building in the UK, is described in ta-ble 1 and is depicted in its model format in figure 5.
Candidate refurbishment measuresA selection of candidate refurbishment measures isisolated and presented in table 2. Approximate costsare also shown, having been estimated from relatedliterature and heuristic data sources, see (Rysanek andChoudhary, 2013).
Economic conditionsThe retrofit analysis, which will examine thecost/benefits of all feasible combinations of retrofitmeasures, is governed by a set of economic conditionswhich are outlined in table 3.
ResultsFrom the 15 candidate retrofit measures defined intable 2, approximately 38,000 combinations of mea-sures are deemed feasible by the DeBERA model.With each combination, or option, carrying a uniquemarginal abatement cost and GHG mitigation poten-tial, a scatter of the data - illustrated in figure 6 - de-picts the range of values obtainable.
There can be numerous ways to parse the data pre-sented in figure 6. As we aim in this paper to com-pare various techniques for constructing MACCs outof building simulation data, we begin by depicting therepresentative illustrative MACC of the given dataset.This is shown in figure 9, where the costs and GHGmitigation potentials of each measure have been as-sessed in isolation - ignoring any interactions withneighbouring measures. Carrying on, in figure 7, wedepict the corresponding true MACC of the dataset,based on a sequential search of measures starting fromthe zero-investment point (see figure 2).
Figure 8 illustrates the effect of generating MACCsoutward from an established target, as shown earlier
by the process given in figure 3. Figure 8 depicts theleast-cost pathway towards the retrofit option with thegreatest GHG mitigation potential overall.
!"#$#%&'()*#'+#%$ ,$$"-$&.-(/0%#%$(01(2#3#'&"("0032
Figure 5: Representative TRNSYS3D model of studybuilding
Table 1: Description of building and existing systems
CharacteristicConstruction date: Between 1960-1961Number of floors: FourTotal occupied floor area: 3,265 m2
Building type: Mixed-use office building, with approx-imately 85 private office, 3 lecture rooms, one computerlaboratory, a small cafeteria and library, meeting roomsand various IT/administrative areas.Existing HVAC: Heating only, with centrally-controlled LTHW radiator system. A high-efficiencynon-condensing boiler was installed in the late 1990s.Building fabric: Limited insulation throughout, as peroriginal construction; single-pane metal-framed glazingwithout weather-stripping.Lighting: T8 fluorescent lighting is installed through-out, with manual control only. Public corridor lightingis left on usually 24/7.Occupancy habits: Occupants work typical weekdayhours, with modest overtime. Approximately 50% ofcomputing equipment is left switched on 24/7.
Table 3: Economic conditions and constraints to anal-ysis
Measure and descriptionEnergy prices: ’Pessimistic’ energy price projections,as set out in Rysanek and Choudhary Tariffs: Constantcarbon tarriff of £12 / ton-CO2
Subsidies: Via the UK Feed-in Tarriffs and RenewableHeat Incentives, a subsidy of £0.026/kWh is providedfor thermal energy delivered by biomass and £0.13/kWhfor solar PVO&M costs: Included, as set out in Rysanek andChoudhary (2013)Investment time horizon: 10 years (2012-2022)Discount rate: 6%Service life of retrofit measures: We assume the ser-vice life of all new equipment to be greater than 10 years
DISCUSSIONThe illustration of MACCs in figures 7 to 9 provide aninteresting perspective on the relevant costs and im-
Proceedings of BS2013: 13th Conference of International Building Performance Simulation Association, Chambéry, France, August 26-28
- 1881 -

Least-cost MACC:
1. CHP2. eTRVs 3. Voltage optimisation4. T8 to T5 conversion5. Refrigerator upgrade6. PIR sensors7. Draught-proofing8. Condensing boiler9. Glazing upgrade10. Solar PV
1. PIR sensors2. T8 to T5 conversion3. Refrigerator upgrade4. Voltage optimisation5. Draught-proofing6. eTRVs7. Glazing upgrade8. Biomass boiler9. Solar PV
1,2
4,5,6,7
8
10
9Bottom-up and maximum abatement MACCs
7
2,3,4,5,6
8
9
Demand-side measures, including possibly solar PV (DSM)
DSM and CHP
DSM, CHP, and Condensing boilerDSM and Condensing boiler
DSM and ASHPDSM, CHP, and ASHP
DSM and Biomass boilerDSM, CHP, and Biomass boiler
Retrofit key (legend for scatter plot)
1 3
Figure 6: Comparison of chosen, true MACC pathways against scatter plot of all simulated options
CHP
Voltage optimisation
eTRVs
Refrigerators upgrade
T8 to T5 conversion
Draught-proofing
Condensing boiler
Glazing upgrade
Solar PV
Facade upgrade (past £500 / ton-CO
2)
PIR sensors
Figure 7: True marginal abatement cost curve, whether starting from no-investment or from option with maximumGHG abatement
Refrigerators upgrade
Voltage optimisation
Draught-proofing
eTRVs
PIR sensors
Glazing upgradeSolar PV
T8 to T5conversion
Biomass boiler
Figure 8: True marginal abatement cost curve, based on option with greatest GHG mitigation potential under £0/ton-CO2
Proceedings of BS2013: 13th Conference of International Building Performance Simulation Association, Chambéry, France, August 26-28
- 1882 -

Table 2: Candidate refurbishment measures
Measure Description CostPIR sensors Install PIR sensors in public areas £5,000T8 to T5 Convert all T8 lighting fixtures to T5 high ballasts £14,000Refrigeration Upgrade all servery food refrigeration units with high-efficiency appliances £4,000Centralize IT Create single, central facility for document printing and photocopying £3,000Replace roof Decreases roof U-value from 1.1 W/m2K to 0.22 W/m2K £80,000Replace glazing Decreases glazing U-value from 5.7 W/m2K to 1.4 W/m2K £150,000Refurbish facade Decrease external wall U-value form 0.77 W/m2K to 0.35 W/m2K £500,000eTRVs Adapt all building radiators with electronically-regulated TRVs, providing zone
heating control£18,000
Draught-proof Inspect build air leakages and apply weather-stripping where needed £10,000Boiler Maintain existing high-efficiency boiler -Biomass Install biomass pellets boiler with automatic feeder £420/kWCondens. boiler Install condensing boiler £90/kWCHP Install small-scale co-generation plant without thermal storage £350/kWASHP Install air-source heat pump £250/kWSolar Install 35-kW rooftop solar photovoltaic system £4000/kW
Voltage optimisation
Draught-proofing
Solar PV (£1,640 / ton-CO
2)
CHP
Glazing upgrade
Condensing boiler
PIR sensors
Biomass boiler
T8 to T5 lighting conversion
Centralize IT
Facade upgrade (£5,260 / ton-CO
2)
Draught-proofing
'Least-cost' MACC
'Best-mitigation' MACC
Figure 9: Illustrative marginal abatement cost curve (no technical interactions between measures
pacts of retrofit measures in achieving particular de-carbonisation targets. Whilst it was expected to seethe illustrative MACC differing greatly from the truecost curves - due to the lack of incorporating technol-ogy interactions between measures - the differencesamongst the various true curves are more striking. Forinstance, whilst combined heat-and-power (CHP) isidentified to be the least-cost measure in figure 7, itis interesting that combining CHP with eTRVS wouldprovide greater cost savings than both in isolation (seefigure 9, for which eTRVs are not even considered aGHG-saving measure in isolation). This is likely dueto the effect eTRVs would have on transient thermalenergy demand, making the building’s ratio of heating-to-electricity demand more favourable for CHP appli-cations. We also see in the true MACCs that cost sav-ings attributed to low-hanging fruit can be put towardsmore expensive carbon reduction measures. This sug-gests that, when examining multiple retrofit options
and including the effects of technology interactions,one may better identify deeper energy and GHG emis-sions savings. Granted, we have not examined the ef-fect of high capital costs - and the access to capital -as a barrier to investment, nor other similar barriers inthis study.Overall, two discussion points emerge from these ini-tial examples of building-tailored MACCs. The firstpoint refers to the relevance of using a single MACCfor any type of cost analysis. It was shown that,for one building alone, there can be multiple possiblepathways to reducing GHG emissions cost-effectively.Two different true MACCs were produced to showthis, though many more could have been generatedhad we introduced further sets of investment targetsand constraints. The second point refers to the valueof MACCs generated from detailed building simula-tions. Figure 9 showed the creation of an illustrativeMACC based on a similar methodology to that used
Proceedings of BS2013: 13th Conference of International Building Performance Simulation Association, Chambéry, France, August 26-28
- 1883 -

by the CCC/BRE/AEA in their generation of MACCsfor the UK building-stock3. When compared to thetrue MACCs generated in this study, there is a strikingdifference between all results; the true MACCs corre-late poorly to the illustrative MACC depicted. Whilstthis information relates only to a single building ver-sus an entire building stock, it suggests that one wouldbe ill-advised to explicitly ignore the technology in-teractions of retrofit measures when generating suchMACCs.
CONCLUSIONSIn a simple study, we have illustrated how there canexist multiple technology pathways for meeting deepenergy and emissions reduction targets in buildings.What we hope has been particularly highlighted in thispaper is the value of constructing marginal abatementcost curves using methodologies which explicitly con-sider both engineering interactions between refurbish-ment measures and the impact of long-term economictargets or constraints.
REFERENCESAnderson, R., Christensen, C., and Horowitz, S.
2006. Analysis of residential system strategies tar-geting least-cost solutions leading to net zero energyhomes. ASHRAE Transactions, 112(Part 2:330–341.
EU 2010. Directive 2010/31/EU of the European Par-liament and of the Council of 19 May 2010 on theenergy performance of buildings. Official Journalof the European Union, L153(13).
Harvey, L. 2009. Reducing energy use in the build-ings sector: measures, costs, and examples. EnergyEfficiency, 2(2):139–163.
Horowitz, S., Christensen, C., Brandemuehl, M., andKrarti, M. 2008. An enhanced sequential searchmethodology for identifying cost-optimal buildingpathways. In Simbuild 2008 Conference, Berkeley,CA, USA. International Building Performance Sim-ulation Association.
Marnay, C., Venkataramanan, G., Stadler, M., Sid-diqui, A., Firestone, R., and Chandran, B. 2007.Optimal Technology Selection and Operation ofCommercial-Building Microgrids. In IEEE Trans-actions on Power Systems, IEEE 2007 PES GeneralMeeting, Tampa, Florida. IEEE.
OECD/IEA 2009. World Energy Outlook 2009. Inter-national Energy Agency, Paris, France.
Pye, S., Fletcher, K., Gardiner, A., Angelini, T.,Greenleaf, J., Wiley, T., and Haydock, H. 2008. Re-view and update of UK abatement costs curves forthe industrial, domestic and non-domestic sectors.
Number 3. ED43333, Issue 3, AEA Energy & Envi-ronment, Didcot, UK.
Ren, H. and Gao, W. 2010. A MILP model for in-tegrated plan and evaluation of distributed energysystems. Applied Energy, 87(3):1001–1014.
Rysanek, A. and Choudhary, R. 2012. A decoupledwhole-building simulation engine for rapid exhaus-tive search of low-carbon and low-energy buildingrefurbishment options. Building and Environment,50(0):21–33.
Rysanek, A. and Choudhary, R. 2013. Optimum build-ing energy retrofits under technical and economicuncertainty. Energy and Buildings, 57:324–337.
The White House; Office of the Press Secretary 2011.President Announces Nearly $4 Billion in Publicand Private Investments in Building Upgrades asPart of Better Buildings Initiative [Press Release].
Urge Vorsatz, D. and Novikova, A. 2006. Opportu-nities and costs of carbon dioxide mitigation in theworlds domestic sector. In International Energy Ef-ficiency in Domestic Appliances and Lighting Con-ference 2006, London, UK.
Urge Vorsatz, D., Novikova, A., Koppel, S., and Boza-Kiss, B. 2009. Bottom up assessment of potentialsand costs of CO2 emission mitigation in the build-ings sector: insights into the missing elements. En-ergy Efficiency, 2(4):293–316.
Weiner, M. 2009. Energy use in buildings and indus-try: Technical appendix. Technical report, Commit-tee on Climate Change.
3see figure 1
Proceedings of BS2013: 13th Conference of International Building Performance Simulation Association, Chambéry, France, August 26-28
- 1884 -