review and update of uk marginal abatement cost curves for
TRANSCRIPT

1
Review and update of UK marginal abatement cost curves for agriculture
Final report Date: 17/8/2010 Prepared for: The Committee on Climate Change Michael MacLeod
a, Dominic Moran
a, Alistair McVittie
a, Bob Rees
a, Glyn Jones
b, David Harris
b, Steve
Antonyb, Eileen Wall
a, Vera Eory
a, Andrew Barnes
a, Kairsty Topp
a, Bruce Ball
a, Steve Hoad
a and Lel
Eoryc
a. SAC, Edinburgh b. ADAS UK Ltd, Wolverhampton c. University of Edinburgh

2
Acknowledgments The authors would like to thank Kavita Srinivasan and Mike Thompson of the Committee on Climate Change and Mario Deconti (Defra) and Michael Zand (Scottish Government) for their help throughout this project. We would also like to thank the Climate Change Task Force for their comments. Finally, we would like to thank the experts who attended the Workshop in March 2010 and also those who generously provided their insights in other ways.

3
Executive Summary The UK is committed to significant greenhouse gas mitigation targets and most sectors of the economy are expected to play a role. The process of analysing and recommending how these commitments should be met has been handed to the Committee on Climate Change (CCC), which has adopted a bottom-up marginal abatement cost curve (MACC) approach to help set realistic budgets. The MACC details abatement potentials from a suite of technically feasible mitigation measures and defines their relative cost-effectiveness. The use of a reference carbon price allows measures to be considered from a notional cost-benefit perspective and provides a threshold for defining an efficient budget (i.e. those measures delivering mitigation at a unit cost less than the chosen reference price). In December 2008, the CCC published the results of its commissioned project that developed MACCs for the agriculture, land use, and land use change (ALULUCF) sectors. The MACCs identified 17.5 MtCO2e in abatement potential by 2020 at a carbon price of up to £100/tCO2e under a Maximum Technical Potential scenario.
1
The exercise also led to the identification of uncertainties, which arise as a result of differing interpretations of the existing evidence, knowledge gaps in the underlying science and limitations in terms of our understanding of some baselines. The assumptions made in the light of these uncertainties can alter the MACC, so one of the main aims of this project was to improve our understanding of the uncertainties, by addressing questions such as: what effect do different assumptions have on the shape of the MACCs?; what are the ranges for key variables?; which areas of uncertainty could and/or should be addressed as a matter of priority? The purpose of this report is to revisit the initial MACCs and revise them in light of emerging evidence. Since the publication of the initial MACCs, two formal reviews have been undertaken, and a significant amount of feedback received on the work from Government and industry. In addition, further evidence (e.g. on the costs of anaerobic digestion) has been identified. This revision is structured around four tasks:
1. Development of an updated view of previous MACC analysis; 2. Setting out a timeline for implementation of abatement options and the actions needed to facilitate
uptake; 3. Characterisation of abatement potential and options for agriculture during the 4
th budget period
(2023-2027); 4. Assessment of potential economic and land-use impacts of abatement.
Tasks 2-4 are informed by the development of task 1, which comprises a range of activities to improve current MACC assumptions, specifically:
1a Reviewing assumptions on the abatement potentials of existing and new measures; 1b Refining cost information, including compliance and enforcement costs; 1c Reviewing options for refining measure interactions; 1d Identifying the applicability of abatement measures to specific farm types, sizes and locations.
Task 1a. Development of an updated view of previous MACC analysis: improving the evidence base and revising assumptions In order to identify areas of uncertainty, the analyses (conducted by ADAS and AEA) provided in the re-evaluation of the original MACCs were reviewed, along with other feedback received on the initial MACC
1 Moran, et. al, (2008) UK Marginal Abatement Cost Curves for the Agriculture and Land Use, Land-Use Change and

4
assumptions.2 The areas of uncertainty were then defined in terms of (a) the precise nature of the
uncertainty, and (b) the origins of the uncertainty (e.g. MACC methodology; lack of understanding of specific processes; conflicting evidence; lack of baseline data etc.) and their importance (in terms of their influence on the MACC curves) ranked. Three activities were used to explore the uncertainties:
One-to-one consultation with experts on specific points;
An expert meeting;
A short survey.
A series of revisions were made to the original assumptions based on the findings of these activities. The MACCs were then recalculated using the revised assumptions and a new approach to interactions. In order to reflect the uncertainty, two new MACCs were developed, a pessimistic MACC and an optimistic MACC. The assumptions used to define these are given in Table E1. Table E1. Assumptions used in the optimistic and pessimistic MACCs
Optimistic MACC Pessimistic MACC
Higher estimate of area of applicability Lower estimate of area of applicability
Higher estimate of abatement rate Lower estimate of abatement rate
Lower estimate of cost Higher estimate of cost
Results The results of the revised MACCs and the original MACCs are given in Table E2, and for the devolved administrations in Table E3. A detailed explanation of revisions to the MACCs can be found in Table 2.1 and a description of MACC mitigation measures can be found in Appendix J. Table E2. Comparison of the abatement potential for measures costing <£100/tCO2e
3 (all maximum
technical potential, 2022, private discount rate, excl. forestry)
MACC Abatement Potential (MtCO2e)
MACC1 17.5
MACC2 - Optimistic 18.9
MACC2 - Pessimistic 8.6
Original MACC vs. optimistic revised MACC The abatement potential (AP) achievable for less than £100/tCO2e for the optimistic MACC2 in 2022 is 1.4 MtCO2e or 8% more than the original MACC, primarily due to the improved cost-effectiveness of nitrification inhibitors and species introduction, which moves them onto the MACC at <£100t. These increases were offset by a reduction in the AP of the following measures: organic N timing; taking full account of manure N; and avoiding N excess. The AP of improving mineral N timing and improving dairy productivity were also reduced, but to a lesser extent. Four of the AD measures move from <£100/t to >£100/t on the revised MACC due to revisions to the AD cost assumptions.
2 Harris, D., Glyn Jones, John Elliott, John Williams, Brian Chambers, Roy Dyer, Carolyn George, Rocio Salado, Bob
Crabtree (2009) RMP/5142 Analysis of Policy Instruments for Reducing Greenhouse Gas Emissions from Agriculture, Forestry and Land Management Wolverhampton: ADAS; AEA (2009) Unpublished Review of the SAC MACC Undertaken for Defra
3 In principle, only abatement costing less than the price of carbon is economically efficient. The central estimate of
the price of carbon for the non-traded sector was £52/tCO2e in 2010, rising to £60tCO2e by 2020 (DECC, 2009), however using this as the threshold risks excluding abatement that costs more than this at the moment, but could become cheaper by 2022. In order to avoid this, a higher notional threshold of £100 per tCO2e was used.

5
Original MACC vs. pessimistic revised MACC The AP achievable for less than £100/tCO2e for the pessimistic MACC2 in 2022 is 8.9 MtCO2e, or 50% lower than the original MACC. This is due primarily due to (a) the reduced cost-effectiveness of ionophores, improved drainage, improved N use plants and making full allowance of manure N, which do not appear on the pessimistic MACC at <£100/t, and (b) a reduction in the AP of the following measures:
Crops-Soils-MineralNTiming
Crops-Soils-OrganicNTiming
Crops-Soils-AvoidNExcess
DairyAn-ImprovedProductivity These reductions are offset to an extent by some large increases in the abatement potential from propionate precursors and species introduction. Pessimistic MACC vs. optimistic MACC The AP achievable for <£100/tCO2e for the pessimistic MACC2 is approximately 10.3 MtCO2e or 54% lower than the optimistic MACC. The smaller abatement in the pessimistic MACC is largely a result of the removal of the following measures from the pessimistic MACC (at <£100/t):
Crops-Soils-ImprovedN-UsePlants
Crops-Soils-Drainage
DairyAn-Ionophores
Crops-Soils-FullManure
Crops-Soils-Nitrification inhibitors
In addition, there are significant reductions in the AP of the following measures that remain on the pessimistic MACC:
Crops-Soils-MineralNTiming
Crops-Soils-OrganicNTiming DairyAn-ImprovedFertility
DairyAn-ImprovedProductivity
Crops-Soils-AvoidNExcess This reduction in AP is partially offset by the introduction of propionate precursors, and an increase in the AP of species introduction. Devolved administrations and different carbon prices
4
The total pessimistic and optimistic abatement potential achievable for each of the devolved administrations is summarised in Table E3. The abatement potential is not proportional to the areas of agricultural land in each of the DAs but rather reflects regional variation in farming, for example the predominance of upland sheep farming in Scotland and Wales, and where few of the abatement measures on the MACC would be applicable.
5 There is a marked drop in the abatement potential at
£34/tCO2e and at £100/tCO2e as two important measures are forecast to cost between £34/t and £100/t: species introduction and nitrification inhibitors.
4 See DECC (2009), for an explanation of carbon prices in policy appraisal
5 Mitigation in upland sheep farming was not considered in the MACC analysis as it was thought likely to have a
relatively small abatement potential.

6
Table E3. Comparison of the abatement potential for measures costing <£100/tCO2e (all maximum technical potential, 2022, private discount rate, excl. forestry) for the devolved administrations
Abatement potential MtCO2e
England Scotland N. Ireland Wales UK
Pessimistic, <£40/tCO2e 3.8 0.8 0.6 0.6 5.8
Pessimistic, <£100/tCO2e 5.6 1.2 0.9 0.9 8.6
Optimistic, <£40/tCO2e 9.6 2.1 1.4 1.5 14.5
Optimistic, <£100/tCO2e 12.5 2.8 1.7 1.9 18.9
Task 1b Development of an updated view of previous MACC analysis: costs and compliance
The original cost assumptions were reviewed and revised where appropriate in task 1a. In task 1b a cost taxonomy was developed for each measure, and each measure was assessed in terms of ease of compliance and monitoring. The cost analysis in the MACCs was restricted to the private costs of the measures. There are four categories of costs and benefits that have, to a greater or lesser extent, been omitted from the quantitative analysis:
1. Policy costs elements not captured in the analysis; 2. Industry administrative costs (e.g. the costs of form filling, learning how to implement a measure,
learning how to comply, demonstrating compliance, etc.); 3. Government administrative costs (the cost of devising and implementing regulation, providing
incentive payments, monitoring and enforcing compliance etc.); 4. Ancillary costs and benefits (i.e. non-market effects).
A future area of research would be to recalculate the MACCs with these missing costs. Expanding the categories of costs to include important non-market effects could lead to different conclusions regarding the relative cost-effectiveness of the measures, and would identify potential synergies or conflicts between GHG policy and other government priorities. Task 1c Development of an updated view of previous MACC analysis: interactions In order to improve the approach to interactions three tasks were undertaken:
The original MACC approach to interactions was compared with an approach used in a previous Defra project to model diffuse pollutants (including GHGs) arising from agricultural activity (WQ0106 Module 6).
The original interactions factors were reviewed and revised.
The way in which interactions are calculated was refined.
The main improvement to the interactions approach in this analysis is a revision to the way in which interactions are taken into account. The method employed in the December 2008 MACC assessment significantly overestimated the extent to which certain mitigation measures interacted, and biased the results against measures that in reality apply to small areas of the UK, thus reducing the calculated abatement potential for certain measures. For example, the measure “making full allowance for manure N” has an abatement potential of 192ktCO2e using the revised interactions method, but only 68ktCO2e under the old method. The overall results using both methods are given in Table E4. Opportunities remain for significant improvements to interactions calculations, notably:
An improved understanding of which measures are likely to coincide;

7
Field scale trials to measure interactions between pairs and packages of methods;
Identification of cost interactions to avoid double counting of mitigation costs. Given the above, the current revised approach to interactions still likely underestimates AP and overestimates costs, however it can be viewed as a more robust estimate than the previous approach. Table E4. Comparison of AP using old and new interactions method
MACC (all maximum technical potential,
2022, private discount rate)
Abatement Potential for measures costing <£100/tCO2e (excl. forestry)
(MtCO2e)
Old interactions method New interactions method
MACC1 17.5 -
MACC2 – Optimistic 15.6 18.9
MACC2 – Pessimistic 5.7 8.6
Task 1d. Development of an updated view of previous MACC analysis: Farm specific analysis This assessment combined the mitigation measures across super regions, farm types and farm sizes to determine their applicability geographically and in terms of farming types. It found that measures are most applicable to larger farms (as measured by Standard Labour Requirements) and consequently the regions where the larger farms of each type are found. The analysis has also considered the applicability to farm type in the context of the UK as a whole. However it is important to note that the farm specific analysis has not been incorporated into MACC calculations due to a lack of data on farm specific baseline activity. Further research would be required to determine the extent to which measures are currently reflected in farm practices due to either existing policies or farm characteristics. Finally, it is worth noting that there appears to be as much variation within England, in terms of the applicability of measures, as there is between England and the other DAs. Task 2&3 Setting out a timeline (barriers) for measures and characterization of the abatement potential and options during the 4th budget (2023-2027) In this section timelines are developed for measures, drawing out key messages in terms of likely uptake subject to a range of barriers and constraints. The development of timelines provides an indication of the likely abatement potential for the fourth budget period. All measures can be assumed to operate within a regulatory environment that will influence the level of uptake and proportion of the MTP abatement. A broad distinction in terms of policy approaches can be made between scenarios involving:
Voluntary compliance with improved provision of education and information (Option 1);
Incentive based (though still voluntary) mechanisms working within current policy frameworks, e.g. via the Rural Development Regulation (Option 2);
Classic “command and control” regulation with enforcement of mandatory standards (Option 3);
Introduction of a market-based instrument (tradable permit or tax) (Option 4).
Broadly speaking, we characterise timelines affecting the proportion of MTP unlocked as:
Low: Arising from options 1 (education/advice) and 2 (providing incentives to adopt mitigation measure via the Rural Development Programme), which are the measures most likely to characterise the second budget period;
Medium: Options 1 and 2 and, where applicable, Option 3 (mandatory controls) we assume these can be used to characterise the third budget period;
High: Options 1 and 2 and, where applicable, 3 and 4 (market-based instruments) plus an ambitious assumption to account for research and technological development (RTD) payoff in the fourth budget period.

8
Results Figure E1 sets out the relevant estimates arising from our assumptions across the four carbon budgets and broken down by measure type.
Task 4 Assessment of potential economic and land-use impacts of abatement Implementation of measures may result in unforeseen economic and land-use impacts. The voluntary or mandatory implementation of measures identified in the MACC can be considered in a wider partial or general equilibrium context to identify potential impacts on input and output prices, supply of and demand for agricultural products (final and intermediate), and UK land use. These factors in turn have the potential to affect the competitiveness of UK agriculture. While it is stressed that a more thorough quantitative assessment requires more modelling that was beyond the scope of this project, the following wider economic and land-use impacts are tentatively identified:
Improved resource use efficiency;
New (domestic) business opportunities;
Capital investment burdens for marginal dairy farms;
International competitiveness – head-start in terms of development of new technologies;
No major land use issues – except overlap with National Ecosystem Assessment scenarios. The conclusions are largely positive for farmers, notwithstanding the caveats that (a) implementing higher cost measures could have some detrimental impacts on competitiveness and further work is necessary to simulate the impacts of farm constraints involving higher cost measures, and (b) the mandatory requirement for the implementation of some measures could imply some significant hidden learning costs and have an adverse financial impact on some marginal livestock.
882
1,3231,496
689
1,413
1,867
1,955
2,495
441
161
101
20
378
283
189277224
0
1,000
2,000
3,000
4,000
5,000
6,000
7,000
8,000
9,000
10,000
11,000
12,000
13,000
Abatement (ktCO2e) at <£100/t
Budget period and measures
Budget IV (2023-2027)
12,268
2,447
178
1,804
2,652
Budget III (2018-2022)
C&C regulat ion
9,630
2,163
416
1,344
1,891
Budget II (2012-2017)
Incentives
7,863
1,442
2771,120
1,891
Budget I (2008-2012)
Educ/advice
3,705
721
420
Diet manipulation
Livestock breeding
Manure management
AD
Using more N eff. Plants
Nitrification inhibitors
Soil management
Nutrient management
Figure E1. Abatement potential (achievable at <£100/t, optimistic assumptions) across budget periods

9
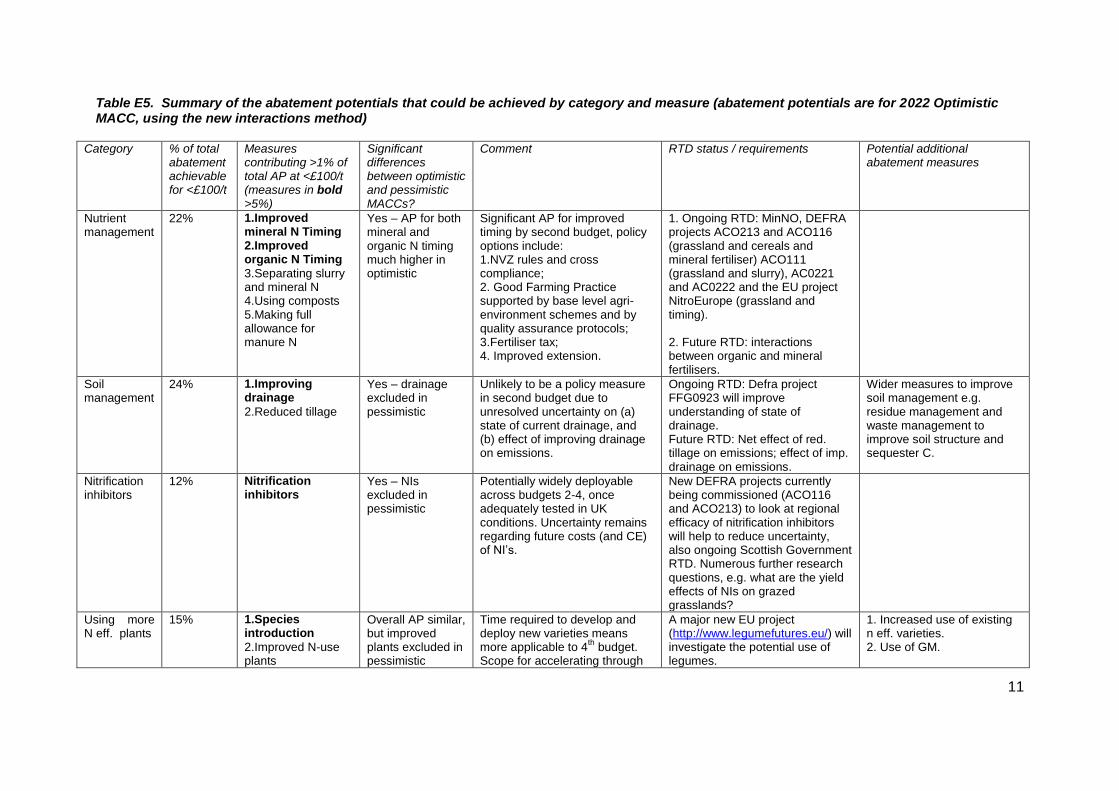
Overall conclusions The abatement potentials that could be achieved at <£100/t are shown in Figure E2, with the measures grouped into eight categories. This figure shows the importance of the assumptions (pessimistic or optimistic) in determining the overall abatement and the types of measures that are required to achieve the abatement. There are large differences between the optimistic and pessimistic abatements of nutrient management, soil management and nitrification inhibitors, illustrating the sensitivity of some measures within these categories to key assumptions. This is a crucial point. Pursuing additional technical potential, for example AP available in the optimistic relative to pessimistic MACC, may not be as straightforward as implementing stronger policies to support uptake. Many of the differences in estimates between the optimistic and pessimistic MACC reflect uncertainties about current baseline activity, or the extent to which farmers are already implementing MACC measures. There are also additional barriers to consider in pursuing uptake of certain measures, including the legality and consumer acceptance of certain measures (e.g. dietary additives). Table E5 highlights the measures that are required to achieve the calculated abatement levels and potential policies or RTD that could help realise some of this notional abatement. The following observations are made:
The abatement achievable for <£100/t on the revised optimistic MACC is slightly higher than the original MACC, but the pessimistic MACC is significantly lower. This shows the sensitivity of the results when different assumptions are made on key variables with uncertainties.
In many cases, reducing the uncertainty will require significant improvements to the evidence base; however there is scope for some of the uncertainty to be reduced in light of findings of ongoing/forthcoming RTD (see Section 8.2).
Accuracy could be significantly improved through the ongoing incorporation of emerging evidence, and the development of MACCs for specific combinations of farms types/location/etc.
The revised interactions method reduces the problem of overestimation of the extent to which measures applicable to small proportions of land will interact and thus reduces the previous bias that underestimated AP.
An assessment of the level of confidence in the abatement potential of the measures and remaining uncertainty is given in Table E6. Improvements in the evidence base in the updated MACC, and the following areas for future improvement are discussed:
1. Refinements to the MACC methodology; 2. Improving understanding of the effectiveness of policy to mitigate agricultural emissions; 3. Improving the accuracy of baselines; 4. Improving understanding of the abatement rates of specific mitigation measures; 5. identifying potential additional abatement

10
0
5,000
10,000
15,000
20,000
2017 - Pessimistic 2017 - Optimistic 2022 - Pessimistic 2022 - Optimistic
Abatement achievable for <£100/t for categories of measures (private discount rate, new interactions method)
ktCO2e
Soil management
Nitrification inhibitors
Using more N eff. Plants
AD
Manure management
Livestock breeding
Diet manipulation
Nutrient management
Figure E2. The abatement potentials that could be achieved by categories of measures at <£100/t
11
Table E5. Summary of the abatement potentials that could be achieved by category and measure (abatement potentials are for 2022 Optimistic MACC, using the new interactions method)
Category % of total abatement achievable for <£100/t
Measures contributing >1% of total AP at <£100/t (measures in bold >5%)
Significant differences between optimistic and pessimistic MACCs?
Comment RTD status / requirements Potential additional abatement measures
Nutrient management
22% 1.Improved mineral N Timing 2.Improved organic N Timing
3.Separating slurry and mineral N 4.Using composts 5.Making full allowance for manure N
Yes – AP for both mineral and organic N timing much higher in optimistic
Significant AP for improved timing by second budget, policy options include: 1.NVZ rules and cross compliance; 2. Good Farming Practice supported by base level agri-environment schemes and by quality assurance protocols; 3.Fertiliser tax; 4. Improved extension.
1. Ongoing RTD: MinNO, DEFRA projects ACO213 and ACO116 (grassland and cereals and mineral fertiliser) ACO111 (grassland and slurry), AC0221 and AC0222 and the EU project NitroEurope (grassland and timing). 2. Future RTD: interactions between organic and mineral fertilisers.
Soil management
24% 1.Improving drainage
2.Reduced tillage
Yes – drainage excluded in pessimistic
Unlikely to be a policy measure in second budget due to unresolved uncertainty on (a) state of current drainage, and (b) effect of improving drainage on emissions.
Ongoing RTD: Defra project FFG0923 will improve understanding of state of drainage. Future RTD: Net effect of red. tillage on emissions; effect of imp. drainage on emissions.
Wider measures to improve soil management e.g. residue management and waste management to improve soil structure and sequester C.
Nitrification inhibitors
12% Nitrification inhibitors
Yes – NIs excluded in pessimistic
Potentially widely deployable across budgets 2-4, once adequately tested in UK conditions. Uncertainty remains regarding future costs (and CE) of NI‟s.
New DEFRA projects currently being commissioned (ACO116 and ACO213) to look at regional efficacy of nitrification inhibitors will help to reduce uncertainty, also ongoing Scottish Government RTD. Numerous further research questions, e.g. what are the yield effects of NIs on grazed grasslands?
Using more N eff. plants
15% 1.Species introduction
2.Improved N-use plants
Overall AP similar, but improved plants excluded in pessimistic
Time required to develop and deploy new varieties means more applicable to 4
th budget.
Scope for accelerating through
A major new EU project (http://www.legumefutures.eu/) will investigate the potential use of legumes.
1. Increased use of existing n eff. varieties. 2. Use of GM.
12
incentive payments and extension/advisory support. Species introduction >£100/t on original MACC.
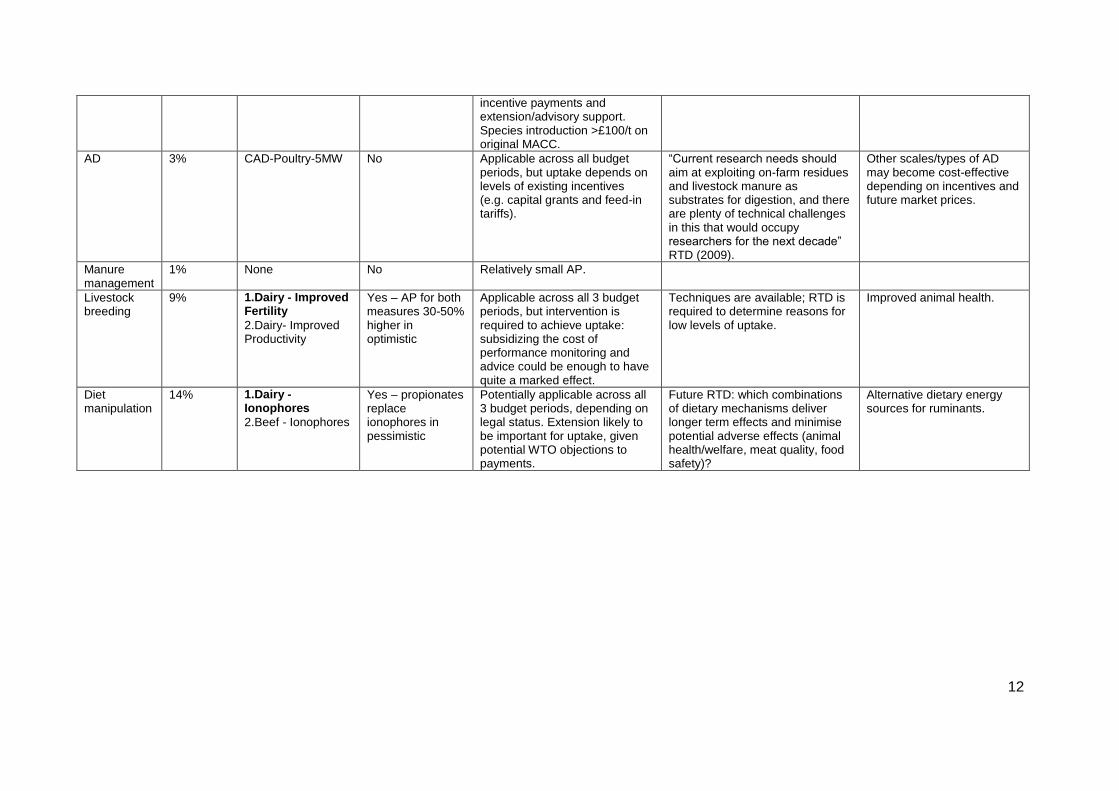
AD 3% CAD-Poultry-5MW No Applicable across all budget periods, but uptake depends on levels of existing incentives (e.g. capital grants and feed-in tariffs).
“Current research needs should aim at exploiting on-farm residues and livestock manure as substrates for digestion, and there are plenty of technical challenges in this that would occupy researchers for the next decade” RTD (2009).
Other scales/types of AD may become cost-effective depending on incentives and future market prices.
Manure management
1% None No Relatively small AP.
Livestock breeding
9% 1.Dairy - Improved Fertility
2.Dairy- Improved Productivity
Yes – AP for both measures 30-50% higher in optimistic
Applicable across all 3 budget periods, but intervention is required to achieve uptake: subsidizing the cost of performance monitoring and advice could be enough to have quite a marked effect.
Techniques are available; RTD is required to determine reasons for low levels of uptake.
Improved animal health.
Diet manipulation
14% 1.Dairy - Ionophores
2.Beef - Ionophores
Yes – propionates replace ionophores in pessimistic
Potentially applicable across all 3 budget periods, depending on legal status. Extension likely to be important for uptake, given potential WTO objections to payments.
Future RTD: which combinations of dietary mechanisms deliver longer term effects and minimise potential adverse effects (animal health/welfare, meat quality, food safety)?
Alternative dietary energy sources for ruminants.

13
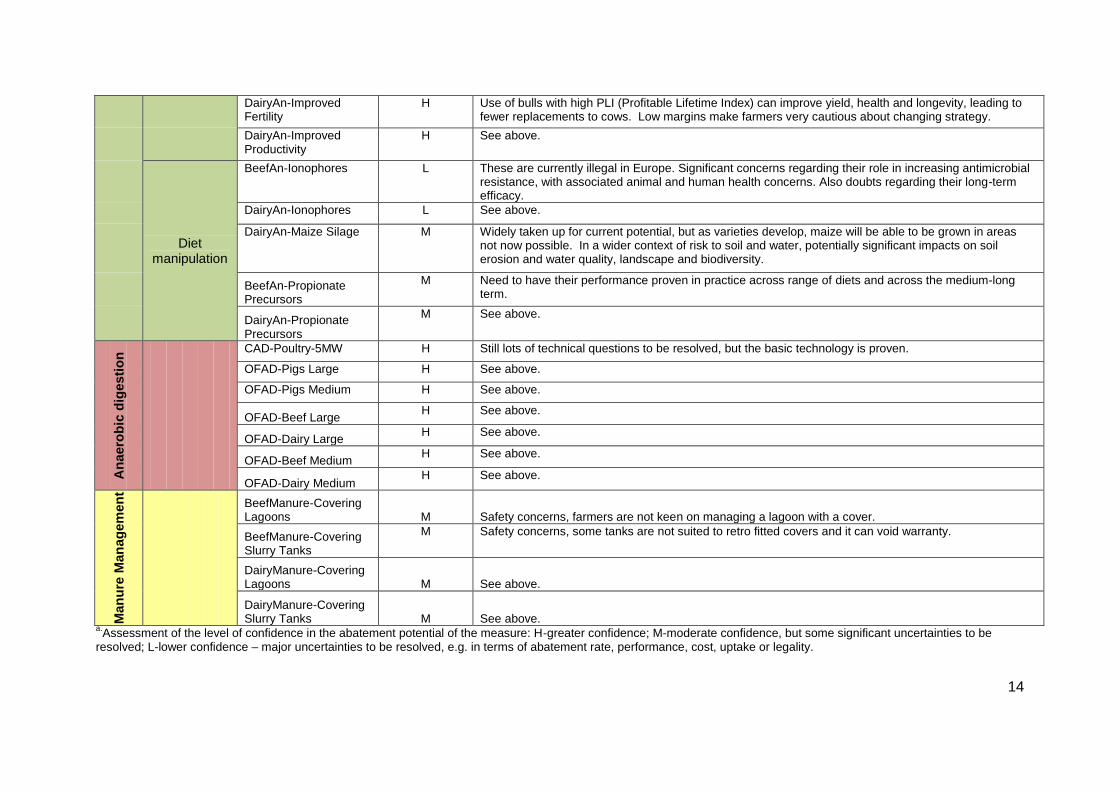
Table E6. Assessment of the level of confidence in the abatement potential of the measures and remaining uncertainty
Category Measure Confidencea Remaining uncertainty
Cro
ps/s
oil
s
Nutrient management
Mineral N Timing M Significant uncertainty regarding the extent to which the timing of mineral N application could be
improved.
Organic N Timing
M Significant uncertainty regarding the extent to which the timing of organic N application could be improved. Also, timing of organic N is linked to storage capacity and many farms have too little to take them over the winter. Although AP may be significant, there is the need for a great deal of investment nationally to realise the potential. However, NVZs mean that in general, farmers have to have such capacity.
Avoid N Excess M Significant uncertainty regarding the extent to which N is applied in excess at present.
Full Manure
The optimistic AP is much higher than the pessimistic, which means that much of the optimistic AP is uncertain.
Using Composts
M Farm assurance schemes may not include using composts from certain sources. Composts vary greatly in available N - usually low and may be more a source of carbon. Replacing slurry with FYM/composts begs the question of what to do with the slurry and if it is turned to FYM, where does the straw come from? Potentially very large investments would be needed to change the system.
Slurry Mineral N Delayed
H Small abatement potential.
Soil management Drainage
L Significant uncertainty regarding the area of land on which drainage could be improved. Also the abatement rate of this measure (i.e. the effect that improving drainage will have on emissions) is uncertain.
Reduced Tillage L There is significant uncertainty regarding the effect of reduced tillage on net GHG emissions.
Nitrification inhibitors Nitrification inhibitors
L Nitrification inhibitors need to be adequately tested in UK conditions to establish their efficacy. Potential negative effects on animal health need to be investigated.
Using more N-eff plants
Improved N-Use Plants
M Likely to yield significant abatement, however there is some uncertainty regarding how much time would be required to develop and deploy new varieties.
Species Intro
L Species introduction has a large abatement potential, however its cost-effectiveness is marginal, and therefore the large AP could become too expensive with small change in the cost assumptions.
Liv
esto
ck
Breeding
BeefAn-Improved Genetics
H Higher confidence, but needs a lot of effort on promotion. Low margins make farmers very cautious of change. This does have potentially significant benefits. There is little use of EBV (Estimated Breeding Value) in breeding, although some farmers have used it to achieve major improvements. It means producing better quality stock quicker rather than developing lines which lead to animal welfare issues. It should be noted that it is important to balance your breeding goal (be it production or fertility or both) for any potential unfavourable correlated responses and ensure that you are not breeding animals that have too high a resource input requirement such that the overall animal benefits are outweighed by system losses.
14
DairyAn-Improved Fertility
H Use of bulls with high PLI (Profitable Lifetime Index) can improve yield, health and longevity, leading to fewer replacements to cows. Low margins make farmers very cautious about changing strategy.
DairyAn-Improved Productivity
H See above.
Diet manipulation
BeefAn-Ionophores L These are currently illegal in Europe. Significant concerns regarding their role in increasing antimicrobial resistance, with associated animal and human health concerns. Also doubts regarding their long-term efficacy.
DairyAn-Ionophores L See above.
DairyAn-Maize Silage M Widely taken up for current potential, but as varieties develop, maize will be able to be grown in areas not now possible. In a wider context of risk to soil and water, potentially significant impacts on soil erosion and water quality, landscape and biodiversity.
BeefAn-Propionate Precursors
M Need to have their performance proven in practice across range of diets and across the medium-long term.
DairyAn-Propionate Precursors
M See above.
An
aero
bic
dig
esti
on
CAD-Poultry-5MW H Still lots of technical questions to be resolved, but the basic technology is proven.
OFAD-Pigs Large H See above.
OFAD-Pigs Medium H See above.
OFAD-Beef Large H See above.
OFAD-Dairy Large H See above.
OFAD-Beef Medium H See above.
OFAD-Dairy Medium H See above.
Man
ure
Man
ag
em
en
t
BeefManure-Covering Lagoons M Safety concerns, farmers are not keen on managing a lagoon with a cover.
BeefManure-Covering Slurry Tanks
M Safety concerns, some tanks are not suited to retro fitted covers and it can void warranty.
DairyManure-Covering Lagoons M See above.
DairyManure-Covering Slurry Tanks M See above.
a.Assessment of the level of confidence in the abatement potential of the measure: H-greater confidence; M-moderate confidence, but some significant uncertainties to be
resolved; L-lower confidence – major uncertainties to be resolved, e.g. in terms of abatement rate, performance, cost, uptake or legality.

15
Table of Contents 1. Background ............................................................................................................................... 19
2. Update of the original MACC .................................................................................................... 20
2.1 Reducing uncertainty by improving the evidence base for the MACC ................................... 20
2.2 Comparison of the original and revised MACC ....................................................................... 26
2.3 Abatement potential by Devolved Administration (DAs) ....................................................... 38
2.4 Reconciling the measures in the updated MACC with other parts of the analysis ................ 38
2.5 Costs and benefits not included in the MACCs ....................................................................... 39
3. Scoping of farm level cost issues for mitigation measures ....................................................... 44
3.1 Principles for identifying costs in the Environmental Stewardship Scheme........................... 44
3.2 Applicability of assumptions on which payments in Environmental Stewardship (ES) are based ............................................................................................................................................. 44
3.3 Production norms and regionalisation.................................................................................... 45
3.4 Baseline levels of regulation ................................................................................................... 45
3.5 Farm size ................................................................................................................................. 47
3.6 Business structure/use of contractors .................................................................................... 47
3.7 Notional costs ......................................................................................................................... 47
3.8 Cost of capital.......................................................................................................................... 48
3.9 The scope for applying the measures by government action ................................................. 48
4. Interactions ............................................................................................................................... 54
4.1 Comparison of the method used in Defra WQ0106 and the original MACC approach .......... 54
4.2 Indentifying key interactions, and revision of the interaction factors used in the SAC MACC1 ...................................................................................................................................................... 55
4.3 Interactions between crops/soils methods and livestock measures ...................................... 58
4.4 Refining the analysis of interactions between measures ....................................................... 58
5. Farm specific analysis ................................................................................................................ 62
5.1 Applicability of measures to farm types ................................................................................. 63
5.2 Characterisation of regions by farm type ............................................................................... 63
5.3 Influence of farm size on applicability and uptake of measures ............................................ 64
5.4 Combining farm type, size and region .................................................................................... 65
5.5 Effects of environment on measures ...................................................................................... 72
5.6 Effects of policy on measures ................................................................................................. 73
5.7 Current uptake of measures ................................................................................................... 74
5.8 Effects of technical efficiency ................................................................................................. 76
5.9 Summary ................................................................................................................................. 76
6. Achieving abatement and measuring progress ........................................................................ 78

16
6.1 Timelines for 2nd, 3rd and 4th budgetary periods ..................................................................... 78
6.2 Indicators ................................................................................................................................ 82
7. Assessment of potential economic and land-use impacts of abatement ................................. 85
8. Conclusions ............................................................................................................................... 87
8.1 Summary of the results ........................................................................................................... 87
8.2 Improvements in the evidence base and areas with future potential ................................... 93
9. References ................................................................................................................................ 95
APPENDIX A. Expert meeting agenda and attendee list .................................................................. 99
APPENDIX B. Expert survey ............................................................................................................ 100
APPENDIX C. Review of the uncertainty in key measures .............................................................. 104
APPENDIX D. Scoping of income foregone calculations of climate change abatement measures 135
APPENDIX E. Comparison of the ADAS and original SAC approach to calculating interactions ..... 140
APPENDIX F. Breakdown of the abatement potential for each devolved administration .............. 141
APPENDIX G. Assessment of mitigation measure applicability by region ...................................... 143
APPENDIX H. Size profiles of robust farm types ............................................................................. 147
APPENDIX I. Background information on timelines ........................................................................ 152
APPENDIX J. Brief descriptions of the mitigation measures ........................................................... 155
APPENDIX K. Review of Anaerobic Digestion plant costs. .............................................................. 158
17
List of tables
Table 2.1 Revisions made to the MACC (see Appendix C for further explanation) .............................. 21 Table 2.2 Description of variables with lower and higher estimates (see Appendix C for further explanation) .......................................................................................................................................... 24 Table 2.3 Assumptions used in the optimistic and pessimistic MACCs ................................................ 26 Table 2.4 Comparison of the abatement potential for measures costing <£100/tCO2e (all maximum technical potential, 2022, private discount rate, excl. forestry)........................................................... 26 Table 2.5 Comparison of measures in MACC1 and the revised MACCs - measures under £100/t (2022, MTP, revised interactions, private), .......................................................................................... 27 Table 2.6 Summary of differences between original MACC and optimistic MACC 2 (measures in green have higher abatement (at <£100/t) in MACC2; measures in red have lower abatement) ................. 29 Table 2.7 Summary of differences between original MACC and pessimistic MACC 2 (measures in green have higher abatement (at <£100/t) in MACC2; measures in red have lower abatement) ....... 31 Table 2.8 Summary of differences between the optimistic and pessimistic MACC 2 (measures in green have higher abatement (at <£100/t) in optimistic; measures in red have lower abatement .... 33 Table 2.9 Abatement potentials for 2022, by devolved administration and MACC type ..................... 38 Table 2.10 Level of analysis of measures with low abatement or high cost in the original MACC ...... 38 Table 2.11Extent to which inclusion of the measure in the analysis of uncertainty is likely to influence the updated MACCs .............................................................................................................................. 39 Table 2.12 Qualitative assessment of the hidden costs (i.e. costs not included in the revised MACCs) .............................................................................................................................................................. 41 Table 4.1 Initial assessment of interactions .......................................................................................... 56 Table 4.2Amended assessment of interactions .................................................................................... 57 Table 4.3 Revisions made to the original IFs ......................................................................................... 58 Table 4.4 Comparison of AP using old and new interactions method .................................................. 59 Table 4.5 Optimistic abatement potential of measures costing <£100/tCO2e for 2022. Measures in bold have significantly higher AP under the new interactions method. .............................................. 60 Table 4.6 Pessimistic abatement potential of measures costing <£100/tCO2e for 2022. Measures in bold have significantly higher AP under the new interactions method. .............................................. 61 Table 5.1 Qualitative assessment of measure applicability across farm types. ................................... 63 Table 5.2 Number of holdings by farm type and region, and percentage of UK holdings by type. ..... 64 Table 5.3 Applicability of measures across farm size categories .......................................................... 65 Table 5.4 Applicability of mitigation measures by farm type and size in the England West region .... 66 Table 5.5 Applicability of mitigation measures by farm type and size in the England East region ...... 67 Table 5.6 Applicability of mitigation measures by farm type and size in the England North region ... 68 Table 5.7 Applicability of mitigation measures by farm type and size in the Wales region ................. 69 Table 5.8 Applicability of mitigation measures by farm type and size in the Scotland region ............. 70 Table 5.9 Applicability of mitigation measures by farm type and size in the Northern Ireland region 71 Table 5.10 Mean uptake of selected fertiliser practices in England with significant differences by farm type, size and region ............................................................................................................................. 75 Table 5.11 Uptake of nutrient management plans in England by farm size, region and type. ............ 76 Table 5.12 Summary of highly and moderately applicable mitigation measures by region and farm type. ...................................................................................................................................................... 77 Table 6.1 Abatement potential (achievable at <£100/t, optimistic assumptions) across budget periods .................................................................................................................................................. 80 Table 6.2Data for measure-specific adoption indicators ...................................................................... 83 Table 8.1 Summary of the abatement potentials that could be achieved by category and measure (abatement potentials are for 2022 Optimistic MACC, using the new interactions method) ............. 89 Table 8.2Assessment of the level of confidence in the abatement potential of the measures and remaining uncertainty........................................................................................................................... 91

18
List of figures
Figure 2.1 Original MACC (MACC1), old interactions method .............................................................. 35 Figure 2.2 Revised MACC (MACC2), 2022, MTP, optimistic, new interactions method ....................... 36 Figure 2.3 Revised MACC (MACC2), 2022, MTP, pessimistic, new interactions method ..................... 37 Figure 3.1 Map showing the location of organic producers in the UK ................................................. 46 Figure 3.2 Assessment of the scope for using policy instruments and extension methods to ensure farm level uptake of abatement measures and the relative ease of ensuring compliance and monitoring effectiveness ...................................................................................................................... 49 Figure 5.1 Map of UK super regions (Map data Crown Copyright) ...................................................... 62 Figure 6.1 Abatement potential (achievable at <£100/t, optimistic assumptions) across budget periods .................................................................................................................................................. 81 Figure 8.1 The abatement potentials that could be achieved by categories of measures at <£100/t . 88
19
1. Background
In the December 2008 report, the Committee on Climate Change (CCC) published the results of its commissioned project that developed marginal abatement cost curves (MACCs) for the agriculture and LULUCF sectors (see Moran et al. 2008). The MACCs identified 17.5 MtCO2e in abatement potential by 2022 at a carbon price of up to £100/tCO2e under a Maximum Technical Potential scenario. Part of this initial estimate has formed the basis for sector targets with input from stakeholder groups and further external scrutiny of the initial project assumptions. The CCC will deliver its 2
nd progress report to Parliament in June 2010, where it will address the
potential for reducing emissions within agriculture. The Committee will also provide advice regarding the 4
th budget period (2023-2027) in December 2010. As part of this advice the Committee will set a
vision for the agriculture and LULUCF sectors‟ future with lower emissions and set out the path towards that vision. For the progress report the Committee will seek to identify a set of indicators (e.g. actions for the government to pursue) to track progress being made towards delivering reductions. In this regard, this project builds upon previous analysis on agriculture developed by the Committee for the first report in December 2008. Key tasks The four main objectives/tasks of the project are:
1. Development of an updated view of previous MACC analysis. 2. Setting out a timeline for implementation of abatement options. 3. Characterisation of abatement potential and options for agriculture during the 4
th budget
period (2023-2027). 4. Assessment of potential economic and land-use impacts of abatement.
Tasks 2-4 are informed by the development of task 1), which comprises a range of activities to improve current MACC assumptions, specifically:
1a Reviewing assumptions on abatement potential of existing and new measures. 1b Refining cost information and including compliance and enforcement costs. 1c Reviewing options for refining measure interactions. 1d Identifying the applicability of abatement measures to specific farm types, sizes and locations.

20
2. Update of the original MACC
The same baseline assumptions for future UK agricultural activity are used in this update as were used in the original MACC study. The BAU3 agriculture emissions projections study (Shepherd et al. 2007) assumed a significant change in agricultural policy would occur in 2013. Hence the period of 2012 is unaffected as it changes linearly from the 2010 period, and the 2017 period accommodates, as did BAU3, its 2015 scenario of changes, such as Common Agricultural Policy (CAP) reform and the Water Framework Directive. 2020 and 2025 were produced with no future new policy implementations, hence the 2022 scenario can again be assumed to be a linear trend growth from 2020. Accordingly, a weighted linear average was used to adjust the BAU3 estimates to cover the carbon budget years, assuming no significant shifts in policies or market prices between the reference years and the forecasted years. 2.1 Reducing uncertainty by improving the evidence base for the MACC
It is recognised that genuine uncertainties exist around the characterisation of abatement potential within the agriculture sector. Since the publication of the original MACC assessment for agriculture, further studies have reassessed the MACCs and reached differing abatement potential conclusions. In order to identify areas of uncertainty, the analysis provided in the ADAS (Harris et al. 2009) and AEA (2009) reports was reviewed, along with other feedback received on the initial MACC assumptions. The areas of uncertainty were then defined in terms of (a) the precise nature of the uncertainty, and (b) the origins of the uncertainty (e.g. MACC methodology; lack of understanding of specific processes; conflicting evidence; lack of baseline data etc.) and their importance (in terms of their influence on the MACC curves) ranked. Potential ways of addressing these uncertainties (in terms of pre-expert meeting actions; topics for discussion at the expert meeting; and post-project activity) were identified along with a list of actions. Three activities were used to explore the uncertainties,
One-to-one consultation with experts on specific points.
An expert meeting was held.
A short survey was undertaken. Consultation with individual experts was used to investigate key uncertainties across all categories of measures. In addition, an expert meeting was convened to attempt to resolve outstanding uncertainties on soil and nutrient management, plant breeding and nitrification inhibitors (see Appendix A). Prior to the meeting, a short survey was sent out, so that those unable to attend were able to contribute (see Appendix B). Experts identified the key uncertainties, reviewed the original assumptions and referred to the evidence base to confirm costs, abatement rate and applicability of uptake for each measure. Where uncertainties were greater, upper and lower estimates were used. Experts also suggested methods to reduce uncertainty in future (e.g. additional research and field-scale trials). A summary of the findings of the review, consultation, meeting and survey is given for each measure in Appendix C. The revisions made to the MACC in light of the findings are summarised in Table 2.1, and explanations of the variables for which higher and lower estimates were used in the revised MACCs are outlined in Table 2.2. Ideally, all uncertainty should be quantified and error bars provided. However, the nature of this project, which drew on a combination of experimental results, expert judgement and interpretation of evidence, meant that it was not possible to quantify the errors. Instead, we used optimistic and pessimistic sets of assumption to illustrate the effect of uncertainty. Clearly the issue of quantifying errors is an important one, and future work should seek to incorporate estimates of error where possible.

21
Table 2.1 Revisions made to the MACC (see Appendix C for further explanation)
Measure Applicability (area or livestock)
Abatement rate (AR) Cost
Cro
ps/s
oil
s
Improving the drainage of agricultural land
Changed range of estimates of the maximum areas where drainage could be improved from: 40% of grassland 30% of arable land to: • 5-40% of grassland • 5-30% of arable land
Changed from single abatement rate of 1tCO2e/ha/year to the range suggested in the expert meeting of 0.2tCO2e to 1.0tCO2e.
Changed capital costs from £1850/ha to a range of £2000/ha to £5000/ha. Changed recurring costs from £250/ha every 5 years to no recurring costs. The resulting costs in the revised MACC were: £33/ha/year (higher) £ -33/ha/year (lower) Compared to the cost in the original MACC of £45/ha.
Improved management of mineral fertiliser N application
Changed areas where timing could be improved from: 70% of grassland 80% of arable land to: • 10 to 58% of grassland • 10 to 80% of arable land
Changed abatement rate where timing could be improved from 0.3t CO2e/ha/year to range between 0 and 0.3t CO2e/ha/year
Original MACC assumed a financial benefit arising from a 5% yield increase. The cost of soil testing was added in the revised MACCs (assumed to be £12.38/ha/yr, based on AEA 2009). This led to a slight change in the costs from £-32/ha/year in the original MACC to £-33 in the revised MACCs.
Improved timing of manure/slurry N application
Changed areas where timing could be improved from 70% (grassland) and 60% (arable) to: • 15-34% of grassland • 15-22% of arable land
No change - original MACC assumptions of an abatement rate of 0.3 tCO2e/ha/year retained.
Original MACC did not include storage costs, these were added to the revised MACCS: Pessimistic: £250 per cow (from AEA 2009) on 50% farms (from survey) within area of application; Optimistic (with a 50% grant): £125 per cow on 50% farms (from survey) within area of application. The revised overall costs were: £-20/ha/year (higher) £-21/ha/year (lower) Compared to the cost in the original MACC of £-21/ha/year.
Making a full allowance for the N supplied in manures
Changed ranges for this measure from 80% of grassland and 50% of arable land to: • 15-34% grassland
Changed maximum amount by which N application could be reduced without affecting yield from 15% to following range: 2-15% N application savings which is
Recalculated cost based on a range of reductions in fertiliser application from 2 to 15% (original MACC assumed 15%). The costs of soil and manure testing, which were omitted from the original MACC, were included in the revised MACC: Capital cost of £400 per farm/ 5 years;

22
• 15-22% of arable land equivalent to an abatement rate of 0.1 to 0.01 tCO2e/ha/year
Recurring cost of £12.38/ha/yr (based on AEA 2009). The resulting costs in the revised MACCs were: £13/ha/year (higher) £-9/ha/year (lower) Compared to £-21/ha/year in the original MACC.
Improved N use plants
The revised MACC assumed that this measure could be applied to the following areas (original assumptions are given in brackets): 20% of grassland (5%) 60% of cereals (50%) 40% of root crops (25%) 40% of other crops (25%)
The original MACC assumed an abatement rate of 0.2 tCO2e/ha/year. Abatement rates in the revised MACC were based on the following assumptions. Pessimistic: It would take 15 years to achieve a 10% reduction in fertiliser use (equal to an abatement rate of 0.06 tCO2e/ha/year). Optimistic: It would take 10 years to achieve a 30% reduction in fertiliser use (equal to an abatement rate of 0.18 tCO2e/ha/year).
Added premium of £14.13 per ha for new varieties (based on AEA (2009) cost estimates). Costs calculated based on a range of 10% to 30% reduction in fertiliser costs (original MACC assumed 30%). The overall costs in the revised MACCs were: £-2/ha/year (higher) £-39/ha/year (lower) Compared to £-14/ha/year in the original MACC.
Avoiding excess N
Changed maximum area of land over which N input could be reduced without affecting yield from 80% to: • 5 to 20% of grassland • 5 to 20% of arable land
Changed maximum amount by which N application could be reduced without affecting yield from 10% to following range: • 1% to 10% reduction in N application savings which are equivalent to abatement rates of 0.007 to 0.07 tCO2e/ha/year.
Changed cost saving from a 10% reduction in fertiliser cost to a reduction in fertiliser cost ranging from 1-10% Cost of soil analyses not included as will have been incurred under improved mineral N timing. The overall costs in the revised MACCs were: £-2/ha/year (higher) and £-17/ha/year (lower). Compared to £-14/ha/year in the original MACC.
Nitrification Inhibitors
Changed areas of application from 70% (grassland) and 80% (arable) to: 15% to 58% (grassland) 15% to 91% (arable)
No change, original MACC assumptions of 0.3 tCO2e/ha/year retained.
Changed range of costs to reflect an NI premium of 10% (pessimistic) to 50% (optimistic) of fertiliser price (original MACC assumed 50%). The overall costs in the revised MACCS were: £83/ha/year (higher) £17/ha/year (lower) Compared to £48/ha/year in the original MACC.
23
Liv
esto
ck
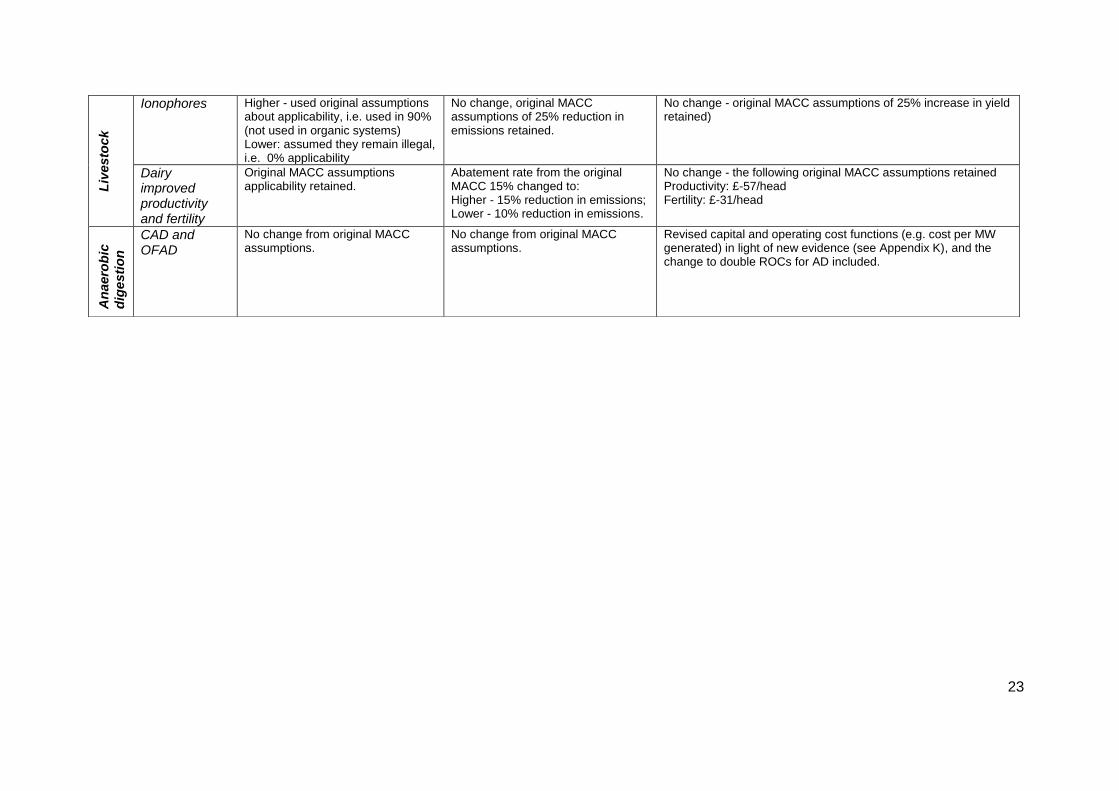
Ionophores Higher - used original assumptions
about applicability, i.e. used in 90% (not used in organic systems) Lower: assumed they remain illegal, i.e. 0% applicability
No change, original MACC assumptions of 25% reduction in emissions retained.
No change - original MACC assumptions of 25% increase in yield retained)
Dairy improved productivity and fertility
Original MACC assumptions applicability retained.
Abatement rate from the original MACC 15% changed to: Higher - 15% reduction in emissions; Lower - 10% reduction in emissions.
No change - the following original MACC assumptions retained Productivity: £-57/head Fertility: £-31/head
An
aero
bic
dig
esti
on
CAD and OFAD
No change from original MACC assumptions.
No change from original MACC assumptions.
Revised capital and operating cost functions (e.g. cost per MW generated) in light of new evidence (see Appendix K), and the change to double ROCs for AD included.
24
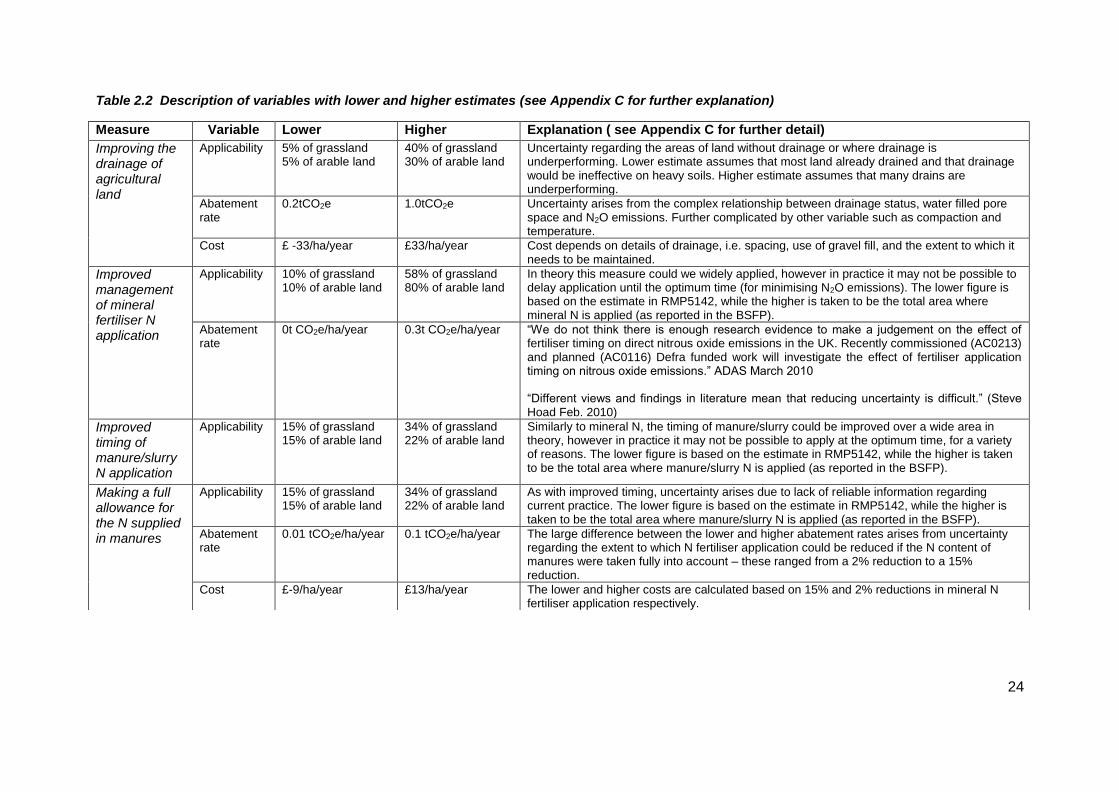
Table 2.2 Description of variables with lower and higher estimates (see Appendix C for further explanation)
Measure Variable Lower Higher Explanation ( see Appendix C for further detail)
Improving the drainage of agricultural land
Applicability 5% of grassland 5% of arable land
40% of grassland 30% of arable land
Uncertainty regarding the areas of land without drainage or where drainage is underperforming. Lower estimate assumes that most land already drained and that drainage would be ineffective on heavy soils. Higher estimate assumes that many drains are underperforming.
Abatement rate
0.2tCO2e 1.0tCO2e Uncertainty arises from the complex relationship between drainage status, water filled pore space and N2O emissions. Further complicated by other variable such as compaction and temperature.
Cost £ -33/ha/year
£33/ha/year
Cost depends on details of drainage, i.e. spacing, use of gravel fill, and the extent to which it needs to be maintained.
Improved management of mineral fertiliser N application
Applicability 10% of grassland 10% of arable land
58% of grassland 80% of arable land
In theory this measure could we widely applied, however in practice it may not be possible to delay application until the optimum time (for minimising N2O emissions). The lower figure is based on the estimate in RMP5142, while the higher is taken to be the total area where mineral N is applied (as reported in the BSFP).
Abatement rate
0t CO2e/ha/year 0.3t CO2e/ha/year “We do not think there is enough research evidence to make a judgement on the effect of fertiliser timing on direct nitrous oxide emissions in the UK. Recently commissioned (AC0213) and planned (AC0116) Defra funded work will investigate the effect of fertiliser application timing on nitrous oxide emissions.” ADAS March 2010 “Different views and findings in literature mean that reducing uncertainty is difficult.” (Steve Hoad Feb. 2010)
Improved timing of manure/slurry N application
Applicability 15% of grassland 15% of arable land
34% of grassland 22% of arable land
Similarly to mineral N, the timing of manure/slurry could be improved over a wide area in theory, however in practice it may not be possible to apply at the optimum time, for a variety of reasons. The lower figure is based on the estimate in RMP5142, while the higher is taken to be the total area where manure/slurry N is applied (as reported in the BSFP).
Making a full allowance for the N supplied in manures
Applicability 15% of grassland 15% of arable land
34% of grassland 22% of arable land
As with improved timing, uncertainty arises due to lack of reliable information regarding current practice. The lower figure is based on the estimate in RMP5142, while the higher is taken to be the total area where manure/slurry N is applied (as reported in the BSFP).
Abatement rate
0.01 tCO2e/ha/year 0.1 tCO2e/ha/year The large difference between the lower and higher abatement rates arises from uncertainty regarding the extent to which N fertiliser application could be reduced if the N content of manures were taken fully into account – these ranged from a 2% reduction to a 15% reduction.
Cost £-9/ha/year
£13/ha/year The lower and higher costs are calculated based on 15% and 2% reductions in mineral N fertiliser application respectively.
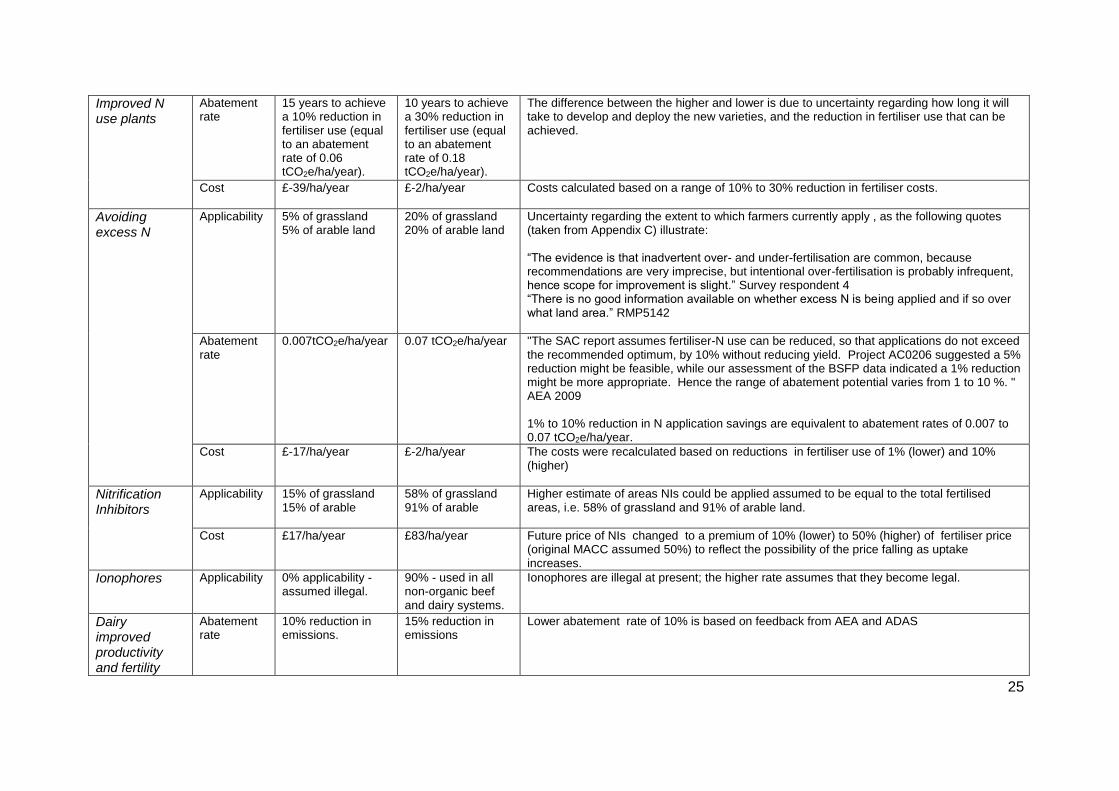
25
Improved N use plants
Abatement rate
15 years to achieve a 10% reduction in fertiliser use (equal to an abatement rate of 0.06 tCO2e/ha/year).
10 years to achieve a 30% reduction in fertiliser use (equal to an abatement rate of 0.18 tCO2e/ha/year).
The difference between the higher and lower is due to uncertainty regarding how long it will take to develop and deploy the new varieties, and the reduction in fertiliser use that can be achieved.
Cost £-39/ha/year
£-2/ha/year
Costs calculated based on a range of 10% to 30% reduction in fertiliser costs.
Avoiding excess N
Applicability 5% of grassland 5% of arable land
20% of grassland 20% of arable land
Uncertainty regarding the extent to which farmers currently apply , as the following quotes (taken from Appendix C) illustrate: “The evidence is that inadvertent over- and under-fertilisation are common, because recommendations are very imprecise, but intentional over-fertilisation is probably infrequent, hence scope for improvement is slight.” Survey respondent 4 “There is no good information available on whether excess N is being applied and if so over what land area.” RMP5142
Abatement rate
0.007tCO2e/ha/year 0.07 tCO2e/ha/year "The SAC report assumes fertiliser-N use can be reduced, so that applications do not exceed the recommended optimum, by 10% without reducing yield. Project AC0206 suggested a 5% reduction might be feasible, while our assessment of the BSFP data indicated a 1% reduction might be more appropriate. Hence the range of abatement potential varies from 1 to 10 %. " AEA 2009 1% to 10% reduction in N application savings are equivalent to abatement rates of 0.007 to 0.07 tCO2e/ha/year.
Cost £-17/ha/year £-2/ha/year The costs were recalculated based on reductions in fertiliser use of 1% (lower) and 10% (higher)
Nitrification Inhibitors
Applicability 15% of grassland 15% of arable
58% of grassland 91% of arable
Higher estimate of areas NIs could be applied assumed to be equal to the total fertilised areas, i.e. 58% of grassland and 91% of arable land.
Cost £17/ha/year
£83/ha/year
Future price of NIs changed to a premium of 10% (lower) to 50% (higher) of fertiliser price (original MACC assumed 50%) to reflect the possibility of the price falling as uptake increases.
Ionophores Applicability 0% applicability - assumed illegal.
90% - used in all non-organic beef and dairy systems.
Ionophores are illegal at present; the higher rate assumes that they become legal.
Dairy improved productivity and fertility
Abatement rate
10% reduction in emissions.
15% reduction in emissions
Lower abatement rate of 10% is based on feedback from AEA and ADAS

26
2.2 Comparison of the original and revised MACC
In this section the revised MACCs (“MACC2”) and the original MACC (“MACC1”) are compared and significant differences highlighted and explained. Unless otherwise noted, the abatement potentials cited are for the Maximum Technical Potential abatement. The revised MACCs were calculated using a revised approach to interactions, (the results using the new methodology are compared with the results using the original interaction methodology in section 4.4). Two versions of the revised MACCs have been generated: the pessimistic MACC and the optimistic MACC (see Table 2.3). During the investigation of the uncertainty, it became apparent that there was no clear consensus for certain key variables, and therefore a single agreed value would have been inappropriate. Instead the higher and lower limits of these variables were estimated and used to generate the two new MACCs. Explanations of the higher and lower estimates are given in Table 2.2.The overall results are presented in Table 2.4, and the original and revised MACCs are in Figures 2.1 – 2.3. Table 2.5 outlines the measures that are on each of the MACCs, and the reasons why some measures do not appear on some of the MACCs. Table 2.3 Assumptions used in the optimistic and pessimistic MACCs
Estimates Optimistic MACC Pessimistic MACC
Applicability (area or livestock)
Higher Lower
Abatement rate Higher Lower
Cost Lower Higher
Table 2.4 Comparison of the abatement potential for measures costing <£100/tCO2e (all maximum technical potential, 2022, private discount rate, excl. forestry)
MACC Abatement Potential (MtCO2e)
MACC1 17.5
MACC2 - Optimistic 18.9
MACC2 - Pessimistic 8.6
Comparison of the original MACC (MACC1) and the optimistic MACC2 for 2022 The measures in the MACC1 and the optimistic MACC2 at a cost-effectiveness of <£100/t are shown in Table 2.5. The AP achievable for less than £100/tCO2e for the optimistic MACC2 is approximately 1.4Mt more than the original MACC, primarily due to the improved cost-effectiveness of nitrification inhibitors and species introduction, which moves them onto the MACC at <£100t (see Table 2.6). These increases were offset by a reduction in the AP of the following measures: organic N timing; taking full account of manure N; and avoiding N excess. The AP of improving mineral N timing and improving dairy productivity were also reduced, but to a lesser extent. Four of the AD measures move from <£100/t to >£100/t on the revised MACC. Comparison of the pessimistic MACC2 with the original MACC (MACC1) The AP achievable for less than £100/tCO2e for the pessimistic MACC2 is approximately 8.9 MtCO2e lower than the original MACC. This is due primarily due to (a) the removal of ionophores, improved drainage, improved N use plants and making full allowance of manure N, which do not appear on the pessimistic MACC at <£100/t, and (b) a reduction in the AP of the following measures that do remain on the pessimistic MACC:
Crops-Soils-MineralNTiming
Crops-Soils-OrganicNTiming
Crops-Soils-AvoidNExcess
DairyAn-ImprovedProductivity These are offset to an extent by some large increases in the abatement from propionate precursors and species introduction.
27
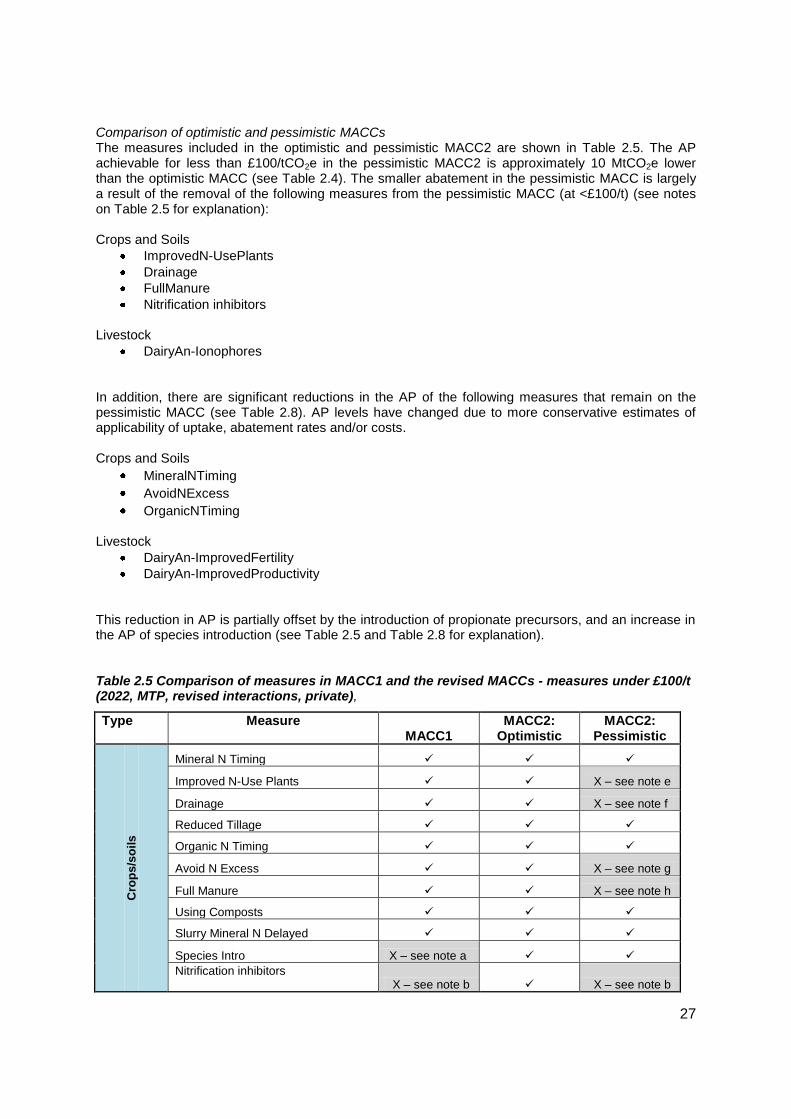
Comparison of optimistic and pessimistic MACCs The measures included in the optimistic and pessimistic MACC2 are shown in Table 2.5. The AP achievable for less than £100/tCO2e in the pessimistic MACC2 is approximately 10 MtCO2e lower than the optimistic MACC (see Table 2.4). The smaller abatement in the pessimistic MACC is largely a result of the removal of the following measures from the pessimistic MACC (at <£100/t) (see notes on Table 2.5 for explanation): Crops and Soils
ImprovedN-UsePlants
Drainage
FullManure
Nitrification inhibitors Livestock
DairyAn-Ionophores
In addition, there are significant reductions in the AP of the following measures that remain on the pessimistic MACC (see Table 2.8). AP levels have changed due to more conservative estimates of applicability of uptake, abatement rates and/or costs. Crops and Soils
MineralNTiming AvoidNExcess OrganicNTiming
Livestock
DairyAn-ImprovedFertility
DairyAn-ImprovedProductivity This reduction in AP is partially offset by the introduction of propionate precursors, and an increase in the AP of species introduction (see Table 2.5 and Table 2.8 for explanation). Table 2.5 Comparison of measures in MACC1 and the revised MACCs - measures under £100/t (2022, MTP, revised interactions, private),
Type Measure MACC1
MACC2: Optimistic
MACC2: Pessimistic
Cro
ps
/so
ils
Mineral N Timing
Improved N-Use Plants X – see note e
Drainage X – see note f
Reduced Tillage
Organic N Timing
Avoid N Excess X – see note g
Full Manure X – see note h
Using Composts
Slurry Mineral N Delayed
Species Intro X – see note a
Nitrification inhibitors X – see note b X – see note b

28
Liv
es
toc
k
BeefAn-Ionophores X – see note i
BeefAn-Improved Genetics
DairyAn-Improved Fertility
DairyAn-Improved Productivity
DairyAn-Ionophores X – see note i
DairyAn-Maize Silage
BeefAn-Propionate Precursors X – see note c X – see note c
DairyAn-Propionate Precursors X – see note c X – see note c
AD
CAD-Poultry-5MW
OFAD-Pigs Large
OFAD-Pigs Medium
OFAD-Beef Large X – see note d X – see note d
OFAD-Dairy Large X – see note d X – see note d
OFAD-Beef Medium X – see note d X – see note d
OFAD-Dairy Medium X – see note d X – see note d
Ma
nu
re
Ma
na
ge
men
t
BeefManure-Covering Lagoons X – see note d
BeefManure-Covering Slurry Tanks X – see note d
DairyManure-Covering Lagoons X – see note d
DairyManure-Covering Slurry Tanks X – see note d
Notes (=in MACC; X=not in MACC)
a. Large increase in AP and improvement in CE in revised MACCs due to revised interactions method
b. CE improved significantly due to in revised optimistic assumption that NIs would command a premium of 10% (rather than 50% in the original and pessimistic MACCs)
c. Incompatible with ionophores, appears on pessimistic MACC as ionophores are assumed to be illegal.
d. The cost assumptions for AD were changed in the revised MACCs (see Appendix K), making some AD more expensive that the manure management options. Some of the more expensive AD measures were removed as they are incompatible with manure management measures targeting the same farm type, e.g., beef-slurry lagoons and beef-OFAD have an interaction factor of 0.
e. Assumed to take longer to develop and deploy in pessimistic (15 years rather than 10).
f. Assumed higher cost and lower applicability and abatement rate in pessimistic.
g. Lower abatement rate and higher cost assumed in the pessimistic, making this cost >£100/t
h. Lower abatement rate and higher cost assumed in the pessimistic, making this cost >£100/t
i. Ionophores assumed to be illegal in the pessimistic MACC.

29
Table 2.6 Summary of differences between original MACC and optimistic MACC 2 (measures in green have higher abatement (at <£100/t) in MACC2; measures in red have lower abatement)
Optimistic MACC 2, 2022, MTP, revised interactions
MACC1, 2022, MTP, original interactions
Measure Abatement potential [ktCO2e]
Cost Eff. [£/tCO2e]
Rank in
MACC2
Abatement potential [ktCO2e]
Cost Eff. [£/tCO2e]
Rank in MACC1
Difference between optimistic MACC2 and original MACC
Cro
ps
/so
ils
Crops-Soils-MineralNTiming 2346 -106 3 2556 -103 3
AP slightly lower due to maximum area of grassland this measure could be applied to being changed from 70% to 58%
Crops-Soils-ImprovedN-UsePlants 737 -205 4 819 -68 9
AP slightly lower, CE improved due to higher ranking (other measures dropping down) and changed assumption about savings arising from reduced fertiliser use.
Crops-Soils-Drainage 4202 -31 5 3869 46 22
AP slightly greater, CE greatly improved due to revised cost assumptions
Crops-Soils-OrganicNTiming 1040 -64 9 2283 -68 4
AP lowered by>50%, due to reduction in the maximum areas on which this measure could be implemented; ranking 5 places lower due to reduced AP (measures with negative costs are ranked according to total savings, not unit CE)
Crops-Soils-ReducedTill 283 -170 11 112 -432 11 AP greater, CE improved, rank unchanged
Crops-Soils-AvoidNExcess 143 -260 12 613 -50 12
AP lowered by ~80% due to reduction in the maximum areas on which this measure could be implemented, rank unchanged
Crops-Soils-FullManure 192 -159 13 1016 -149 5
AP lowered by ~80% due to reduction in the maximum areas on which this measure could be implemented, dropped from 5
th to 13th
Crops-Soils-UsingComposts 273 0 15 174 0 13
AP increased due to new interactions method
Crops-Soils-SlurryMineralNDelayed 172 0 16 105 0 14
AP increased due to new interactions method
Crops-Soils-Nitrification inhibitors 2240 59 22 1341 293 25
Large increase in AP due to improved ranking, CE improved significantly due to optimistic assumption that NIs would command a premium of 10% (rather than 50%)
Crops-Soils-SpeciesIntro 2033 70 24 813 174 23 Large increase in AP and improvement in CE due to revised interactions method
Crops-Soils- 471 210 25 22 4434 30 No significant change (0 abatement at <£100/t)

30
SystemsLessReliantOnInputs
Crops-Soils-ControlledRelFert 1132 332 27 369 1068 26
No significant change (0 abatement at <£100/t)
Crops-Soils-ReduceNFert 1136 432 28 303 2045 28
No significant change (0 abatement at <£100/t)
Crops-Soils-BiolFix 240 858 29 19 14280 31 No significant change (0 abatement at <£100/t)
Liv
es
toc
k
BeefAn-Ionophores* 772 -1748 1 772 -1748 1 No change
BeefAn-ImprovedGenetics* 103 -3603 2 103 -3603 2
No change
DairyAn-ImprovedFertility 976 -101 6 769 0 8 AP greater, and ranking improved by 2 places
DairyAn-ImprovedProductivity 685 -144 7 839 0 6
AP lower, and ranking one place lower
DairyAn-Ionophores 1644 -49 8 1644 -49 7 No significant change
DairyAn-MaizeSilage 213 -263 10 213 -263 10 No change
DairyAn-bST 294 224 26 294 224 24 No change
DairyAn-Transgenics 1121 1692 30 1121 1692 27 No change
BeefAn-Concentrates 180 2705 31 180 2705 29 No change
An
ae
rob
ic
dig
es
tio
n
CAD-Poultry-5MW 487 0 14 487 12 19 AP unchanged, CE (and rank) improved significantly due to new AD cost assumptions
OFAD-PigsLarge 106 17 18 106 1 15 AP unchanged, slightly more expensive due to revised assumptions about the costs of AD
OFAD-PigsMedium 36 33 21 36 4 17 CE worsened, due to revised assumptions about the cost of AD
Ma
nu
re
ma
na
ge
me
nt BeefManure-
CoveringLagoons 23 9 17 0 NA NA
Most AD measures became more expensive on MACC2, so manure management measures previously removed due to their incompatibility with AD come into the MACC2
BeefManure-CoveringSlurryTanks 27 24 19 0 NA NA
See above
DairyManure-CoveringLagoons 74 25 20 0 NA NA
See above
DairyManure-CoveringSlurryTanks 77 70 23 0 NA NA
See above
*Note: It was noticed during the write up that the method may lead to an overestimate of the CE of these beef measures (because the financial benefits accruing from yield increases were based on liveweight instead of deadweight). The abatement potential is unaffected by this assumption, and is correct (within the limitations of the method).

31
Table 2.7 Summary of differences between original MACC and pessimistic MACC 2 (measures in green have higher abatement (at <£100/t) in MACC2; measures in red have lower abatement)
Pessimistic MACC2, 2022, MTP, revised interactions MACC1, 2022, MTP
Abbr.
Abatement potential [ktCO2e]
Cost Eff. [£/tCO2e]
Rank in
MACC2
Abatement potential [ktCO2e]
Cost Eff. [£/tCO2e]
Rank in
MACC1
Difference between original MACC and pessimistic? MACC2
Cro
ps
/so
ils
Crops-Soils-ReducedTill 315 -153 6 112 -432 11 AP greater, due to improved rank
Crops-Soils-MineralNTiming 358 -104 7 2556 -103 3
AP much lower due to the lower estimate of the area of land measure could be applied to being dramatically reduced
Crops-Soils-OrganicNTiming 427 -56 8 2283 -68 4
AP much lower due to the lower estimate of the area of land measure could be applied to being dramatically reduced
Crops-Soils-AvoidNExcess 5 -196 11 613 -50 12
AP much lower due to the lower estimate of the area of land measure could be applied to being dramatically reduced
Crops-Soils-UsingComposts 237 0 12 174 0 13
AP increased due to new interactions method
Crops-Soils-SlurryMineralNDelayed 172 0 13 105 0 14
AP increased due to new interactions method
Crops-Soils-SpeciesIntro 2703 52 19 813 174 23
Large increase in AP and improvement in CE due to revised interactions method (note AP is higher than optimistic MACC due to improved rank)
Crops-Soils-Drainage 121 155 21 3869 46 22
AP much reduced due to much lower estimates of area measure could be applied to and lower abatement rates in the pessimistic
Crops-Soils-ControlledRelFert 1810 208 22 369 1068 26
No significant change (0 abatement at <£100/t)
Crops-Soils-SystemsLessReliantOnInputs 358 277 24 22 4434 30
No significant change (0 abatement at <£100/t)
Crops-Soils-ReduceNFert 1143 429 25 303 2045 28
No significant change (0 abatement at <£100/t)
Crops-Soils-NIs 948 698 26 1341 293 25 No significant change (0 abatement at <£100/t)
Crops-Soils-BiolFix 74 2769 29 19 14280 31 No significant change (0 abatement at <£100/t)

32
Crops-Soils-FullManure 1 17633 30 1016 -149 5
AP much reduced due to much lower estimates of area measure could be applied to and lower abatement rates in the pessimistic
Liv
esto
ck
BeefAn-PropionatePrecursors* 566 -1017 1 0 NA NA
Substitute for ionophores, which are assumed to be illegal in pessimistic
BeefAn-ImprovedGenetics* 103 -3603 2 103 -3603 2
No change
DairyAn-ImprovedProductivity 456 -144 3 839 0 6
AP lower
DairyAn-ImprovedFertility 765 -86 4 769 0 8 AP unchanged, CE and ranking improved
DairyAn-MaizeSilage 213 -263 5 213 -263 10 No change
DairyAn-PropionatePrecursors 1469 -15 9 0 NA NA
Substitute for ionophores, which are assumed to be illegal in pessimistic
DairyAn-bST 294 224 23 294 224 24 No change
DairyAn-Transgenics 1121 1692 27 1121 1692 27 No change
BeefAn-Concentrates 180 2705 28 180 2705 29 No change
An
aero
bic
dig
esti
on
CAD-Poultry-5MW 487 0 10 487 12 19 AP unchanged, CE (and rank) improved significantly due to new AD cost assumptions
OFAD-PigsLarge 106 17 15 106 1 15 AP unchanged, slightly more expensive due to revised assumptions about the costs of AD
OFAD-PigsMedium 36 33 18 36 4 17 CE worsened, due to revised assumptions about the cost of AD
Ma
nu
re m
an
ag
em
en
t
BeefManure-CoveringLagoons 23 9 14 0 NA NA
Most AD measures became more expensive on MACC2, so manure management measures previously removed due to their incompatibility with AD come into the MACC2
BeefManure-CoveringSlurryTanks 27 24 16 0 NA NA
See above
DairyManure-CoveringLagoons 74 25 17 0 NA NA
See above
DairyManure-CoveringSlurryTanks 77 70 20 0 NA NA
See above
*Note: It was noticed during the write up that the method may lead to an overestimate of the CE of these beef measures (because the financial benefits accruing from yield increases were based on liveweight instead of deadweight). The abatement potential is unaffected by this assumption, and is correct (within the limitations of the method).
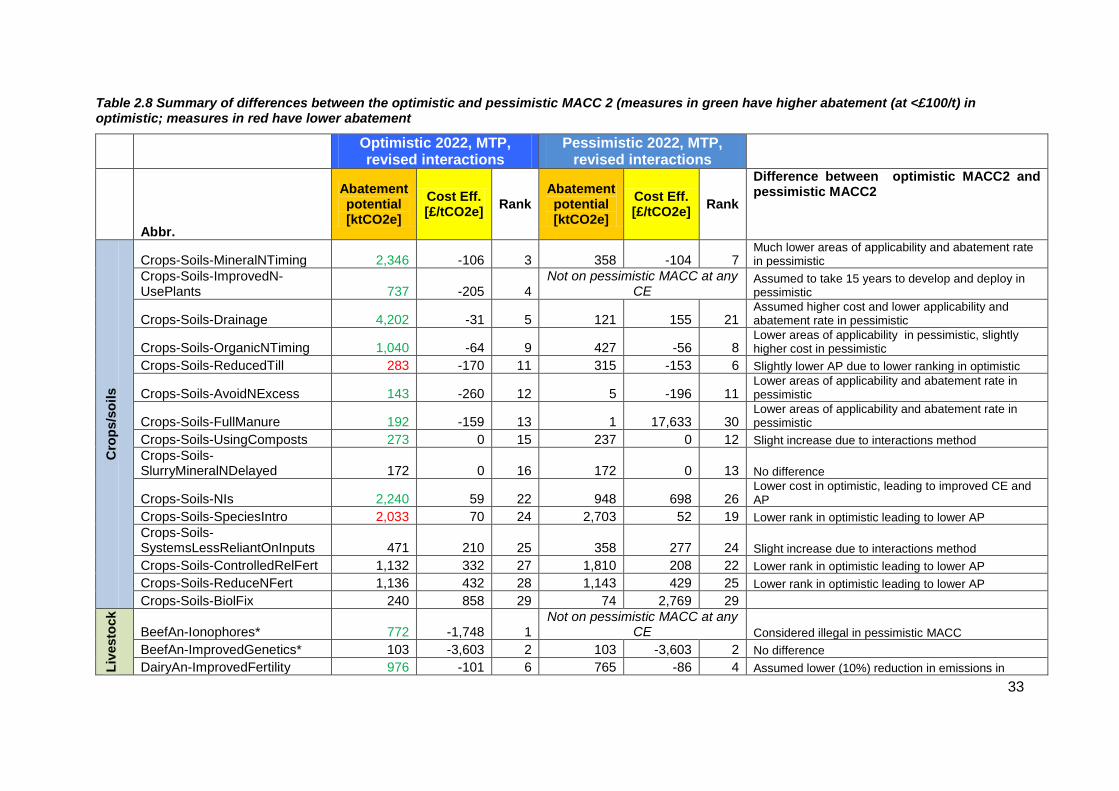
33
Table 2.8 Summary of differences between the optimistic and pessimistic MACC 2 (measures in green have higher abatement (at <£100/t) in optimistic; measures in red have lower abatement
Optimistic 2022, MTP, revised interactions
Pessimistic 2022, MTP, revised interactions
Abbr.
Abatement potential [ktCO2e]
Cost Eff. [£/tCO2e]
Rank Abatement potential [ktCO2e]
Cost Eff. [£/tCO2e]
Rank
Difference between optimistic MACC2 and pessimistic MACC2
Cro
ps/s
oil
s
Crops-Soils-MineralNTiming 2,346 -106 3 358 -104 7 Much lower areas of applicability and abatement rate in pessimistic
Crops-Soils-ImprovedN-UsePlants 737 -205 4
Not on pessimistic MACC at any CE
Assumed to take 15 years to develop and deploy in pessimistic
Crops-Soils-Drainage 4,202 -31 5 121 155 21 Assumed higher cost and lower applicability and abatement rate in pessimistic
Crops-Soils-OrganicNTiming 1,040 -64 9 427 -56 8 Lower areas of applicability in pessimistic, slightly higher cost in pessimistic
Crops-Soils-ReducedTill 283 -170 11 315 -153 6 Slightly lower AP due to lower ranking in optimistic
Crops-Soils-AvoidNExcess 143 -260 12 5 -196 11 Lower areas of applicability and abatement rate in pessimistic
Crops-Soils-FullManure 192 -159 13 1 17,633 30 Lower areas of applicability and abatement rate in pessimistic
Crops-Soils-UsingComposts 273 0 15 237 0 12 Slight increase due to interactions method
Crops-Soils-SlurryMineralNDelayed 172 0 16 172 0 13 No difference
Crops-Soils-NIs 2,240 59 22 948 698 26 Lower cost in optimistic, leading to improved CE and AP
Crops-Soils-SpeciesIntro 2,033 70 24 2,703 52 19 Lower rank in optimistic leading to lower AP
Crops-Soils-SystemsLessReliantOnInputs 471 210 25 358 277 24 Slight increase due to interactions method
Crops-Soils-ControlledRelFert 1,132 332 27 1,810 208 22 Lower rank in optimistic leading to lower AP
Crops-Soils-ReduceNFert 1,136 432 28 1,143 429 25 Lower rank in optimistic leading to lower AP
Crops-Soils-BiolFix 240 858 29 74 2,769 29
Liv
esto
ck
BeefAn-Ionophores* 772 -1,748 1 Not on pessimistic MACC at any
CE Considered illegal in pessimistic MACC
BeefAn-ImprovedGenetics* 103 -3,603 2 103 -3,603 2 No difference
DairyAn-ImprovedFertility 976 -101 6 765 -86 4 Assumed lower (10%) reduction in emissions in

34
pessimistic
DairyAn-ImprovedProductivity 685 -144 7 456 -144 3 Assumed lower (10%) reduction in emissions in pessimistic
DairyAn-Ionophores 1,644 -49 8 Not on pessimistic MACC at any
CE Considered illegal in pessimistic MACC
DairyAn-MaizeSilage 213 -263 10 213 -263 5 No difference
DairyAn-bST 294 224 26 294 224 23 No difference
DairyAn-Transgenics 1,121 1,692 30 1,121 1,692 27 No difference
BeefAn-Concentrates 180 2,705 31 180 2,705 28 No difference
BeefAn-PropionatePrecursors Not on optimistic MACC at any
CE 566 -1,017 1 Not compatible with ionophores
DairyAn-PropionatePrecursors Not on optimistic MACC at any
CE 1,469 -15 9 Not compatible with ionophores
AD
CAD-Poultry-5MW 487 0 14 487 0 10 No difference
OFAD-PigsLarge 106 17 18 106 17 15 No difference
OFAD-PigsMedium 36 33 21 36 33 18 No difference
Man
ure
man
ag
em
en
t BeefManure-CoveringLagoons 23 9 17 23 9 14 No difference
BeefManure-CoveringSlurryTanks 27 24 19 27 24 16 No difference
DairyManure-CoveringLagoons 74 25 20 74 25 17 No difference
DairyManure-CoveringSlurryTanks 77 70 23 77 70 20 No difference
*Note: It was noticed during the write up that the method may lead to an overestimate of the CE of these beef measures (because the financial benefits accruing from yield increases were based on liveweight instead of deadweight). The abatement potential is unaffected by this assumption, and is correct (within the limitations of the method).

35
-3,603
OFADPigM
0
12,000 14,000 16,000 18,000
-3,650
-250
-200
-150
-100
1 462014
12
-50
74
3
0
BeefGenBeefIon
10,000
AvoidNxsCompostSeparate
Abatement potential (ktCO2e) (macc1, 2022, old interactions)
0 2,000 4,000
OFADPigL
8,000
-1,748
CE
MinNTimingOrgNTiming
FullManure
DairyProd
DairyIonDairyFert
ImpPlantsDairyMaize
RedTill
OFADBeefL
OFADDairyL
-506,000
50
CE (£/ktCO2e)
CADHen5OFADBeefMOFADDairyM
Drainage
-68
-149
0
-49
0
-68
-263
-432
-103
0
Figure 2.1 Original MACC (MACC1), old interactions method

36
0
0 10,0005,000
100
50
Abatement potential (ktCO2e) (optimistic macc2, 2022, new interactions)
-3,650
-200
-150
-100
-50
-250
DairyProdDairyIonMinNTiming
ImpPlantsDrainage
CompostSeparateBeefLagoonsOFADPigL
DairyLagoons
OFADPigMDairyFert NIs
OrgNTiming DairySlurryTanksDairyMaize
RedTill
SpeciesInt
AvoidNxsFullManure
CADHen5
BeefGen
CE
BeefIon
15,000
-170-159
0
9
24
3370
20,000
-205
BeefSlurryTanks
-31
-101-144
-49-64
-263 -260
0
0
17 25
5970
CE (£/ktCO2e)
-106
-3,603
-1,748
Figure 2.2 Revised MACC (MACC2), 2022, MTP, optimistic, new interactions method
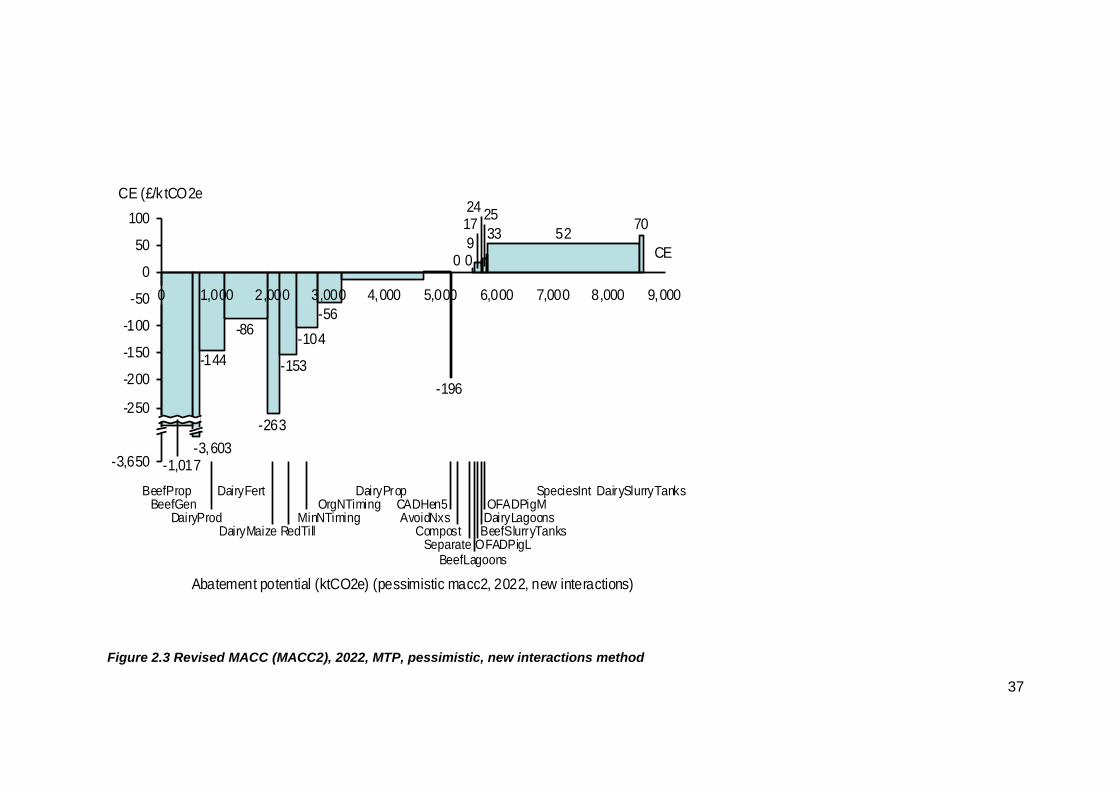
37
70
Abatement potential (ktCO2e) (pessimistic macc2, 2022, new interactions)
-250
-144
BeefPropBeefGen
MinNTimingDairyMaize
DairyFert
DairyProd
CE
AvoidNxsCompost
SeparateBeefLagoons
OFADPigLBeefSlurryTanks
-3,603
DairyLagoonsOFADPigM
SpeciesInt DairySlurryTanksCADHen5
DairyPropOrgNTiming
RedTill
-3,650
-200
-86
-1,017
-263
-153
-104
-56
-196
0 09
1724
25
33 52
-150
-100
-50
0
50
100
CE (£/k tCO2e
0 1,000 2,000 3,000 4,000 5,000 6,000 7,000 8,000 9,000
Figure 2.3 Revised MACC (MACC2), 2022, MTP, pessimistic, new interactions method

38
2.3 Abatement potential by Devolved Administration (DAs)
The total pessimistic and optimistic abatement potential achievable for each of the devolved administrations is summarized in Table 2.9. A breakdown of the abatement by measure is given in Appendix F. The abatement is not proportional to the areas of agricultural land in each of the DAs, but rather reflects regional variation in farming, for example the predominance of upland sheep farming in Scotland and Wales, and thus where few of the abatement measures would be applicable. There is a marked drop in the abatement potential at £34/t and at £100/t, this is because two important measures are forecast to cost between £34/t and £100/t: species introduction and nitrification inhibitors. Table 2.9 Abatement potentials for 2022, by devolved administration and MACC type
England Scotland N. Ireland Wales UK
Abatement potential ktCO2e
Abatement potential ktCO2e
Abatement potential ktCO2e
Abatement potential ktCO2e
Abatement potential ktCO2e
Pessimistic, <£40/tCO2e 3811 798 639 592 5839
Pessimistic, <£100/tCO2e 5584 1239 882 914 8619
Optimistic, <£40/tCO2e 9563 2127 1353 1492 14534
Optimistic, <£100/tCO2e 12486 2791 1679 1928 18885
2.4 Reconciling the measures in the updated MACC with other parts of the analysis
In order to make best use of the time available, several of the tasks were undertaken concurrently. This enabled the project to maintain momentum and to produce the results within the required timeframe. In order to do this, the measures to be included in the various tasks had to be identified before the revisions to the MACC had been completed. This means that some measures that are important on the updated MACC were not included in all parts of the analysis because they were relatively marginal in the original MACC. This has been addressed by undertaking the missing analysis retrospectively, where possible. The measures on the updated MACC that were not cost-effective in the original MACC and the level of analysis are shown in Table 2.10. Note that manure management measures were not included in this due their small abatement potential in the updated MACC. Table 2.10 Level of analysis of measures with low abatement or high cost in the original MACC
Reason for exclusion
In analysis of uncertainty?
In cost/policy scoping?
Included in farm specific analysis
Included in timelines?
Dairy Maize silage Moderate AP No Yes Yes Yes
Separate slurry and mineral N application Small AP No Yes Yes Yes
Nitrification inhibitors Cost >£100/t Yes Yes Yes Yes
Species intro Cost >£100/t No Yes No Yes
Propionate precursors Not on MACC1 No Yes No Yes
Reduced tillage Small AP No Yes Yes Yes
Re-examining the uncertainty in light of the revised MACCs It is worth considering to what extent the revised MACCs would look different if the all the measures on them had been included in the analysis of uncertainty (see Table 2.11). Fortunately, nitrification inhibitors were included in the analysis because it was thought that they may become more important in the updated MACC.

39
Table 2.11Extent to which inclusion of the measure in the analysis of uncertainty is likely to influence the updated MACCs
Measure Is analysis of the uncertainty likely to influence the updated MACCs?
Dairy Maize silage Little change likely – only accounts for 1.1% of optimistic MACC AP and 2.5% of pessimistic MACC AP , and costs >£100tCO2e
Separate slurry and mineral N application
Little change likely – only accounts for 0.9% of optimistic MACC AP and 2.0% of pessimistic MACC AP available for £100tCO2e
NIs Included in uncertainty analysis
Species introduction (including legumes)
Analysis of uncertainty could have a major impact given the high abatement potential and borderline cost-effectiveness of this measure. Further investigation of this uncertainty should be a priority, and should be informed by ongoing RTD, such as the Legume Futures project.
Propionate precursors
Large significant abatement in the pessimistic MACC. Considerable uncertainty regarding future legal status – probiotics a possible alternative option if both ionophores and propionate precursors remain banned. In vivo experiments
required to reduce uncertainty over efficacy.
Reduced tillage
The abatement potential of reduced tillage is significantly higher in the updated MACC. However there is considerable uncertainty as to the net effect of reduced tillage on GHG emissions. The abatement rate of reduced tillage in the pessimistic MACC should be assumed to be zero to reflect this uncertainty.
Manure management (lagoons and slurry tanks) Little effect due to small abatement potential.
2.5 Costs and benefits not included in the MACCs
The estimation of the cost/benefit of each measure in the MACC was restricted to the private costs of the measures. There are four categories of cost/benefit that have, to a greater or lesser extent, been omitted from the analysis (see Table 2.12):
1. Policy costs elements not captured in the analysis. 2. Industry administrative costs (e.g. the costs of form filling, learning how to implement a
measure, learning how to comply, demonstrating compliance, etc.). 3. Government administrative costs (the cost of devising and implementing regulation,
providing incentive payments, monitoring and enforcing compliance etc.). 4. Ancillary costs and benefits (i.e. non-market effects).
Policy costs The original MACC analysis tried to include the main costs and benefits; however some potentially important costs/benefits were omitted from the analysis. Some missing costs were identified during the review of the MACC and included in the MACC2 update. An independent review of the costs of the measures was undertaken during the MACC update (see Appendix D), which highlighted further potential costs/benefits that could be included in future analysis (see Table 2.12). Industry administrative costs A preliminary assessment of the potential administrative costs associated with the measure is given in Table 2.12, however it should be noted that the actual administrative costs will depend on the combination of the measure and the policy approach adopted. Government administrative costs Government administrative costs (such as the cost of devising and implementing regulation, providing incentive payments, monitoring and enforcing compliance etc.) are not included because it is difficult to give a meaningful assessment of them without knowing the specific regulatory approach adopted. However, it is worth noting that while providing education/advice is often the approach adopted, it is not necessarily a cheap option. For example, (with respect to diffuse water pollution from agriculture) it has been argued that “Promotion of best practice will continue to be the standard means of diffuse pollution control from rural areas. However, the expense of educational initiatives is the hidden cost of light touch regulation”. (D‟ Arcy et al. 2006, p 199) Ancillary costs and benefits

40
Actions taken to mitigate GHG emissions can have unintended non-market effects (e.g. on water pollution or animal welfare) that are not accounted for in the MACCs. These were reviewed in Moran et al. (2008) and are summarised in Table 2.12.

41
Table 2.12 Qualitative assessment of the hidden costs (i.e. costs not included in the revised MACCs)
Type Measure Policy costs/benefits Industry admin. costs
Non-market effects
Included in MACC Potential additional costs/benefits
Significant? Costs Benefits
Cro
ps
-So
ils
Improving the drainage of agricultural land
Capital costs of installation, recurring benefit of increased yield (10%)
Maintenance required on some soil types
N Water quality improvement due to reduced run-off
Improving the management of mineral fertiliser N application
Small yield increase (5%), cost of soil testing
Effects on crop quality (positive or negative), management time, consultancy
N? Water quality improvement due to reduced run-off
Improved N use plants
Reduced fertiliser costs, increased cost of seed
Effects on crops quality, risk profile of the new crop, cost of establishing, management time
Y Reduction in the impacts of fertiliser production and manufacture Improved water quality
Avoiding excess N Fertiliser costs reduced Yield penalties if reduced by too much, soils testing (if not done for other measures), management time, consultancy
Y? Reduction in the impacts of fertiliser production and manufacture Improved water quality
Reduced tillage Capital costs of harrow purchase, cultivation costs reduced
Effects on crop yield/quality, management time (learning time), consultancy, greater use of contractors? Cost of extra chemicals?
Y Impacts of increased use of herbicides?
Improved water quality Reduced soil erosion
Making full allowance for the N in manures when applying fertiliser N
Reduced fertiliser purchase costs, cost of increasing manure storage
Cost of soil testing (if not done for another measure), consultancy/advice, management time
Y? Reduction in the impacts of fertiliser production and manufacture
Separating slurry application from mineral N application
No financial costs/benefits Effects on crop quality (positive or negative), management time
Y Improved water quality
Nitrification Inhibitors
Increase fertiliser cost by 10-50%, small increase in yield, small decrease in cultivation costs
Effects on crop yield/quality, management time (learning time), consultancy, greater use of contractors?
Y Externalities associated with manufacturing
Species introduction (inc.
Cultivation costs increased, yields reduced, fertiliser
Effect on crop quality, management time (learning time), consultancy,
Y? Reduction in the impacts of fertiliser production and

42
legumes) cost reduced greater use of contractors? manufacture Water quality improvement
Improved management of manure/slurry N application
Small yield increase (3%), cost of slurry storage
Effects on crop/grass quality, reduction in fertiliser, management cost (e.g. learning how to time)
N? Water quality improvement due to reduced run-off
Liv
es
toc
k
Ionophores Cost of feed additive, yield increase
Effects on meat and milk quality, management cost (advice, vet input, learning time)
N? Animal health/welfare, human health Manufacturing externalities Public/consumer acceptance
Dairy improved productivity and fertility
No costs assumed, yield increase
Cost premium for high genetic merit animals, cost of any additional management (recording etc) or equipment needed
Y? Animal health/welfare Public/consumer acceptance
Beef improved productivity and fertility
No costs assumed, yield increase
Cost premium for high genetic merit animals, cost of any additional management (recording etc) or equipment needed
Y? Animal health/welfare Public/consumer acceptance
DairyAn-MaizeSilage
Increased cost of feed, increased yield
Effects on carcass/milk quality (positive or negative), management time, consultancy, animal health effects
Y? Animal health/welfare Soil damage, water quality
Propionate precursors
Cost of feed additive, yield increase
Effects on carcass/milk quality (positive or negative), management time, consultancy, animal health effects
Y? Animal health/welfare

43
AD
Anaerobic digestion Capital costs, operating
costs The benefits were: electricity price, ROC value, heat value.
Benefits Value of any agronomic benefits to digestate over slurry Waste collection payments? Cost of renting land to dispose of slurry? Cost of alternative storage? Any fertiliser cost saving Costs Management costs (learning, record keeping etc), insurance, consultancy
Y CAD: Increased road transport externalities (congestion, noise, accidents, infrastructure, fuel use) CAD: Higher emissions from N production/transport to replace digestate nutrients CAD: Externalities associated with digestate disposal if not utilised for N
Water quality improvement
44
3. Scoping of farm level cost issues for mitigation measures
The cost estimates in the original MACC were based on existing data, assumptions implicit in the farm level LP model and expert assessment of the likely on-farm effects of the mitigation measures. These assumptions were reviewed (in particular in AEA 2009) and revised, see Table 2.1. This section explores the possibility of using the ground rules employed in the Environmental Stewardship Scheme as a way of improving the consistency of cost estimation in future assessments. It also scopes out the potential for application of the measures at farm level. This assessment was done in parallel with the update of the MACCs, i.e. it was not used to revise the assumptions underpinning the MACCs, but rather is intended to aid the interpretation of the MACCs by providing a preliminary assessment of how the abatement potential might vary by farm. Specific aims were to: 1. Establishing ground rules and principles of identifying costs and income foregone as a result of
the measures. 2. Scoping out the potential for applying the measures by use of existing or new policy instruments
and/or methods based on extension i.e. research, education, publicity, advice, demonstrations, etc.
3. Scoping out the ease with which application of the measures can be monitored and compliance ensured.
The potential issues relating specifically to the cost categories for specific measures are set out in Appendix D. This seeks to identify: 1. Agronomic issues associated with each measure and to establish the context in which the
measure might be applied. 2. Economic issues about the measure and the context in which it is likely to be applied. 3. The likely revenue and cost headings in the partial budget to determine the profit or loss resulting
from applying each measure. 3.1 Principles for identifying costs in the Environmental Stewardship Scheme
The issues surrounding the identification of income foregone and costs incurred are very similar to those encountered in determining standard payments for agri-environment schemes. The methodology for this has been refined by farm business economists in England working for MAFF, RDS, DEFRA and now Natural England. Since 2005 it has been a requirement that these calculations also come under the independent scrutiny of an expert to verify that the assumptions made can be supported. This entails looking at both the budgeting principles involved and the data sourcing that back the assumptions made. The process is therefore one that has become well researched and validated in an appropriate context. 3.2 Applicability of assumptions on which payments in Environmental Stewardship (ES) are based
Timing The figures used in the ES budgets are a medium term forecast to represent an average or a norm during a five year period. This period was chosen because it fits with a normal review cycle for the Rural Development Programme for England (RDPE) of six years and the term of the agri-environment agreements (five years at Entry Level and ten years with a five year break at Higher Level). However budgets become particularly hard to establish with any certainty beyond two or three years. The unit cost of certain inputs can be forecasted with some degree of confidence. But some are highly variable and ex ante assessment would suggest that trends are not sufficiently clear to make extrapolation beyond five years sensible or worthwhile. Output prices are even more unstable than costs. There are sources such as EU Commission and OECD-FAO that offer long term commodity price projections. In the case of OECD-FAO it is nine years. But they tend to „flat line‟ for most of the latter half of any nine year period simply because too many factors can change in a manner that is hard to predict beyond that point. Thus whilst the structural reasons for projecting over 5 years in budgets supporting

45
payments in ES need not be relevant to the calculation of marginal abatement costs there is little point in attempting to project further than this. It is a legitimate question as to whether it is better to use actual historic costs or project them. EU Commission guidance for the verification of agri-environment scheme payments favours use of a three year average of historic data. DEFRA have been firmly of the opinion that this is inappropriate. This is because agri-environment scheme payments need to be forward looking and reflect the income foregone that farmers might expect to suffer rather than look backwards and assess them under past conditions that may no longer be relevant. The problem of changed circumstances is exacerbated by the lead in time for data gathering. Most good sources using robust data collection and analysis procedures (such as the Farm Business Survey) have a time lag from financial year end to publication of a year. Given that financial year ends can lag the end of production cycles by up to another year that imposes a delay of up to two years before the data can be used. If it is averaged over three years the lag stretches out to a maximum of five years. It is easy to see that over a five year period costs and revenues can shift onto a substantially different level. The context with reference to commodity markets, regulatory changes, government support policy etc. can all change markedly over five years. On the other hand using one year‟s historic data does not seem sensible because of annual variation in production conditions, price etc. Therefore the basis used in establishing ES payments of a five year average (a mid-point of two and half years on linear trends) would seem to be just as appropriate for establishing a benchmark for abatement costs going forward as it is for establishing agri-environment payments. The backward looking averaging of historic figures has exactly the same methodological problems. 3.3 Production norms and regionalisation
The use of forward budgets goes hand in hand with the use of normative assumptions on production systems i.e. input use, yields etc. In the case of ES payments assumptions are adapted to the circumstances. If the scheme or prescription is only open to farmers in the uplands then upland costings and upland production performance metrics are used. If there is any regional or site specific bias then the figures must be appropriate. But in much of ES although there are some site specific assumptions that can be made they are generally for wide application across the whole of England. The abatement cost estimates are being assessed for different farm types and for the six UK super regions. Therefore they are more specific. It will require a much larger data base and make it less likely that common assumptions on costs, revenue and production can be used. It is likely that there will be more heterogeneity based on farm type than there will be from the geographic split within the UK. There is considerable variation within regions. Thus whilst it is likely that cereal yields are likely to be higher in the East of England than in the North in general it is also likely that cereals growing will be focused on the localities that are best suited. It is likely that in the best areas such as the Fylde or the coastal fringe of Northumberland yields might well match or exceed those in East Anglia. 3.4 Baseline levels of regulation
The baseline for ES payments determination is Good Agricultural Practice guidelines and the cross compliance requirements of the Single Payment. This is likely to also be an appropriate baseline for abatement measures. Virtually all commercial scale producers in England are subject to cross compliance. The historic basis of entitlement means that adherence to cross compliance cannot be regarded as quite so universal in Scotland and Wales but it is widespread. The static hybrid model in Northern Ireland provides for a wide reach of cross compliance, similar to that in England. Participation in the Single Farmer Payment scheme (SPS) is the norm. Participation in agri-environment schemes (AES) is widespread at the entry level but only a minority are involved at higher level. According to Natural England in August 2009 there were more than 58,000 AES agreements covering in excess of 6 million hectares in England. This represents over 66% of English agricultural land – approaching the 70% coverage target agreed between Natural England and Defra. By area, Entry Level Stewardship (ELS)-only agreements account for the majority (45%), classic schemes (10%), Higher Level Stewardship (HLS) (7%) and Organic Entry Level Stewardship (OELS) agreements (4%). Regionally the proportion of agricultural land under AES varies between 61% in the

46
South East and 81% in the North East. Compliance with organic farming protocols has a strong regional and product bias. Organic farming protocols and practices create a different starting point for the application of abatement measures and it obviously constrains what can be done. It also, to an extent, effects what needs to be done because some measures would not be applicable to organic farms (e.g. those concerning the use of mineral N).The organic area in the UK was 743,000 ha in 2008. There is a bias towards grassland with 85% of the UK organic area is in pasture compared with 69% of the total area. There is also a regional bias and 28% of the organic livestock producers in the UK are in South West England. There is a bias towards certain districts where the prevalence is above average (as can be seen from the map below).
Figure 3.1 Map showing the location of organic producers in the UK
Quality assurance protocols also create a baseline for farming practices that is above the minimum set by cross compliance and Good Farming Practice. The purchasers of crop and livestock products may impose requirements that might exceed the baseline requirements for SPS. This is not taken into consideration for the calculation of payments for ES. They might affect the assumptions for the cost of applying abatement measures. The prevalence of quality assurance conditions that are relevant to the abatement measures will vary from sector to sector.

47
In the dairy sector virtually all dairy farmers are supplying milk subject to a contract. Some go farther than others in dictating the means of production. But certainly the premium contracts do stipulate good environmental practices. In the combinable crop sector most cereals are sold subject to ACCS (the Assured Combinable Crops Scheme) requirements. Under the current regulations requirement EC 10.4 states that „Fertiliser rates must be based on a calculation of the nutrient requirements of the crop and on regular analysis of nutrient levels in soil, plant or nutrient solution. Nutrient applications should be guided by the levels contained within the Defra/SAC fertiliser recommendations.‟ Regulation EC.10.5 states that „The supply and timing of nutrient application must be matched to meet crop demand as nutrient leaching has significant environmental consequences‟. Therefore in part some of the proposed measures are already being applied through protocols of this kind. In other sectors, such as sheep and beef, more selling takes place through marketing channels where assurance is less widespread or less effective in the areas that are relevant to the abatement measures. What therefore needs to be established is how relevant the assurance protocols are to the abatement measures and how widespread their application is within the sector concerned. In summary therefore the ES budgets really only need to take into account a fairly basic level of compliance based on the cross compliance and Good Farming Practice. If the purpose of assessing marginal abatement costs were to establish appropriate compensation payments then this would also be adequate for this purpose. But to get a realistic cost assessment it might be worthwhile trying to take account of any alteration of circumstances as a result of agri-environment scheme participation, organic farming protocols and quality assurance schemes. 3.5 Farm size
Farm size does not necessarily have to be an important factor in determining costs. If marginal changes are being made in say tractor running costs one can base the assumption on the typical machine for the job – a small tractor for haymaking, a large one for arable work. Up to a point although larger machines have higher running costs per hour the work rate is also higher and the resulting costs per hectare might be within a similar range when all factors are taken into account. In instances where farm size is important in ES attention is paid to the average size of farm with an agreement. What is perhaps a more important factor on farm size is the extent to which small farmers would experience disproportionate levels of cost in applying measures that require capital expenditure rather than just a change of management. They might well be able to apply the measure but only by resorting to the use of agricultural contractors or by joining a cooperative venture. This could have major implications for the way in which those businesses are run. 3.6 Business structure/use of contractors
The use of contractors in running farms or doing particular operations is important. The marginal cost of doing an operation with a contractor is the same as the total cost. Doing the operation in hand with own labour and machinery has substantial fixed cost elements and the marginal cost is much less than total cost. The assumption about use of contractors is determined to an extent by the task. Hedge cutting and silage making are frequently undertaken by contractors. Fertilising is generally only undertaken by contractors on farms where virtually all the work is done by contractors. 3.7 Notional costs
The most important notional cost is that of labour. Farmers and farm families are typically rewarded out of profit and not as a cost to the business. Costing the use of labour is complicated by the fact that it is a fixed cost and there is no measure of cost or price for the labour alone. It can be imputed and it is likely that this is the best way of dealing with it for the marginal abatement costs. The imputed cost of labour in ES payment calculations is higher for managerial work than for manual. There is of course no change in the reward per hour for a farmer when he gets off his tractor and enters the farm office but it seems appropriate to use rates that equate to what they would be for a farm worker or a professional manager according to the task.
48
Land costs can also be notional. Rent is sometimes used as a proxy for a range of costs from mortgage interest to buildings insurance despite the fact that land is twice as likely to be owned as rented in the UK. However the range of costs to the owner-occupier and the added complications that come with the ownership of an investment asset mean that rent is an easier measure to deal with than the actual costs to the owner-occupier. 3.8 Cost of capital
The opportunity of cost of capital to heavily indebted farms is the marginal cost of borrowing. To the well capitalised business with high liquidity this is the marginal interest paid on savings. There are statistics on the variation in the capital position associated with different farm types etc. However in the ES payment calculations the rate used in all circumstances is the medium to long term cost of borrowing to sound businesses with substantial collateral. This smoothes out the effect of short term variations like the current historically low bank base rates and the gap between LIBOR and base rate that has opened up for short run finance. The longer the period over which investments are capitalised the more sensitive budgets are to these costs. It is very sensitive in forestry and it is likely to be sensitive for fixed capital investments such as anaerobic digesters.
3.9 The scope for applying the measures by government action
The selection of the most appropriate means of applying the abatement measures is an involved and detailed process. It is not intended to attempt to define the means at this stage in the project but to scope out the options and give an assessment of the likely ease of monitoring and ensuring compliance. These are summarised in Figure 3.2 with a high, medium or low rating. The considerations on which the ratings are based are discussed briefly for each measure below. It is not intended to be a detailed or an accurate assessment. This will depend on identifying which specific policy instruments to use and this cannot be determined at this stage in the process of selection.

49
Figure 3.2 Assessment of the scope for using policy instruments and extension methods to ensure farm level uptake of abatement measures and the relative ease of ensuring compliance and monitoring effectiveness
Existing and new instruments of policy are considered under the general headings of regulatory approaches i.e. based upon some form of compulsion and payments based i.e. using various forms of financial inducement both positive and negative. The potential role of extension is considered, which encompasses a wide range of activities including research, publicity, advice, education, demonstration etc. These in turn could be delivered by government agencies, by the public sector, through industry representative bodies, through levy boards etc. There are many options and permutations. The ease of compliance and monitoring is inevitably rather dependent on the means of delivery adopted. Some come with existing and effective systems of compliance and monitoring and
Role Ease of Ease of
The objective of Compli- Monit-
i.e. the abatement measures Regu- Pay- Regu- Pay- Exten- ance oring
lation ments lation ments sion
Improving the drainage of agricultural land L L L M H H M
Improving the management of mineral
fertiliser N applicationH M H H H M L
Ionophores M M M H H H M
Improved management of manure/slurry N
applicationM M H M M L L
Dairy improved productivity and fertility L L L M H M M
Beef improved productivity and fertility L L L M H L L
Anaerobic digestion L H L H H H M
Making full allowance for the N in manures
when applying fertiliser NL L M M H L L
Improved N use plants L M M H H M M
Avoiding excess N M L M M H L L
Reduced tillage M M M H M H M
DairyAn-MaizeSilageL M L H H M H
Separating slurry application from mineral
N applicationL L L L M L L
Nitrification InhibitorsM M H H M M M
Species introduction (inc. legumes)M M M H H H H
Propionate precursorsM M M H H H M
Key to assessment symbols
Low level of scope to apply policy instruments or ease in compliance & monitoring L
Medium level of scope to use policy instruments or ease in compliance & monitoring M
High level of scope to use policy instruments or ease in compliance & monitoring H
instruments instruments
Existing New

50
with others it is more hypothetical. But the assessment is based partly on the inherent nature of the on-farm changes that are proposed for each measure. Improving the drainage of agricultural land Improving land drainage would not be easy to apply as a regulatory requirement. It was very successfully incentivized through government funded capital grants until these ending with the winding up of the FHDS scheme in the 1980s. As a measure aimed at increasing productivity it would not be compliant with WTO green box requirements and would not therefore be feasible at present. Capital grants would probably be the most effective policy instrument but this would not be available within the existing policy framework. Another option would be fiscal, for example by extending the scope of one of the existing capital or investment allowances. This might therefore include additional first year allowance for the purchase of land drainage machinery. The precedent for special tax treatment of items which offer environmental benefits has already been created with the Enhanced Capital Allowances (ECAs) which enable a business to claim 100% first-year capital allowances on their spending on qualifying plant and machinery. There are currently three schemes qualifying for ECAs: Energy-saving plant and machinery; Low carbon dioxide emission cars and natural gas and hydrogen refuelling infrastructure and Water conservation plant and machinery. Because businesses can write off the whole of the capital cost of their investment in these technologies against their taxable profits in the period during which they make the investment returns are enhanced creating a bias in favour of this type of investment. The scope for using extension methods is good and probably offers good value for money. Compliance is quite easy in the sense that the work is generally done by specialist contractors and it should be possible to ensure that it has taken place and to an acceptable standard. Monitoring effectiveness is less easy because there is no guarantee of effectiveness and ineffectiveness will only show up under certain conditions. Improving the management of mineral fertiliser N application Improving the management of mineral fertiliser nitrogen application is something that can be done through regulatory approaches. Scope for this does exist through existing requirements under NVZ rules supported by cross compliance, Good Farming Practice supported by base level agri-environment schemes and by quality assurance protocols. These existing regulations could be extended but do currently apply some of the farm level control envisaged by the measure. It might be possible to apply a particularly high and stringent set of protocols as agri-environment payments. But the experience with regard to the Manure and Nutrient Management Plans which were disallowed as prescriptions within ELS flags up an obvious warning that currently the requirements must be well beyond that of normal farming practice to qualify for payments. It would not be difficult to envisage new instruments of policy that could apply the measure through regulations or incentive payments. This could include the taxing of nitrogen to incentivize its more careful use by increasing its cost. A nitrogen tax would also affect the economic optimum level of use but this would also depend on the output price and the shape of the production function which in turn is affected by local production conditions. Therefore without prejudging the suitability or effectiveness of price as a means of delivering improved management the most that can be said at this stage is that an increase in price is likely to encourage a more careful use of mineral nitrogen. It should be noted that the efficacy of any fertiliser tax depends on the demand for fertiliser being price-elastic, however Bel et al. (2004) in a review of European research and experience of price and volume of mineral N use reached the conclusion that “over the last 20 years in Europe, the price of nitrogen fertilisers has weakly influenced its consumption trends”. There is clearly plenty of scope for extension methods to be used to encourage better on-farm practice in nitrogen use. Compliance would have to be through recording. Whilst this could be effective there is no guarantee that the fertiliser is applied where the records say that it is. Likewise monitoring is feasible by the appearance of the crop (which lends itself to remote sensing) and by plant and soil testing. But none of these are necessarily all that easy or low cost. Ionophores The use of ionophores is currently restricted in the UK due to a ban at the EU level. The product is classed as a growth promoter and there is some potential for antimicrobial resistance. Their use is therefore contingent on a change in their legal status; the “optimistic” MACC assumes they are legalized, while the “pessimistic” MACC assumes they remain illegal. There are plenty of regulatory controls on animal feeds. It would be comparatively easy to implement requirements to label the

51
inclusion of ionophores but not easy nor perhaps appropriate to require their inclusion through regulation. There are no payments regimes in place within agri-environment or other areas of agricultural policy to support use of ionophores but it would not be too hard to see how this could be done. Use of ionophores could fit into livestock prescriptions, or there could be specific voluntary measures as part of the post 2012 CAP. In as much as this has a production benefit it may be hard to apply payment without falling foul of WTO green box requirements. The role of extension in promoting the use of ionophores is potentially very high and might be sufficient without resorting to other measures given the potential economic benefits to the farmer. Ease of compliance in ensuring the use is fairly good given the state of regulation in the animal feed industry and the ability to trace the supply of the products. Similarly with monitoring although with slightly less confidence given that it is harder to ensure supply than use of the products. Improved management of manure/slurry N application The improved management of manure and slurry is similar in some respects to mineral nitrogen in terms of what can be done with existing or new policy instruments i.e. a tightening of NVZ rules, agri-environment baseline requirements, quality assurance protocols etc. But the limitation is that manures/slurries are produced on farm and hence it is harder to regulate quantities. It is (thus?) not so easy to apply fiscal measures to incentivize more careful use. Ease of ensuring and monitoring compliance is low because it is harder to record and regulate use and abuse. Dairy improved productivity and fertility Improving dairy productivity and fertility is clearly very production-orientated and consequently offers little scope for either regulatory or payment measures within policy instruments in current use. It would be completely contrary to WTO green box requirements. There are too many systems of production which need to be applied according to on-farm circumstances to make regulation anything other than clumsy and potentially counter-productive. But there could be new kinds of payment incentive to draw producers towards improved productivity and fertility. Extension could play a very big role and has done so in the past. In fact subsidizing the cost of performance monitoring and advice could be enough to have quite a marked effect on its own. Most dairy farmers are used to performance monitoring and compliance could be implemented fairly easily if the incentive could be provided. The same could be said of monitoring. Beef improved productivity and fertility Considerations are similar for improving beef productivity and fertility to those of dairying but are much harder to apply. Beef farming is far less responsive to management than dairying. The state of record keeping is much more basic. The system variation is far more diverse. The application of new payments is feasible. An age related headage payment that incentivized prolificacy and faster finishing would have some influence. It would run counter to the incentivisation provided through agri-environment payments which aim to extensify beef production to achieve greater bio-diversity. It goes against the decoupling of such supports within the CAP since 2003 and is not green box compliant. Compliance will be difficult. Monitoring should be possible to an extent through the existing cattle traceability system (which is the area that results in the most frequent breaches of the cross compliance regulations). But given the range in breed types, the amount of cross-breeding etc. even simple measures such as weight at slaughter might not mean all that much. Anaerobic digestion The capital costs of anaerobic digesters are already being funded by Pillar 2 payments. The co-products of heat and electricity are being subsidized by a combination of regulatory incentives on the electricity industry. The mechanisms seem largely to already be in place. The role seems stronger for payments (direct or indirectly obtained) rather than regulation to force farmers to adopt anaerobic digestion technology. This is partly because of the size of barriers to entry and economies of scale. It would be penal on small farmers. Compliance is fairly easy because it is based on a rather obvious capital investment with a strong economic incentive to maximize the use of once it is up and running. Monitoring is possibly a little more difficult in terms of recording the extent of use. Making full allowance for the N in manures when applying fertiliser N There is already some regulatory control over the excessive use of nitrogen fertiliser in addition to manure through the NVZ regulations and baseline agri-environment scheme requirements etc. But that is for exceeding thresholds rather than for fine tuning. This is probably too subtle for either current
52
regulation or payments mechanisms. It is possible to conceive of new measures but they are mostly likely to be too clumsy and inaccurate to be sure of the outcome. Increasing the cost of mineral nitrogen may be a viable option, particularly if it were done in tandem with extension methods (see comments under “improving the management of mineral fertiliser N application” above). Compliance and monitoring would both be difficult because the most successful measures that could be taken are voluntary and rely on farmers being aware of economic benefits. Improved N use plants There are no regulatory mechanisms in place currently that could apply compulsion to the use of plants with improved nitrogen use. There are some payment schemes such as the protein crop supplement but in fact that is being phased out. It is obviously not WTO green box compliant. It would not be hard to conceive of regulatory or incentive approaches that could be applied. The role that extension could play is clearly a large one. It is hard to judge the compliance and monitoring issues without going into the detail of the type of plants and how different they are from other genotypes etc. It could range from quite easy to almost impossible. Avoiding excess N The current regulations in the form of the NVZ rules, baseline agri-environment requirements and quality assurance schemes offer some control already on excessive use of nitrogen. New incentives could be added by funding the equipment for more accurate spreading, better soil and plant analysis, more costly nitrogen etc. None of this is in place at present but new policy instruments could be created. Compliance monitoring will be difficult and extension methods already have some influence and could play a much bigger role. Reduced tillage Existing regulations on soil conservation within cross compliance play some part in encouraging the use of reduced tillage methods. It is also encouraged in a few agri-environment prescriptions, mainly to conserve soil and protect archaeology. It would not be difficult to conceive of both regulatory- and incentive-led policy instruments that could be introduced. Reduced tillage does rely, to an extent, on chemical use and that in turn could be easier with a relaxation of regulations on their use. Adoption of GM technology would also help but is restricted by other regulatory hurdles, consumer attitudes and some quality assurance scheme protocols. In some ways organic farming protocols and practices mitigate against reduced tillage particularly strongly. Cultivation is one of the main tools that organic farmers can use to combat weeds and burying weeds and trash by ploughing is the most effective method. Conventional farmers can use chemicals to control weeds and disease which is almost essential in a minimum tillage (min-till) or no tillage (no-till) regime. The role of extension could be important but it is not as though reduced tillage is something that most arable farmers are ignorant of but that they mainly lack the conditions or the incentive. Compliance would be easily identifiable on the ground and probably detectable by remote sensing. Monitoring could be fairly easy if measures that require compliance are applied. If they are not and it relies on encouragement rather than compulsion or payments then it could be moderately difficult. The abatement potential of reduced tillage is significantly higher in the updated MACC, however it should noted that there is considerable uncertainty regarding the net abatement rate (and therefore abatement potential) of reduced tillage (see section 2.4). It is suggested that inclusion of this measure in the uncertainty analysis is likely to have resulted in the abatement rate in the pessimistic MACC being assumed to be zero. Dairy maize silage The growing and storage of maize on dairy farms could be monitored and if the bulk feed is in place it will most likely be used. Maize can normally only be grown at lower altitudes in the UK and there will be major social and economic issues if the use of maize becomes a requirement rather than an option to be encouraged. Farmers might be forced into adopting measures such as trucking in maize from nearby lowland areas with resulting cost penalties and negative impacts on emissions. The growing of maize for silage was, before 2005, artificially stimulated by the Arable Area Aid payment that it qualified for prior to decoupling. Whilst maize growing could be promoted in the same way again this would not be compliant with WTO green box requirements and would represent a U turn on subsidy decoupling. Extension is likely to be the most practical way of achieving uptake and the support for research into breeding varieties that can be grown successfully in the UK at higher altitudes than has

53
been possible to date. Ironically climate change itself may begin to resolve the necessity for such maize breeding. SlurryMineralNDelayed In principle, separating the application of slurry and of mineral N fertiliser at the same time should lead to a reduction in N2O emissions. While advice outlining the need for the separation of slurry and mineral N could be fairly readily incorporated into existing advice and codes of practice, it is difficult to see how any regulation or payments could be used to encourage uptake, given the difficulties associated with monitoring compliance. This measure assumes that the weather conditions permit the separation of the applications, and that adequate storage is available, which may not always be the case. Nitrification Inhibitors It would not be easy to verify whether or not nitrification inhibitors have been used. Records confirming use could be included within cross-compliance and audited by the inspections process and this could include proof of purchase. The issue therefore is whether if purchased it is fair to assume that they will have been used. Extension on its own is unlikely to result in large scale adoption, given the predicted cost of nitrification inhibitors, however scope for extension based on demonstration would be increased by the provision of a financial incentive. The best scope for financial incentive is probably to subsidise the products via the manufacturers or retailers to artificially lower the cost to the farmer. Species introduction (inc. legumes) Introducing species that fix N or use it more efficiently could be further incentivised through existing agri-environment schemes and compliance would then be monitored enforced as part of the inspections process. This should be a fairly straightforward to comply with but there may be need to review existing prescription requirements. There are agri-environment prescriptions that currently limit the use of legumes as well as those that encourage them or require it (for example the Environmental Stewardship prescription to under sow a grass mixture into a spring cereal crop currently requires a minimum 10% inclusion of clover in the mix). Planting new species could present some technical challenges in the early years of uptake; provision of suitable advisory support should prevent this from being a major problem. Uptake is more likely to be influenced by the net cost/benefit of introducing the new species, i.e. whether the yield losses are compensated for by the reduction in N fertiliser cost. Encouragement of plant breeding, demonstration and advice has major scope to improve uptake and extension is likely to comprise a major part of the solution as to how to get farmers to adopt use of nitrogen fixing plants. Propionate precursors There are plenty of regulatory controls on animal feeds. It would be comparatively easy to implement requirements to label the inclusion of propionate precursors. But not easy or perhaps appropriate to require their inclusion through regulation. There are no payments regimes in place within agri-environment or other areas of agricultural policy to apply encouragement but it would not be too hard to see how this could be done. In as much as there is a production benefit it may be hard to apply payment without falling foul of WTO green box requirements. The role of extension in promoting the use of propionate precursors is potentially very high and might be sufficient without resorting to other measures given the potential economic benefits to the farmer. Ease of compliance in ensuring the use is fairly good given the state of regulation in the animal feed industry and the ability to trace the supply of the products. Similarly with monitoring although with slightly less confidence given that it is harder to ensure supply than use of the products.
54
4. Interactions
An abatement measure can be applied on its own, i.e. stand alone, or in combination with other measures. The stand alone cost-effectiveness (CE) of a measure can be calculated by simply dividing the weighted mean cost (£/ha/y) by the abatement rate (tCO2e/ha/y). However, when measures are applied in combination, they interact and their abatement rates and cost effectiveness change in response to the measures that they combine with. For example, if a farm implements measure A (biological fixation), then less N fertiliser will be required, lessening the extent to which N fertiliser can be reduced (measure B). In the original MACC analysis, the extent to which the efficacy of a measure was reduced (or in some cases, increased) was expressed using an interaction factor (IF):
B measure of rate abatement alone stand
Aafter applied whenB measure of rate abatement (AB) factor nInteractio
When considering potential interactions between two measures, it is also necessary to consider whether one measure enables the second rather than if it directly competes for a direct reduction in the pollutant. For example, the improvement of field drainage would enable spring application of manure and therefore allow for the full impact of the improved manure timing method to be achieved. However, field drainage would not enable improved timing of mineral N fertiliser with respect to crop need. A complication in measuring interactions is uncertainty regarding the extent to which measures overlap. The way measures interact depends on how they abate (which is represented by their interaction factor) and the extent to which they are applied on overlapping areas of land (e.g. on what proportion of hectares across the UK would it be applicable to implement both drainage and improved manure timing). One of the tasks for the MACC update was to review the approach used in the original MACC to determine if there were any refinements that could made within the scope of the project. In order to inform the review, the original MACC approach to interactions was compared with an alternative approach (used in Defra WQ0106 Module 6). 4.1 Comparison of the method used in Defra WQ0106 and the original MACC approach
ADAS modelling of diffuse pollutants (including GHGs) is spatially explicit in Defra WQ0106 Module 6.
6 In this project, mitigation potential is calculated as a proportion of emissions. Emissions are
considered at three levels:
Baseline emissions – pollutant loadings in the absence of any mitigation method implementation using forecasts of land use and livestock with IPCC emission factors.
Prior implementation emissions - account for current levels of uptake of mitigation methods.
Scenarios – percentage changes from the prior emissions of coordinate systems (location and activity).
The pollutant losses are calculated for representative farm types (similar to robust farm types) which were used in the form of export coefficients for each source type and area. National pollutant losses were estimated as the product of the export coefficients and the total potential input within each 10 by 10km
2 grid used in the Business as Usual III project. Mitigation measures addressed were from the
User Manual and coded for applicability via the identification of environmental and farm system constraints. The constraints were applied for each grid cell and expressed as a % of the agricultural land within each cell. Costs were calculated net of any prior implementation. The cost data was re-expressed as per cubic meter of all livestock excreta and managed slurry or FYM, and per hectare of arable, grass or rough grazing to enable scaling up of costs.
6 ADAS (2009), Quantitative Assessment of Scenarios for Managing Trade-Off between the Economic
Performance of Agriculture and the Environment and Between Different Environmental Media

55
The efficacy of each measure was characterised as a percentage reduction of pollutant loss by specific source type, area, and pathway on each farm type and based upon literature reviews, and expert judgement. Given the variation in the reported mitigation values, an indicator scale of effectiveness was developed with an average value surrounded by an uncertainty range. Rules tables were used to make explicit the sources and areas affected by the measure. Both the literature and the expert opinion relate to stand alone efficacy. WQ0106 developed a simple algorithm to adjust efficacy when multiple measures are applied. For modelling tractability it assumes maximum overlap i.e. if two measures apply to 50% and 20% of area respectively, 20% has both applied and 30% just one. The net effect is a weighted sum of the combined effectiveness values. To estimate of levels of prior implementation, expert opinion was utilised with a limited evidence base (e.g. Farm Practices Survey, data on farmer recommendations). As with the levels of efficacy in order to recognise the inherent uncertainty, an indicator scale with ranges was used. Separate levels of uptake were estimated for farms within NVZ areas and CSF priority catchments.
ADAS interaction – combines efficacy values with the net weighted efficacy % applied to total emissions. Efficacy determined by literature and expert opinion. SAC MACC Interaction Factors - reduce abatement rates (tonnes of CO2e/hectare) by proportion
determined by expert opinion.
A spreadsheet illustrating the approach is shown in Appendix E. Limitations of the approaches:
Data: Both have to rely on expert opinion given the relative paucity of both experimental and survey data
The ADAS interaction method is clearer but does not provide a rationale for the relative degradation in efficacy.
All methods interact equally (according to overlap and efficacy) in the ADAS method. However, mitigation measures are applied according to rules and therefore “inappropriate” interactions are avoided (preventing the SAC MACC issue whereby some measures appear too far to the right of the overall MACC). That is, measures only interact if they target the same source type (fertiliser, excreta, soil and manure) of GHG.
The SAC method is less clear but does provide a “story” behind two-way interactions. However, discussions on the nature of the interactions have highlighted the complexity, natural variability, and uncertainty inherent. As such, such “stories” could easily mislead.
4.2 Indentifying key interactions, and revision of the interaction factors used in the SAC MACC1
This section reports the findings of an independent review undertaken by experts not involved in the original MACC project. Method Assessment - First Stage An initial run through the mitigation methods under consideration identified those that were considered to interact at a high (H), medium (M), or small level (S). The matrix below represents initial thoughts on those interactions that may be significant. Those indicated by a * mean that it is considered unlikely that these measures would be applied at the same time, but if they were, there would be a high level of interaction. Those cells coloured in yellow are those that had some an interaction factor applied in the initial MACC report but for which we can see limited rationale.

56
Table 4.1 Initial assessment of interactions
Some examples of interactions: a. The combination of 'Reduced Tillage' and making 'Full Allowance of Manure Nitrogen' is marked
with an H* - indicating strong interaction. The '*' is because we believe that application of manures to arable land requires ploughing down of the manure before cultivation for the next crop, and is therefore not compatible with reduced tillage. The score could be reduced to an 'M*' if we believed that manures were spread only every 3-4 years.
b. Similarly, the methods 'Separate Slurry / Fertiliser Application Times' and 'Use FYM Composts
Instead of Slurries' ought to be incompatible as they depend on different manure handling strategies, so the combination was marked with an 'H*'.
c. The 'Improved Timing of Organic Nitrogen' and making 'Full Allowance of Manure Nitrogen was
marked as an 'H' because improved timing (preferably moving manure applications from autumn to spring to avoid leaching) is the key enabling mechanism to allow making full allowance of manure nitrogen. We see them as a single method of improved manure management.
Method Assessment - Second Stage The original SAC estimates of absolute method impact were variable. For example, 'Improved Drainage' would conserve 1.0t CO2e/yr whilst the 'Improved Timing of Organic Nitrogen' would conserve 0.3t CO2e/yr (Table Annex B4). These figures implied that the methods were targeting - to some extent - different potential emission sources. In this case, improved timing of organic nitrogen would potentially conserve only the N2O associated with the organic nitrogen addition; but improved drainage would potential reduce losses from the turnover of the much larger soil nitrogen pool, and reduce indirect losses from leached fertiliser and organic nitrogen applications. Therefore, even though the first assessment stage awarded this combination a medium 'M' level of interaction (because the improved drainage enables the improved timing), the level of interaction had to be reduced to reflect the fact that they were not targeting the same pools. Therefore, the interaction mark was revised to an 'S'. Extending this logic to the rest of the interactions produces the following interactions matrix.
Dra
ina
ge
Min
era
l N
Ion
op
ho
res
Org
an
ic N
Da
iry im
pro
ve
d
pro
du
ctiv
ity a
nd
fertility
An
ae
rob
ic d
ige
stio
n
Fu
ll ma
nu
re
Imp
rove
d N
use
pla
nts
Avo
idin
g e
xce
ss N
Da
iry m
aiz
e s
ilag
e
Use
FY
M/c
om
po
sts
inste
ad
of s
lurrie
s
Re
du
ce
d tilla
ge
Se
pa
rate
slu
rry/ m
an
ure
Be
ef im
pro
ve
d
pro
du
ctiv
ity a
nd
fertility
Improved Drainage over None
Timing of Bagged N
Ionophores
Timing of Organic N MDairy improved productivity and fertility
Anaerobic digestion
Full manure M HImproved N use plants
Avoiding excess N M M S SDairy maize silage
Use FYM/composts instead of slurries SReduced tillage S H* H* H*Separate slurry/ fertiliser application times N* H*Beef improved productivity and fertility

57
Table 4.2Amended assessment of interactions
Imp
roved d
rain
age
Tim
ing o
f bagged (
min
era
l)
N
Ionophore
s
Tim
ing o
f org
anic
N
Dairy -
im
pro
ved
pro
ductivity/fert
ility
Anaero
bic
dig
estio
n
Ma
kin
g f
ull
allo
wance f
or
ma
nure
N
Imp
roved N
use p
lants
Avoid
ing e
xcess N
Dairy m
aiz
e s
ilage
Use F
YM
/com
posts
inste
ad
of slu
rrie
s
Reduced t
illa
ge
Separa
te s
lurr
y/ fe
rtili
ser
applic
atio
n t
ime
s
Beef
- im
pro
ved
pro
ductivity/fert
ility
Improved drainage
Timing of bagged (mineral) N
Ionophores
Timing of organic N S
Dairy - improved productivity/fertility
Anaerobic digestion
Full allowance for manure N S H
Improved N use plants
Avoiding excess N M M S S
Dairy maize silage
Use FYM/composts instead of slurries S
Reduced tillage N H* H* H*
Separate slurry fertiliser application H*
Beef - improved productivity/fertility
These revised scores were then translated into numbers (see Table 4.3). As we felt 'H' and especially 'H*' genuinely meant substantial competition for effect (or incompatible methods) the interaction factor had to be set very low at 0.2; which led to the scoring of 'M' as 0.5 and 'S' as 0.8 (remember that these factors are multiplied against the SAC absolute abatement effect numbers). Some specific interaction pairings
Drainage and reduced tillage. No interaction because they are targeting different emissions and have widely different scales of magnitude.
Avoid excess N application and N timing. The question is whether excess N can be avoided by improved timing of N application, but it is quite possible to avoid application of excess N and still get the timing wrong, hence we have assigned a medium value.
Full allowance for manure depends on timing, so the two methods will have a large overlap.
Reduced tillage and organic N and Full Allowance for Manure. Little competition since organic N as FYM needs to be cultivated in, so applies to ploughed land for spring crops only. Therefore the score was set to high because both operations would not be carried out in the same field.
Separate slurry/fertiliser application times and use FYM/composts instead of slurries. In this case, the two methods are mutually exclusive.

58
Use FYM/composts Instead of Slurries and Reduced Till. If reduced tillage is used, there is little opportunity to apply FYM/composts in place of slurries.
Table 4.3 Revisions made to the original IFs
First measure Second measure Previous New Reason
Full manure Drainage 0.9 0.8 See previous
Separate slurry from mineral N
Avoiding N excess 0.9 1 No interaction
Reduced tillage Avoiding N excess 0.9 1 No interaction
Using composts Avoiding N excess 0.9 1 No interaction
Avoiding N excess Full manure 0.9 0.8 See previous
Separate slurry from mineral N
Full manure 0.9 1 No interaction
Avoid N excess Improving min N timing
0.9 0.6 See previous
Full manure Improving min N timing
0.6 1 No interaction
Separate slurry from mineral N
Improving min N timing
0.6 1 No interaction
Avoiding N excess Improving organic N timing
0.9 0.5 See previous
Full manure Improving organic N timing
0.55 0.2 See previous
Separate slurry from mineral N
Improving organic N timing
0.6 1 No interaction
Using composts Improving organic N timing
0.75 0.9 Low interaction
Avoid N excess Improved N use plants 1 0.9 Low interaction
Reduce N fertiliser Using composts 0.9 1 No interaction
Separate slurry from mineral N
Using composts 0.75 1 No interaction
4.3 Interactions between crops/soils methods and livestock measures
As a general statement, any measure that affects the volume of excreta is likely to affect other measures. For example, increased efficiency of feeding or improved breeding may reduce the number of dairy replacements. This will in turn reduce the amount of excreta produced per unit of production, reduce the head of livestock and hence the gain from achieving better management of manures in terms of making full use and timing. Another example would be use of bST. If more milk is produced per unit of feed, this will reduce N in the excreta and hence the gain from taking full account of manure N and organic N timing. A third example would be covering slurry tanks/lagoons. First, covering slurry stores/lagoons may reduce emissions and increase the efficacy of making full use of manures and better timing. Second, however, there will be some pollution swapping from reduced ammonia losses in store and potentially increased losses once spread. Third, this MM prevents entry of rain and hence may help with organic N timing. These appear to be the limit of any interactions between crops/soils measures and livestock measures, but in any case, the values are likely to be small. 4.4 Refining the analysis of interactions between measures
Issue with the original method The original MACCs were calculated using the approach to interactions outlined in Moran et al. (2008), MacLeod et al. (2010a). One of the key features of this approach is that an assumption has to be made regarding the extent to which measures overlap. For example, 2 measures that are applicable to 30% of grassland could: (a) be applicable to the same 30% of land (i.e. overlap 100%);

59
(b) be applicable to two different 30%‟s (i.e. overlap 0%); or (c) partially overlap. In the original study, it was assumed that all measures overlapped by 50%, regardless of the area of land to which they were applicable. There are two problems with this: (a) if measure A applies to an area smaller than B, then overlap is impossible on the area B-A; (b) it is likely that as the areas two measures are assumed to be applicable to decrease, then the chance of two measures being applied to the same area decreases, i.e. the % overlap should decrease as the area of applicability decreases. This is particularly important for the revised pessimistic MACCs, where the areas of applicability are much smaller than they are in the MACC1 or optimistic MACC2; using the same interaction factor and overlap rate for the optimistic and pessimistic scenarios is likely to overestimate the extent to which measures interact, and consequently underestimate the abatement potential and cost-effectiveness, particularly in the pessimistic scenario. In order to address this, the interactions factors were adjusted to reflect the areas measures are applied to. Revised approach The IF‟s for the optimistic and pessimistic MACCs were adjusted based on the following assumptions:
1. If AREAA AREAB, then IFAB IFBA
2. If AREAA AREAB, then IFAB only applies to AREAA of measure B, the IF for the remaining area of B, AREAB-A = 1, i.e. there is no interaction.
3. Where the measures do overlap, for the pessimistic MACC it is assumed that there is 100% overlap, but for the optimistic MACC it is assumed that the areas are randomly distributed.
Example Measure A is applicable to 10% of grassland (0.1) Measure B is applicable to 30% of grassland (0.3) IFold based on the old method = 0.8 Pessimistic IFopt = ((AREAA x IFold) + (AREAB-A x 1))/AREAB = ((0.1x 0.8) + (0.2 x 1))/0.3 = 0.93
Optimistic IFpess = (((AREAA x AREAB) x IFold) + ((AREAB – (AREAA x AREAB)) x 1))/AREAB = (((0.1 x 0.3) x 0.8) + ((0.3 – (0.1 x 0.3)) x 1))/0.3 = (0.024 + 0.27)/0.3 = 0.98 Results The abatement potentials achievable for <£100/tCO2e for the optimistic and pessimistic scenarios are compared for the old and new interactions methods in Table 4.4. There are significant increases in the AP for both optimistic and pessimistic MACCs. Increases are particularly marked for measures to the RHS of the MACC, which previously had their AR and CE underestimated. The differences are more marked on the pessimistic MACC where the assumed areas of applicability are lower. Table 4.4 Comparison of AP using old and new interactions method
MACC (all maximum technical potential, 2022, private discount rate)
Abatement Potential for measures costing <£100/tCO2e (excl. forestry) (ktCO2e)
Old interactions method New interactions method
MACC1 17.50 -
MACC2 – Optimistic 15.64 18.89
MACC2 – Pessimistic 5.74 8.62
Table 4.5 lists the abatement potential for measures costing <£100/tCO2e for 2022. In the optimistic MACC, most of the change is due to the increased AP of nitrification inhibitors, and the improved cost-effectiveness of species introduction from £194 to £72/tCO2e, which brings it under the £100
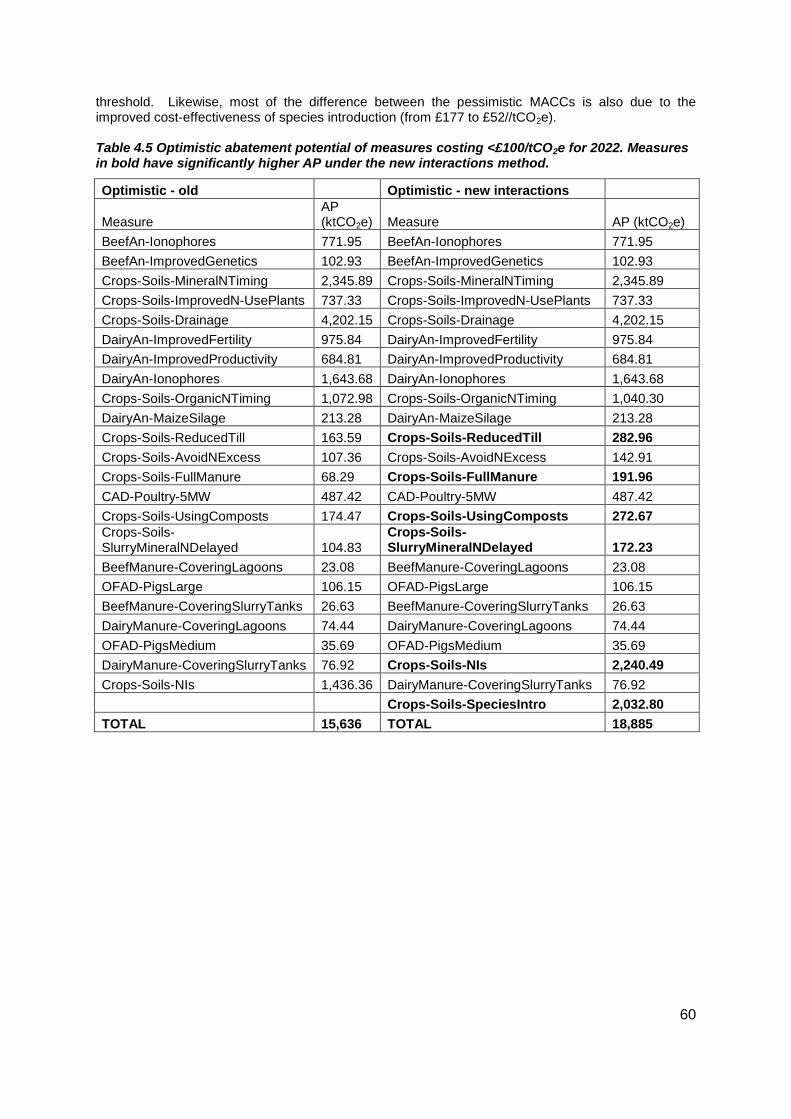
60
threshold. Likewise, most of the difference between the pessimistic MACCs is also due to the improved cost-effectiveness of species introduction (from £177 to £52//tCO2e). Table 4.5 Optimistic abatement potential of measures costing <£100/tCO2e for 2022. Measures in bold have significantly higher AP under the new interactions method.
Optimistic - old
Optimistic - new interactions
Measure AP (ktCO2e) Measure AP (ktCO2e)
BeefAn-Ionophores 771.95 BeefAn-Ionophores 771.95
BeefAn-ImprovedGenetics 102.93 BeefAn-ImprovedGenetics 102.93
Crops-Soils-MineralNTiming 2,345.89 Crops-Soils-MineralNTiming 2,345.89
Crops-Soils-ImprovedN-UsePlants 737.33 Crops-Soils-ImprovedN-UsePlants 737.33
Crops-Soils-Drainage 4,202.15 Crops-Soils-Drainage 4,202.15
DairyAn-ImprovedFertility 975.84 DairyAn-ImprovedFertility 975.84
DairyAn-ImprovedProductivity 684.81 DairyAn-ImprovedProductivity 684.81
DairyAn-Ionophores 1,643.68 DairyAn-Ionophores 1,643.68
Crops-Soils-OrganicNTiming 1,072.98 Crops-Soils-OrganicNTiming 1,040.30
DairyAn-MaizeSilage 213.28 DairyAn-MaizeSilage 213.28
Crops-Soils-ReducedTill 163.59 Crops-Soils-ReducedTill 282.96
Crops-Soils-AvoidNExcess 107.36 Crops-Soils-AvoidNExcess 142.91
Crops-Soils-FullManure 68.29 Crops-Soils-FullManure 191.96
CAD-Poultry-5MW 487.42 CAD-Poultry-5MW 487.42
Crops-Soils-UsingComposts 174.47 Crops-Soils-UsingComposts 272.67
Crops-Soils-SlurryMineralNDelayed 104.83
Crops-Soils-SlurryMineralNDelayed 172.23
BeefManure-CoveringLagoons 23.08 BeefManure-CoveringLagoons 23.08
OFAD-PigsLarge 106.15 OFAD-PigsLarge 106.15
BeefManure-CoveringSlurryTanks 26.63 BeefManure-CoveringSlurryTanks 26.63
DairyManure-CoveringLagoons 74.44 DairyManure-CoveringLagoons 74.44
OFAD-PigsMedium 35.69 OFAD-PigsMedium 35.69
DairyManure-CoveringSlurryTanks 76.92 Crops-Soils-NIs 2,240.49
Crops-Soils-NIs 1,436.36 DairyManure-CoveringSlurryTanks 76.92
Crops-Soils-SpeciesIntro 2,032.80
TOTAL 15,636 TOTAL 18,885

61
Table 4.6 Pessimistic abatement potential of measures costing <£100/tCO2e for 2022. Measures in bold have significantly higher AP under the new interactions method.
Pessimistic - old
Pessimistic - new interactions Measure AP Measure AP
BeefAn-PropionatePrecursors 565.88 BeefAn-PropionatePrecursors 565.88
BeefAn-ImprovedGenetics 102.93 BeefAn-ImprovedGenetics 102.93
DairyAn-ImprovedProductivity 456.47 DairyAn-ImprovedProductivity 456.47
DairyAn-ImprovedFertility 764.77 DairyAn-ImprovedFertility 764.77
DairyAn-MaizeSilage 213.28 DairyAn-MaizeSilage 213.28
Crops-Soils-ReducedTill 314.75 Crops-Soils-ReducedTill 314.75
Crops-Soils-MineralNTiming 368.17 Crops-Soils-MineralNTiming 357.56
Crops-Soils-OrganicNTiming 262.98 Crops-Soils-OrganicNTiming 427.21
DairyAn-PropionatePrecursors 1,468.85 DairyAn-PropionatePrecursors 1,468.85
CAD-Poultry-5MW 487.42 CAD-Poultry-5MW 487.42
Crops-Soils-AvoidNExcess 4.26 Crops-Soils-AvoidNExcess 4.73
Crops-Soils-UsingComposts 193.86 Crops-Soils-UsingComposts 237.09
Crops-Soils-SlurryMineralNDelayed 194.13 Crops-Soils-SlurryMineralNDelayed 171.97
BeefManure-CoveringLagoons 23.08 BeefManure-CoveringLagoons 23.08
OFAD-PigsLarge 106.15 OFAD-PigsLarge 106.15
BeefManure-CoveringSlurryTanks 26.63 BeefManure-CoveringSlurryTanks 26.63
DairyManure-CoveringLagoons 74.44 DairyManure-CoveringLagoons 74.44
OFAD-PigsMedium 35.69 OFAD-PigsMedium 35.69
DairyManure-CoveringSlurryTanks 76.92 Crops-Soils-SpeciesIntro 2,702.97
DairyManure-CoveringSlurryTanks 76.92
TOTAL 5,741 TOTAL 8,619
The main improvement to the interactions approach in this analysis is a revision to the way in which interactions are taken into account. The method employed in the December 2008 MACC assessment is likely to have significantly overestimated the extent to which certain mitigation measures interacted (particularly those that apply to small areas or are less cost-effective, such as species introduction) thus biasing the results against these measures and reducing the calculated abatement potential. The revised method has reduced this bias but it is clear that opportunities remain for significant improvements to interactions calculations, notably:
An improved understanding of which measures are likely to coincide.
Field scale trials to measure interactions between pairs and packages of methods.
Identification of cost interactions to avoid double counting of mitigation costs.

62
5. Farm specific analysis
This section reports on the qualitative assessment of the applicability of the mitigation measures across the six UK super regions and robust farm types. The regions considered are: England West, England East, England North, Wales, Scotland and Northern Ireland as illustrated in Figure 5.1. This assessment was done in parallel with the update of the MACCs, i.e. it was not used to revise the assumptions underpinning the MACCs, rather it is intended to aid the interpretation of the MACCs by providing a preliminary assessment of how the abatement potential might vary by farm type, location and size. The applicability of measures was assessed in terms of farm type and size and these were then applied across the different regions. Across all regions measures were mostly applicable to large farms. Differences between regions reflected the regional distribution of farm types. Measures were applicable to dairy in the west and north of the UK; mixed farms in the south and Scotland; and general cropping in the east and north.
Figure 5.1 Map of UK super regions (Map data Crown Copyright)
The following farm types are considered:
Cereals
General cropping
Horticulture
Specialist pigs
Specialist poultry
Dairy
Grazing livestock (LFA)
Grazing livestock (lowland)
Mixed The distinction between LFA and lowland grazing livestock is retained and is assumed to be a reasonable proxy measure for the intensity of production; in turn this will affect the applicability of measures such as manure management and use of feed additives.

63
5.1 Applicability of measures to farm types
The first task was the assessment of the applicability of each measure to each of the farm types. This was undertaken on a qualitative basis with measures with the highest applicability scoring 3 with moderate applicability scoring 2, minimal applicability scores 1, and no applicability receiving no score. These scores are ordinal and do not reflect any quantitative differences between measures or farm types. Table 5.1 presents the results of this initial assessment and indicates that there is a similar applicability of measures across the mixed and arable farm types largely relating to greater efficiency in fertiliser use. There is also a great deal of similarity between the two assumed intensive ruminant types (dairy and lowland grazing livestock) where there is the opportunity for manure management measures; there is less opportunity for such measures in extensive systems (LFA livestock) due to the lower use of animal housing and the greater number of sheep associated with these systems. Specialist pigs and poultry farms are only associated with anaerobic digestion, although it is possible that such holdings also have integrated arable activities. 5.2 Characterisation of regions by farm type
The original and update MACCs for agriculture consider the abatement potential for measures across the UK as a whole. However, specialisation in agriculture and environmental differences means that farm types are not evenly distributed across the UK. Instead some degree of regional specialisation occurs. In order to assess the regional applicability of measures it is first necessary to characterise the farm types associated with each region. Table 5.2 shows the percentage of UK holdings of each farm type across the six super regions. The data indicate that there is a high representation of most farm types (excepting LFA livestock) in the West and East of England, with a higher representation of arable farm types in the East and livestock types in the West. The North of England also has a range of farm types including just under a quarter of specialist pigs holdings and a fifth of dairy holdings. The most prominent farm type in Wales, Scotland and Northern Ireland is LFA livestock. Scotland also has a fifth of general cropping holdings and moderate representation in cereals, poultry and mixed farms. In addition to just over a quarter of LFA livestock holdings, Northern Ireland also has a fifth of dairy holdings. Appendix G outlines the methodology and results of the qualitative combinations of measure applicability across farm types and region. Table 5.1 Qualitative assessment of measure applicability across farm types.
Measure Farm type
Cere
als
Gen
era
l
cro
ppin
g
Hort
icultu
re
Specia
list
pig
s
Specia
list
poultry
Dairy
Gra
zin
g
livesto
ck
(LF
A)
Gra
zin
g
livesto
ck
(low
land
)
Mix
ed
Improving the drainage of agricultural land 3 3 3 2 1 2 3
Improved management of mineral fertiliser N application
3 3 3 2 2 2 3
Ionophores 3 1 2
Improved management of manure/slurry N application
2 2 2 3 1 3 2
Dairy improved productivity and fertility 3
Anaerobic digestion 2 2 3 3 2
Making a full allowance for the N supplied in manures when deciding on the amounts of fertiliser-N to apply to a crop
2 2 2 3 1 3 3
Improved N use plants 3 3 3 1 1 3
Avoiding excess N 3 3 3 2 1 2 3
Dairy maize silage 3
Use FYM/composts instead of slurries 2 2 2 3 3 3
Reduced tillage 3 3 3 3
Separate slurry/ manure applications from fertiliser applications by several days
2 2 2 3 3 3
Beef improved productivity and fertility 2 3
Nitrification inhibitors 3 3 3 3 2 3 3
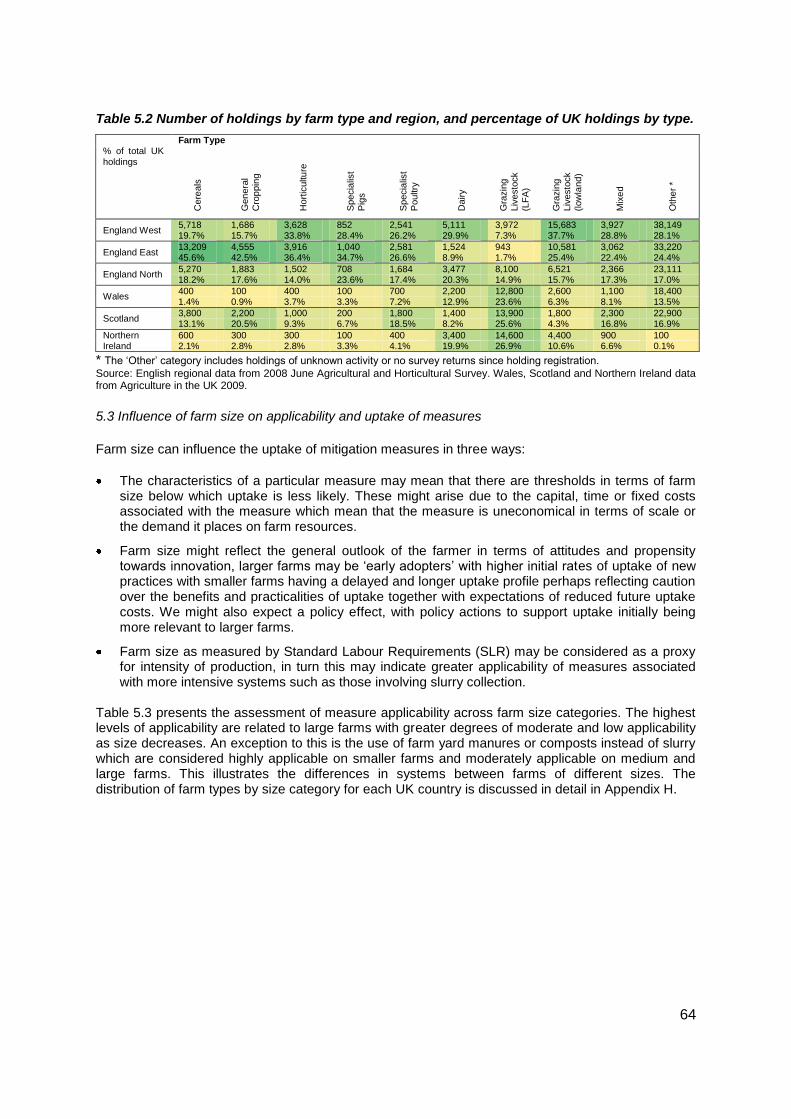
64
Table 5.2 Number of holdings by farm type and region, and percentage of UK holdings by type.
Farm Type % of total UK holdings
Cere
als
Gen
era
l
Cro
ppin
g
Hort
icultu
re
Specia
list
Pig
s
Specia
list
Poultry
Dairy
Gra
zin
g
Liv
esto
ck
(LF
A)
Gra
zin
g
Liv
esto
ck
(low
land
)
Mix
ed
Oth
er
*
England West 5,718 1,686 3,628 852 2,541 5,111 3,972 15,683 3,927 38,149 19.7% 15.7% 33.8% 28.4% 26.2% 29.9% 7.3% 37.7% 28.8% 28.1%
England East 13,209 4,555 3,916 1,040 2,581 1,524 943 10,581 3,062 33,220 45.6% 42.5% 36.4% 34.7% 26.6% 8.9% 1.7% 25.4% 22.4% 24.4%
England North 5,270 1,883 1,502 708 1,684 3,477 8,100 6,521 2,366 23,111 18.2% 17.6% 14.0% 23.6% 17.4% 20.3% 14.9% 15.7% 17.3% 17.0%
Wales 400 100 400 100 700 2,200 12,800 2,600 1,100 18,400 1.4% 0.9% 3.7% 3.3% 7.2% 12.9% 23.6% 6.3% 8.1% 13.5%
Scotland 3,800 2,200 1,000 200 1,800 1,400 13,900 1,800 2,300 22,900 13.1% 20.5% 9.3% 6.7% 18.5% 8.2% 25.6% 4.3% 16.8% 16.9%
Northern Ireland
600 300 300 100 400 3,400 14,600 4,400 900 100 2.1% 2.8% 2.8% 3.3% 4.1% 19.9% 26.9% 10.6% 6.6% 0.1%
* The „Other‟ category includes holdings of unknown activity or no survey returns since holding registration.
Source: English regional data from 2008 June Agricultural and Horticultural Survey. Wales, Scotland and Northern Ireland data from Agriculture in the UK 2009.
5.3 Influence of farm size on applicability and uptake of measures
Farm size can influence the uptake of mitigation measures in three ways:
The characteristics of a particular measure may mean that there are thresholds in terms of farm size below which uptake is less likely. These might arise due to the capital, time or fixed costs associated with the measure which mean that the measure is uneconomical in terms of scale or the demand it places on farm resources.
Farm size might reflect the general outlook of the farmer in terms of attitudes and propensity towards innovation, larger farms may be „early adopters‟ with higher initial rates of uptake of new practices with smaller farms having a delayed and longer uptake profile perhaps reflecting caution over the benefits and practicalities of uptake together with expectations of reduced future uptake costs. We might also expect a policy effect, with policy actions to support uptake initially being more relevant to larger farms.
Farm size as measured by Standard Labour Requirements (SLR) may be considered as a proxy for intensity of production, in turn this may indicate greater applicability of measures associated with more intensive systems such as those involving slurry collection.
Table 5.3 presents the assessment of measure applicability across farm size categories. The highest levels of applicability are related to large farms with greater degrees of moderate and low applicability as size decreases. An exception to this is the use of farm yard manures or composts instead of slurry which are considered highly applicable on smaller farms and moderately applicable on medium and large farms. This illustrates the differences in systems between farms of different sizes. The distribution of farm types by size category for each UK country is discussed in detail in Appendix H.

65
Table 5.3 Applicability of measures across farm size categories
Very small (<1 SLR)
Small (1 to 2 SLR)
Medium (2 to 3 SLR)
Large (>3 SLR)
Improving the drainage of agricultural land 2 2 3 3
Improved management of mineral fertiliser N application 2 2 3 3
Ionophores 1 1 2 3
Improved management of manure/slurry N application 2 2 3 3
Dairy improved productivity and fertility 1 1 2 3
Anaerobic digestion 1 1 2 3
Making a full allowance for the N supplied in manures when deciding on the amounts of fertiliser-N to apply to a crop
1 2 2 3
Improved N use plants 1 2 3 3
Avoiding excess N 2 2 3 3
Dairy maize silage 1 1 2 3
Use FYM/composts instead of slurries 3 3 2 2
Reduced tillage 1 1 2 3
Separate slurry/ manure applications from fertiliser applications by several days
2 2 3 3
Beef improved productivity and fertility 1 1 2 3
Nitrification inhibitors 2 3 3 3
5.4 Combining farm type, size and region
The final stage of the regional assessment is the combination of measures with farm types, farm size and region. This was achieved by interacting the results of the assessment of measures by farm type and region with the applicability of measures by farm size and characterisation of farm size and type. Data on farm type and size was not available for the three English regions so the aggregate characterisation for England was assumed to be representative of the structure within each region. As with the preceding assessments, this exercise is essentially qualitative and uses a simple scoring method to allow interaction between different characteristics. Table 5.4 to 5.9 present the results of the assessment for each region and include the applicability of each measure for each size category of each farm type. Across all regions large farms are indicated as having the highest level of applicability. This applicability to large farms is generally consistent across all measures with the exception of using farm yard manures or composting instead of slurry systems, which is more applicable to smaller holdings, particularly in cereals or lowland grazing livestock types. In terms of applicability of measures to farm type, across the measures this is generally highest for general cropping (except in England West and North), horticulture (except in England East and North), dairy (except in England East) and mixed farms in England West and East. Applicability tends to be moderate across measures in cereals and lowland grazing livestock and low in LFA grazing livestock.

66
Table 5.4 Applicability of mitigation measures by farm type and size in the England West region
Cereals General
Cropping Horticulture Specialist Pigs Specialist
Poultry Dairy Grazing
Livestock (LFA)
Grazing Livestock (lowland)
Mixed
VS
S M L VS
S M L VS
S M L VS
S M L VS
S M L VS
S M L VS
S M L VS
S M L VS
S M L
Improving the drainage of agricultural land 1 1 1 2 1 1 1 2 1 1 1 3 1 1 1 2 1 1 1 1 1 1 1 1 1 1 1 3
Improved management of mineral fertiliser N application 1 1 1 2 1 1 1 2 1 1 1 3 1 1 1 2 1 1 1 1 1 1 1 1 1 1 1 3
Ionophores 1 1 1 3 1 1 1 1 1 1 1 1
Improved management of manure/slurry N application 1 1 1 2 1 1 1 2 1 1 1 2 1 1 1 3 1 1 1 1 1 1 1 1 1 1 1 2
Dairy improved productivity and fertility 1 1 1 3
Anaerobic digestion 1 1 1 2 1 1 1 2 1 1 1 3 1 1 1 1 1 1 1 2
Making a full allowance for the N supplied in manures when deciding on the amounts of fertiliser-N to apply to a crop
1 1 1 2 1 1 1 2 1 1 1 2 1 1 1 3 1 1 1 1 1 1 1 1 1 1 1 3
Improved N use plants 1 1 1 2 1 1 1 2 1 1 1 3 1 1 1 1 1 1 1 1 1 1 1 3
Avoiding excess N 1 1 1 2 1 1 1 2 1 1 1 3 1 1 1 2 1 1 1 1 1 1 1 1 1 1 1 3
Dairy maize silage 1 1 1 3
Use FYM/composts instead of slurries 1 2 1 1 1 1 1 2 1 1 1 2 1 1 1 2 2 1 1 1 1 1 1 2
Reduced tillage 1 1 1 2 1 1 1 2 1 1 1 3 1 1 1 3
Separate slurry/ manure applications from fertiliser applications by several days
1 1 1 2 1 1 1 2 1 1 1 2 1 1 1 3 1 1 1 1 1 1 1 3
Beef improved productivity and fertility 1 1 1 1 1 1 1 1
Nitrification inhibitors 1 2 1 2 1 1 1 2 1 1 1 3 1 1 1 3 1 1 1 1 1 1 1 1 1 1 1 3
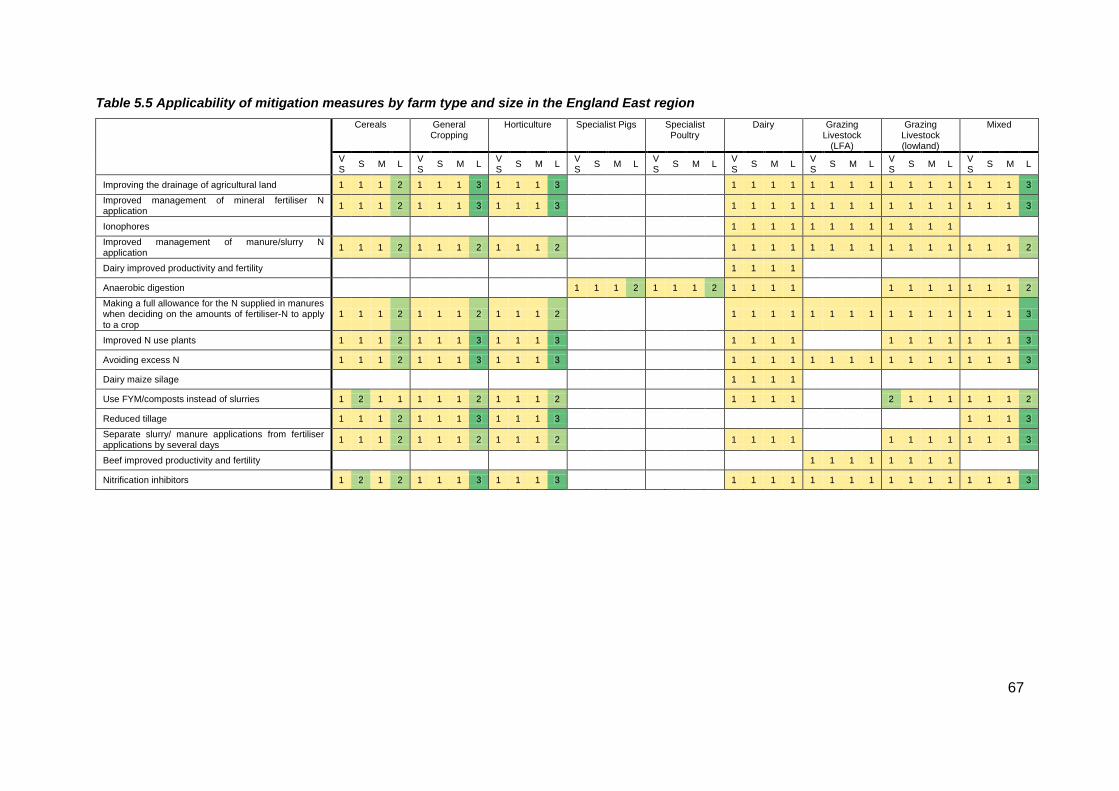
67
Table 5.5 Applicability of mitigation measures by farm type and size in the England East region
Cereals General
Cropping Horticulture Specialist Pigs Specialist
Poultry Dairy Grazing
Livestock (LFA)
Grazing Livestock (lowland)
Mixed
VS
S M L VS
S M L VS
S M L VS
S M L VS
S M L VS
S M L VS
S M L VS
S M L VS
S M L
Improving the drainage of agricultural land 1 1 1 2 1 1 1 3 1 1 1 3 1 1 1 1 1 1 1 1 1 1 1 1 1 1 1 3
Improved management of mineral fertiliser N application
1 1 1 2 1 1 1 3 1 1 1 3 1 1 1 1 1 1 1 1 1 1 1 1 1 1 1 3
Ionophores 1 1 1 1 1 1 1 1 1 1 1 1
Improved management of manure/slurry N application
1 1 1 2 1 1 1 2 1 1 1 2 1 1 1 1 1 1 1 1 1 1 1 1 1 1 1 2
Dairy improved productivity and fertility 1 1 1 1
Anaerobic digestion 1 1 1 2 1 1 1 2 1 1 1 1 1 1 1 1 1 1 1 2
Making a full allowance for the N supplied in manures when deciding on the amounts of fertiliser-N to apply to a crop
1 1 1 2 1 1 1 2 1 1 1 2 1 1 1 1 1 1 1 1 1 1 1 1 1 1 1 3
Improved N use plants 1 1 1 2 1 1 1 3 1 1 1 3 1 1 1 1 1 1 1 1 1 1 1 3
Avoiding excess N 1 1 1 2 1 1 1 3 1 1 1 3 1 1 1 1 1 1 1 1 1 1 1 1 1 1 1 3
Dairy maize silage 1 1 1 1
Use FYM/composts instead of slurries 1 2 1 1 1 1 1 2 1 1 1 2 1 1 1 1 2 1 1 1 1 1 1 2
Reduced tillage 1 1 1 2 1 1 1 3 1 1 1 3 1 1 1 3
Separate slurry/ manure applications from fertiliser applications by several days
1 1 1 2 1 1 1 2 1 1 1 2 1 1 1 1 1 1 1 1 1 1 1 3
Beef improved productivity and fertility 1 1 1 1 1 1 1 1
Nitrification inhibitors 1 2 1 2 1 1 1 3 1 1 1 3 1 1 1 1 1 1 1 1 1 1 1 1 1 1 1 3

68
Table 5.6 Applicability of mitigation measures by farm type and size in the England North region
Cereals General
Cropping Horticulture Specialist Pigs Specialist
Poultry Dairy Grazing
Livestock (LFA)
Grazing Livestock (lowland)
Mixed
VS
S M L VS
S M L VS
S M L VS
S M L VS
S M L VS
S M L VS
S M L VS
S M L VS
S M L
Improving the drainage of agricultural land 1 1 1 2 1 1 1 2 1 1 1 2 1 1 1 2 1 1 1 1 1 1 1 1 1 1 1 2
Improved management of mineral fertiliser N application
1 1 1 2 1 1 1 2 1 1 1 2 1 1 1 2 1 1 1 2 1 1 1 1 1 1 1 2
Ionophores 1 1 1 3 1 1 1 1 1 1 1 1
Improved management of manure/slurry N application
1 1 1 2 1 1 1 2 1 1 1 2 1 1 1 3 1 1 1 1 1 1 1 1 1 1 1 2
Dairy improved productivity and fertility 1 1 1 3
Anaerobic digestion 1 1 1 2 1 1 1 2 1 1 1 3 1 1 1 1 1 1 1 2
Making a full allowance for the N supplied in manures when deciding on the amounts of fertiliser-N to apply to a crop
1 1 1 2 1 1 1 2 1 1 1 2 1 1 1 3 1 1 1 1 1 1 1 1 1 1 1 2
Improved N use plants 1 1 1 2 1 1 1 2 1 1 1 2 1 1 1 1 1 1 1 1 1 1 1 2
Avoiding excess N 1 1 1 2 1 1 1 2 1 1 1 2 1 1 1 2 1 1 1 1 1 1 1 1 1 1 1 2
Dairy maize silage 1 1 1 3
Use FYM/composts instead of slurries 1 2 1 1 1 1 1 2 1 1 1 2 1 1 1 2 2 1 1 1 1 1 1 2
Reduced tillage 1 1 1 2 1 1 1 2 1 1 1 2 1 1 1 2
Separate slurry/ manure applications from fertiliser applications by several days
1 1 1 2 1 1 1 2 1 1 1 2 1 1 1 3 1 1 1 1 1 1 1 2
Beef improved productivity and fertility 1 1 1 2 1 1 1 1
Nitrification inhibitors 1 2 1 2 1 1 1 2 1 1 1 2 1 1 1 3 1 1 1 2 1 1 1 1 1 1 1 2
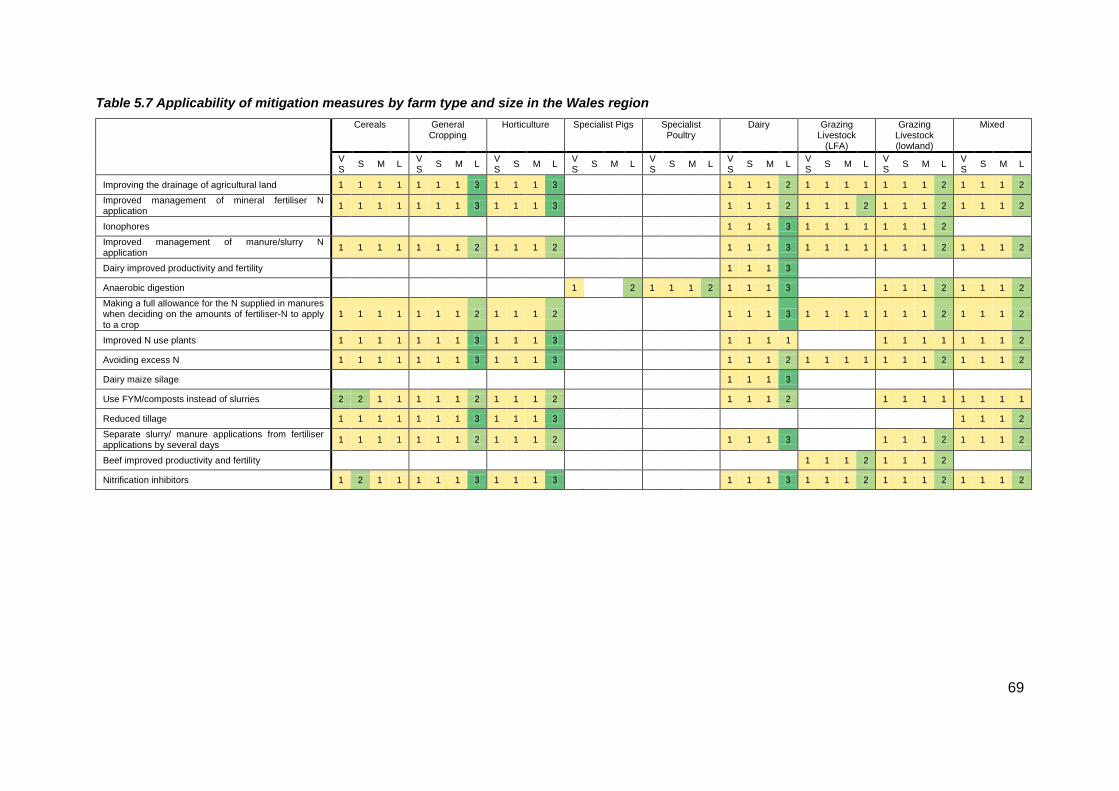
69
Table 5.7 Applicability of mitigation measures by farm type and size in the Wales region
Cereals General
Cropping Horticulture Specialist Pigs Specialist
Poultry Dairy Grazing
Livestock (LFA)
Grazing Livestock (lowland)
Mixed
VS
S M L VS
S M L VS
S M L VS
S M L VS
S M L VS
S M L VS
S M L VS
S M L VS
S M L
Improving the drainage of agricultural land 1 1 1 1 1 1 1 3 1 1 1 3 1 1 1 2 1 1 1 1 1 1 1 2 1 1 1 2
Improved management of mineral fertiliser N application
1 1 1 1 1 1 1 3 1 1 1 3 1 1 1 2 1 1 1 2 1 1 1 2 1 1 1 2
Ionophores 1 1 1 3 1 1 1 1 1 1 1 2
Improved management of manure/slurry N application
1 1 1 1 1 1 1 2 1 1 1 2 1 1 1 3 1 1 1 1 1 1 1 2 1 1 1 2
Dairy improved productivity and fertility 1 1 1 3
Anaerobic digestion 1 2 1 1 1 2 1 1 1 3 1 1 1 2 1 1 1 2
Making a full allowance for the N supplied in manures when deciding on the amounts of fertiliser-N to apply to a crop
1 1 1 1 1 1 1 2 1 1 1 2 1 1 1 3 1 1 1 1 1 1 1 2 1 1 1 2
Improved N use plants 1 1 1 1 1 1 1 3 1 1 1 3 1 1 1 1 1 1 1 1 1 1 1 2
Avoiding excess N 1 1 1 1 1 1 1 3 1 1 1 3 1 1 1 2 1 1 1 1 1 1 1 2 1 1 1 2
Dairy maize silage 1 1 1 3
Use FYM/composts instead of slurries 2 2 1 1 1 1 1 2 1 1 1 2 1 1 1 2 1 1 1 1 1 1 1 1
Reduced tillage 1 1 1 1 1 1 1 3 1 1 1 3 1 1 1 2
Separate slurry/ manure applications from fertiliser applications by several days
1 1 1 1 1 1 1 2 1 1 1 2 1 1 1 3 1 1 1 2 1 1 1 2
Beef improved productivity and fertility 1 1 1 2 1 1 1 2
Nitrification inhibitors 1 2 1 1 1 1 1 3 1 1 1 3 1 1 1 3 1 1 1 2 1 1 1 2 1 1 1 2

70
Table 5.8 Applicability of mitigation measures by farm type and size in the Scotland region
Cereals General
Cropping Horticulture Specialist Pigs Specialist
Poultry Dairy Grazing
Livestock (LFA)
Grazing Livestock (lowland)
Mixed
VS
S M L VS
S M L VS
S M L VS
S M L VS
S M L VS
S M L VS
S M L VS
S M L VS
S M L
Improving the drainage of agricultural land 1 1 1 2 1 1 1 3 1 1 1 3 1 1 1 2 1 1 1 1 1 1 1 2 1 1 1 3
Improved management of mineral fertiliser N application
1 1 1 2 1 1 1 3 1 1 1 3 1 1 1 2 1 1 1 2 1 1 1 2 1 1 1 3
Ionophores 1 1 1 3 1 1 1 1 1 1 1 2
Improved management of manure/slurry N application
1 1 1 2 1 1 1 2 1 1 1 2 1 1 1 3 1 1 1 1 1 1 1 2 1 1 1 2
Dairy improved productivity and fertility 1 1 1 3
Anaerobic digestion 1 1 1 2 1 1 1 2 1 1 1 3 1 1 1 2 1 1 1 2
Making a full allowance for the N supplied in manures when deciding on the amounts of fertiliser-N to apply to a crop
1 1 1 2 1 1 1 2 1 1 1 2 1 1 1 3 1 1 1 1 1 1 1 2 1 1 1 3
Improved N use plants 1 1 1 2 1 1 1 3 1 1 1 3 1 1 1 1 1 1 1 1 1 1 1 3
Avoiding excess N 1 1 1 2 1 1 1 3 1 1 1 3 1 1 1 2 1 1 1 1 1 1 1 2 1 1 1 3
Dairy maize silage 1 1 1 3
Use FYM/composts instead of slurries 2 2 1 1 1 1 1 2 1 1 1 2 1 1 1 2 2 1 1 1 1 1 1 2
Reduced tillage 1 1 1 2 1 1 1 3 1 1 1 3 1 1 1 3
Separate slurry/ manure applications from fertiliser applications by several days
1 1 1 2 1 1 1 2 1 1 1 2 1 1 1 3 1 1 1 2 1 1 1 3
Beef improved productivity and fertility 1 1 1 2 1 1 1 2
Nitrification inhibitors 1 2 1 2 1 1 1 3 1 1 1 3 1 1 1 3 1 1 1 2 1 1 1 2 1 1 1 3

71
Table 5.9 Applicability of mitigation measures by farm type and size in the Northern Ireland region
Cereals General
Cropping Horticulture Specialist Pigs Specialist
Poultry Dairy Grazing
Livestock (LFA)
Grazing Livestock (lowland)
Mixed
VS
S M L VS
S M L VS
S M L VS
S M L VS
S M L VS
S M L VS
S M L VS
S M L VS
S M L
Improving the drainage of agricultural land 1 1 1 1 1 1 1 3 1 1 1 3 1 1 1 2 1 1 1 1 2 1 1 1 1 1 1 2
Improved management of mineral fertiliser N application
1 1 1 1 1 1 1 3 1 1 1 3 1 1 1 2 2 1 1 1 2 1 1 1 1 1 1 2
Ionophores 1 1 1 3 1 1 1 1 1 1 1 1
Improved management of manure/slurry N application
1 1 1 1 1 1 1 2 1 1 1 2 1 1 1 3 1 1 1 1 2 1 1 1 1 1 1 2
Dairy improved productivity and fertility 1 1 1 3
Anaerobic digestion 1 1 1 2 1 1 1 2 1 1 1 3 1 1 1 1 1 1 1 2
Making a full allowance for the N supplied in manures when deciding on the amounts of fertiliser-N to apply to a crop
1 1 1 1 1 1 1 2 1 1 1 2 1 1 1 3 1 1 1 1 1 1 1 1 1 1 1 2
Improved N use plants 1 1 1 1 1 1 1 3 1 1 1 3 1 1 1 1 1 1 1 1 1 1 1 2
Avoiding excess N 1 1 1 1 1 1 1 3 1 1 1 3 1 1 1 2 1 1 1 1 2 1 1 1 1 1 1 2
Dairy maize silage 1 1 1 3
Use FYM/composts instead of slurries 2 1 1 1 1 1 1 2 1 1 1 2 1 1 1 2 3 2 1 1 1 2 1 1
Reduced tillage 1 1 1 1 1 1 1 3 1 1 1 3 1 1 1 2
Separate slurry/ manure applications from fertiliser applications by several days
1 1 1 1 1 1 1 2 1 1 1 2 1 1 1 3 2 1 1 1 1 1 1 2
Beef improved productivity and fertility 1 1 1 1 1 1 1 1
Nitrification inhibitors 1 1 1 1 1 1 1 3 1 1 1 3 1 1 1 3 2 1 1 1 2 2 1 1 1 2 1 2
72
5.5 Effects of environment on measures
The preceding assessment by region only considered the applicability of measures in respect of farm type and size. We have not explicitly considered environmental conditions in the regional assessment due to size of the regions and the variation in conditions within them; however their inclusion is partially implicit due to the more general effect of environmental conditions on the farm types present in each region. Environmental conditions will influence the effectiveness of measures in a number of ways. These effects will include temperature, precipitation and the nature of the underlying soils. The expert meetings held on 23 March 2010 considered the effect of environment on a number of mitigation measures as summarised below. We summarise below key conclusions made by experts on the applicability of measures based on existing environmental conditions and management practice.
Improving drainage
There is more scope for improving drainage in Scotland as (a) less was drained in the past, and (b) different soil types – drainage could be improved on most grassland over imperfectly drained soils, although drainage would not be effective on some soils, e.g. mottled gleys. In terms of the areas where drainage could be improved, Scotland may be at the higher end and England at the lower end due to these reasons of current drainage and soil types. However it should be noted that considerable uncertainty remains regarding the effect that improving drainage would have on emissions and the areas of land where drainage could be improved (see APPENDIX C. Review of the uncertainty in key measures, for further discussion of this uncertainty). The range of estimates of the maximum areas where drainage could be improved is: • 5-40% of grassland • 5-30% of arable land
Improved timing of mineral N
Timing can only be improved in areas where fertiliser is applied, which is 58% of grassland and 91% of arable land within the UK.
Improved manure N timing
Application of manure N is likely to be more appropriate on free draining grassland soils, with limited scope for application on heavy clay soils. Manure N timing can thus only be improved where manure is applied. The British Survey of Fertiliser Practice (2008) suggests that manure is applied to 34% of grassland and 22% of arable land. NVZ rules currently restrict autumn/winter application, so there could be more scope for improving timing outside NVZs. In Scotland much livestock production occurs outside NVZ‟s, so there may be more potential for improving timing. However, much of the slurry is produced in the west, but is needed for application to arable areas in the east.
Making full allowance for manure N
This can only be improved where manure is applied. The British Survey of Fertiliser Practice (2008) suggests that manure is applied to 34% of grassland and 22% of arable land. Thus it is assumed that this measure is only applicable to 34% of grassland and 22% of arable land. Barriers remain to the transport of manure from producing farms to other holdings to ensure greater use efficiency, for example the attendant risks and liabilities of accidental spillage.
Avoiding excess N
It is more likely that excess N is applied to certain crops (e.g. maize and potatoes) rather than to certain geographical regions of the UK.
Nitrification Inhibitors
Nitrification inhibitors can be applied in any area where fertiliser is applied, which is 58% of grassland and 91% of arable land. Due to lower temperatures, compared to New Zealand, nitrification inhibitors are likely to work better in Scotland and at least as well (as New Zealand) in England, as nitrification inhibitors will breakdown more slowly with lower temperatures.

73
5.6 Effects of policy on measures
The main policy of relevance to many of the mitigation measures related to crops/soils is the designation of Nitrate Vulnerable Zones (NVZs). These restrict the quantities and timings of N application to land, and are primarily intended to improve water quality. However the policy has implications for measures relating to N2O emission reduction. The precise requirements of nitrate action programmes differ across the devolved administrations, reflecting general conditions in each country. NVZs are not uniformly distributed across the UK, with 70% of the English land area designated primarily in the East (although less so in the South East), the Midlands, and the southern part of the North of England region
7. In Wales 3% of the land
area is designated as NVZs mainly in the north east of Wales. NVZs have been designated across 14% of Scotland‟s land area, this is primarily along the eastern coast arable and mixed farming areas with a single NVZ designated in the south west. The whole of Northern Ireland has been designated as an NVZ. The effects of NVZ designation on mitigation measures will largely relate to nutrient management and are likely to be positive. NVZ designation may require more efficient use of N and better manure management practices. Measures such as anaerobic digestion may be more attractive as capital costs for increased slurry storage may be incurred in any case. Although initially more expensive AD offers an income stream to offset this cost. The N content of AD digestate is also more available for plant uptake than is the case with untreated slurry. Reduced application of N to wet ground may also be beneficial. Given current recommended fertiliser timings for arable crops (see Defra, 2000) it is unlikely that the closed periods within NVZs (the latest ending date for NVZs closed periods is 20
th February in North East Scotland)
would overlap with recommended fertiliser application times. Some of the NVZ rules could lead to direct reduction in GHG emissions. The livestock and organic manure N farm limit and the crop N requirement limit are closely related to the mitigation measure “avoiding N excess”. Similarly, the rules on planning N use (which require that soil N supply, crop requirement and N from organic manures are assessed) should ensure that another GHG mitigation measure - “taking full account of manure N” - is implemented. In addition, there are NVZ rules which, while unlikely to lead to reductions in GHG emissions directly, could facilitate the implementation of mitigation measures. The closed periods for application of organic manures and requirements to provide 6 months storage capacity for could enable farmers to improve the timing of its application. The requirement to prepare a fertiliser and manure management plan could also lead to reduced emissions if it encourages improved timing or the avoidance of excess N being applied. However, while NVZ requirements may result in some abatement, they are unlikely to be sufficient to maximise N2O abatement potential. Further research is required to understand the overlap between NVZ requirements and MACC mitigation measures. Other policies that might affect mitigation measures include the different levels of Pillar II support payments under the Rural Development Programmes. These might be basic measures applicable to all farmland (e.g. Entry Level Scheme, Tir Cynal, Land Managers Options, and Countryside Management Scheme) or higher level measures (e.g. Higher Level Scheme, Tir Gofal, and Rural Priorities) that are more restricted in application. Again we have not explicitly considered these policies in our assessment as this would require detailed data on the geographical uptake of measures, which are not readily available. University of Hertfordshire (2007) undertook an assessment of the mitigation potential of Environmental Stewardship and found potential for GHG mitigation across a range of scheme options due to land use change or reduced inputs. However the potential for displaced production and emissions
7 On 6
th May 2010, this was reduced to 62% following the decisions by an independent Panel on appeals submitted
by farmers with evidence to show that their land should not have been designated.

74
needs to be considered where options also lead to reduced production. Work commissioned by Defra to explore the potential for Environmental Stewardship to increase GHG mitigation is currently underway.
8
5.7 Current uptake of measures
Some of the measures being considered may already be undertaken by some farms (but such actions are not recorded), thus reducing the potential for further mitigation
9. Moreover existing application of
measures may differ across farm types and sizes. ADAS (2010) undertook a telephone survey of 301 farmers to assess the potential for GHG mitigation associated with N fertiliser use. Table 5.10 summarises the results of the ADAS survey for a range of fertiliser use issues and indicates where significant differences from the mean occur for practices in terms of farm type size or region. The results of the survey suggest that there are no systematic differences in practices across the broad range of fertiliser use issues. This general observation contrasts with results of the Farm Practices Survey 2009 (Defra, 2009) which found differences in the use of nutrient management plans across large (72% ±4), medium (59% ±6) and small (42% ±3) farms. However the Defra survey covers all farm types and use of nutrient management plans is significantly lower than arable farm types in livestock sectors other than dairy. The uptake of nutrient management plan results from the Farm Practices Survey are summarised in Table 5.11. A more complete analysis of these datasets would be required to determine whether significant interactions exist between farm types, sizes and regions that would indicate differences in current uptake and mitigation potentials.
8
http://randd.defra.gov.uk/Default.aspx?Menu=Menu&Module=More&Location=None&Completed=0&ProjectID=15884 9 Mitigation potentials considered in the MACC analysis are additional to current practices, i.e. based on reported
nutrient application rates.
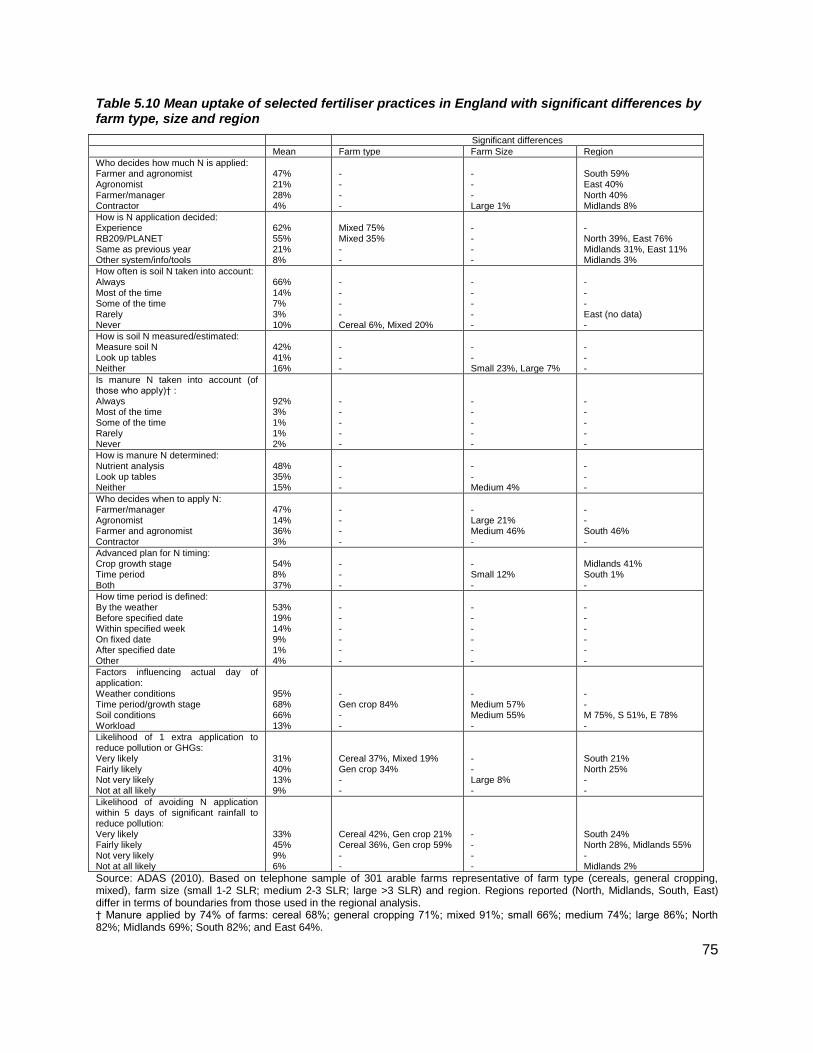
75
Table 5.10 Mean uptake of selected fertiliser practices in England with significant differences by farm type, size and region
Significant differences
Mean Farm type Farm Size Region
Who decides how much N is applied: Farmer and agronomist Agronomist Farmer/manager Contractor
47% 21% 28% 4%
- - - -
- - - Large 1%
South 59% East 40% North 40% Midlands 8%
How is N application decided: Experience RB209/PLANET Same as previous year Other system/info/tools
62% 55% 21% 8%
Mixed 75% Mixed 35% - -
- - - -
- North 39%, East 76% Midlands 31%, East 11% Midlands 3%
How often is soil N taken into account: Always
Most of the time Some of the time Rarely Never
66%
14% 7% 3% 10%
-
- - - Cereal 6%, Mixed 20%
-
- - - -
-
- - East (no data) -
How is soil N measured/estimated: Measure soil N Look up tables Neither
42% 41% 16%
- - -
- - Small 23%, Large 7%
- - -
Is manure N taken into account (of those who apply)† : Always Most of the time Some of the time Rarely Never
92% 3% 1% 1% 2%
- - - - -
- - - - -
- - - - -
How is manure N determined: Nutrient analysis Look up tables Neither
48% 35% 15%
- - -
- - Medium 4%
- - -
Who decides when to apply N: Farmer/manager Agronomist Farmer and agronomist Contractor
47% 14% 36% 3%
- - - -
- Large 21% Medium 46% -
- - South 46% -
Advanced plan for N timing: Crop growth stage Time period Both
54% 8% 37%
- - -
- Small 12% -
Midlands 41% South 1% -
How time period is defined: By the weather Before specified date Within specified week On fixed date After specified date Other
53% 19% 14% 9% 1% 4%
- - - - - -
- - - - - -
- - - - - -
Factors influencing actual day of application: Weather conditions Time period/growth stage Soil conditions Workload
95% 68% 66% 13%
- Gen crop 84% - -
- Medium 57% Medium 55% -
- - M 75%, S 51%, E 78% -
Likelihood of 1 extra application to reduce pollution or GHGs: Very likely Fairly likely Not very likely Not at all likely
31% 40% 13% 9%
Cereal 37%, Mixed 19% Gen crop 34% - -
- - Large 8% -
South 21% North 25% - -
Likelihood of avoiding N application within 5 days of significant rainfall to reduce pollution: Very likely Fairly likely Not very likely Not at all likely
33% 45% 9% 6%
Cereal 42%, Gen crop 21% Cereal 36%, Gen crop 59% - -
- - - -
South 24% North 28%, Midlands 55% - Midlands 2%
Source: ADAS (2010). Based on telephone sample of 301 arable farms representative of farm type (cereals, general cropping, mixed), farm size (small 1-2 SLR; medium 2-3 SLR; large >3 SLR) and region. Regions reported (North, Midlands, South, East) differ in terms of boundaries from those used in the regional analysis. † Manure applied by 74% of farms: cereal 68%; general cropping 71%; mixed 91%; small 66%; medium 74%; large 86%; North 82%; Midlands 69%; South 82%; and East 64%.
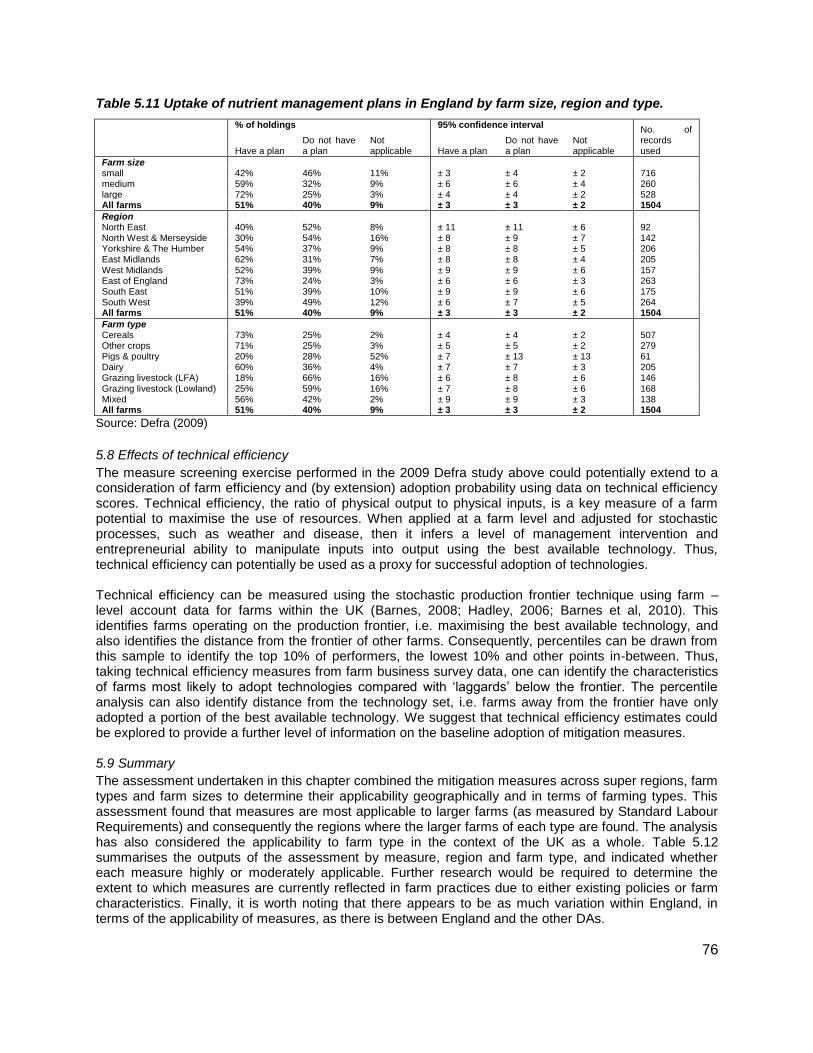
76
Table 5.11 Uptake of nutrient management plans in England by farm size, region and type.
% of holdings 95% confidence interval No. of records used Have a plan
Do not have a plan
Not applicable Have a plan
Do not have a plan
Not applicable
Farm size small 42% 46% 11% ± 3 ± 4 ± 2 716 medium 59% 32% 9% ± 6 ± 6 ± 4 260 large 72% 25% 3% ± 4 ± 4 ± 2 528 All farms 51% 40% 9% ± 3 ± 3 ± 2 1504
Region North East 40% 52% 8% ± 11 ± 11 ± 6 92 North West & Merseyside 30% 54% 16% ± 8 ± 9 ± 7 142 Yorkshire & The Humber 54% 37% 9% ± 8 ± 8 ± 5 206 East Midlands 62% 31% 7% ± 8 ± 8 ± 4 205 West Midlands 52% 39% 9% ± 9 ± 9 ± 6 157 East of England 73% 24% 3% ± 6 ± 6 ± 3 263 South East 51% 39% 10% ± 9 ± 9 ± 6 175 South West 39% 49% 12% ± 6 ± 7 ± 5 264 All farms 51% 40% 9% ± 3 ± 3 ± 2 1504
Farm type Cereals 73% 25% 2% ± 4 ± 4 ± 2 507 Other crops 71% 25% 3% ± 5 ± 5 ± 2 279 Pigs & poultry 20% 28% 52% ± 7 ± 13 ± 13 61 Dairy 60% 36% 4% ± 7 ± 7 ± 3 205 Grazing livestock (LFA) 18% 66% 16% ± 6 ± 8 ± 6 146 Grazing livestock (Lowland) 25% 59% 16% ± 7 ± 8 ± 6 168 Mixed 56% 42% 2% ± 9 ± 9 ± 3 138 All farms 51% 40% 9% ± 3 ± 3 ± 2 1504
Source: Defra (2009)
5.8 Effects of technical efficiency
The measure screening exercise performed in the 2009 Defra study above could potentially extend to a consideration of farm efficiency and (by extension) adoption probability using data on technical efficiency scores. Technical efficiency, the ratio of physical output to physical inputs, is a key measure of a farm potential to maximise the use of resources. When applied at a farm level and adjusted for stochastic processes, such as weather and disease, then it infers a level of management intervention and entrepreneurial ability to manipulate inputs into output using the best available technology. Thus, technical efficiency can potentially be used as a proxy for successful adoption of technologies. Technical efficiency can be measured using the stochastic production frontier technique using farm – level account data for farms within the UK (Barnes, 2008; Hadley, 2006; Barnes et al, 2010). This identifies farms operating on the production frontier, i.e. maximising the best available technology, and also identifies the distance from the frontier of other farms. Consequently, percentiles can be drawn from this sample to identify the top 10% of performers, the lowest 10% and other points in-between. Thus, taking technical efficiency measures from farm business survey data, one can identify the characteristics of farms most likely to adopt technologies compared with „laggards‟ below the frontier. The percentile analysis can also identify distance from the technology set, i.e. farms away from the frontier have only adopted a portion of the best available technology. We suggest that technical efficiency estimates could be explored to provide a further level of information on the baseline adoption of mitigation measures. 5.9 Summary
The assessment undertaken in this chapter combined the mitigation measures across super regions, farm types and farm sizes to determine their applicability geographically and in terms of farming types. This assessment found that measures are most applicable to larger farms (as measured by Standard Labour Requirements) and consequently the regions where the larger farms of each type are found. The analysis has also considered the applicability to farm type in the context of the UK as a whole. Table 5.12 summarises the outputs of the assessment by measure, region and farm type, and indicated whether each measure highly or moderately applicable. Further research would be required to determine the extent to which measures are currently reflected in farm practices due to either existing policies or farm characteristics. Finally, it is worth noting that there appears to be as much variation within England, in terms of the applicability of measures, as there is between England and the other DAs.
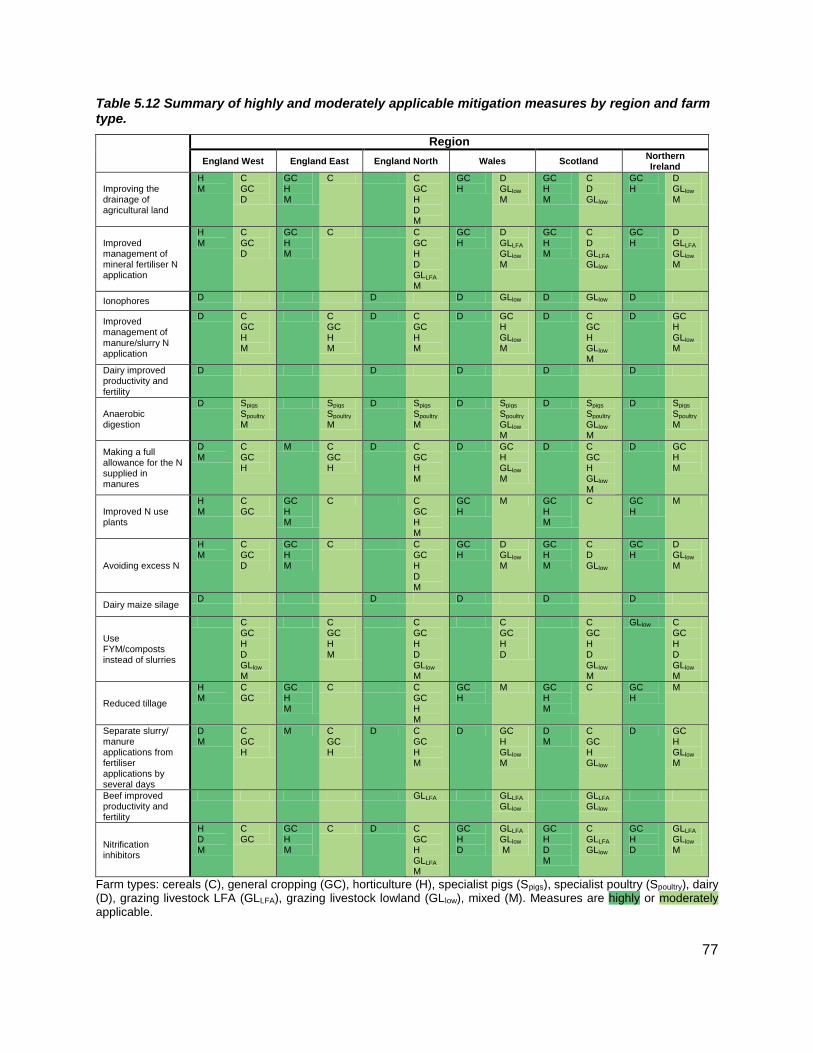
77
Table 5.12 Summary of highly and moderately applicable mitigation measures by region and farm type.
Region
England West England East England North Wales Scotland Northern Ireland
Improving the drainage of agricultural land
H M
C GC D
GC H M
C C GC H D M
GC H
D GLlow M
GC H M
C D GLlow
GC H
D GLlow M
Improved management of mineral fertiliser N application
H M
C GC D
GC H M
C C GC H D GLLFA
M
GC H
D GLLFA
GLlow M
GC H M
C D GLLFA GLlow
GC H
D GLLFA GLlow M
Ionophores D D D GLlow D GLlow D
Improved management of manure/slurry N application
D C GC H M
C GC H M
D C GC H M
D GC H GLlow M
D C GC H GLlow M
D GC H GLlow M
Dairy improved productivity and fertility
D D D D D
Anaerobic digestion
D Spigs
Spoultry
M
Spigs
Spoultry
M
D Spigs
Spoultry
M
D Spigs
Spoultry
GLlow M
D Spigs
Spoultry
GLlow M
D Spigs
Spoultry
M
Making a full allowance for the N supplied in manures
D M
C GC H
M C GC H
D C GC H M
D GC H GLlow M
D C GC H GLlow M
D GC H M
Improved N use plants
H M
C GC
GC H M
C C GC H M
GC H
M GC H M
C GC H
M
Avoiding excess N
H M
C GC D
GC H M
C C GC H D M
GC H
D GLlow M
GC H M
C D GLlow
GC H
D GLlow M
Dairy maize silage D D D D D
Use FYM/composts instead of slurries
C GC H D GLlow
M
C GC H M
C GC H D GLlow M
C GC H D
C GC H D GLlow M
GLlow C GC H D GLlow M
Reduced tillage
H M
C GC
GC H M
C C GC H M
GC H
M GC H M
C GC H
M
Separate slurry/ manure applications from fertiliser applications by several days
D M
C GC H
M C GC H
D C GC H M
D GC H GLlow M
D M
C GC H GLlow
D GC H GLlow M
Beef improved productivity and fertility
GLLFA GLLFA GLlow
GLLFA GLlow
Nitrification inhibitors
H D M
C GC
GC H M
C D C GC H GLLFA
M
GC H D
GLLFA GLlow
M
GC H D M
C GLLFA GLlow
GC H D
GLLFA GLlow M
Farm types: cereals (C), general cropping (GC), horticulture (H), specialist pigs (Spigs), specialist poultry (Spoultry), dairy (D), grazing livestock LFA (GLLFA), grazing livestock lowland (GLlow), mixed (M). Measures are highly or moderately applicable.

78
6. Achieving abatement and measuring progress
6.1 Timelines for 2
nd, 3
rd and 4
th budgetary periods
In order for the UK to meet its 80% emissions reduction target by 2050, the Committee on Climate Change has set carbon budgets, or legally binding ceilings on the level of allowed UK emissions over five year periods. These budgets correspond with the following time periods:
1st budget: 2008-2012
2nd
budget: 2013-2017
3rd
budget: 2018-2022
4th budget: 2023-2027
In this section we develop timelines for implementation of mitigation measures during the 2
nd and 3
rd
budgets, drawing out key messages in terms of likely uptake subject to a range of barriers and constraints. The development of timelines provides an indication of the likely abatement potential for the fourth budget period. This assessment is based on the measures and abatement potential in the optimistic MACC. For the assessment, measures can be arranged into 8 groupings listed as:
1. Nutrient management 2. Soil management 3. Nitrification inhibitors 4. Using more N efficient plants 5. Anaerobic digestion 6. Manure management 7. Livestock breeding 8. Diet manipulation
All measures can be assumed to operate within a regulatory environment that will influence the level of uptake and proportion of the MTP abatement. A broad distinction in terms of the policy approaches can be made between scenarios involving:
Option 1: Voluntary compliance with improved provision of education and information
Option 2: Incentive based (though still voluntary) mechanisms working within current policy frameworks, e.g. via the Rural Development Regulation
Option 3: Classic “command and control” regulation with enforcement of mandatory standards
Option 4: Introduction of a market-based instrument (tradable permit or tax)
It is important to note that for some measures (e.g. feed additives) application in any scenario presupposes the removal of specific legal barriers banning the use in production. Lifting these barriers would be a prerequisite for producer and consumer education and information (Option 1) to have an effect. In the time period to 2022, different combinations of these approaches are applicable to groups of
measures10
– i.e. we can assume that voluntary compliance (Option 1) will be easier for measures that are
best practice and/or with some win-win potential (e.g. many of the nutrient management options). For many other measures, further incentives are most likely provided through a combination of Options 1 and 2. Options 3 and 4 can be used to further ramp up abatement rates if required, but are politically less palatable and (as in the case of market-based approaches) may not be applicable for several measures. In the background to the combined potential delivered by combinations of interventions (options 1-4), we can expect ongoing and in some cases accelerated improvement in research and technological
10
In determining this we also cross refer to the cost/compliance table in the cost section, which indicates ease of
monitoring and compliance.
79
development (RTD), which is likely to deliver a significant increment to be counted for the 4th budget
period (as a result largely of plant and animal breeding breakthroughs). The abatement potential arising from RTD is expected to be realised primarily in the 4
th budget, following a period of research and
promotion of findings. It is assumed that RTD has the effect of enabling more of the maximum technical potential to be achieved, rather than increasing the maximum technical potential itself. Broadly speaking, we can characterise timelines affecting the proportion of MTP as:
Low (arising from options 1 & 2) which are the measures most likely to characterise the second budget period.
Medium (1 & 2 & where applicable 3) we assume these can be used to characterise the third budget period.
High (1 & 2 & where applicable 3&4) plus an ambitious assumption to account for RTD payoff in the fourth budget period.
We used a spreadsheet to develop measure-specific narratives that are then converted into estimates of the relative impacts of the aforementioned options. Appendix I shows background assumptions and the affect of the different policy environments on uptake and abatement potential. These assumptions then determine the proportion of the MTP that can be anticipated in each period. Results Table 6.1 and Figure 6.1 set out the relevant estimates arising from our assumptions.
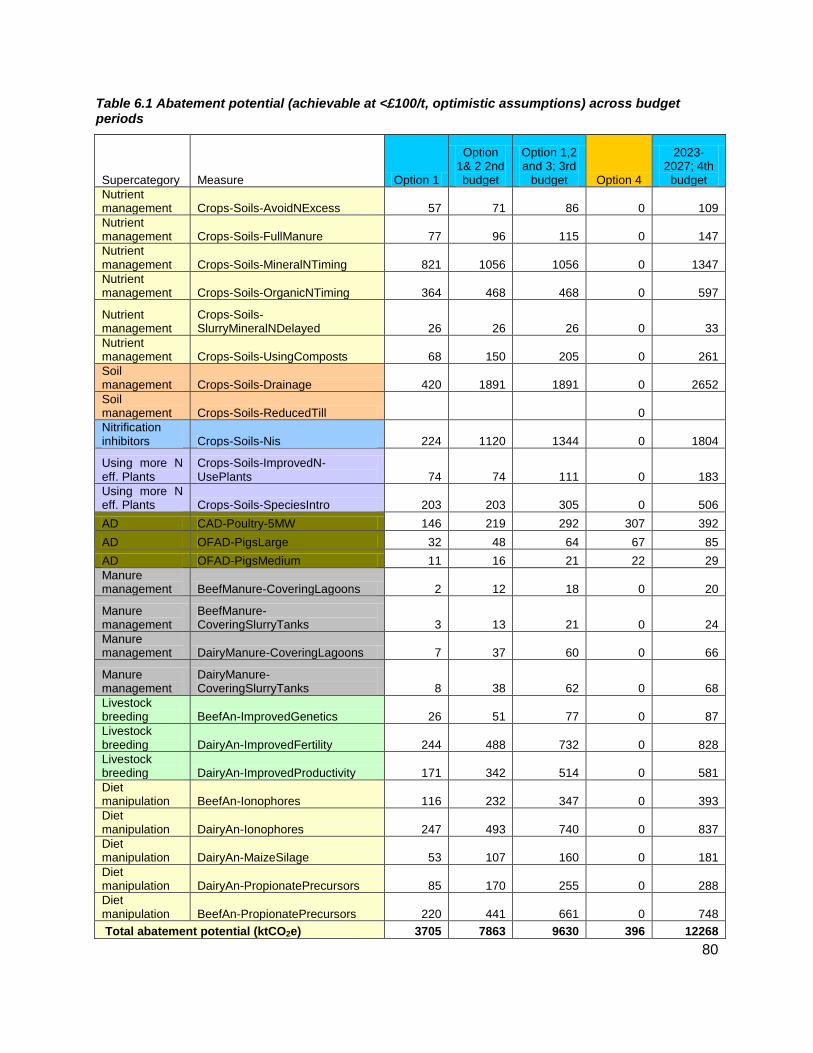
80
Table 6.1 Abatement potential (achievable at <£100/t, optimistic assumptions) across budget periods
Supercategory Measure Option 1
Option 1& 2 2nd budget
Option 1,2 and 3; 3rd
budget Option 4
2023-2027; 4th
budget
Nutrient management Crops-Soils-AvoidNExcess 57 71 86 0 109
Nutrient management Crops-Soils-FullManure 77 96 115 0 147
Nutrient management Crops-Soils-MineralNTiming 821 1056 1056 0 1347
Nutrient management Crops-Soils-OrganicNTiming 364 468 468 0 597
Nutrient management
Crops-Soils-SlurryMineralNDelayed 26 26 26 0 33
Nutrient management Crops-Soils-UsingComposts 68 150 205 0 261
Soil management Crops-Soils-Drainage 420 1891 1891 0 2652
Soil management Crops-Soils-ReducedTill
0
Nitrification inhibitors Crops-Soils-Nis 224 1120 1344 0 1804
Using more N eff. Plants
Crops-Soils-ImprovedN-UsePlants 74 74 111 0 183
Using more N eff. Plants Crops-Soils-SpeciesIntro 203 203 305 0 506
AD CAD-Poultry-5MW 146 219 292 307 392
AD OFAD-PigsLarge 32 48 64 67 85
AD OFAD-PigsMedium 11 16 21 22 29
Manure management BeefManure-CoveringLagoons 2 12 18 0 20
Manure management
BeefManure-CoveringSlurryTanks 3 13 21 0 24
Manure management DairyManure-CoveringLagoons 7 37 60 0 66
Manure management
DairyManure-CoveringSlurryTanks 8 38 62 0 68
Livestock breeding BeefAn-ImprovedGenetics 26 51 77 0 87
Livestock breeding DairyAn-ImprovedFertility 244 488 732 0 828
Livestock breeding DairyAn-ImprovedProductivity 171 342 514 0 581
Diet manipulation BeefAn-Ionophores 116 232 347 0 393
Diet manipulation DairyAn-Ionophores 247 493 740 0 837
Diet manipulation DairyAn-MaizeSilage 53 107 160 0 181
Diet manipulation DairyAn-PropionatePrecursors 85 170 255 0 288
Diet manipulation BeefAn-PropionatePrecursors 220 441 661 0 748
Total abatement potential (ktCO2e) 3705 7863 9630 396 12268

81
882
1,3231,496
689
1,413
1,867
1,955
2,495
441
161
101
20
378
283
189277224
0
1,000
2,000
3,000
4,000
5,000
6,000
7,000
8,000
9,000
10,000
11,000
12,000
13,000
Abatement (ktCO2e) at <£100/t
Budget period and measures
Budget IV (2023-2027)
12,268
2,447
178
1,804
2,652
Budget III (2018-2022)
C&C regulat ion
9,630
2,163
416
1,344
1,891
Budget II (2012-2017)
Incentives
7,863
1,442
2771,120
1,891
Budget I (2008-2012)
Educ/advice
3,705
721
420
Diet manipulation
Livestock breeding
Manure management
AD
Using more N eff. Plants
Nitrification inhibitors
Soil management
Nutrient management
Figure 6.1 Abatement potential (achievable at <£100/t, optimistic assumptions) across budget periods

82
6.2 Indicators
Monitoring and evaluating progress towards these budgets relies on the identification of indicators that are specific to each measure. Table 6.2 sets out a range of indicators and/or data sources necessary for evaluation. In some cases, compliance monitoring may be possible using existing data, albeit held by industry (e.g. fertiliser purchase and use). In other cases, specific survey data may be required to be collected (e.g. as part of agri-environment applications). Policy / Research sequencing The timeline exercise complements information detailed in section 8 on RTD priorities. From this exercise, we suggest several immediate actions for research and/or barrier removal:
Addressing regulations and bans on feed additives.
Research programming for nitrogen efficiency in plants, new crops and legumes.
Research on consumer acceptance of additives.
Research on interactions between current and alternative dietary additives (e.g. natural versus synthetics additives).
Search for alternative dietary energy sources for ruminants (to avoid silage).
Continued ways of interacting animal and plant genetic improvements (e.g. breeding high sugar grasses and breeding animals to use them efficiently).

83
Table 6.2Data for measure-specific adoption indicators
Category and measure
Indicator
Nutrient management
Crops-Soils-AvoidNExcess
AIC (Fertiliser manufacturers Assoc.) data. Survey of compliance with fertiliser recommendations (regionalised if necessary). Improved inventory will contribute by providing region-specific guidance. This measure could also lead to a small reduction in overall mineral N fertiliser use.
Crops-Soils-FullManure
Survey of compliance with fertiliser recommendations (regionalised if necessary). Inventory will contribute by providing region-specific guidance. This measure could also lead to a small reduction in overall mineral N fertiliser use.
Crops-Soils-MineralNTiming
Survey of compliance with fertiliser recommendations (regionalised if necessary). Improved inventory will contribute by providing region-specific guidance.
Crops-Soils-OrganicNTiming
Survey of compliance with fertiliser recommendations (regionalised if necessary). Improved inventory will contribute by providing region-specific guidance. NVZ compliance surveys (if available).
Crops-Soils-SlurryMineralNDelayed
Input indicator (fertiliser use) Output of product per unit of fertiliser use (assuming a fixed level of N2O emission per unit of fertiliser).
Crops-Soils-UsingComposts Proportion of farmers using composts; amount of compost used.
Soil management
Crops-Soils-Drainage
The national drainage contractors association maintains a register of new installations. Some assessment of drainage condition should be maintained by DEFRA. Current Defra project will provide baseline data.
Crops-Soils-ReducedTill Area of land cultivated using reduced tillage.
Nitrification inhibitors AIC data
Using more N efficient plants
Crops-Soils-ImprovedN-UsePlants
Areas dedicated to specific varieties and fertiliser use survey – this measure could lead to a significantly large reduction in mineral N fertiliser use (i.e. >10%) to be discernable
Crops-Soils-SpeciesIntro
Areas dedicated to specific varieties and fertiliser use survey– this measure could lead to a significantly large reduction in mineral N fertiliser use (i.e. >10%) to be discernable
Anaerobic digestion
CAD-Poultry-5MW
Installed plant of specific generation capacity, fossil fuel equivalent (kilo tonnes of oil equivalent, Ktoe) generated using AD plants. MTP is based on 8 plants, with an installed capacity of 40.40MW.
OFAD-PigsLarge
Installed plant of specific generation capacity, fossil fuel equivalent (kilo tonnes of oil equivalent, Ktoe) generated using AD plants. MTP is based on 689 plants, with an installed capacity of 10.34MW.
OFAD-PigsMedium
Installed plant of specific generation capacity, fossil fuel equivalent (kilo tonnes of oil equivalent, Ktoe) generated using AD plants. MTP is based on 1730 plants, with an installed capacity of 3.46MW.
Manure management BeefManure-
CoveringLagoons Farm survey of compliance, MTP assumes 117 lagoons with strainers, 187 lagoons without strainers.
BeefManure-CoveringSlurryTanks Farm survey of compliance, MTP assumes 656 slurry tanks.

84
DairyManure-CoveringLagoons
Farm survey of compliance, MTP assumes 1623 lagoons with strainers, 1240 lagoons without strainers.
DairyManure-CoveringSlurryTanks Farm survey of compliance, MTP assumes 5544 slurry tanks.
Livestock breeding
BeefAn-ImprovedGenetics
Numbers of livestock of different production/fertility efficiency. Better indicators could be developed by linking animal identification/movement databases with more widely available database, such as genetic evaluation datasets as well as other major animal performance data sources (e.g., abattoir data, health databases, benchmarking). This would give an indication of the numbers of animals of different breeds/genetic merit and/or performance (production output and health/fertility) and thus make for a more robust and routine mitigation inventory mechanism. The MTP assumes 6% average yield increase/animal across the herd.
DairyAn-ImprovedFertility
The MTP assumes an 11% average yield increase/animal across the herd and a 10% decrease in national herd size (assuming quota is maintained).
DairyAn-ImprovedProductivity
Numbers of livestock of different production/fertility efficiency. Better indicators could be developed by linking animal identification/movement databases with more widely available database, such as genetic evaluation datasets as well as other major animal performance data sources (e.g., abattoir data, health databases, benchmarking). This would give an indication of the numbers of animals of different breeds/genetic merit and/or performance (production output and health/fertility) and thus make for a more robust and routine mitigation inventory mechanism. The MTP assumes an 11% average yield increase/animal across the herd and a 10% decrease in national herd size (assuming quota is maintained).
Diet manipulation
BeefAn-Ionophores
Numbers of livestock on specific feed regimes, number of units sold, and farmer diet management survey. MTP assumes that ionophores are used on 90% of cattle (all non –organic systems) and result in a yield increase of 25% per animal, which equates to a 23% average yield increase/animal across the herd.
DairyAn-Ionophores
Numbers of livestock on specific feed regimes, number of units sold, and farmer diet management survey. MTP assumes a 23% weighted average yield increase/animal; 18% decrease in national herd size (assuming quota is maintained).
DairyAn-MaizeSilage
Numbers of livestock of animals consuming different diets. MTP assumes a 7% average yield increase/animal across the herd and a 7% decrease in national herd size (assuming quota is maintained).
DairyAn-PropionatePrecursors
Numbers of livestock of animals consuming different feed additives and diets. Numbers of livestock on specific feed regimes, number of units sold, and farmer diet
management survey. MTP assumes a 15% average yield increase/animal across the
herd and a13% decrease in national herd size (assuming quota is maintained).
BeefAn-PropionatePrecursors
Numbers of livestock of animals consuming different feed additives and diets. Numbers of livestock on specific feed regimes, number of units sold, and farmer diet
management survey. MTP assumes a 6% average yield increase/animal across the
herd.
85
7. Assessment of potential economic and land-use impacts of abatement
The voluntary or mandatory implementation of measures identified in the MACC can be considered in a wider partial or general equilibrium context to identify potential impacts on input and output prices, supply of and demand for agricultural products (final and intermediate), and UK land use. These factors in turn have the potential to affect the competitiveness of UK agriculture. In this section we consider some of these issues in turn. However, we stress that a more thorough quantitative assessment requires more modelling that is beyond the scope of this project.
Partial and general equilibrium impacts
To date the main focus of the wider economic impacts from mitigation on land use has been on the consequences of biofuels expansion in a range of countries. Scenarios generally involve significant land use change from arable crops to annual (e.g. miscanthus or switch grass) and perennial crops (willow coppice) destined to substitute for fossil fuels. Changing supply conditions for the displaced crops are then traced within partial (i.e. within farm or sector) and general (across the whole economy) impacts that derive initially from the price response from changing supply conditions. A range of model frameworks have been suggested for understanding this analysis
11. The main result of partial modelling in the UK is
that the switch to biofuel crops cannot happen under current relative prices, but that a much higher return to biomass crops could induce a supply response that would influence wheat and barley prices. An interesting controversy of this debate, although not one that is strictly applicable here, is that the impacts of switching into biofuel may be a net increase in global emissions (Searchinger et al 2008)
12. This finding
is contested, but it highlights the importance of taking a general equilibrium perspective on land use change of an apparently targeted policy.
Price effects
The UK is a price taker for most tradable agricultural products, but the sector is unlikely to suffer any significant competitive disadvantage from price increases related to mitigation activity involving low cost measures, which emphasise increasing resource use efficiency. In the first instance, these win-win opportunities do not suggest an immediate increase in resources (i.e. land) reallocated from production, and thus any negative impact on product prices, and are not expected to have an adverse impact on domestic or international competitive of the UK industry. Pursuit of these increased efficiencies counteracts any tendency to equate emissions reductions to fewer animals, and any inevitable displacement of activity beyond the UK. Implementing higher cost measures could however have some detrimental impacts on competitiveness and further work is necessary to simulate the impacts of farm constraints involving higher cost measures. Such modelling was not feasible within the limits of this project, but is clearly possible by coupling farm scale models with sector-wide trade models.
11
Witzke et al (2008) Modelling of Energy-Crops in Agricultural Sector Models - A Review of Existing Methodologies – Joint Research Centre of the EU http://ftp.jrc.es/EURdoc/JRC42597.pdf
12 http://www.princeton.edu/~tsearchi/writings/Searchinger_et_al-ScienceExpress.pdf

86
Moreover it is clear that the mandatory requirement for the implementation of some measures could imply some significant hidden learning costs and have an adverse financial impact on some marginal livestock producers. Specifically, the following measures have implementation costs of between £0 and £100/tCO2e:
BeefManure-CoveringLagoons
OFAD-PigsLarge
BeefManure-CoveringSlurryTanks
DairyManure-CoveringLagoons
OFAD-PigsMedium
DairyManure-CoveringSlurryTanks
Crops-Soils-NIs
The issue of manure handling and storage represents a particular cost burden for some producers. At this point we are unable to say how this will affect prices although those affected are likely to be smaller producers, due to the significant fixed-cost associated with these measures. Thus the mitigation agenda could alter industry structure.
Competitiveness
The early development of mitigation activity could potentially offer wider industry benefits in terms of developing technology and expertise in the field of mitigation technology. This might be anticipated in the areas of nitrification inhibitors, ionophores, as well as new market opportunities for anaerobic digestion facilities, manure management, reduced tillage and drainage contractors. We suggest that these opportunities will soon be recognised by the industry.
Land use
Beyond ambitious forestry targets, the only significant land use change identified relates to the potential for increase areas of maize for silage, although as the agriculture industry Climate Change Task Force (2010) note:
“Maize cultivation can cause damage to soils (and consequently water quality) if not managed correctly – this depends partly on cultivation techniques, soil type, condition and slope and partly on proximity to water courses. Maize cultivation may be banned in future in some Water Protection Zones.”

87
8. Conclusions
8.1 Summary of the results
The abatement potentials that could be achieved at <£100/t are shown in Figure 8.1, with the measures grouped into 8 categories. This figure shows the importance of the assumptions (pessimistic or optimistic) in determining the overall abatement and the types of measures that are required to achieve the abatement. There are large differences between the optimistic and pessimistic abatements of nutrient management, soil management and nitrification inhibitors, illustrating the sensitivity of some measures within these categories to key assumptions. Table 8.1 highlights the measures that are required to achieve these abatements and potential policies or RTD that could help realise some of this notional abatement. The following observations are made:
The abatement achievable for <£100/t on the optimistic MACC2 is slightly higher than MACC1, but on the pessimistic MACC2 significantly lower than MACC1. This shows the sensitivity of the results when different assumptions are made on key variables with uncertainties.
In many cases, reducing the uncertainty will require significant improvements to the evidence base. There is scope for some of the uncertainty to be reduced in light of findings of ongoing/forthcoming RTD (see 8.2).
Accuracy could be significantly improved through the incorporation of emerging evidence, and the development of MACCs for specific combinations of farms types/location/etc.
The new interactions method reduces the problem of the overestimation of the extent to which measures applicable to small proportions of land will interact. However there is clearly a case for refining the methodology through field scale trials, etc.
An assessment of the level of confidence in the abatement potential of the measures and remaining uncertainty is given in Table 8.2.
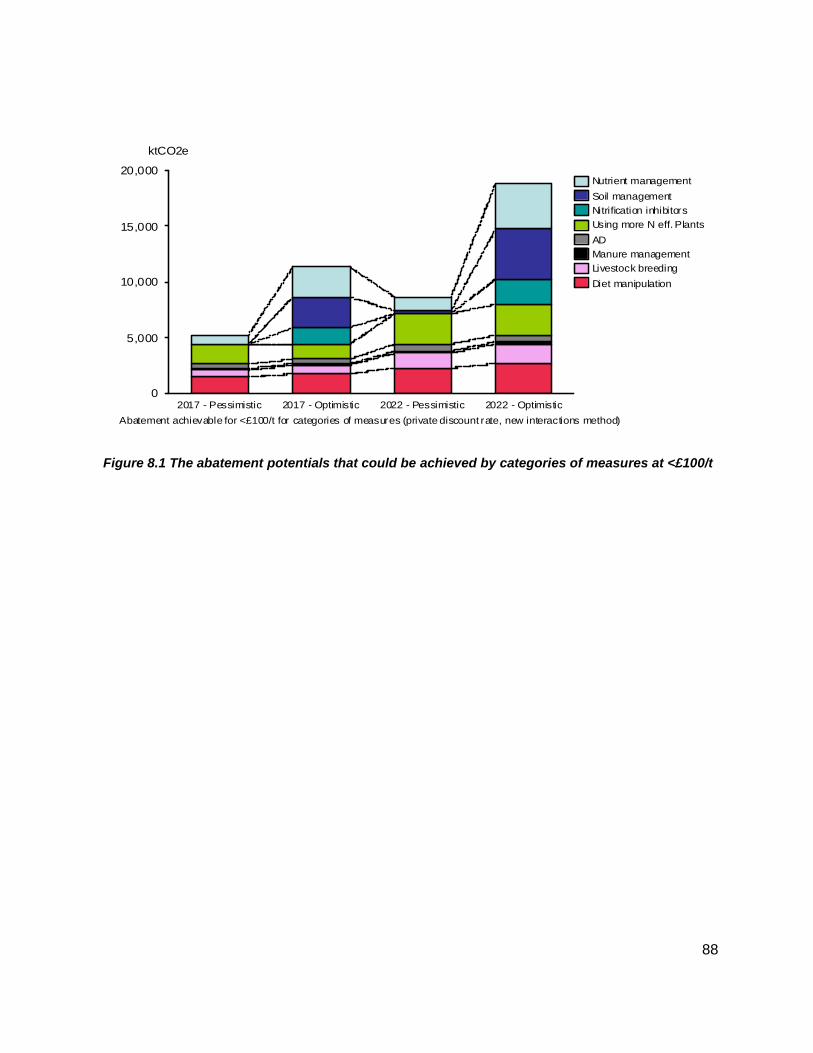
88
0
5,000
10,000
15,000
20,000
2017 - Pessimistic 2017 - Optimistic 2022 - Pessimistic 2022 - Optimistic
Abatement achievable for <£100/t for categories of measures (private discount rate, new interactions method)
ktCO2e
Soil management
Nitrification inhibitors
Using more N eff. Plants
AD
Manure management
Livestock breeding
Diet manipulation
Nutrient management
Figure 8.1 The abatement potentials that could be achieved by categories of measures at <£100/t

89
Table 8.1 Summary of the abatement potentials that could be achieved by category and measure (abatement potentials are for 2022 Optimistic MACC, using the new interactions method)
Category % of total
abatement achievable for <£100/t
Measures contributing >1% of total AP at <£100/t (measures in bold >5%)
Significant differences between optimistic and pessimistic MACCs?
Comment RTD status / requirements Potential additional abatement measures
Nutrient management
22% 1.Improved mineral N Timing 2.Improved organic N Timing
3.Separating slurry and mineral N 4.Using composts 5.Making full allowance for manure N
Yes – AP for both mineral and organic N timing much higher in optimistic
Significant AP for improved timing by second budget, policy options include: 1.NVZ rules and cross compliance 2. Good Farming Practice supported by base level agri-environment schemes and by quality assurance protocols. 3.Fertiliser tax 4. Improved extension
1. Ongoing RTD: MinNO, DEFRA projects ACO213 and ACO116 (grassland and cereals and mineral fertiliser) ACO111 (grassland and slurry), AC0221 and AC0222 and the EU project NitroEurope (grassland and timing). 2. Future RTD: interactions between organic and mineral fertilisers
Soil management
24% 1.Improving drainage
2.Reduced tillage
Yes – drainage excluded in pessimistic
Unlikely to be a policy measure in second budget due to unresolved uncertainty on (a) state of current drainage, and (b) effect of improving drainage on emissions.
Ongoing RTD: Defra project FFG0923 will improve understanding of state of drainage. Future RTD: Net effect of red. tillage on emissions; effect of imp. drainage on emissions
Wider measures to improve soil management e.g. residue management and waste management to improve soil structure and sequester C.
Nitrification inhibitors
12% Nitrification inhibitors
Yes – NIs excluded in pessimistic
Potentially widely deployable across budgets 2-4, once adequately tested in UK conditions. Uncertainty remains regarding future costs (and CE) of NI‟s.
New DEFRA projects currently being commissioned (ACO116 and ACO213) to look at regional efficacy of nitrification inhibitors will help to reduce uncertainty, also ongoing Scottish Government RTD. Numerous further research questions, e.g. what are the yield effects of NIs on grazed grasslands?
Using more N eff. plants
15% 1.Species introduction
2.Improved N-use plants
Overall AP similar, but improved plants excluded in pessimistic
Time required to develop and deploy new varieties means more applicable to 4
th budget.
Scope for accelerating through
A major new EU project (http://www.legumefutures.eu/) will investigate the potential use of legumes.
1. Increased use of existing n eff. varieties. 2. Use of GM

90
incentive payments and extension/advisory support. Species introduction >£100/t on original MACC.
AD 3% CAD-Poultry-5MW No Applicable across all budget periods, but uptake depends on levels of existing incentives (e.g. capital grants and feed-in tariffs).
“Current research needs should aim at exploiting on-farm residues and livestock manure as substrates for digestion, and there are plenty of technical challenges in this that would occupy researchers for the next decade” RTD (2009)
Other scales/types of AD may become cost-effective depending on incentives and future market prices.
Manure management
1% None No Relatively small AP
Livestock breeding
9% 1.Dairy - Improved Fertility
2.Dairy- Improved Productivity
Yes – AP for both measures 30-50% higher in optimistic
Applicable across all 3 budget periods, but intervention is required to achieve uptake: subsidizing the cost of performance monitoring and advice could be enough to have quite a marked effect.
Techniques are available; RTD is required to determine reasons for low levels of uptake.
Improved animal health.
Diet manipulation
14% 1.Dairy - Ionophores
2.Beef - Ionophores
Yes – propionates replace ionophores in pessimistic
Potentially applicable across all 3 budget periods, depending on legal status. Extension likely to be important for uptake, given potential WTO objections to payments.
Future RTD: which combinations of dietary mechanisms deliver longer term effects and minimise potential adverse effects (animal health/welfare, meat quality, food safety)?
Alternative dietary energy sources for ruminants.

91
Table 8.2Assessment of the level of confidence in the abatement potential of the measures and remaining uncertainty
Category Measure Confidencea Remaining uncertainty
Cro
ps/s
oil
s
Nutrient management
Mineral N Timing M Significant uncertainty regarding the extent to which the timing of mineral N application could be
improved.
Organic N Timing
M Significant uncertainty regarding the extent to which the timing of organic N application could be improved. Also, timing of organic N is linked to storage capacity and many farms have too little to take them over the winter. Although AP may be significant, there is the need for a great deal of investment nationally to realise the potential. However, NVZs mean that in general, farmers have to have such capacity.
Avoid N Excess M Significant uncertainty regarding the extent to which N is applied in excess at present.
Full Manure
The optimistic AP is much higher than the pessimistic, which means that much of the optimistic AP is uncertain.
Using Composts
M Farm assurance schemes may not include using composts from certain sources. Composts vary greatly in available N - usually low and may be more a source of carbon. Replacing slurry with FYM/composts begs the question of what to do with the slurry and if it is turned to FYM, where does the straw come from, potentially very large investments would be needed to change the system.
Slurry Mineral N Delayed
H Small abatement potential.
Soil management Drainage
L Significant uncertainty regarding the area of land on which drainage could be improved. Also the abatement rate of this measure (i.e. the effect that improving drainage will have on emissions) is uncertain.
Reduced Tillage L There is significant uncertainty regarding the effect of reduced tillage on net GHG emissions.
Nitrification inhibitors Nitrification inhibitors
L Nitrification inhibitors need to be adequately tested in UK conditions to establish their efficacy. Potential negative effects on animal health need to be investigated.
Using more N-eff plants
Improved N-Use Plants
M Likely to yield significant abatement, however there is some uncertainty regarding how much time would be required to develop and deploy new varieties.
Species Intro
L Species introduction has a large abatement potential, however its cost-effectiveness is marginal, therefore the large AP could become too expensive with small change in the cost assumptions.
Liv
esto
ck
Breeding
BeefAn-Improved Genetics
H Higher confidence, but needs a lot of effort on promotion. Low margins make farmers very cautious of change. This does have potentially significant benefits. There is little use of EBV (Estimated Breeding Value) in breeding, although some farmers have used it to achieve major improvements. It means producing better quality stock quicker rather than developing lines which lead to animal welfare issues. It should be noted that it is important to balance your breeding goal (be it production or fertility or both) for any potential unfavourable correlated responses and ensure that you are not breeding animals that have too high a resource input requirement such that the overall animal benefits are outweighed by system losses.

92
DairyAn-Improved Fertility
H Use of bulls with high PLI (Profitable Lifetime Index) can improve yield, health and longevity, leading to fewer replacements to cows. Low margins make farmers very cautious about changing strategy.
DairyAn-Improved Productivity
H See above.
Diet manipulation
BeefAn-Ionophores L These are currently illegal in Europe. Significant concerns regarding their role in increasing antimicrobial resistance, with associated animal and human health concerns. Also doubts regarding their long-term efficacy.
DairyAn-Ionophores L See above.
DairyAn-Maize Silage M Widely taken up for current potential, but as varieties develop, maize will be able to be grown in areas not now possible. In a wider context of risk to soil and water, potentially significant impacts on soil erosion and water quality, landscape and biodiversity.
BeefAn-Propionate Precursors
M Need to have their performance proven in practice across range of diets and across the medium-long term.
DairyAn-Propionate Precursors
M See above.
An
aero
bic
dig
esti
on
CAD-Poultry-5MW H Still lots of technical questions to be resolved, but the basic technology is proven.
OFAD-Pigs Large H See above.
OFAD-Pigs Medium H See above.
OFAD-Beef Large H See above.
OFAD-Dairy Large H See above.
OFAD-Beef Medium H See above.
OFAD-Dairy Medium H See above.
Man
ure
Man
ag
em
en
t
BeefManure-Covering Lagoons M Safety concerns, farmers are not keen on managing a lagoon with a cover.
BeefManure-Covering Slurry Tanks
M Safety concerns, some tanks are not suited to retro fitted covers and it can void warranty.
DairyManure-Covering Lagoons M See above.
DairyManure-Covering Slurry Tanks M See above.
a.Assessment of the level of confidence in the abatement potential of the measure: H-greater confidence; M-moderate confidence, but some significant uncertainties to be
resolved; L-lower confidence – major uncertainties to be resolved, e.g. in terms of abatement rate, performance, cost, uptake or legality.

93
8.2 Improvements in the evidence base and areas with future potential
Improvements in the evidence base in the updated MACC, and areas for future improvement are discussed under five headings:
1. Refinements to the MACC methodology; 2. Improving understanding of the effectiveness of policy to mitigate agricultural emissions; 3. Improving the accuracy of baselines; 4. Improving understanding of the abatement rates of specific mitigation measures; 5. Identifying potential additional abatement.
8.2.1 Refinements to the MACC methodology Interactions The main improvement in terms of the method had been the revisions to the way in which interactions are taken into account. The previous method significantly overestimated the extent to which certain measures interacted, and biased the results against measures that apply to small areas of the UK. The revised method has reduced this but opportunities remain for significant improvement in the method, notably:
Improved understanding of which measures are likely to coincide;
Field scale trials to measure interactions between pairs and packages of methods;
Identification of cost interactions to avoid double counting of mitigation costs. UK vs. farm specific MACCs The current approach treats the UK as a single farm, with all measures potentially interacting. In practice the range of measures that can be adopted by any particular farm will be limited by the specific circumstances. The treatment of interactions (and the analysis in general) would therefore be facilitated by the development of bespoke MACCs tailored to particular combinations of farm types, locations, soil types etc. Costs The estimation of the costs of measures focused on private, on-farm costs. Several costs identified during reviews of the original MACC were included in MACC2 (see Table 2.1). Also, several of the cost assumptions were changed in response to feedback and emerging evidence. For example the original MACC exercise used cost equations derived by FEC Services (2003) to estimate the costs of AD plants for different size categories of livestock holding. For the current study a wider range of 11 published cost estimates for different size of AD plant were reviewed. In addition, a range of potential hidden costs were identified (see Table 2.12). An obvious improvement to the method would be to evaluate the extent to which the cost assumptions used correlated with costs on actual farms via implementation of measures and cost audits. Another avenue of research would to expand the categories of costs to included non-market effects, as MACCs including social costs may lead to different conclusions regarding the relative cost-effectiveness of the measures, and would be useful in identifying potential synergies or conflicts between GHG policy and other government priorities. 8.2.2 Improving understanding of the effectiveness of policy to mitigate agricultural emissions The original MACC analysis did not explore the policy dimensions in depth; simple assumptions were made about the likely uptake of measures based on four policy scenarios, and it was assumed that uptake would be linear over time. Subsequent studies (e.g. Harris et al. 2009) have explored the policy options in more detail. This report undertook a brief review of the options that could be applied to each measure (see section 3), however there is clearly need to improve our understanding of the extent to which various policy instruments available could achieve uptake of the measures identified in the MACCs,

94
at what speed and at what cost to the government. Part of this process will require an improved understanding of the barriers to in-farm deployment, and ongoing research (e.g. Defra project AC0222) should help. There are also unanswered questions regarding the extent to which consumers are willing to accept potentially controversial mitigation measures (such as ionophores) that could have impacts on animal welfare etc. 8.2.3 Improving the accuracy of baselines In order to understand the extent to which a measure could be uptake, it is necessary to have some idea of the baseline from which one is starting. The accuracy of the baseline varies considerably depending on the type of measure. For some measures, such as AD, it is possible to define the baseline with precision. However for other measures, such as those based on changing unobserved behaviour (e.g. improving mineral N timing) it is difficult to define the baseline with certainty and one has to rely on self-reported evidence, and the opinion of those familiar with industry practice. The updated MACC attempted to draw together and examine some of this evidence in the expert meeting and survey (see Appendices A-C). Ongoing work (e.g. Defra projects AC0221 (N timing and excess), AC0222 (10 measures), FFG0918 (market segmentation) and FFG0923 (status of drainage) should help to refine baselines. 8.2.4 Improving understanding of the abatement rates of specific mitigation measures There is considerable uncertainty regarding the abatement rates of many mitigation measures. This is to an extent unavoidable given that it is impossible to test the mitigation measures under all the infinite physical conditions in which they can be applied. An improvement in the revised MACC is that the abatement rates reflect this uncertainty to a greater extent. In the original MACC, single “average” abatement rates were used, while in the revised MACC, ranges are developed for some measures (see Table 2.1). There is clearly scope for a great deal of experimental and model-based research to improve our understanding of the physical and physiological performance of the mitigation measures, and much research is already underway or planned. Two projects that could change the overall abatement potentials of the MACCs are Legume Futures, and the ADAS-led field trials of nitrification inhibitors. These projects are important as they should shed light on two mitigation measures that have large abatement potentials and are marginal in terms of their cost-effectiveness. 8.2.5 Identifying potential additional abatement The original MACC project and this update have focussed on a subset all possible measures. There are therefore categories of measures, and potential areas for improving understanding, that are excluded from the analysis, such as:
Measures screened out of the analysis, e.g. mitigation in sheep;
Off-farm emissions, e.g. wider LCA effects;
Using demand-side policies to reduce emissions. In addition, there are areas where targeted RTD could unlock further mitigation (MacLeod et al. 2010b):
Using plant breeding to improve nitrogen use efficiency;
Using alternative approaches to cropping, e.g. N fixing plants, or more N efficient varieties;
Improving livestock feed efficiency through rumen manipulation;
Improving livestock efficiency through breeding;
Improving livestock efficiency through improved animal health;
Improving soil management and carbon;
Precision farming;
Nitrification inhibitors.
95
9. References
ADAS (2002) Development of a database of agricultural drainage Defra Project ES0111 London: Defra ADAS (2010) Scoping the potential to reduce GHG emissions associated with N fertiliser applied to arable crops. Final report to Defra. AEA (2009) Unpublished Review of the SAC MACC Undertaken for Defra Aldhous (2008) New Scientist 197, 28-31 Ball, B.C., McTaggart, I.P. & Scott, A. 2004. Mitigation of greenhouse gas emissions from soil under silage production by use of organic manures or slow-release fertilizer. Soil Use and Management, 20, 287-295. Ball, B.C., Rees,R.M., Sinclair, A.H.(2008) Mitigation of nitrous oxide and methane emissions from agricultural soils – a summary of Scottish experience. 2008. Barnes, A.P., Revoredo-Giha, C., Sauer, J. Elliott, J. and Jones, G. (2010). A report on technical efficiency at the farm level 1989 to 2008. Report for Defra, London. Barnes, A.P. (2008). Technical Efficiency Estimates for Scottish Agriculture: A Note. Journal of Agricultural Economics, Volume 59.2, June. Bel, F., d‟Aubigny, G.D., Lacroix, A., and Mollard, A. (2004) Fertiliser taxation and regulation on nonpoint water pollution: a critical analysis based on European experiences. International Journal of Water, v 2, no. 4, pp 247-266 Bouwman, A.F., Boumans, L.J.M. & Batjes,N.H. 2002. Emissions of N2O and NO from fertilized fields: Summary of available measurement data. Global Biogeochemical Cycles, 16, art-1058. British Survey of Fertiliser Practice (2008) Available at: http://www.defra.gov.uk/evidence/statistics/foodfarm/enviro/fertiliserpractice/index.htm Climate Change Task Force (2010) Pers comm Climate Change Task Force 5/3/10 D‟Arcy, B.J., Schmulian, K. and Wade, R. (2006) Regulatory options for the management of diffuse pollution. In L. Gairns, K. Crighton and B. Jeffrey (eds), Agriculture and the Environment VI: Managing Rural Diffuse Pollution Edinburgh: SEPA/SAC. Davidson E.A. (1991). Fluxes of nitrous oxide and nitric oxide from terrestrial ecosystems. In: Rogers J.E. and Whitman W.B. (eds) Microbial Production and Consumption of Greenhouse Gases: Methane, Nitrogen Oxides and Halomethanes. American Society of Microbiology, Washington DC, pp. 219–235 DECC (2009). Carbon Appraisal in UK Policy Appraisal: A revised Approach London: DECC. Retrieved 5
th July 2010 from http://www.decc.gov.uk
Defra (2007) The Social Cost Of Carbon And The Shadow Price Of Carbon: What They Are, And How To Use Them In Economic Appraisal In The UK Economics Group, Defra December 2007 Defra (2000) Fertiliser Recommendations for Agricultural and Horticultural Crops (RB209) (7
th Edition).
Defra Defra (2009) Farm Practices Survey 2009. Defra
96
Defra (2009) Quantitative Assessment of Scenarios for Managing Trade-Off between the Economic Performance of Agriculture and the Environment and Between Different Environmental Media Defra Project WQ0106 (Module 6) Di, H.J.& Cameron, K.C. 2002. The use of a nitrification inhibitor, dicyandiamide (DCD), to decrease nitrate leaching and nitrous oxide emissions in a simulated grazed and irrigated grassland. Soil Use and Management, 18, 395-403. Di,H.J.& Cameron, K.C. 2003. Mitigation of nitrous oxide emissions in spray-irrigated grazed grassland by treating the soil with dicyandiamide, a nitrification inhibitor. Soil Use and Management, 19, 284-290. Di,H.J.& Cameron, K.C. 2004. Effects of the nitrification inhibitor dicyandiamide on potassium, magnesium and calcium leaching in grazed grassland. Soil Use and Management, 20, 2-7. Di,H.J., Cameron, K.C. & Sherlock, R.R. 2007. Comparison of the effectiveness of a nitrification inhibitor, dicyandiamide, in reducing nitrous oxide emissions in four different soils under different climatic and management conditions. Soil Use and Management, 23, 1-9. Dobbie, K.E., Smith, K.A., 2006. The effect of water table depth on emissions of N2O from a grassland soil. Soil Use and Management 22, 22-28. FEC Services Ltd (2003) Anaerobic digestion, storage, oligolysis, lime, heat and aerobic treatment of livestock manures. Final report to Scottish Executive http://www.scotland.gov.uk/Resource/Doc/1057/0002224.pdf Garnsworthy, P.C (2004) The Environmental impact of fertility in dairy cows: a modeling approach to predict methane and ammonia emissions. Animal Feed Science and Technology 112; 211-223. Godwin et al (2008) The Current Status of Soil and Water Management in England Stoneleigh Park: Royal Agricultural Society of England Hadley, D. (2006) Efficiency and Productivity at the Farm Level in England and Wales 1982 to 2002,Report to Defra, London. Harris, D., Glyn Jones, John Elliott, John Williams, Brian Chambers, Roy Dyer, Carolyn George, Rocio Salado, Bob Crabtree (2009) RMP/5142 Analysis of Policy Instruments for Reducing Greenhouse Gas Emissions from Agriculture, Forestry and Land Management Wolverhampton: ADAS Johnson, J.M.F., Franzluebbers, A.J., Weyers, S.L. & Reicosky, D.C. 2007. Agricultural opportunities to mitigate greenhouse gas emissions. Environmental Pollution, 150, 107-124. Jones, S. K., Rees, R. M., Skiba, U. M., and Ball, B. C. (2004) Greenhouse gas emissions from a managed grassland. Global and Planetary Change 47, 201-211. Jones, S.K., Rees,R.M., Skiba, U.M. & Ball,B.C. 2007. Influence of organic and mineral N fertiliser on N2O fluxes from a temperate grassland. Agriculture Ecosystems & Environment, 121, 74-83. Jones HE, Warkup CC, Williams A and Audsley E 2008. The effect of genetic improvement on emission from livestock systems. In Proceedings of the European Association of Animal Production, 24–27 August 2008, Vilnius, Lithuania, Session 5.6, p. 28. Merino, P., Estavillo, J.M., Graciolli, L.A., Pinto, M., Lacuesta, M., Munoz-Rueda, A. & Gonzalez-Murua, C. 2002. Mitigation of N2O emissions from grassland by nitrification inhibitor and Actilith F2 applied with fertilizer and cattle slurry. Soil Use and Management, 18, 135-141.
97
McGuffey R.K., Richardson L.F., & Wilkinson J.I.D. (2001) Ionophores for Dairy Cattle: Current Status and Future Outlook. Journal of Dairy Science 84(E. Suppl.):E194-E203 Michael MacLeod , Dominic Moran , Vera Eory, R.M. Rees, Andrew Barnes, Cairistiona F.E. Topp, Bruce Ball, Steve Hoad, Eileen Wall, Alistair McVittie, Guillaume Pajot, Robin Matthews, Pete Smith, Andrew Moxey (2010a) Developing greenhouse gas marginal abatement costs curves for agricultural emissions from crops and soils in the UK Agricultural Systems 103 198–209 MacLeod, M., Alistair McVittie, Bob Rees, Eileen Wall, Kairsty Topp, Dominic Moran, Vera Eory, Andy Barnes, Tom Misselbrook, Dave Chadwick, Andrew Moxey, and Pete Smith (2010b) Roadmaps Integrating RTD in Developing Realistic GHG Mitigation Options from Agriculture up to 2030 Defra Project: FFG0812
McTaggart, I.P., Clayton, H., Parker, J., Swan, L. & Smith, K.A. 1997. Nitrous oxide emissions from grassland and spring barley, following N fertiliser application with and without nitrification inhibitors. Biology and Fertility of Soils, 25, 261-268. Moran, D., Michael MacLeod, Eileen Wall, Vera Eory, Guillaume Pajot, Robin Matthews, Alistair McVittie, Andrew Barnes, Bob Rees, Andrew Moxey, Adrian Williams, Pete Smith (2008) UK Marginal Abatement Cost Curves for the Agriculture and Land Use, Land-Use Change and Forestry Sectors out to 2022, with Qualitative Analysis of Options to 2050 London: Committee on Climate Change Mosier, A.R., Duxbury, J.M., Freney J.R., Heinemeyer, O. & Minami, K. 1998. Assessing and mitigating N2O emissions from agricultural soils. Climatic Change, 40, 7-38. NERA (2007) Market Mechanisms for Reducing GHG Emissions from Agriculture, Forestry and Land Management London: Defra Pollok C. (2008) Options for Greenhouse Gas Mitigation in the UK April 2008 Market Harborough: Nuffield Farming Scholarships Trust Rochette P. & Janzen H. (2005) Towards a Revised Coefficient for Estimating N2O Emissions from Legumes. Nutrient Cycling in Agroecosystems, 73, 171-179. RTD (2009) Unpublished Defra Report “Roadmaps Integrating RTD in Developing Realistic GHG Mitigation Options from Agriculture up to 2030” Project Code: FFG 0812 Saggar, S. (2010) Agriculture, Ecosystems & Environment Volume 136, Issues 3-4, 15 March 2010, Pages 189-191 Estimation of nitrous oxide emission from ecosystems and its mitigation technologies Scottish Government (2009) pers comm. Searchinger, T., Ralph Heimlich, R. A. Houghton, Fengxia Dong, Amani Elobeid, Jacinto Fabiosa, Simla Tokgoz, Dermot Hayes, Tun-Hsiang Yu (2008) Use of U.S. Croplands for Biofuels Increases Greenhouse Gases Through Emissions from Land Use Change Sciencexpress February 2008 Shepherd, M., Anthony, S., Temple, M., Renwick, A., Barnes, A., Chadwick, D., Burgess, D., Patton, M., (2007). Baseline projections for agriculture and implications for emissions to air and water SFF0601. Defra, London. Sinclair A.H. (2002). Nitrogen recommendations for cereals, oilseed rape and potatoes. SAC Technical Note. T516

98
Smith, K.A., McTaggart, I.P. & Tsuruta, H. 1997. Emissions of N2O and NO associated with nitrogen fertilization in intensive agriculture, and the potential for mitigation. Soil Use and Management, 13, 296-304. Smith, K.A. and Dobbie, K.E. (2002) Nitrous oxide emissions from agricultural soils and the potential for their reduction. Final Project Report, DEFRA Contract CC0233 London; Defra Smith, K.A., McTaggart, I.P. & Tsuruta, H. 1997. Emissions of N2O and NO associated with nitrogen fertilization in intensive agriculture, and the potential for mitigation. Soil Use and Management, 13, 296-304. Stehfest, E. and Bouwman, L. (2006) N2O and NO emission from agricultural fields and soils under natural vegetation: summarizing available measurement data and modeling of global annual emissions Journal Nutrient Cycling in Agroecosystems 74 (3) March, 2006 Sylvester-Bradley, R. and Daniel R. Kindred (2009) Analysing nitrogen responses of cereals to prioritize routes to the improvement of nitrogen use efficiency Journal of Experimental Botany University of Hertfordshire (2007) Research into the current and potential climate change mitigation impacts of environmental stewardship Defra Project Code BD2302 London: Defra Wall, E., G. Simm and D. Moran (2009) Developing breeding schemes to assist mitigation of greenhouse gas emissions Animal 4:3, pp 366–376 Webb J, Misselbrook TH. 2004. A mass-flow model of ammonia emissions from UK livestock production. Atmospheric Environment 38, 2163-2176.
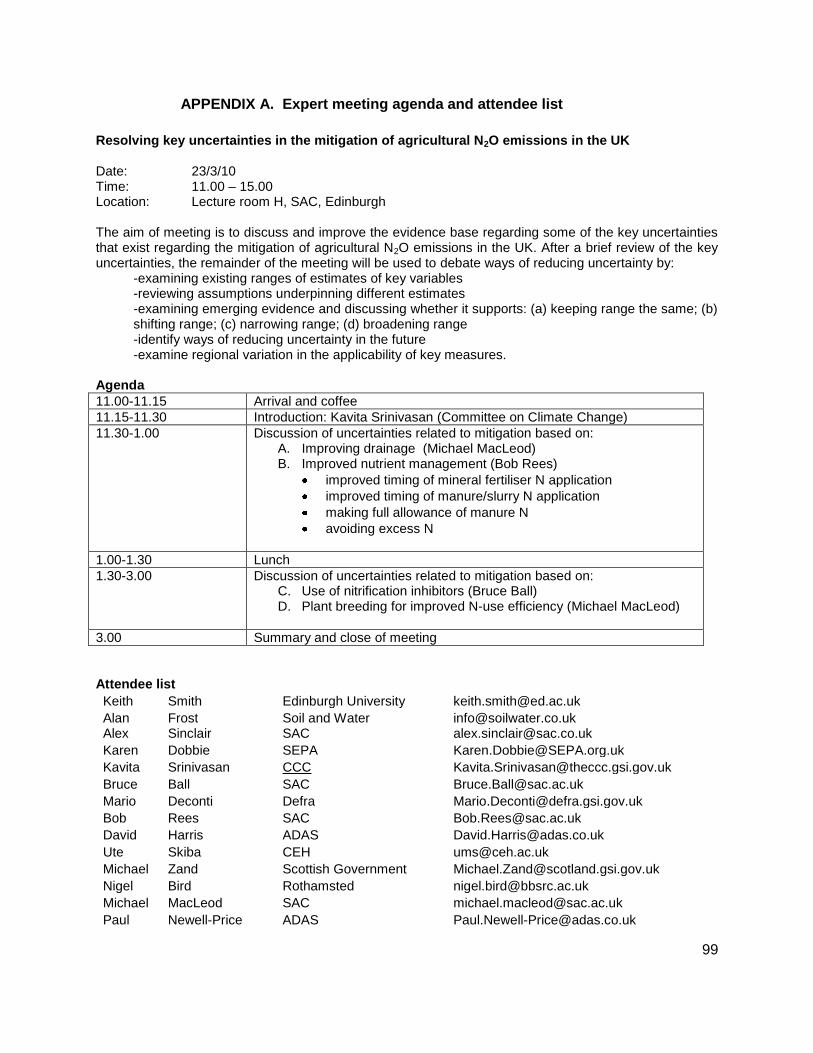
99
APPENDIX A. Expert meeting agenda and attendee list
Resolving key uncertainties in the mitigation of agricultural N2O emissions in the UK Date: 23/3/10 Time: 11.00 – 15.00 Location: Lecture room H, SAC, Edinburgh The aim of meeting is to discuss and improve the evidence base regarding some of the key uncertainties that exist regarding the mitigation of agricultural N2O emissions in the UK. After a brief review of the key uncertainties, the remainder of the meeting will be used to debate ways of reducing uncertainty by:
-examining existing ranges of estimates of key variables -reviewing assumptions underpinning different estimates -examining emerging evidence and discussing whether it supports: (a) keeping range the same; (b) shifting range; (c) narrowing range; (d) broadening range -identify ways of reducing uncertainty in the future -examine regional variation in the applicability of key measures.
Agenda
11.00-11.15 Arrival and coffee
11.15-11.30 Introduction: Kavita Srinivasan (Committee on Climate Change)
11.30-1.00 Discussion of uncertainties related to mitigation based on: A. Improving drainage (Michael MacLeod) B. Improved nutrient management (Bob Rees)
improved timing of mineral fertiliser N application
improved timing of manure/slurry N application
making full allowance of manure N
avoiding excess N
1.00-1.30 Lunch
1.30-3.00 Discussion of uncertainties related to mitigation based on: C. Use of nitrification inhibitors (Bruce Ball) D. Plant breeding for improved N-use efficiency (Michael MacLeod)
3.00 Summary and close of meeting
Attendee list
Keith Smith Edinburgh University [email protected]
Alan Frost Soil and Water [email protected] Alex Sinclair SAC [email protected]
Karen Dobbie SEPA [email protected]
Kavita Srinivasan CCC [email protected]
Bruce Ball SAC [email protected]
Mario Deconti Defra [email protected]
Bob Rees SAC [email protected]
David Harris ADAS [email protected]
Ute Skiba CEH [email protected]
Michael Zand Scottish Government [email protected]
Nigel Bird Rothamsted [email protected]
Michael MacLeod SAC [email protected]
Paul Newell-Price ADAS [email protected]
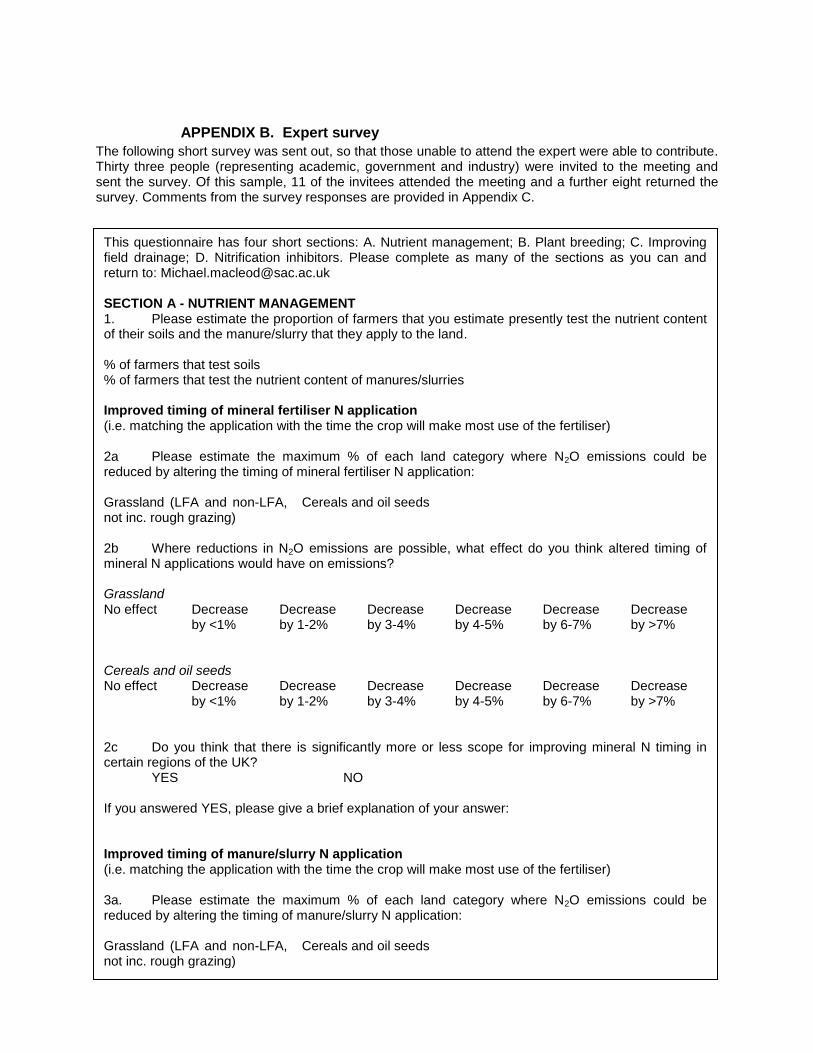
100
APPENDIX B. Expert survey
The following short survey was sent out, so that those unable to attend the expert were able to contribute. Thirty three people (representing academic, government and industry) were invited to the meeting and sent the survey. Of this sample, 11 of the invitees attended the meeting and a further eight returned the survey. Comments from the survey responses are provided in Appendix C.
This questionnaire has four short sections: A. Nutrient management; B. Plant breeding; C. Improving field drainage; D. Nitrification inhibitors. Please complete as many of the sections as you can and return to: [email protected] SECTION A - NUTRIENT MANAGEMENT 1. Please estimate the proportion of farmers that you estimate presently test the nutrient content of their soils and the manure/slurry that they apply to the land. % of farmers that test soils % of farmers that test the nutrient content of manures/slurries Improved timing of mineral fertiliser N application (i.e. matching the application with the time the crop will make most use of the fertiliser) 2a Please estimate the maximum % of each land category where N2O emissions could be reduced by altering the timing of mineral fertiliser N application: Grassland (LFA and non-LFA, not inc. rough grazing)
Cereals and oil seeds
2b Where reductions in N2O emissions are possible, what effect do you think altered timing of mineral N applications would have on emissions? Grassland No effect Decrease
by <1% Decrease by 1-2%
Decrease by 3-4%
Decrease by 4-5%
Decrease by 6-7%
Decrease by >7%
Cereals and oil seeds No effect Decrease
by <1% Decrease by 1-2%
Decrease by 3-4%
Decrease by 4-5%
Decrease by 6-7%
Decrease by >7%
2c Do you think that there is significantly more or less scope for improving mineral N timing in certain regions of the UK? YES NO If you answered YES, please give a brief explanation of your answer: Improved timing of manure/slurry N application (i.e. matching the application with the time the crop will make most use of the fertiliser) 3a. Please estimate the maximum % of each land category where N2O emissions could be reduced by altering the timing of manure/slurry N application: Grassland (LFA and non-LFA, not inc. rough grazing)
Cereals and oil seeds

101
3b. Where reductions in N2O emissions are possible, what effect do you think altered timing of manure/slurry applications would have on emissions? No effect Decrease
by <1% Decrease by 1-2%
Decrease by 3-4%
Decrease by 4-5%
Decrease by 6-7%
Decrease by 8-9%
Decrease by >9%
3c. On land where the timing of manure/slurry N could be improved, what proportion of farmers would require extra manure/slurry storage capacity in order to improve management? <10% 11-20% 21-30% 31-40% 41-50% 51-60% 61-70% >70% 3d. Do you think that there is significantly more or less scope for improving manure/slurry N timing in certain regions of the UK? YES NO If you answered YES, please give a brief explanation of your answer: Making a full allowance for the N supplied in manures when deciding on the amounts of fertilizer-N to apply to a crop 4a Please estimate the maximum % of each land category where N2O emissions could be reduced by making a full allowance for the N supplied in manures when deciding on the amounts of fertilizer-N to apply to a crop
Grassland (LFA and non-LFA, not inc. rough grazing)
Cereals and oil seeds
4b. By what proportion do you think fertiliser N could be reduced, without affecting yield, if famers were able to take full account of manure N?
Decrease by <1%
Decrease by 1-2%
Decrease by 3-4%
Decrease by 4-5%
Decrease by 6-7%
Decrease by 8-9%
Decrease by <9%
4c Do you think that there is significantly more or less scope for making full allowance of manure N in certain regions of the UK? YES NO If you answered YES, please give a brief explanation of your answer: Avoiding excess N 5a Please estimate the maximum % of each land category where N2O emissions could be reduced by reducing the total amounts of (mineral and organic) N application, without reducing yields:
Grassland (LFA and non-LFA, not inc. rough grazing)
Cereals and oil seeds
5b. On land where it total N applied could be reduced without affecting yield, by what proportion do you think total N could be reduced?
Decrease by <1%
Decrease by 1-2%
Decrease by 3-4%
Decrease by 4-5%
Decrease by 6-7%
Decrease by 8-9%
Decrease by 9-10%
Decrease by 11-12%
Decrease by >12%

102
5c Do you think that there is significantly more or less scope for avoiding excess N in certain regions of the UK? YES NO If you answered YES, please give a brief explanation of your answer: SECTION B – PLANT BREEDING Improved N use plants 6a. If a breeding programme designed to improve plant N-use efficiency was started now, when do you think the new varieties would be on the market? 6b. What % reduction in fertiliser requirement do you think breeding improved varieties could achieve over the next 15 years? Decrease by <5%
Decrease by 5-10%
Decrease by 11-15%
Decrease by 16-20%
Decrease by 21-25%
Decrease by 26-30%
Decrease by >30%
6c Do plants with this genetic ability exist in the field for all major crop types grown in the UK at present, e.g. wheat, oats, barley, oilseed rape or sugar beet? YES NO (please state which) 6d If, not do they exist in the laboratory? YES NO (please state which) 6e Are the improved varieties of these plants likely to be suitable for the purposes for which they are currently used e.g. milling, animal feed, alcohol production etc? YES NO (please state which) 6f Do think that the uptake of improved varieties is likely to vary by farm size, type or location? YES (please explain) NO SECTION C – IMPROVING FIELD DRAINAGE Improving the drainage of agricultural land 7. What proportion of the grassland (LFA and non-LFA, not inc. rough grazing) in the UK could
significantly increase yield by:
(a) having drainage installed <5% 6-10% 11-15% 16-20% 21-25% 26-30% >30%
(b) having existing drainage renovated <5% 6-10% 11-15% 16-20% 21-25% 26-30% >30%

103
8. What proportion of the arable land in the UK could significantly increase yield by:
(a) having drainage installed
<5% 6-10% 11-15% 16-20% 21-25% 26-30% >30%
(b) having existing drainage renovated <5% 6-10% 11-15% 16-20% 21-25% 26-30% >30%
9. Do think that the condition of the existing drainage system varies between different regions of the UK?
YES (please explain) NO
10. Are there any regions of the UK in which improving drainage is more likely to be a more suitable way of reducing N2O emissions?
YES (please explain) NO Section D – NITRIFICATION INHIBITORS 11. If nitrification inhibitors (such as DCD) were applied together with N fertiliser application:
(a) What would be the effect on N2O emissions from arable land?
Decrease by <1%
Decrease by 1-4%
Decrease by 4-6%
Decrease by 6-8%
Decrease by 8-10%
Decrease by 10-15%
Decrease by 15-20%
Decrease by 20-25%
Decrease by >25%
(b) Would you expect yields to (state a percentage if possible)
Decrease Stay the same Increase
(c) What would be the effect on N2O emissions from grassland? Decrease by <1%
Decrease by 1-4%
Decrease by 4-6%
Decrease by 6-8%
Decrease by 8-10%
Decrease by 10-15%
Decrease by 15-20%
Decrease by 20-25%
Decrease by >25%
(d) Would you expect yields to (state a percentage if possible)
Decrease Stay the same Increase ADDITIONAL COMMENTS: please add any further comments you have on the issue raised in this questionnaire in the space below.

104
APPENDIX C. Review of the uncertainty in key measures
This appendix provides a summary of expert responses and comments from the survey sent out in early March 2010. It also summarises the discussion of key uncertainties at the expert meeting on 23 March 2010 in Edinburgh as well in other one-on-one sessions and written communication. The following measures were reviewed in detail through expert consultation.
• Improving the drainage of agricultural land • Improving timing of mineral fertiliser N application • Improving timing of manure/slurry N application • Making full allowance for the N supplied in manures when deciding on the amount of fertiliser-N
to apply to a crop • Avoiding excess N • The use of nitrification inhibitors • The use of improved N use plants • Anaerobic digestion • Ionophores • Dairy and beef cattle – Breeding for improved productivity and fertility
The key revisions made to the MACC assumptions in light of the expert review are listed at the end of each measure section. .
IMPROVING THE DRAINAGE OF AGRICULTURAL LAND Introduction Improving the drainage of agricultural land can reduce greenhouse gas emissions in three ways:
1. Directly by reducing denitrification; 2. Indirectly by increasing yields. 3. Directly by reducing anaerobism and methanogenesis
There is evidence that improving land through drainage could make a significant contribution to reducing GHG emissions. The most comprehensive assessment of N2O studies to date was carried out by Bouwman et al. (2002), who showed in over 600 comparisons that N2O emissions from poorly drained soils were about 10% higher than well drained soils. Work on the effect of soil water table on N2O emissions was carried out by Dobbie and Smith (2006) in Scotland, and showed a substantial fall in emissions with an increasing depth to water table, under a drained pasture. These results suggest that if drainage were improved, the annual flux could be substantially reduced. Uncertainty 1: What is the current state of drainage in the UK, i.e. what % of land could increase yield and reduce emissions by having drainage improved, either through the installation of new drainage or the renovation of existing drainage? Original assumptions Recent work for the UK Committee on Climate Change concluded that improving drainage could be one of the most important ways of mitigating agricultural GHG emissions (it was estimated that it could reduce UK emissions by 1.7 MtCO2e at a cost of £14/tCO2e (Moran et al. 2008)). However, elements of this analysis have been questioned (Scottish Government 2009, Harris et al. 2009, AEA 2009), and considerable uncertainty remains regarding the abatement potential of improved drainage.

105
One of the main unknowns is the present state of drainage (and therefore the extent to which it could be improved). Drainage schemes were subject to significant grants in the 1970‟s and 1980‟s, and consequently a large area of land was drained during this period. In the original analysis, it was estimated that drainage could be improved on 1.86m ha across the UK. This is based on the following assumptions (derived from expert opinion) that the maximum amount of land on which drainage could be improved were:
40% of grassland
30% of arable land The central feasible potential was based on an uptake of 45% of the maximum technical potential, i.e. drainage could be improved on:
18% of grassland
14% of arable land Feedback
ADAS (2009) noted that anecdotal evidence indicated that “Most of what was worth draining was drained, both arable and grassland. The land not drained but still productive was probably subject to significant slopes. Other land was probably marginal. For this reason, we would estimate maybe 25% of your figure” – i.e. an area of approximately 0.5m ha could be improved. However, they also noted “we are not aware of any studies/data.”
“The SAC assessment that 40% of grassland could beneficially receive a full under drainage system is a high figure and we would regard 30% as being at the maximum. Arable production on clay and medium soils is usually dependent on functioning under drainage systems (i.e. if the land did not have an effective drainage system it would make it very difficult to grow winter cereals/oilseeds on a significant area of drained clay and medium soils in most years). Therefore, the potential to improve land drainage on arable land is likely to be lower than on grassland. Our view is that the SAC estimate of 30% of arable land that could benefit from improved drainage is too high and a more realistic estimate may be 10%.” (RMP5142, p31)
Range Range of estimates of the maximum areas where drainage could be improved: • 30-40% of grassland • 10-30% of arable land Other evidence “The application potential depends on the area of land that is (a) not drained, but could be, and (b) is drained but the drainage is underperforming (e.g. due to lack of maintenance). In addition, the application potential also depends on the features of the land where drainage could be improved (e.g. in terms of location, farm system, and land characteristics). Given that grants were distributed more than 20 years ago, there should be scope for improvement. Godwin et al. (2008, p10) note that land drainage has seen little reinvestment since the mid-80s, and there could be 2m ha, plus 50,000ha x 20 years = 3m ha requiring improvement, (i.e. ~25% of land)” Michael MacLeod 2009 “Still believe that there is very limited area to which it can be applied.” ADAS Feb 2010
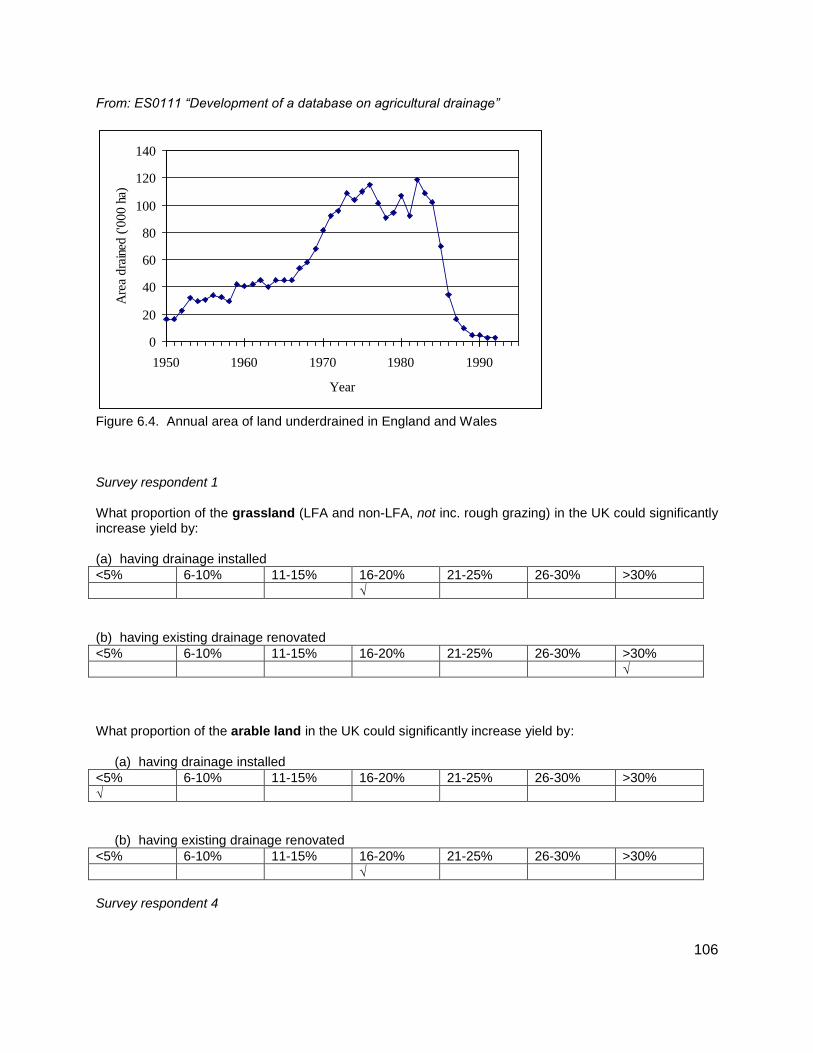
106
From: ES0111 “Development of a database on agricultural drainage”
Figure 6.4. Annual area of land underdrained in England and Wales Survey respondent 1
What proportion of the grassland (LFA and non-LFA, not inc. rough grazing) in the UK could significantly increase yield by:
(a) having drainage installed
<5% 6-10% 11-15% 16-20% 21-25% 26-30% >30%
√
(b) having existing drainage renovated
<5% 6-10% 11-15% 16-20% 21-25% 26-30% >30%
√
What proportion of the arable land in the UK could significantly increase yield by:
(a) having drainage installed
<5% 6-10% 11-15% 16-20% 21-25% 26-30% >30%
√
(b) having existing drainage renovated
<5% 6-10% 11-15% 16-20% 21-25% 26-30% >30%
√
Survey respondent 4
0
20
40
60
80
100
120
140
1950 1960 1970 1980 1990
Year
Are
a d
rain
ed (
'00
0 h
a)

107
“Improved / increased land drainage will depend on the balance between future profitability of farming, and environmental constraints on further drainage, so are not easy to predict.” Survey respondent 5 “In our experience drainage systems are better maintained on arable land than on grassland.” Survey respondent 8 “soil cultivation techniques and maintenance of good soil structure all important”
(a) having drainage installed
<5% 6-10% 11-15% 16-20% 21-25% 26-30% >30%
X
One would presume that the land that needed drainage already has drainage installed (b) having existing drainage renovated
<5% 6-10% 11-15% 16-20% 21-25% 26-30% >30%
X
It is likely that a significant percentage of field drains have deteriorated but difficult to assess what proportion could benefit from improvement. 7. What proportion of the arable land in the UK could significantly increase yield by:
(a) having drainage installed (* and improving soil structure (c) -16-20%)
<5% 6-10% 11-15% 16-20% 21-25% 26-30% >30%
X
(b) having existing drainage renovated
<5% 6-10% 11-15% 16-20% 21-25% 26-30% >30%
X
Reducing Uncertainty Analysis of the data collected in ES0111 “Development of a database on agricultural drainage”. Contact the Land Drainage Contractors Association and see if they can provide data on volume and distribution of work done. “Method included in AC0222 (a) Produce an objective proposal for nitrous oxide emissions based on likely soil conditions and agree i) likely denitrification (and nitrification) rates in drained soils ii) associated uncertainty values. (b) Nitrification rates and uncertainty values (c) Field values for nitrification – NB current Defra consortium projects.” ADAS 2010 “The uncertainty in baseline conditions is recognised as an important issue and will be explored further in DEFRA's new inventory project ACO114. This will use a combination of expert opinion and existing records to determine the nature and extent of current drainage conditions. Given the uncertainty associated with both baseline conditions and the affects of drainage on N2O emissions identified in this report, further research on this issue remains a priority. If as seems likely from anecdotal evidence, there has been a deterioration in the UK's drainage status, then we need to have a better understanding of the impact of that on N2O emissions, and how that might be interact with other mitigation measures.” Bob Rees Feb 2010
108
Regional variation Does the condition of the existing drainage system vary between different regions of the UK?
Are there any regions of the UK in which improving drainage is likely to be a more suitable way of reducing N2O emissions? Discussion at Expert Meeting AF – Ron Spiers looked at the state of drainage in the 1990‟s, explained in follow-up e-mail to Bob, 24/3/10 “I‟ve looked for Ron‟s graph of drainage replacement but can‟t find it. All he did was to estimate the area of arable and improved grass in Scotland requiring underdrainage, perhaps 50% of the total area. He then divided this by 100 and by 120 to give mean rate of replacement drainage required assuming schemes last 100 or 120 years. He plotted annual area actually drained on the Y axis against time (years) on the X axis. The required replacement rate was shown by two horizontal lines, one for 100 year life and one for 120. It was interesting that even in the peak years of 1980 or so, the required replacement rate was not exceeded by much and going back to 1950, in most years schemes would be failing faster than they would be being replaced. As in many things, we are living on Victorian engineering.” PNP – soil type an important variable, drainage won‟t be effective on some soils, e.g. mottled gleys moling being done on most arable sites on medium and heavy clay soils – arable no longer viable on these soils without moling – less than 5% not viable without drainage. Grass – drains will improve spring yield but can reduce yield later in year – overall improvement marginal, about 5% or less of grassland could increase yield by improving drainage. KSm – there is a relationship between drainage, wetness of profile and WFPS, and there‟s a exp relationship between WFPS and emissions flux “overall body of evidence points towards a beneficial effect” (in terms of reducing N2O fluxes). Weather is the key factor, but drainage enables land to drain more quickly. Bob asked PNP – why the big disparity between his assumption (of 5%) and our much higher area? PNP – his lower estimate is based on (a) the assumption that the heavy soils mean that drainage would not be effective in many area, and (b) that most land that could be drained in 70‟s-80‟s was drained. AF – “that‟s certainly not the case in Scotland” most grassland in Scotland won‟t have drains from the 1980‟s, though many will have drains from the 1880‟s, which are now coming to the end of their lives. KSm – Fluxes in his Bush experiments were observed in which Emission Factors were between 0.4-7.0% depending on season. Poaching/soil damage can increase fluxes by double. Variables: mineral N in soil, water content, T. Bruce – compaction was in initial MACC – need to revisit. DH – drainage is a risk-minimisation strategy. Problems are due to poor soil management, rather than lack of drainage. AF – but drainage helps to manage soils. AF – costs of drainage
£5k/ha for 10m spacing and gravel fill
£3k/ha for 10m spacing with no gravel fill
£2k/ha for 20m spacing with no gravel fill

109
Fixing drainage about 1/3 cost of installing it – you can put in lateral drains.
Cost of moling?
Most drainage uses gravel fill – use £2-5k/ha as a range
If you target problem areas and hotspots, rather than draining whole fields, the costs would be reduced further.
Is there a case for doing MACCs within measures, i.e. for different types of drainage applied to different soils, in different areas, being used for different purposes (e.g. silage, grazing, arable etc)? US – AR of 1tCO2e/ha seems arbitrary Revisions arising: Area of application Area - Lower bound – less than 5% of arable and grassland based on PNP, so revised ranges:
REVISION: Change range of estimates of the maximum areas where drainage could be improved: • 5-40% of grassland • 5-30% of arable land
Regional variation More scope for improving drainage in Scotland as (a) less was drained in the past, and (b) different soil types – drainage could be improved on most grassland over imperfectly drained soils. Drainage won‟t be effective on some soils, e.g. mottled gleys. So in terms of the areas where drainage could be improved, Scotland may be at the higher end and England at the lower end.
REVISION: Use £2k to 5k/ha as a range of costs.
Uncertainty 2: To what extent would improving drainage reduce emissions? Original assumptions Based on expert opinion, it was assumed that where drainage could be improved, it would reduce emissions by 1.0t CO2e/ha/year. Feedback "On balance improved drainage should reduce emissions of N2O, although on some soils, in some seasons, emissions could increase. This approach is difficult to quantify." AEA 2009 "There does seem to be some debate on this issue. Our concern is that improving land drainage may not axiomatically reduce emissions of N2O, which are related to water-filled pore space (WFPS). There is a risk that on the heavier, wetter soils, in which denitrification takes place but produces predominantly N2, drainage will reduce the WFPS to that optimum for production of N2O. Stehfest and Bouwman (2006) did not identify drainage status as a controlling factor for emissions from agricultural fields. For soils under natural vegetation Stehfest and Bouwman found smaller emissions from poorly-drained soils. They considered that, in general, poor drainage and high bulk density both limit gas diffusion. Under low gas diffusivity N2O is more likely to be re-consumed before being emitted from the soil (Davidson, 1991). In contrast, Rochette (2008), in an evaluation of the interaction between drainage status and tillage regime on emissions of N2O reported greater emissions, under all tillage regimes, for poorly-drained soils." AEA 2009
110
“The effect of soil drainage status on nitrous oxide emissions is uncertain. In waterlogged conditions, denitrification is likely to occur which may lead to the formation of N2 gas in preference to nitrous oxide, so the quantity of nitrous oxide emitted may be reduced compared to well drained soils. Also, nitrate leaching losses may be greater on land with improved drainage compared with undrained land which may lead to increased indirect nitrous oxide losses. For these reasons, we estimate that the abatement rate for drainage is very low. Adoption rates have not been assumed due to the cost of full under drainage systems.” RMP5142 “Is this a cost-effective measure?” Scottish Government Range “very low” to 1.0t CO2e/ha/year Other evidence “Information on drainage indicates that this is important, see Bouwman et al. (2002), Smith and Dobbie (2002). The most comprehensive assessment of N2O studies to date was carried out by Bouwman. He showed that in over 600 comparisons that N2O emissions from poorly drained soils were about 10% higher than well drained soils (Bouwman et al. 2002). Work on the effect of soil water table on N2O emissions was carried out by Smith and Dobbie (2002) in Scotland, showed a very substantial fall in emissions with an increasing depth to water table, under a drained pasture. The largest fluxes occurred when the soil water table was within 10 cm of the surface and other parameters were not limiting. (See figure below). These results suggest that if the if drainage were improved, the annual flux could be substantially reduced.” Bob Rees 2009 Will current systems be able to cope with increased volatility of the weather? "In addition to uncertainty regarding the application potential of drainage, there is ongoing debate regarding the extent to which improving drainage affects N20 emissions." RTD 2009 “A couple of points have been missed so far. Firstly improved drainage can help improve N uptake efficiency of fertiliser N, leading to the need to apply less N, or leave less soil N to be lost as N2O. However improved drainage also alters the balance of processes generating N2O. Less wet soils may produce less N2O by denitrification (unless the soils were previously producing N2 by denitrification). However less wet soils also produce more N2O by nitrification. The balance of these processes is therefore difficult to predict and uncertainty must therefore be high.” (Bob Rees Feb 2010) We accept that there is potential for significant variation in N2O emissions dependent upon a range of variables - moisture, compaction and temperature. ADAS Feb 2010 “To reiterate the point on drainage. Very wet fields, in wet areas, where WFPS is >80% for much of the season are likely to emit little N2O as denitrification will tend to go all the way to N2. Hence draining these, if it increases the proportion of the year when WFPS is 60-80% then an increase in N2O emissions could occur. Also, aeration leading to increased oxidation of accumulated SOM and consequent nitrification could also increase emissions of N2O. This is not to say that improved drainage will not have benefits on many soils in many areas, but it needs to be carried out appropriately.” Survey respondent 1 Costs/benefits Yield effects – no direct yield effect, but potential indirect yield increase by enabling greater access to fields, i.e. half a poorly drained field may be unworkable 1 year in 5 = 10% loss of yield. Abatement rate
111
REVISION: Change from single abatement rate of 1t to range suggested in light of the meeting, i.e. 0.2 to 1.0tCO2e. NOTE that 0.4 – 7.0% refer to variation in emissions factors, NOT % reductions in emissions.
Reducing uncertainty in the future KSm – model relationship between drainage and WFPS, then combine with evidence base on WFPS and N2O fluxes. Include poaching effects in models. Other measure ACTION: Add soil management as a measure?
IMPROVING TIMING OF MINERAL FERTILISER N APPLICATION
(i.e. matching the application with the time the crop will make most use of the fertiliser) Introduction Matching the timing of application with the time the crop will make most use of the fertiliser reduces the likelihood of N2O emissions by ensuring there is a better match between supply and demand. This can be achieved by avoiding time delays between the application of N and its uptake by the plants, i.e. by avoiding applying fertiliser when the crop is not growing, or when there is no crop. This is essentially best practice and should not entail any additional costs (providing adequate storage is available). In fact, improving timing should result in small (3-5%) increases in yield through more efficient use of the nutrients. Uncertainty 1: Over what % of each land category where N2O emissions could be reduced by altering the timing of mineral fertiliser N application? Uncertainty 2: Where reductions in N2O emissions are possible, what effect will altered timing of mineral N applications have on emissions? Original assumptions The maximum areas of land on which mineral N timing could be improved are:
70% of grassland
80% of arable land The central feasible potential was based on an uptake of 45% of the maximum technical potential, i.e. timing could be improved on:
32% of grassland
36% of arable land The abatement rate where timing could be improved would be 0.3t CO2e/ha/year. Feedback
Farm practice is to spread fertiliser in spring when crops are actively growing and taking up nitrogen. There is very limited scope for improving fertiliser N application timings to improve fertiliser N utilisation by crops. We have suggested scope for implementation on 10% of land for all categories (RMP5142, p33).
112
Lower abatement rate. ADAS 2009
In their 2009 review AEA set the minimum area of application as 0%
No yield increase. Scottish Government 2009
Does this take into account possible reductions in emissions from split application? CCTF 2010 "The SAC report indicated that improved mineral-N timing could lead to a 3-5% increase in yield and hence reduce emissions of N2O by 3-5% as a result of reducing the amount of N needed to produce a given amount of crop. A large body of existing data shows crop yields are not sensitive to nuances in timing (largely unpublished ADAS data). Advisory experience suggests that farmers apply N fertiliser at the times recommended by systems such as PLANET, hence our conclusion that there is no further scope for reducing emissions of N2O by this means. The upper range for potential abatement could be regarded as the 5% quoted by SAC. However, in this revision we have not assigned a range of potential efficiencies for this measure as the evidence seems clear that there is no further potential for yield improvements from timing of fertiliser-N application." AEA 2009 “We do not think there is enough research evidence to make a judgement on the effect of fertiliser timing on direct nitrous oxide emissions in the UK. Recently commissioned (AC0213) and planned (AC0116) Defra funded work will investigate the effect of fertiliser application timing on nitrous oxide emissions.” ADAS March 2010 Range Areas where timing could be improved:
0-70% of grassland
0-80% of arable land The abatement rate where timing could be improved: between 0 and 0.3t CO2e/ha/year. Other evidence “Timing of N applications is widely recognised as an important opportunity for the mitigation of N2O emissions (McTaggart et al. 1997; Smith et al. 1997; Mosier et al. 1998; Johnson et al. 2007; Ball et al. 2008). It is noted by Smith et al. 1997; that “The timing of fertiliser application can have an important role in determining the magnitude of N2O and NO emissions” Given this sensitivity of N2O emissions to timing we consider that the 3-5% reduction in emissions as a consequence of improved timing is modest.” (Bob Rees 2009) “People often don‟t tailor timing of splits to growth conditions – scope to alter splits. “Although not as prescriptive as we might want, the HGCA Report 159 'An Integrated Approach to Improving Nutrition for Wheat' (1998) provides evidence for being able to manipulate N uptake by adjusting nitrogen fertiliser amount and timing. Essentially, yield and quality is maintained at least through better use of nitrogen i.e. optimising uptake and leaf canopy size.” (Steve Hoad 2009) “Data from the British Survey of Fertiliser Practice (2008) suggests that 58% of grassland and 91% of arable land receives applications of manufactured inorganic nitrogen each year. It is unlikely that changing fertiliser timings will reduce nitrous oxide across all the land area receiving applications of inorganic fertiliser N” ADAS March 2010 Reducing Uncertainty Evidence in recent AIC/Defra seminar? “Timing continues to be identified as a potential measure for reducing N2O emissions. The uncertainties involved have supported the establishment of a number of recent research programmes in this area.

113
These include DEFRA projects ACO213 and ACO116 (grassland and cereals and mineral fertiliser) ACO111 (grassland and slurry), and the EU project NitroEurope (grassland and timing). These projects are either in the process of being commissioned, or have yet to report, but will deliver valuable new evidence on the role of timing in contributing to N2O mitigation”. (Bob Rees Feb. 2010) “Different views and findings in literature mean that reducing uncertainty is difficult. There is also the issue of how novel fertilisers and other soil treatments might be applied e.g. slow release fertilisers and nitrification inhibitors. In future, potential for improving N use and timing will be linked more strongly to plant breeding.” (Steve Hoad Feb. 2010) “Method included in AC0221 and AC0222 (as Use an N fertiliser management plan)
a) There is very limited evidence on the effect of timing on crop yield and no studies have systematically quantified the effect of N timing on GHG emissions.
b) What kind of data is needed to fill the gaps identified? This will inform medium to long term needs. How much can farmers actually alter practice? What are the costs to overcome these barriers?
c) Defined by the answers to (b). “ ADAS March 2010 Regional variation Is there is significantly more or less scope for improving mineral N timing in certain regions of the UK, e.g. outside NVZs? Discussion at meeting and revisions arising BR – presented evidence that suggested timing could affect emissions AS – the top of the (fertiliser applied v yield) response curve is very flat – you can apply +/- 20kg without really affecting yield very much. US – timing may be able to affect emissions in theory, but in practice the farmer may not be able to wait until the optimum time. BB delaying could cost – if you‟ve got to delay for five days you‟re losing yield. KSm – if you use urea (i.e. ammonium) based fertiliser for first application you can cut emissions by 16% US – downside is ammonia emissions (but these emissions depend on temp) AS – urea ok for first application on arable, but not seen as viable on grass where farmers want an “early bite”. PNP - British Survey of Fertiliser Practice (2008) suggest that mineral fertiliser is applied to 58% of grassland and 91% of arable land, so revised maximum areas of application:
REVISION: Change areas where timing could be improved to:
10 to 58% of grassland
10 to 80% of arable land REVISION: Change the abatement rate where timing could be improved to a range of between 0 and 0.3t CO2e/ha/year

114
IMPROVED TIMING OF MANURE/SLURRY N APPLICATION Introduction Matching the timing of application with the time the crop will make most use of the fertiliser reduces the likelihood of N2O emissions by ensuring there is a better match between supply and demand. This can be achieved by avoiding time delays between the application of N and its uptake by the plants, i.e. by avoiding applying fertiliser when the crop is not growing, or when there is no crop. This is essentially best practice and should not entail any additional costs (providing adequate storage is available). In fact, improving timing should result in small (3-5%) increases in yield through more efficient use of the nutrients. Uncertainty 1: Over what % of each land category could N2O emissions be reduced by altering the timing of manure/slurry N application? Uncertainty 2: Where reductions in N2O emissions are possible, what effect will altered timing of manure/slurry N applications have on emissions? Uncertainty 3: On land where the timing of manure/slurry N could be improved, what proportion of farmers would require extra manure/slurry storage capacity in order to improve management? Original assumptions The maximum areas of land on which manure/slurry N timing could be improved are:
70% of grassland
60% of arable land The central feasible potential was based on an uptake of 45% of the maximum technical potential, i.e. timing could be improved on:
32% of grassland
27% of arable land The abatement rate where timing could be improved would be 0.3t CO2e/ha/year. Feedback
The IGER report suggests that spreading manure at appropriate time/conditions will reduce nitrous oxide emissions from organic fertiliser applications by 2-10% (equivalent to 40-230 kt CO2e). Smith et al 2001a and b suggest that around 50% of slurries and poultry manures are applied in the autumn/winter period, so the maximum improvement that can be achieved would be on 50% of the land receiving slurries and poultry manures. However, there are a number of practical issues that make it difficult to spread manures in spring (especially on heavy clay soils) such as damage to soils, run off from spreading a low dry matter slurry in high volumes on to wet soil and the risk of rain following application. A certain amount will always be spread on stubbles in the autumn although this is now limited by the new NVZ rules which only allow applications in August and September or from January. The SAC implementation levels of 70% on grassland, 60% on arable, 50% on roots and 40% on other crops are in our view high and we would suggest 15% on all categories of land. (RMP5142). Lower abatement rate. ADAS 2009
No yield increase. Scottish Government 2009
Does this take into account possible reductions in emissions from split application? CCTF 2010
"The SAC report suggested that improved manure-N timing would be effective by the same mechanism as that given above. We agree that there is scope to improve effectiveness of

115
manure-N by better timing, but this is not easy to quantify. For example, manures are often applied in late summer and early autumn before planting arable crops. However, most, if not all, of the available-N in such manures may be lost by leaching over winter. It is currently a requirement in NVZs not to apply slurries or poultry manures to soils with a high risk of leaching at these times. However, opportunities to apply all manures in spring, when the available-N will be recovered more efficiently, are limited and may conflict with measures to reduce emissions of NH3. We agree with the 4% abatement potential proposed by SAC. The range would be that cited in the Defra report by IGER and ADAS (AC0206) i.e. 2-10%. This measure was acknowledged to be of high uncertainty in the SAC report. SAC were happy with this comment." AEA 2009
Range
15% to 70% of grassland
15% to 60% of arable land Abatement rate of between ? and 0.3t CO2e/ha/year. Other evidence Survey respondent 1: “In my opinion impossible to say, for two reasons. First, N2O emissions following manure application appear to be greatly influenced by subsequent weather, but the relationship is not clear. Second, and more important, our information of where and when manures are applied is extremely uncertain. We know most manures are applied on the farms from where the manure originates, and generally near to the buildings and stores where the manure is kept. But we would not know details of soil type or condition. Second, our data on timing of application is very broad, the UK inventories report proportions of manure applied in the different seasons - that is the limit of our precision. While good models of N2O emission should be able to discriminate between emissions following slurry application to a well-drained sandy loam and a heavy clay, and between applications made to a soil at less than field capacity prior to a period of rapid crop growth and applications made to the same soil prior to a wet and cool spell, we don't have sufficiently detailed information on times and locations of application to discriminate at national level. I suspect improved timing does have a fair potential to reduce emissions following manure applications, but hard to quantify. Area of application: grassland 50%, arable 10%” “There is some evidence from Defra project ES0115 that spring slurry application timings on free-draining grassland soils reduced nitrous oxide emissions compared with late autumn/early winter timings. However, we feel it is necessary to wait for the results from Defra project AC0111 before commenting on the effect that application timing may have on nitrous oxide emissions.” ADAS March 2010 “Data from the Farm Practice Survey (2009) suggests that 18% of farmers test the nutrient content of organic manures. The Professional Agricultural Analysis Group Report 2008/09 indicates that routine soil analysis (i.e. P, K, Mg, pH) is carried out on about 30% of the arable and managed grassland area. Further information on soil mineral N sampling will be available from farmer surveys undertaken as part of Defra project AC0221” ADAS March 2010 Survey respondent 8 41-50% would require extra storage capacity Reducing Uncertainty Method included in AC0221 and AC0222 For grassland:
a) Agree extent of slurry spread at relevant times b) Rates applicable throughout the DAs

116
c) Field values for nitrification – NB current Defra consortium projects. “Awaiting AC0111, but we do not feel there is the data to provide a quantified figure” ADAS March 2010 Regional variation Is there is significantly more or less scope for improving mineral N timing in certain regions of the UK, e.g. outside NVZs? Discussion at meeting and revisions arising AS – “So much being applied in autumn/early winter due to lack of storage capacity, so much bigger potential for being (more) efficient” PNP – BSFP 18% test for nutrient content of manures. PNP – British Survey of Fertiliser Practice (2008) suggests that manure is applied to 34% of grassland and 22% of arable land), so revised maximum areas of application:
REVISION: Change areas where timing could be improved to:
15-34% of grassland
15-22% of arable land
Regional variation Should be better storage (and better timing) in NVZs. NVZ rules currently restrict autumn winter application, so there should be more scope for improving timing outside NVZs? AF – a lot of Scottish livestock is not in NVZ‟s, so more potential for improving timing? However, much of the slurry is produced in the west, but is needed for application to arable areas in the East. A possibility would be to use pelletiser plants for drying slurry, but need to achieve economies of scale, plus what would the LCA effects be? ACTION – investigate costs of storage (SGovt info on storage grants may be useful)
MAKING A FULL ALLOWANCE FOR THE N SUPPLIED IN MANURES WHEN DECIDING ON THE AMOUNTS OF FERTILISER-N TO APPLY TO A CROP
Introduction This involves using manure N as far as possible. The fertiliser requirement is adjusted for the manure N, which potentially leads to a reduction in fertiliser N applied. In addition, the manure N is more likely to be applied when the crop is going to make use of the N, and therefore N2O emissions will be reduced. This measure should reduce N fertiliser inputs by about 15%. Uncertainty 1. What is the maximum % of each land category where N2O emissions could be reduced by making a full allowance for the N supplied in manures when deciding on the amounts of fertiliser-N to apply to a crop? Uncertainty 2. By what proportion could fertiliser N be reduced, without affecting yield, if famers were able to take full account of manure N?

117
Original assumptions The maximum areas of land on which N2O emissions could be reduced by making a full allowance for the N supplied in manures:
80% of grassland
50% of arable land The central feasible potential was based on an uptake of 45% of the maximum technical potential, i.e. timing could be improved on:
36% of grassland
23% of arable land Fertiliser N is reduced by 15%, leading to a reduction in emissions of 0.4t CO2e/ha/year. Feedback “The AEA assessment of this measure for the EA, made using data reported by the British Survey of Fertiliser Practice (BSFP) suggested the potential for this measure is nearer to 2% than the 15% used by SAC. The report AC0206 suggested there was potential to reduce fertiliser-N use by 5% by making better allowance for manure-N. , We consider this measure cannot exceed a reduction of 11% of fertiliser-N applications, since the total amount of readily-available manure-N applied to land, as estimated by the NARSES model (Webb and Misselbrook, 2004), is only c. 11% of the amount of fertiliser-N currently applied. SAC make the point that readily available manure N at the time of application is not the only driver of N2O emissions since mineralisation and subsequent nitrification/denitrification are likely to be significant (Jones et al. 2007). We do not disagree with this statement, but it is not the point of our argument. On p 26 and elsewhere of the final report the point is made that the measure's effectiveness is via reducing the total amount of N applied. This will only be done with respect to readily-available N which is what is taken up by the crop. If allowance is made for total manure-N applied this will have costs since yield will be reduced. Hence the range of potential abatement may be taken to be 2-11%. This measure was acknowledged to be of high uncertainty in the SAC report.” AEA 2009 "Significant uncertainty regarding the abatement potential of this measure, specifically: what is the level of readily available N from manure that mineral applications could be reduced by without affecting yield?" RTD “The actual saving (in fertiliser N) will depend on manure type, timing of application and any changes in timing as opposed to current practice.” Scottish Government 2009 “The IGER report suggests a 5% reduction in N2O emission from organic fertiliser applications which would be equivalent to 110kt CO2e. SAC rates of implementation on 80% of grassland and 50% of arable land are in our view very high and a more realistic assumption would be 15% on both grassland and arable. With regard to root crops, SAC suggests implementation of 20% of the area where we would suggest 10% and for other crops, we would agree with the SAC estimate of 10%.” RMP5142 “Existing uptake of this measure (in theory this is already carried out in NVZs however in practice testing manure and soil will give more accurate results than if standard figures are used – does the economic analysis account for this? If not remember that slurry needs to be stirred prior to testing and application and this also requires equipment.) Could higher technical potential be achieved through this measure by targeting application through use of precision techniques?” CCTF 2010 Range
15% to 80% of grassland
15% to 50% of arable land

118
A reduction in fertiliser application of from 2 to 15% Other evidence “There is anecdotal evidence that farmers don‟t take (full) account of manure N when deciding how much mineral N to apply (though they are meant to as part of NVZ best practice). Research is required to establish actual practice. Readily available manure N at the time of application is not the only driver of N2O emissions since mineralisation and subsequent nitrification/denitrification are likely to be significant (Jones et al. 2007)” Bob Rees 2009 Survey respondent 1:
Grassland (LFA and non-LFA, not inc. rough grazing)
Cereals and oil seeds
30
15
Reduction in fertiliser application: 4-5% Survey respondent 2:
Grassland (LFA and non-LFA, not inc. rough grazing)
Cereals and oil seeds
30
15
Reduction in fertiliser application: 1-2% Survey respondent 8
Grassland (LFA and non-LFA, not inc. rough grazing)
Cereals and oil seeds
40% plus 15% plus
Reduction in fertiliser application: 3-4% “Data from the British Survey of Fertiliser Practice (2008) suggests that 34% of grassland and 22% of arable land receives applications of organic manure.” ADAS 2010 “There will be more scope to reduce fertiliser N applications and change application timings from autumn to spring for slurries and poultry manures. The practicalities of spreading straw-based FYM will usually limit applications to the autumn in arable systems.” ADAS March 2010 Reducing Uncertainty “Ask farm advisors about current farm practice (to complement data gathered in the BSFP). It would seem reasonable to undertake some survey work here, with a random selection of farmers to try to assess the extent to which farms comply with fertiliser recommendations. Another option might be to try to match fertiliser sales in a given area (perhaps the whole UK) with what might be predicted in terms of N use according to recommendations (not a trivial task)” Bob Rees Feb 2010 “Need to have a method to estimate labile N and potential mineralisation rate in manures so that their N input contribution can be assessed.” Bruce Ball Feb 2010
119
"Included in AC0222 (a) Produce an objective proposal for nitrous oxide emissions based on likely soil conditions and agree uncertainty values. (b) Nitrification rates and uncertainty values (c) Field values for nitrification – NB current Defra consortium projects." ADAS 2010 Regional variation Is there likely to be significantly more or less scope for making full allowance of manure N in certain regions of the UK? Discussion at meeting and revisions arising PNP – British Survey of Fertiliser Practice (2008) suggests that manure is applied to 34% of grassland and 22% of arable land.
REVISION: change ranges for this measure to:
15-34% grassland
15-22% of arable land REVISION: recalculate abatement rate and cost based on a range of reductions in fertiliser application of from 2 to 15%
AVOIDING EXCESS N Introduction Reducing N application in areas where it is applied in excess reduces N in the system and therefore reduces N2O emissions. There are various schemes and advisory activities to help farmers apply N at optimum recommended rates, for example: Defra‟s RB209 guidance (http://www.defra.gov.uk/farm/environment/land-manage/nutrient/fert/rb209/index.htm); Sinclair (2002). Unlike simply reducing N fertiliser application rates, avoiding N excess should not lead to reductions in yield. It is assumed that the N fertiliser purchase costs will be reduced by 10%. Uncertainty 1. On what % of each land category could N2O emissions be reduced by reducing the total amounts of (mineral and organic) N application, without reducing yields? Uncertainty 2. By what proportion could fertiliser N be reduced, without affecting yield? Original assumptions It was assumed that N application could be reduced without affecting yield on a maximum of:
80% of grassland
80% of arable land

120
The central feasible potential was based on an uptake of 45% of the maximum technical potential, i.e. excess N could be avoided on:
36% of grassland
36% of arable land It was assumed that N application could be reduced by 10% without affecting yield, and that this would lead to a reduction in emissions of 0.4t CO2e/ha/year Feedback "The SAC report assumes fertiliser-N use can be reduced, so that applications do not exceed the recommended optimum, by 10% without reducing yield. Project AC0206 suggested a 5% reduction might be feasible, while our assessment of the BSFP data indicated a 1% reduction might be more appropriate. Hence the range of abatement potential varies from 1 to 10 %. SAC agreed with this range of potential reductions." AEA 2009 “The IGER report suggests a 5% reduction (equivalent to 680 kt CO2e) in nitrous oxide emission from fertiliser, manure spreading and grazing by not exceeding crop N requirements. There is no good information available on whether excess N is being applied and if so over what land area. The main source of information on fertiliser use is the British Survey of Fertiliser Practice which suggests that fertiliser N use has reduced in recent years especially on grassland. For this reason, we have suggested the potential area for avoiding N excess on grassland is 5% compared with SAC at 20% and on all other land 5% compared with SAC at 20%. Recent significant increases in fertiliser prices mean there is economic pressure to avoid applying excess N.” RMP5142 "How is “excess” defined (past non-linear point of growth curve- level of RB209)? Does “excess” to grassland consider whether land is overstocked?
Existing level of uptake of this measure?
Does economic analysis consider the factors laid out in the impact assessment of the Nitrates Action Programme e.g. capital costs for increase slurry storage facilities, administrative costs for completion of a nutrient management plan?
Could higher technical potential be achieved through this measure by targeting application through use of precision techniques e.g. trailing shoes/hoses/ injectors? - if so can it be included and the cost analysis also be included?” CCTF 2010 Range Maximum area of land over which N input could be reduced without affecting yield:
5 to 20% of grassland
5 to 20% of arable land Maximum amount by which N application could be reduced without affecting yield:
1-10% Other evidence Survey respondent 1:
Grassland (LFA and non-LFA, not inc. rough grazing)
Cereals and oil seeds
15
5
N could be reduced by 4-5%
121
Survey respondent 2:
Grassland (LFA and non-LFA, not inc. rough grazing)
Cereals and oil seeds
20
10
N could be reduced by 9-10%
Survey respondent 4 I have some expertise on arable crops here. The evidence is that inadvertent over- and under-fertilisation are common, because recommendations are very imprecise, but intentional over-fertilisation is probably infrequent, hence scope for improvement is slight. I believe more specific answers, as you ask, would be no better than tossing a coin. “Data from the British Survey of Fertiliser Practice suggest that few farmers are over fertilising. Further information will be available from Defra project AC0221” ADAS March 2010 Survey respondent 8
Grassland (LFA and non-LFA, not inc. rough grazing)
Cereals and oil seeds
20% 5%
Decrease total N by 1-2% Reducing Uncertainty "Included in AC0221 (as N precision) and AC0222 (as Use a Fertiliser Management Plan). (a) AC0221 is to provide an estimate of the potential to reduce imprecision by considering past records and trial data and compared to prediction systems. (b) Summary of AC0221 to be provided to the expert meeting. (c) A better understanding of how much N is available for crop uptake from the soil (in the absence of fertiliser). HGCA project SNS Best Practice 3045 is looking at predicting natural N supply." ADAS 2010 Regional variation Is there significantly more or less scope for avoiding excess N in certain regions of the UK? “It is more likely that excess N is applied to certain crops (e.g. maize and potatoes) rather geographical regions of the UK” ADAS March 2010 Discussion at meeting and revisions arising AS – the only people that go beyond recommended rates are consultants – it‟s not their money BR – people over apply for 2 reasons: (a) insurance policy, (b) inadvertent – these won‟t be captured in the BSFP BR – (a) are farmers applying at the recommended rate, (b) is the recommended rate the economic optimum? Is the economic optimum the same as the N2O optimum?
122
DH – AC0221 should help here. Using averages we‟ve done quite well, to improve accuracy of N application rates, you need to know more about the soil. AS – need to gather data over time, to study relationship between amount applied, soil condition, subsequent weather and N2O fluxes. Economic optimum diff from biological optimum – see new SAC technical note for more on breakeven ratio (this is the amount of N need to be applied so that marginal revenue = marginal cost, however problem is that you know the cost of your fertiliser, but you don‟t necessarily know what you‟re going to get for your grain.
REVISION: Change maximum area of land over which N input could be reduced without affecting yield:
5 to 20% of grassland
5 to 20% of arable land REVISION: Change maximum amount by which N application could be reduced without affecting yield to range:
1-10%
REVISION: Change cost saving to a reduction in fertiliser cost of the range: 1-10%
NITRIFICATION INHIBITORS Introduction Nitrification inhibitors slow the rate of conversion of fertiliser ammonium to nitrate. This means that the rate of reduction of nitrate to nitrous oxide (or dinitrogen) is decreased and emissions of nitrous oxide decrease. The use of nitrification inhibitors and slow release fertilisers has been studied extensively (Smith et al. 1997; Merino et al. 2002; Di & Cameron 2003; Di & Cameron 2004; Ball et al. 2004; Di et al. 2007). Pioneering work in New Zealand has shown that the application of DCD to grazed grassland soils can reduce emissions of N2O, mainly from urine patches, by up to 82% (Di & Cameron 2002). This work also demonstrated that DCD applications could also increase herbage production by up to 30%, and more than half the nitrate concentration in drainage water, providing an added economic incentive to reduce N losses. However, Pollok (2008, p22) has noted that “They are expensive and significant reductions in mineral fertiliser requirements would be needed to make them cost-effective… there appears to be a need to measure effectiveness under UK systems”. It is assumed that the inhibitor makes good contact with the fertiliser or urine patch to be effective, and that the inhibitor will be applied at the right time and to the right fertiliser type. It is assumed that inhibitors lead to significant cost increases (equivalent to a 50% increase in fertiliser costs). These costs will be slightly offset by the reduced labour/machine costs. Uncertainty The effectiveness of inhibitors depends upon the conditions under which they are used and the research is not therefore always directly transferable. Research at SAC has shown mitigation can sometimes be more modest. There are no restrictions on the use of nitrification inhibitors or slow release fertilisers in the UK (except within organic farming). Further research is required to establish the relative benefits of nitrification inhibitors and slow release fertilisers. New DEFRA projects currently being commissioned (ACO116 and ACO213) to look at regional efficacy of nitrification inhibitors will help to reduce uncertainty. Research required:
What factors influence efficacy? How are they affected by local soil conditions and crop type?
What is the influence of application method and timing?
Soil/climate influence.
Yield/N recovery. There is a potential for yield improvements
123
Other N loss. Leaching and ammonia volatilisation may be reduced.
Interactions with other N sources. There are also potential benefits through increased soil N uptake
Scope for pollution swapping.
What‟s the effect on long term C:N balance? If soil N increases could this increase long term losses?
What are the side effects? Original assumptions The maximum areas of land on which nitrification inhibitors could be used are:
70% of grassland
80% of arable land The central feasible potential was based on an uptake of 45% of the maximum technical potential, i.e. timing could be improved on:
32% of grassland
27% of arable land The abatement rate where nitrification inhibitors could be used would be 0.3t CO2e/ha/year. Range
15% to 70% of grassland
15% to 80% of arable land
Abatement rate: ? to 0.3t CO2e/ha/year. Other evidence “We don‟t feel we can comment on this section until the results of the recently commission (AC0213) and planned (AC0116) Defra funded work are available. Work carried out in other parts of the world, and most notably New Zealand, has shown that NIs can reduce nitrous oxide emissions and nitrate leaching losses. However, this work has been carried out on farming systems, and under soil and climatic conditions that are not directly comparable with those in the UK.” ADAS March 2010 Reducing Uncertainty New DEFRA and RERAD funded research will help improve our understanding of mitigation potential and regional variability Regional variation
If nitrification inhibitors (such as DCD) were applied together with N fertiliser application: (a) What would be the effect on N2O emissions from arable land?
Decrease by <1%
Decrease by 1-4%
Decrease by 4-6%
Decrease by 6-8%
Decrease by 8-10%
Decrease by 10-15%
Decrease by 15-20%
Decrease by 20-25%
Decrease by >25%

124
(b) Would you expect yields to (state a percentage if possible)
Decrease Stay the same Increase
(c) What would be the effect on N2O emissions from grassland?
Decrease by <1%
Decrease by 1-4%
Decrease by 4-6%
Decrease by 6-8%
Decrease by 8-10%
Decrease by 10-15%
Decrease by 15-20%
Decrease by 20-25%
Decrease by >25%
(d) Would you expect yields to (state a percentage if possible)
Decrease Stay the same Increase
Discussion at meeting and revisions arising BB – average reduction in emissions is 64% (so assuming 1% EF and 100kg, ~ AR = 300kg*.64 ~ 0.2tCO2e/ha/yr KD – got a 50% reduction in fluxes DH – NZ exp had multiple applications BR – mode of application is critical, particle suspension v granular form. KSm – Commercial products come and go. No patent rights on DCD. “Should there be market for it, anyone could set up and make it…should only be a fine tuning to fertiliser price” Due to lower temperatures, compared to NZ, NI‟s should work better in Scotland and at least as well (as NZ) in England , as NI will breakdown more slowly with lower temps. Should be some yield improvement. Not pollution swapping – win-win. KSm – DIDIN costs about £50/ha/year, premium could be within +10% of fertiliser price once production has increased. AS – doesn‟t recommend slow release fertilisers – they affect yield and can cause fluxes later in the season, difficult to target and get timing right. Areas – 15% seems low – it was agreed that there was no reason why these couldn‟t be applied to whole of fertilised area, i.e. 58% of grassland and 91% of arable land. Not applicable to organic areas (but these don‟t receive mineral fertiliser anyway)
REVISION: change maximum areas of application to 58% (grassland) and 91% (arable) REVISION: Change range of costs to reflect an increase in fertiliser price of from 10 to 50%
Further research – what are yield effects of NIs on grazed grasslands?

125
IMPROVED N USE PLANTS Introduction Different plant species utilise N with different levels of efficiency. There should therefore be scope for selectively breeding plants that utilise N more efficiently. Adopting new plant varieties that can produce the same yields using less N would reduce the amount of fertiliser required and the associated emissions. However, as Pollok (2008, p22) notes, improving N use efficiency “without adverse effects on other important agronomic characteristics will be difficult and will take many years to come to market”. For this study, it has been assumed that new varieties will be able to produce current yields with 30% less N fertiliser. Uncertainty 1. What is the potential for new varieties to reduce fertiliser use, i.e.: What areas of land could they be used on? What reduction in N requirement could be achieved over the next 20 years? When could the reduction in N requirement be achieved, i.e. how long would the breeding programmes take and what would be the rate of industry uptake of the resulting varieties? Uncertainty 2. What premiums would the new varieties command? Original assumptions It was assumed that varieties with improved N use could reduce emissions on a maximum of:
5% of grassland
50% of cereal/oilseed land
25% of root crops
25% of other crops The central feasible potential was based on an uptake of 45% of the maximum technical potential, i.e. improved N use varieties could be deployed on:
2% of grassland
23% of cereal/oilseed land
11% of root crops
11% of other crops It was assumed that improved N use varieties could enable mineral N application to be reduced by 30% without affecting yield, and that this would reduce emissions by 0.2t CO2e/ha/year. Feedback "Plant breeding makes improved N use potentially possible, but suitable varieties need to be bred. SAC suggest this approach could lead to 30% less fertiliser-N being required by 2022. We consider this over-optimistic and speculatively suggest that, should a breeding programme be initiated which begins to deliver new varieties within 5 years, and that a 1% annual improvement in N fertiliser efficiency then accrues each year, then perhaps a 9% reduction in N fertiliser use might be achieved by 2022 . AEA agree this is a conservative estimate. [Aldhous 2008]" AEA 2009 “AEA estimate seems very conservative. See recent reviews e.g. Aldhous 2008, New Scientist 197, 28-31” Bob Rees 2009 “This method has a lot of potential – anything that reduces the optimum fertiliser N application rate will reduce excess N in the soil and reduce the potential for nitrous oxide emissions. Further research
126
evidence is required before the extent of abatement can be quantified, but if fertiliser N rates can be reduced by (as much as two thirds in oilseed rape (see http://www.arcadiabio.com/contact.php)); it is fair to assume that nitrous oxide emissions from fertiliser applications will be reduced on a pro-rata basis. Uptake will be dependent on the crops being acceptable in the market place.” ADAS 2010 "• Do plants with this genetic ability exist in the field for all major crop types grown in the UK ate present? e.g. wheat, oats, barley, oilseed rape or sugar beet. • If not do they exist in the laboratory? • Are the grains of these plants suitable for the purposes for which they are currently used e.g. milling, animal feed, alcohol production etc. • The UK market for grain alone is not big enough to attract commercial R&D investment from seed companies- others in Europe or the states would also need to require action to provide this push. • Developing plant varieties that are suitable for use in the UK takes many years (an accurate estimate should be sought from Bayer/Syngenta/ Monsanto etc.)– all varieties must be tested for distinctness, uniformity and stability under field conditions to meet registration requirements." CCTF 2010 Range
New varieties could reduce N use (within 14 years) by: 9-30+%
Rate of reduction in N requirement (after 5 years) of 1-3% Other evidence “There are data for wheat and spring barley to estimate potential for breeding to improve N use. There are two issues to consider (1) breeding for yield e.g. 1% improvement per year is improving N use efficiency and (2) breeding programmes are already looking at improvements in N use.” Steve Hoad 2010 Survey respondent 3 “In cereals, the increase in NUE that has been achieved through variety improvement has come about because of the increase in yield. In barley there has be no change in the optimum rate of N required to maximise yield, but in wheat there is evidence that the N optimum has increased. So although greater efficiency of N use has been achieved, it hasn‟t led to reduction in fertiliser requirement. In order to reduce the fertiliser requirement much greater increases in fertiliser recovery are required that more than offset the greater N offtake associated with increases in yield. This is likely to need a different approach to breeding than simply breeding for yield. It will have a longer run in terms of first identifying the traits to select and identifying sources of variation that can be exploited.” Survey respondent 4 I lead the Green grain project, gave a paper on this subject at the Monogram meeting last week, and have relevant refereed papers on this subject (see attached); hence I believe I am in a good position to provide some views here. However these views differ depending on the nutrient and the species to which you are referring, and the conditions governing the breeding programmes - e.g. levels of investment possible, variety testing criteria, regulation of nutrient use in agriculture. I am assuming that you are referring just to nitrogen and no other nutrient, and have expanded your table to differentiate between crop species. I am assuming that crop yield will remain the prime breeding objective, and that NUE will be a secondary objective. Otherwise, faster progress might be possible. Note that it is NUE which is normally the target, rather than fertiliser requirements per se. There are also important interactions with crop quality; for instance malting criteria encourage NUE improvement (and improvements have already taken place), but bread criteria discourage improvement (as described in the attached paper). Hence I have differentiated crops by market. It is possible that we could change the criteria for bread wheats in the future so as to allow NUE improvements, but until then, improvement will continue to be slowed. Many crop species e.g. sugar beet & spring malting barley, already have quite good NUE (see Table 1 of attached paper), hence although the prospects for reducing N requirements are small, N requirements are already small. The precision of the predictions in your table is out of keeping with the sorts of

127
judgements possible at this stage, so I have broadened your categories. It is not clear why you have omitted potatoes and grass from your list, hence I have included them. I have also included legumes for completeness. It is important to register that genetic improvement by species choice has significantly greater potential to reduce fertiliser N use than plant breeding ... there is a ten-fold range in NUE between existing UK crops (Table 1 again). There are therefore important questions which you have not asked, e.g. about whether livestock feeds and feeding could be redesigned to reduce N fertiliser use? You don‟t need a new breeding programme; you just need to start selecting amongst existing varieties for the right traits. Inevitably, there are existing varieties with advantages in NUE and existing data on these. Denmark has already progressed along this path. Hence NUE varieties could reach the market this autumn at the earliest. However, the NL process and HGCA RL process are crucial to identifying and approving these varieties; we urgently need to introduce nutrient use criteria into NL and RL testing processes. This is the main stumbling block to improving the prospects for progress in NUE. In subsequent answers, I am assuming that such changes will have taken place within three years. What % reduction in fertiliser requirement do you think breeding improved varieties could achieve over the next 15 years?
Crop <10% 11-30% >30% Comments:
Wheat – feed Varieties exist with some improvement
Wheat – bread
Depends on changes in bread-making technology and customer requirements.
Barley – malt Requirements already low
Barley – feed Requirements already low
Oats Requirements already low
Triticale Requirements already low
OSR Varieties exist with some improvement.
Potatoes Varieties exist, with some improvement but breeding is slow and the market is conservative.
Sugar beet Requirements already low
Grass Varieties exist with some improvement but uptake will be slow.
Peas & beans Requirements already low
Do plants with this genetic ability exist in the field for all major crop types grown in the UK at present, e.g. wheat, oats, barley, oilseed rape or sugar beet? SEE ABOVE If, not do they exist in the laboratory? YES. There are very significant GM approaches to NUE being developed for wheat, rice, OSR and other species. Acceptability of GM will be crucial to rates of NUE improvement. Are the improved varieties of these plants likely to be suitable for the purposes for which they are currently used e.g. milling, animal feed, alcohol production etc? Most crops are grown and sold according to their energy or carbohydrate content, but reduced protein (N) content may start to have deleterious effects on their value if they become too marked. There will be interactions between progress in NUE and improving downstream usage of crop products e.g. the feeding industry could usefully become more specific about protein and essential amino acid composition of their feedstuffs. Do you think that the uptake of improved varieties is likely to vary by farm size, type or location?

128
This depends mainly on crop species, not farm size, type etc... E.g. Annual species are changed frequently by most cereal growers as new varieties are released but grass is re-sown less frequently than arable crops, so improvement will be slower. Roger Sylvester-Bradley and Daniel R. Kindred (2009) Analysing nitrogen responses of cereals to prioritize routes to the improvement of nitrogen use efficiency Journal of Experimental Botany Survey respondent 7: “Key issue for cereals will be their market. For example, in wheat breeding for increased yield at lower N fertiliser has been achieved, but this has compromised grain quality and limits use of this type of variety in a quality milling market. Where there is a requirement for high grain protein or nitrogen then end users would need to be on-board if improvements in NUE meant differences in protein content. There is wide genetic variation in NUE across varieties e.g. wheat and evidence for significant improvement in NUE across years of plant breeding e.g. wheat and spring barley. Differences or improvements in NUE relate to changes in the efficiencies of N uptake and N utilisation. Both could be improved further through increases in yield, but this needs to be considered against other selection criteria such as protein content and quality. To breed for reduced fertiliser rather than just NUE would require a change in the selection and testing procedures (i.e. testing at different levels of N fertiliser) such that reduction in fertiliser use is the target (to shift the N fertiliser optimum).” Survey respondent 8 “Decrease emissions by 11-15% post 2020 Preferential selection of existing varieties for nitrogen efficiency traits over other priorities is currently possible but will not realise substantial savings (as indicated above) without further breeding development in rooting potential and genome selection. In the case of starch grains – speak with HGCA” Reducing Uncertainty "Included in AC0221 (a) Very little is known about the differences in N use efficiency (NUE) between species and varieties. Two Defra Link projects are examining such differences between current varieties of wheat and OSR. LK0959 is showing modest differences in NUE between wheat varieties (this project is due to report later this year). LK0979 is showing larger differences between OSR varieties that could be of interest as a mitigation method but this project will not report until mid 2011. (b) What are the barriers to using species with a potentially lower N requirement such as triticale or oats? (c) Which low N species and varieties?" ADAS 2010 Variation Is the uptake of improved varieties likely to vary by farm size, type or location? Discussion at meeting and revisions arising MD – need to address the displacement effects of increased yields under task 4. See RSB e-mail and paper for estimates of efficiency improvements for individual crops, which can then map onto land areas to give an idea of regional variation. MD – thought 2025 seemed a more realistic target – 10 years to develop and 5 years to achieve uptake
REVISION: use range of time periods for deployment of 10-15 years

129
DH - testing and approval systems are a barrier. AS – thought 30% seemed optimistic, yields can go down after the first few years, efficacy of new varieties can diminish
REVISION: recalculate abatement potential for 10 to 30% reduction in N REVISION: use the following assumptions to reflect the upper and lower maximum abatement rates that
could be achieved:
Period Lower maximum Abatement Rate (based on
15 years to get uptake and an AR of 10%) Upper maximum Abatement Rate (based on 10 years to achieve uptake and an abatement rate of 30%)
2012 0% 0 2017 0 0 2022 0 30% (0.18 tCO2e/ha/year) 2027 10% (0.06 tCO2e/ha/year) 30% (0.18 tCO2e/ha/year) KSm – is there scope for reducing emissions by using small grain cereals for making silage? This echoes the comment of survey respondent 4: “It is important to register that genetic improvement by species choice has significantly greater potential to reduce fertiliser N use than plant breeding ... there is a ten-fold range in NUE between existing UK crops (Table 1 again). There are therefore important questions which you have not asked, e.g. about whether livestock feeds and feeding could be redesigned to reduce N fertiliser use?” ACTION – add species choice as an additional measure. Additional comments Survey respondent 4 “I remain very concerned that your approach will encourage government to form policy based on what they suppose is a scientific consensus, when in reality these may just be guesses; i.e. you have not assessed the state of knowledge.” Survey respondent 8 “While we are keen to be helpful, as you know, we are also nervous about giving information based on opinion rather than robust surveyed interpretation. If we generally head in the right direction perhaps that is ok but policy makers are forcing us onto shaky ground, don‟t you think?”

130
ANAEROBIC DIGESTION Uncertainty 1. Need to improve the validity of the AD plant costings. Original assumptions Wide range of assumptions was made regarding the costs and abatement potentials, for a range of AD scenarios. Feedback "Uptakes were set at 30, 45 and 75% for the low, central and high feasibility potential scenarios respectively have been used as with this measure the uncertainty is not over the abatement efficiency but over the extent to which it might be adopted. " AEA 2009 "The equations used to calculate the cost of AD plants need to be validated using empirical data, as they may well underestimate the costs of small AD plants. How will costs change over time due to economies of scale, innovation, feedstock costs, energy prices etc.? How is the market for biogas heat and electricity likely to develop?" RTD report 2010 “• Farmers are unlikely to use AD facilities using only manure as the feedstock- some may involve municipal waste but for on-farm AD, especially, are likely to use crops such as maize and grass silage. There will be nitrous oxide emissions associated with the cultivation of these crops. • Digestate will also produce nitrous oxide emissions if applied to land – I don‟t think we are yet clear whether this would be better or worse than other fertilisers. • I note that several other economic analyses have concluded that on-farm AD is not economically viable however it may be that these have not included feed in tariffs; Revised cost-estimates need to take into account new feed in tariffs published by DECC. • The SAC analysis includes non-CO2 abated from manures and slurries but also from energy generation – note that this is not included in carbon budgets for agriculture or land use (unless the biofuel is used to power on-farm vehicles or power another source of stationary emissions)” CCTF 2010 Obtain data on actual costs of different sizes of AD plant to calibrate equations? How do AEA costs compare with equation estimates? SAC 2010 Range Wide range of costs and abatement potentials depending on the specific AD scenario. Other evidence In order to refine the cost estimates, a review of AD studies was undertaken (see Appendix K) Reducing Uncertainty Included in AC0222 (a) What actions we can carry out in the short-term to resolve uncertainty/disagreement? Consider current practical limitations in terms of finance, security, skill levels, technical requirements (chemical engineers), storage space etc. when estimating the extent to which the MM can be applied. Take maximum abatement and reduce by those factors. (b) What issues can be debated at an expert meeting? Food versus fuel issues for AD and other energy markets. Farmer attitudes to risk (c) What issues require further (medium/long-term) investigation? Policy initiatives to encourage development.

131
ADAS 2010 Regional variation Regional distribution of AD - (where) is it likely to agglomerate? How will the market develop over time?
Revisions arising Capital and operating cost functions (e.g. cost per MW generated) revised in light of new evidence, and the change to double ROCs for AD included.
IONOPHORES Introduction “Ionophore antimicrobials (e.g. monensin) are used to improve efficiency of animal production by decreasing the dry matter intake (DMI) and increasing performance and decreasing CH4 production. It should be noted that the use of these additives are forbidden in the EU but they have been routinely used as a growth promoter in some non-EU countries.” (Moran et al. 2008) Uncertainty 1. Uncertainty arises for policy rather than technical reasons, i.e. will ionophores be legal at some future data? Uncertainty 2. There is also uncertainty regarding the effect that ionophores will have on milk quality and price. Original assumptions Ionophores will reduce methane emissions by 25% and are applicable to 100% of the herd. Feedback “The science is well established (with perhaps a few questions about persistency remaining) in relation to the use of beef and dairy ionophores. But since ionophore use in feed is banned in EU then there is currently no potential. If the ban was lifted these would have an immediate impact. In recognition that the purpose of the MACC was to identify additional potential abatement, not abatement that will be achieved under BAU conditions. Hence we have taken the abatement potential, and applicability, as 0%, but with a range of 0-25% in the event of the ban being lifted.” AEA 2009 “Ionophores has been presented as a potential "silver bullet" to help the reduction of GHG emissions from ruminant, particularly dairy systems. As highlighted in the SAC and ADAS report these are currently banned in the EU (due to their "growth promoter" label). Ionophores have been shown to have an impact on milk quality, such that fat and protein % are reduced (e.g., McGuffey et al, 2001). There is potential for other feed additives to have favourable GHG emissions reductions effects that ionophores have been shown to have, maybe not as strong. However, these are less well studied and should fall under an alternative strategy and carry higher uncertainty.” SAC (EW) 2009 “Comments made on probiotics that may also apply to ionophores: "The economic analysis assumes that there will be a limited market for dairy products (possibly due to the milk quota); are we convinced that this is right?" "• I understood that most beef cattle in the UK are extensively reared – surely probiotics
132
would have to be administered in feed? Is the scale of population that could be treated with probiotics correct; these animals are unlikely to suffer from acidosis?" "• The economic analysis assumes that there will continue to be a market demand for the increased meat production resulting from yield improvements under this method; is this right? Is the UK market alone big enough to justify testing; • Are slow release (e.g. bolus formulations) available? • How much would alternative (slow-release) formulations cost to develop and register; how long would this take?" CCTF 2010 Range Applicable to between 0 and 100%, depending on legal status. Other evidence Reducing Uncertainty “Replaced with Probiotics in AC0222 which also include Optimum diet formulation (a) What actions we can carry out in the short-term to resolve uncertainty/disagreement? Consider current knowledge and product range, when estimating the extent to which the MM can be applied. Take maximum abatement and reduce by those factors. (b) What issues can be debated at an expert meeting? Markets (main retail, niche, catering and market attitudes) and technical ability. Farmer attitudes to risk. (c) What issues require further (medium/long-term) investigation? Likelihood of new product development by 2020. Consequences in relation to biotechnology” Regional variation
Revisions arising UPPER - use original assumption about applicability LOWER - assume 0% applicability
DAIRY IMPROVED PRODUCTIVITY AND FERTILITY Introduction Generally, selection for efficiency of production in livestock species will help to reduce emissions. In many cases this can be achieved simply through selection on production traits and traits related to the efficiency of the entire production system (e.g., fertility and longevity traits - see Moran et al. 2008 for further explanation). Uncertainty 1. "Abatement rates are based on current selection policies for fertility and productivity. What further abatement could be achieved by targeted RTD? What is the potential for RTD specifically targeting breeding for reduced methane emissions?" RTD Report 2010
133
Original assumptions Breeding for improved productivity/fertility could reduce emissions by 15%. Feedback "Potential breeding for production/fertility could achieve reductions in GHG emissions similar to those proposed by SAC. There is also some suggestion that we can breed for reduced CH4 emissions. But, if the deadline is 2022 then that is likely too short a time horizon for an impact. Hence we AEA suggested a reduced abatement of 5% in 2022, compared with that of SAC (15%)."AEA 2009 “The abatement potential for genetic improvement of any sort tends to be cumulative. Farmers can use different bulls each year and with the availability of genetic improvement tools (delivered to the national dairy, beef and sheep populations and updated regularly) the males (and females) will improve year on year (i.e., the genetic merit of a bull 20 years ago is different to the genetic potential of a bull today). The increased abatement potential of 15% in 2022 is based on this continued genetic improvement of animals over time (i.e., 10 years of improvement from 2012 to 2022) and does not include breeding directly for reduced emissions which is likely to enhance the abatement potential. This annual abatement rate of GHG emissions by continuing current selection policies has been shown in the study of Jones et al. (2008) and the Defra report AC0204. The abatement rate for selecting on fertility has been shown by Wall et al. (2009, in print) and Garnsworthy (Animal Feed Science and Technology, 2004). It should be noted that improved productivity and/or fertility can be delivered via other routes apart from genetics, such as increased breeding management, nutrition management, however these would require continuous input costs.” SAC (EW) 2009 "• Assuming this method relies on genetics- does analysis of existing genetic resource guarantee that this potential is currently available? • Have the impacts of health and longevity been factored into the model in estimating the abatement potential of this method • To what extent do genetics influence fertility; how much is down to environmental factors? • Have the costs of getting the environmental factors (e.g. feed) been factored in? e.g. If environmental improvements required to what extent is this technically limited by land quality? • What proportion of animals might become more fertile through genetic and environmental improvements? • Same issues about population model in relation to market conditions expressed above) • Have costs of stock bulls/ AI / compliance with tracing systems been factored in. • Are structures in place to ensure that a breeding programme can be rolled out? How much would this cost to set up and administer (private and public costs).” CCTF 2010 Range Reduction in emissions of 5-15% Other evidence Reducing Uncertainty "Dairy and beef in AC0222 as Breeding for yield, fertility and health and applied at applicable farm types (a) What actions we can carry out in the short-term to resolve uncertainty/disagreement? Not too much to say on this one other than that the AEA estimate of 5% seemed too low. The opinions of The Dairy Group (Nick Holt Martin and Ian Powell) should be sought. (b) What issues can be debated at an expert meeting?
134
The impact of improved animal welfare. The potential for more precise nutrition - do farmers apply best practice with respect to nutritional balance? (c) What issues require further (medium/long-term) investigation? In addition to welfare issues, medium and long term issues for investigation might include: a. Rumen additives to reduce methane outputs b. New and improved forage crops/grasses c. Improved feed conversion efficiency In general there seems less potential for beef productivity and fertility given that animal welfare issues are generally less severe, although the number of calves reared per cow mated is still too low. This often comes down to health and nutrition although suckler cows are much longer lived than dairy cows. Cattle growth rates could be increased via improved grassland management and better genetics. The use of superior sires and fertility testing would be of benefit in many herds." ADAS 2010 Regional variation
Revisions arising UPPER - 15% reduction in emissions LOWER - 10% reduction in emissions

135
APPENDIX D. Scoping of income foregone calculations of climate change abatement measures
Section 3 provides a scoping of farm level cost issues for mitigation. An independent review of the costs of the mitigation measures was undertaken which highlighted that further potential costs/benefits could be included in future analysis. These potential economic costs/benefits for specific measures in the MACCs are set out below.
Measure Agronomic Issues
Economic Issues
General Income Loss / Extra Costs Income Gain / Costs Saved
Improving the management of mineral fertiliser N application
Crops to which better N management will be applied (responsiveness to timing and N use).
Potential downside on yield if N management fails to match crop demand for optimum yield response.
Associated requirements of pH, P, K, Mg etc. to allow optimisation to be achieved.
Timing requirements.
Recording, testing and mapping requirements.
Crop response and economic value.
Ongoing cost of associated liming, basal fertiliser, trace elements etc.
Management time.
Cost of precision application equipment – viability on small scale (requiring a move to specialist contractors?).
Income Loss
Potential loss of yield if management/systems fail?
Extra Costs
Depreciation and interest on 50% of the capital cost of more advanced machinery
Machinery running costs for extra passes
Marginal labour costs
Contract charges?
Management cost/time
Costs of testing/agronomy advice
Income gain
Improved yields?
Better price through better management of crop quality?
Costs saved
N fertiliser cost saving
Improved management of manure/slurry N application
Soil types, climate and field working conditions dictating what is possible?
Cropping type associations – most likely following crop e.g. maize?
Baseline for what is acceptable currently – prevalence of NVZ rules dictating existing limits (included within cross compliance baseline).
Impact on crop/grass growth.
Capital cost of creating adequate storage.
Cost of spreading.
Need for specialist equipment (need to rely on
contractors).13
Economies of scale.
Value of improved crop/grass yield & quality.
Income Loss
n/a Extra Costs
Depreciation and interest on 50% of capital cost of storage facility
Depreciation and interest on 50% of purchase cost of new manure/slurry applicator
Contract costs of manure/slurry application using specialist machinery?
Income gain
Any additional value to output Costs saved
Potential reduction in cost of mineral N?
Any savings in depreciation and interest on 50% of original capital cost of old spreading equipment no longer required
Marginal labour and machinery running cost savings from less frequent application of manure/slurry
13 See Farmers Weekly 2
nd April 2010 „Variable rate for less‟ pages 74 and 75 for the cost of adapting a fertiliser spreader for variable rate application which the
article considers would be £2,000 to £3,000 and „fairly easy to justify‟ on a 200ha farm.

136
Measure Agronomic Issues
Economic Issues
General Income Loss / Extra Costs Income Gain / Costs Saved
Making full allowance for the N in manures when deciding on the amounts of fertiliser N to apply to the crop
Cropping type associations – most likely following crop e.g. maize?
Baseline for what is acceptable currently – prevalence of NVZ rules dictating existing limits (included within cross compliance baseline).
Impact of over application e.g. lodging.
Value of the impact on following crop yield.
Cost saving of mineral N.
Any reduction in fertiliser application costs.
Income loss
n/a Extra costs
Costs of analysis
Cost of consultancy advice
Cost of management time
Income gain
Value of any crop yield benefit Costs saved
Combine cost savings vs. cutting lodged crops
Savings in the cost of mineral N
Savings in the application of mineral N (if any)
Avoiding excess N
Soil type associations – under what circumstances is variability greatest?
Cropping type associations – greatest response and greatest benefit.
Any yield benefits i.e. avoids lodging.
Impact on crop yield, quality and at what price?
Cost of technology required14
.
Whether equipment can be justified only by large farms and contractors?
Value of fertiliser cost savings.
Income loss
Value of any potential loss of yield if the technology fails and fertiliser is under applied
Extra costs
Depreciation and interest on 50% of capital on new spreader or spreader modification
Cost of extra consultancy advice
Cost of extra soil testing
Cost of management time
Income gain
Value of any potential yield loss due to lodging etc.
Costs saved
Value of fertiliser savings
Depreciation and interest on 50% of capital on old fertiliser spreader
Improving the drainage of agricultural land
Soil type/topographic associations - clay soils, flat land, drainage system.
Cropping type associations – high value mainly arable crops and intensive grazing.
Does higher potential mean higher output of the same enterprises or a new range of enterprises to reflect the higher potential?
Spacing – typically 20m.
Cost of ancillary works – expensive if a network of ditches needs to be established.
Write-off period.
On-going maintenance cost – frequency and need for mole ploughing
Income Loss
None (or old range of crop gross margins)
Extra Costs
Depreciation
Interest on 50% of capital cost
Marginal cost of mole ploughing say every other year
Marginal cost of ditch clearance say every other
Income gain
Yield increase across range of suitable crops at medium to long term average prices
(or new range of crop gross margins)
Costs saved
Marginal costs for old enterprises
14 See Farmers Weekly 2
nd April 2010 „Variable rate for less‟ pages 74 and 75 for the cost of adapting a fertiliser spreader for variable rate application which the
article considers would be £2,000 to £3,000 and „fairly easy to justify‟ on a 200ha farm.

137
Measure Agronomic Issues
Economic Issues
General Income Loss / Extra Costs Income Gain / Costs Saved
year
Higher input costs to match higher yield potential?
Marginal costs for new enterprises
Improved N use plants
Substitution of which plants?
Effects on rotations, disease risk, sowing dates, harvesting and all the other physical characteristics that are substituted.
Impact on growing costs.
Impact on establishment cost and knock on effects on workload etc.
Impact on crop marketing.
Any changes in the risk profile of the new crops.
Income loss
Old crop gross margin Extra costs
Interest on working capital of new crop
Marginal cost of labour and machinery on new crop
Income gain
New crop gross margin Costs saved
Interest on working capital of old crop
Marginal cost of labour and machinery on old crop
Reduced tillage
Soil type associations – soils that are best suited.
Suitability for different crops – effect on rotation.
Coping with trash and burying turf – advantages of inversion tillage which are particularly important with mixed farming and intensive arable/horticulture.
Reliance on chemicals – weed problems and carryover of disease.
Long term impact on soil – earthworm build up etc.
Benefit of soil moisture conservation.
Value of change in crop yield i.e. quantity, quality and price.
Chemical cost.
Marginal machinery and labour cost savings.
Shift to a greater reliance on contractors?
Income loss
Value of gross margins under old high tillage system.
Extra costs
Depreciation and interest on 50% of capital on min till equipment required.
Cost of extra consultancy advice.
Income gain
Value of gross margins of crops suited to min. till (including any potential yield gain due to improved timeliness and any increased cost due to greater chemical use).
Costs saved
Depreciation and interest on 50% of capital on heavy till equipment no longer required.
Marginal savings in labour, fuel and repairs.
Dairy improved productivity and fertility
Ex post yields based on breed
type, genetics, feeding, seasonality etc. and scope for improvement.
Does „improvement‟ mean a system change towards greater intensity (with all that implies) or fine tuning based on the existing system?
Feed requirements under new
Effect on cost per litre of variable costs – feed, vet, AI, dairy sundries etc.
Effect on cost per litre of overhead costs – cost per litre of labour, land, machinery, buildings, water, electricity etc.
Cost of any improvements required in facilities – better
Income Loss
Gross margin post improvements
Extra costs
Interest on working capital under the new system
Depreciation and interest on 50% of capital cost of any new equipment required
Income gain
Gross margin of herd under improved productivity/ management (could be expressed per ha or per cow or for a particular scale of operation)
Costs saved
Interest on working capital under

138
Measure Agronomic Issues
Economic Issues
General Income Loss / Extra Costs Income Gain / Costs Saved
regime (stocking rate, forage use, concentrates and bulk feeds).
Effect on replacement rate.
Effect on milk compositional quality and hence price.
Stockmanship and recording requirements.
Need or benefit from more frequent milking.
Veterinary impact.
feed rationing systems, computerised records etc.
Cost of management.
Cost/benefit of staff training and better staff?
Cost of advice
Cost of additional management
Cost of staff training
Cost of higher wages due to up skilling?
the old management system
Beef improved productivity and fertility
System type – there are so many with beef.
Whether derived from dairy cross or pure beef breeds.
Breed type and genetics linked with optimum system choice.
Seasonality of calving.
Level of concentrate feeding and use of bought in feeds.
Buildings requirements for intensive systems.
Cost of feed.
Labour and machinery costs associated with intensive systems.
Quality premiums with slow maturing grass fed systems.
Cost of management.
Cost of improved genetics.
Income loss
Gross margin post improvements
Extra costs
Interest on working capital under the new system
Depreciation and interest on 50% of capital cost of any new equipment required
Cost of advice
Cost of additional management
Cost of staff training
Cost of higher wages due to up skilling?
Income gain
Gross margin of herd under improved productivity/ management (could be expressed per ha or per head
Costs saved
Interest on working capital under the old management system
Probiotics
Which types of livestock would benefit and to what extent?
Output benefits.
Impact on feed intake.
Side effects to probiotic use.
Cost of probiotics.
Value of feed cost savings.
Value of any effects on growth, carcass quality etc.
Consumer perception on the use of probiotics and the impact on price and product differentiation.
Income Loss
n/a Extra costs
Cost of the probiotics
Any additional nutritionist advice or veterinary costs
Cost of any additional management input
Income gain
Value of any increased output Costs saved
Feed cost savings
Ionophores
Species of animals to which it can be applied to the feed (mostly cattle?).
Systems of farming?
Appropriate performance benchmark ex post
Value of improvements in growth rates and feed
Income Loss
Gross margin without feed additive
Income gain
Gross margin per year with feed additive (lower mortality, more per year, better conversion
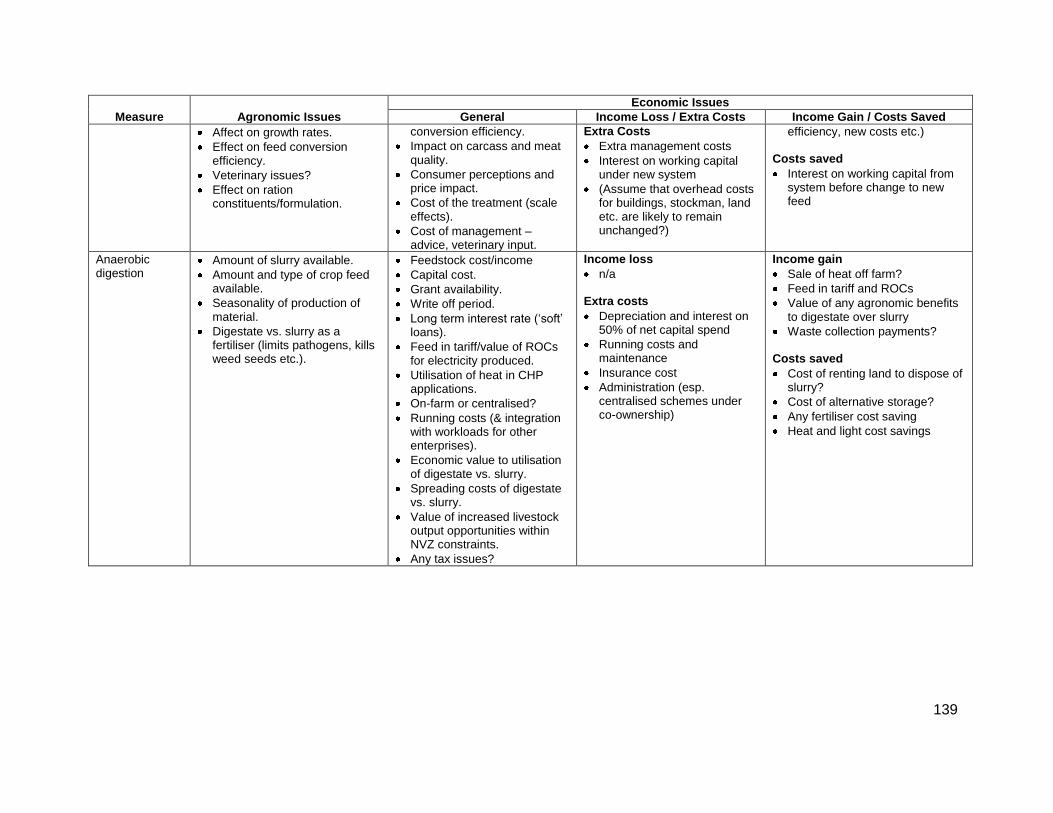
139
Measure Agronomic Issues
Economic Issues
General Income Loss / Extra Costs Income Gain / Costs Saved
Affect on growth rates.
Effect on feed conversion efficiency.
Veterinary issues?
Effect on ration constituents/formulation.
conversion efficiency.
Impact on carcass and meat quality.
Consumer perceptions and price impact.
Cost of the treatment (scale effects).
Cost of management – advice, veterinary input.
Extra Costs
Extra management costs
Interest on working capital under new system
(Assume that overhead costs for buildings, stockman, land etc. are likely to remain unchanged?)
efficiency, new costs etc.) Costs saved
Interest on working capital from system before change to new feed
Anaerobic digestion
Amount of slurry available.
Amount and type of crop feed available.
Seasonality of production of material.
Digestate vs. slurry as a fertiliser (limits pathogens, kills weed seeds etc.).
Feedstock cost/income
Capital cost.
Grant availability.
Write off period.
Long term interest rate („soft‟ loans).
Feed in tariff/value of ROCs for electricity produced.
Utilisation of heat in CHP applications.
On-farm or centralised?
Running costs (& integration with workloads for other enterprises).
Economic value to utilisation of digestate vs. slurry.
Spreading costs of digestate vs. slurry.
Value of increased livestock output opportunities within NVZ constraints.
Any tax issues?
Income loss
n/a Extra costs
Depreciation and interest on 50% of net capital spend
Running costs and maintenance
Insurance cost
Administration (esp. centralised schemes under co-ownership)
Income gain
Sale of heat off farm?
Feed in tariff and ROCs
Value of any agronomic benefits to digestate over slurry
Waste collection payments? Costs saved
Cost of renting land to dispose of slurry?
Cost of alternative storage?
Any fertiliser cost saving
Heat and light cost savings

140
APPENDIX E. Comparison of the ADAS and original SAC approach to calculating interactions
Baseline emissions/ha 0.6 Assumed 1% N20 emissions from c200kg N application per hectare * 300 GWP
100% overlap 50% overlap
Method Efficacy Abatement rate Applicability IF A B C IF A B C
A 20% 0.2 80% A A
B 50% 0.3 50% B 0.9 B 0.95
C 20% 0.2 20% C 0.7 0.6 C 0.85 0.8
Assume applied A-B-C
ADAS Combined efficacy Contrib to total
A only 20% 6.0%
A nd B 60% 18.0%
A, B, and C 68% 13.6%
37.6%
New emissions 0.37
SAC 100% overlap 50% overlap
A 0.160 0.160
B 0.135 0.143
C 0.017 0.027
0.312 0.330
New emissions 0.288 0.270
SAC:
The IFs for 50% overlap are
calculated by taking the
average of 1 (which is the IF
for all measures when the
overlap is 0%) and the IF for
100% overlap.
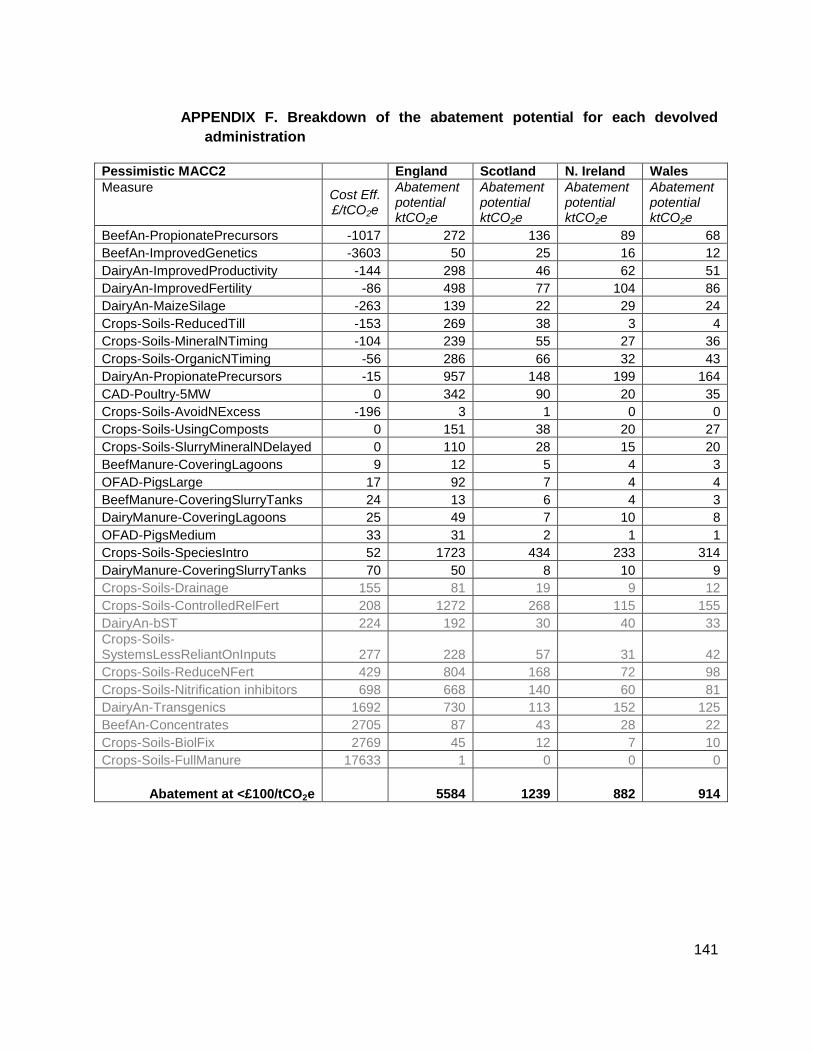
141
APPENDIX F. Breakdown of the abatement potential for each devolved
administration
Pessimistic MACC2 England Scotland N. Ireland Wales
Measure Cost Eff. £/tCO2e
Abatement potential ktCO2e
Abatement potential ktCO2e
Abatement potential ktCO2e
Abatement potential ktCO2e
BeefAn-PropionatePrecursors -1017 272 136 89 68
BeefAn-ImprovedGenetics -3603 50 25 16 12
DairyAn-ImprovedProductivity -144 298 46 62 51
DairyAn-ImprovedFertility -86 498 77 104 86
DairyAn-MaizeSilage -263 139 22 29 24
Crops-Soils-ReducedTill -153 269 38 3 4
Crops-Soils-MineralNTiming -104 239 55 27 36
Crops-Soils-OrganicNTiming -56 286 66 32 43
DairyAn-PropionatePrecursors -15 957 148 199 164
CAD-Poultry-5MW 0 342 90 20 35
Crops-Soils-AvoidNExcess -196 3 1 0 0
Crops-Soils-UsingComposts 0 151 38 20 27
Crops-Soils-SlurryMineralNDelayed 0 110 28 15 20
BeefManure-CoveringLagoons 9 12 5 4 3
OFAD-PigsLarge 17 92 7 4 4
BeefManure-CoveringSlurryTanks 24 13 6 4 3
DairyManure-CoveringLagoons 25 49 7 10 8
OFAD-PigsMedium 33 31 2 1 1
Crops-Soils-SpeciesIntro 52 1723 434 233 314
DairyManure-CoveringSlurryTanks 70 50 8 10 9
Crops-Soils-Drainage 155 81 19 9 12
Crops-Soils-ControlledRelFert 208 1272 268 115 155
DairyAn-bST 224 192 30 40 33
Crops-Soils-SystemsLessReliantOnInputs 277 228 57 31 42
Crops-Soils-ReduceNFert 429 804 168 72 98
Crops-Soils-Nitrification inhibitors 698 668 140 60 81
DairyAn-Transgenics 1692 730 113 152 125
BeefAn-Concentrates 2705 87 43 28 22
Crops-Soils-BiolFix 2769 45 12 7 10
Crops-Soils-FullManure 17633 1 0 0 0
Abatement at <£100/tCO2e 5584 1239 882 914

142
Optimistic MACC2 England Scotland N. Ireland Wales
Measure Cost Eff. £/tCO2e
Abatement potential ktCO2e
Abatement potential ktCO2e
Abatement potential ktCO2e
Abatement potential ktCO2e
BeefAn-Ionophores -1748 371 186 122 93
BeefAn-ImprovedGenetics -3603 50 25 16 12
Crops-Soils-MineralNTiming -106 1628 350 156 211
Crops-Soils-ImprovedN-UsePlants -205 552 103 35 47
Crops-Soils-Drainage -31 2723 665 347 468
DairyAn-ImprovedFertility -101 636 98 132 109
DairyAn-ImprovedProductivity -144 446 69 93 77
DairyAn-Ionophores -49 1071 166 223 184
Crops-Soils-OrganicNTiming -64 664 167 89 121
DairyAn-MaizeSilage -263 139 22 29 24
Crops-Soils-ReducedTill -170 242 34 3 4
Crops-Soils-AvoidNExcess -260 96 22 11 15
Crops-Soils-FullManure -159 122 31 17 22
CAD-Poultry-5MW 0 342 90 20 35
Crops-Soils-UsingComposts 0 174 44 23 32
Crops-Soils-SlurryMineralNDelayed 0 110 28 15 20
BeefManure-CoveringLagoons 9 12 5 4 3
OFAD-PigsLarge 17 92 7 4 4
BeefManure-CoveringSlurryTanks 24 13 6 4 3
DairyManure-CoveringLagoons 25 49 7 10 8
OFAD-PigsMedium 33 31 2 1 1
Crops-Soils-NIs 59 1578 330 141 191
DairyManure-CoveringSlurryTanks 70 50 8 10 9
Crops-Soils-SpeciesIntro 70 1296 326 175 236
Crops-Soils-SystemsLessReliantOnInputs 210 300 76 41 55
DairyAn-bST 224 192 30 40 33
Crops-Soils-ControlledRelFert 332 795 167 72 97
Crops-Soils-ReduceNFert 432 799 167 72 97
Crops-Soils-BiolFix 858 145 40 24 32
DairyAn-Transgenics 1692 730 113 152 125
BeefAn-Concentrates 2705 87 43 28 22
Abatement at <£100/tCO2e 12486 2791 1679 1928

143
APPENDIX G. Assessment of mitigation measure applicability by region
As described in Section 5, we assessed the interaction of measure applicability by farm type with the characterisation of regional farm types. This was done by applying an ordinal score to each farm type in each region based on the level of representation of the UK holdings of that farm type as follows: More than 30% of holdings = 4 Between 20% and 30% of holdings = 3 Between 10% and 20% of holdings = 2 Less than 10% of holdings = 1 These scores were then multiplied with those for the applicability of measures. The resulting scores ranged between 1 and 12 (non-applicable measures are excluded); again to emphasise the ordinal nature of the scores these were subsequently categorised into a 3 level scoring as follows: Combined score greater than 8 = 3 Combined score between 4 and 8 = 2 Combined score less than 4 = 1 The following tables present the results of these interactions for each region based on the UK wide context, i.e. the regional applicability of a measure is relation to the UK wide potential of each measure by farm type. This does not mean that farm type specific measures are not important at a regional level.
Table G1 presents the results for the England West; these indicate that the most applicable farm types are horticulture, dairy, lowland livestock and mixed farms. Of moderate applicability are the cereals and general cropping farm types. The least applicable farm type is LFA livestock reflecting both the low applicability of measures to this farm type and its low representation in this region. Table G2 presents the interaction results for the England East region. Reflecting the prominence of arable farming in this region the most applicable farm types are cereals, general cropping and horticulture. Lowland grazing livestock and mixed farms are also of moderate to high applicability. Of low applicability are dairy and LFA livestock, again this reflects the low representation of these farm types in this region. Table G3 presents the results for the England North region. Dairy is the only farm type with a high level of applicability of measures for this region. However, there was moderate applicability of measures for cereals, general cropping, horticulture, lowland grazing livestock and mixed farms. Table G4 presents the results for Wales; these suggest that due to the representation of the farm types in Wales there are no highly applicable measures (in the UK context). Measures relating to dairy farms are of moderate applicability, with measures for the remaining farm types being of low applicability. The results for Scotland are presented in Table G5. Measures relating to general cropping are of moderate to high applicability. Those measures relating to cereals and mixed farm types are of moderate applicability. Measures for horticulture, dairy and livestock (LFA and lowland) are of low applicability. The results for Northern Ireland are present in Table G6. Measures relating to dairy and lowland livestock are of moderate applicability. Whereas measures relating to other farm types are of low applicability.

144
Table G1 Interaction of measure applicability and farm type for the England West super region.
Farm type Measure
Cere
als
Gen
era
l cro
ppin
g
Hort
icultu
re
Specia
list
pig
s
Specia
list
poultry
Dairy
Gra
zin
g
livesto
ck
(LF
A)
Gra
zin
g
livesto
ck
(low
land
)
Mix
ed
Improving the drainage of agricultural land
2 2 3 2 1 3 3
Improved management of mineral fertiliser N application
2 2 3 2 1 3 3
Ionophores 3 1 3
Improved management of manure/slurry N application
2 2 3 3 1 3 2
Dairy improved productivity and fertility
3
Anaerobic digestion 2 2 3 3 2
Making a full allowance for the N supplied in manures when deciding on the amounts of fertiliser-N to apply to a crop
2 2 3 3 1 3 3
Improved N use plants 2 2 3 1 2 3
Avoiding excess N 2 2 3 2 1 3 3
Dairy maize silage 3
Use FYM/composts instead of slurries
2 2 3 3 3 3
Reduced tillage 2 2 3 3
Separate slurry/ manure applications from fertiliser applications by several days
2 2 3 3 3 3
Beef improved productivity and fertility
1 3
Nitrification inhibitors 2 2 3 3 1 3 3
Table G2 Interaction of measure applicability and farm type for the England East super region.
Farm type Measure
Cere
als
Gen
era
l
cro
ppin
g
Hort
icultu
re
Specia
list
pig
s
Specia
list
poultry
Dairy
Gra
zin
g
livesto
ck
(LF
A)
Gra
zin
g
livesto
ck
(low
land
)
Mix
ed
Improving the drainage of agricultural land
3 3 3 1 1 2 3
Improved management of mineral fertiliser N application
3 3 3 1 1 2 3
Ionophores 1 1 2
Improved management of manure/slurry N application
3 3 3 1 1 3 2
Dairy improved productivity and fertility
1
Anaerobic digestion 3 2 1 3 2
Making a full allowance for the N supplied in manures when deciding on the amounts of fertiliser-N to apply to a crop
3 3 3 1 1 3 3
Improved N use plants 3 3 3 1 1 3
Avoiding excess N 3 3 3 1 1 2 3
Dairy maize silage 1
Use FYM/composts instead of slurries
3 3 3 1 3 3
Reduced tillage 3 3 3 3
Separate slurry/ manure applications from fertiliser applications by several days
3 3 3 1 3 3
Beef improved productivity and fertility
1 3
Nitrification inhibitors 3 3 3 1 1 3 3

145
Table G3 Interaction of measure applicability and farm type for the England North super region. Farm type Measure
Cere
als
Gen
era
l
cro
ppin
g
Hort
icult
ure
Specia
lis
t pig
s
Specia
lis
t po
ultry
Dairy
Gra
zin
g
livesto
ck
(LF
A)
Gra
zin
g
livesto
ck
(low
land
)
Mix
ed
Improving the drainage of agricultural land
2 2 2 2 1 2 2
Improved management of mineral fertiliser N application
2 2 2 2 2 2 2
Ionophores 3 1 2
Improved management of manure/slurry N application
2 2 2 3 1 2 2
Dairy improved productivity and fertility
3
Anaerobic digestion 2 2 3 2 2
Making a full allowance for the N supplied in manures when deciding on the amounts of fertiliser-N to apply to a crop
2 2 2 3 1 2 2
Improved N use plants 2 2 2 1 1 2
Avoiding excess N 2 2 2 2 1 2 2
Dairy maize silage 3
Use FYM/composts instead of slurries
2 2 2 3 2 2
Reduced tillage 2 2 2 2
Separate slurry/ manure applications from fertiliser applications by several days
2 2 2 3 2 2
Beef improved productivity and fertility
2 2
Nitrification inhibitors 2 2 2 3 2 2 2
Table G4 Interaction of measure applicability and farm type for the Wales super region. Farm type Measure
Cere
als
Gen
era
l cro
ppin
g
Hort
icult
ure
Specia
li
st pig
s
Specia
list
poultry
Dairy
Gra
zin
g
livesto
ck
(LF
A)
Gra
zin
g
livesto
ck
(low
land
) Mix
ed
Improving the drainage of agricultural land
1 1 1 2 1 1 1
Improved management of mineral fertiliser N application
1 1 1 2 2 1 1
Ionophores 2 1 1
Improved management of manure/slurry N application
1 1 1 2 1 1 1
Dairy improved productivity and fertility
2
Anaerobic digestion 1 1 2 1 1
Making a full allowance for the N supplied in manures when deciding on the amounts of fertiliser-N to apply to a crop
1 1 1 2 1 1 1
Improved N use plants 1 1 1 1 1 1
Avoiding excess N 1 1 1 2 1 1 1
Dairy maize silage 2
Use FYM/composts instead of slurries
1 1 1 2 1 1
Reduced tillage 1 1 1 1
Separate slurry/ manure applications from fertiliser applications by several days
1 1 1 2 1 1
Beef improved productivity and fertility
2 1
Nitrification inhibitors 1 1 1 2 2 1 1

146
Table G5 Interaction of measure applicability and farm type for the Scotland super region. Farm type Measure
Cere
als
Gen
era
l cro
ppin
g
Hort
icult
ure
Specia
lis
t pig
s
Specia
lis
t po
ultry
Dairy
Gra
zin
g
livesto
ck
(LF
A)
Gra
zin
g
livesto
ck
(low
land
)
Mix
ed
Improving the drainage of agricultural land
2 3 1 1 1 1 2
Improved management of mineral fertiliser N application
2 3 1 1 2 1 2
Ionophores 1 1 1
Improved management of manure/slurry N application
2 2 1 1 1 1 2
Dairy improved productivity and fertility
1
Anaerobic digestion 1 2 1 1 2
Making a full allowance for the N supplied in manures when deciding on the amounts of fertiliser-N to apply to a crop
2 2 1 1 1 1 2
Improved N use plants 2 3 1 1 1 2
Avoiding excess N 2 3 1 1 1 1 2
Dairy maize silage 1
Use FYM/composts instead of slurries
2 2 1 1 1 2
Reduced tillage 2 3 1 2
Separate slurry/ manure applications from fertiliser applications by several days
2 2 1 1 1 2
Beef improved productivity and fertility
2 1
Nitrification inhibitors 2 3 1 1 2 1 2
Table G6 Interaction of measure applicability and farm type for the Northern Ireland super region.
Farm type Measure
Cere
als
Gen
era
l cro
ppin
g
Hort
icultu
r
e
Specia
list
pig
s
Specia
list
poultry
Dairy
Gra
zin
g
livesto
ck
(LF
A)
Gra
zin
g
livesto
ck
(low
land
)
Mix
ed
Improving the drainage of agricultural land
1 1 1 2 1 2 1
Improved management of mineral fertiliser N application
1 1 1 2 2 2 1
Ionophores 2 1 2
Improved management of manure/slurry N application
1 1 1 2 1 2 1
Dairy improved productivity and fertility
2
Anaerobic digestion 1 1 2 2 1
Making a full allowance for the N supplied in manures when deciding on the amounts of fertiliser-N to apply to a crop
1 1 1 2 1 2 1
Improved N use plants 1 1 1 1 1 1
Avoiding excess N 1 1 1 2 1 2 1
Dairy maize silage 2
Use FYM/composts instead of slurries
1 1 1 2 2 1
Reduced tillage 1 1 1 1
Separate slurry/ manure applications from fertiliser applications by several days
1 1 1 2 2 1
Beef improved productivity and fertility
2 2
Nitrification inhibitors 1 1 1 2 2 2 1
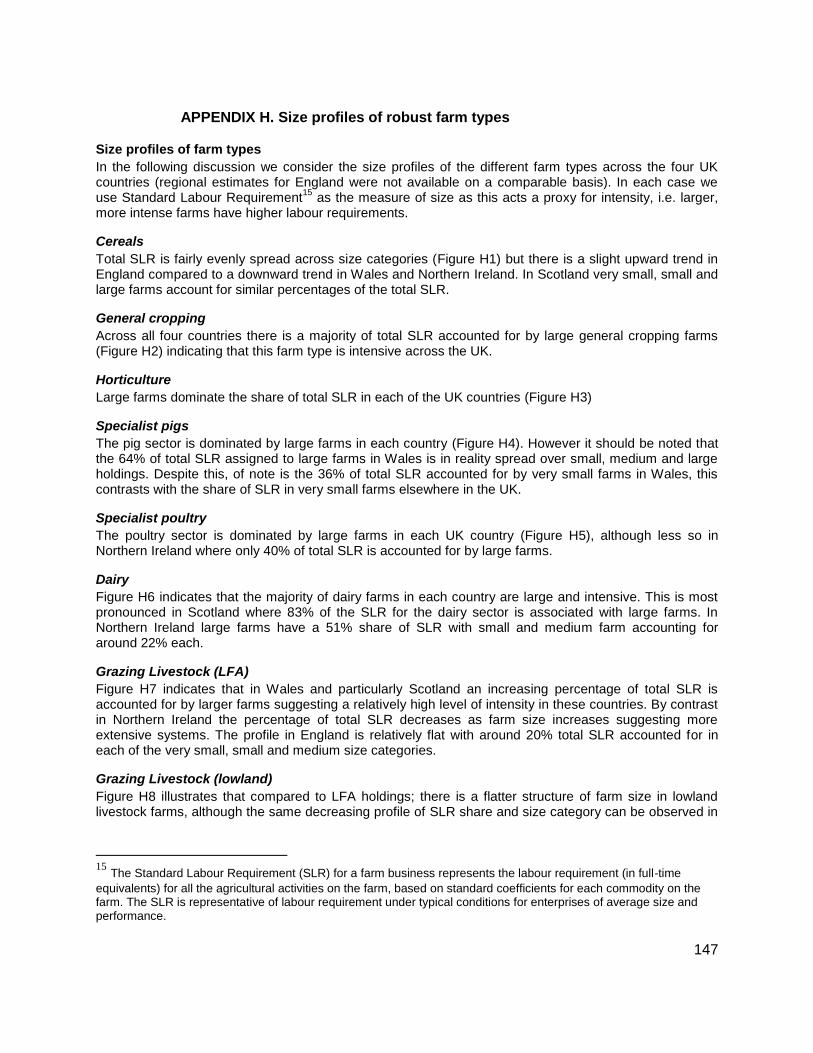
147
APPENDIX H. Size profiles of robust farm types
Size profiles of farm types
In the following discussion we consider the size profiles of the different farm types across the four UK countries (regional estimates for England were not available on a comparable basis). In each case we use Standard Labour Requirement
15 as the measure of size as this acts a proxy for intensity, i.e. larger,
more intense farms have higher labour requirements.
Cereals
Total SLR is fairly evenly spread across size categories (Figure H1) but there is a slight upward trend in England compared to a downward trend in Wales and Northern Ireland. In Scotland very small, small and large farms account for similar percentages of the total SLR.
General cropping
Across all four countries there is a majority of total SLR accounted for by large general cropping farms (Figure H2) indicating that this farm type is intensive across the UK.
Horticulture
Large farms dominate the share of total SLR in each of the UK countries (Figure H3)
Specialist pigs
The pig sector is dominated by large farms in each country (Figure H4). However it should be noted that the 64% of total SLR assigned to large farms in Wales is in reality spread over small, medium and large holdings. Despite this, of note is the 36% of total SLR accounted for by very small farms in Wales, this contrasts with the share of SLR in very small farms elsewhere in the UK.
Specialist poultry
The poultry sector is dominated by large farms in each UK country (Figure H5), although less so in Northern Ireland where only 40% of total SLR is accounted for by large farms.
Dairy
Figure H6 indicates that the majority of dairy farms in each country are large and intensive. This is most pronounced in Scotland where 83% of the SLR for the dairy sector is associated with large farms. In Northern Ireland large farms have a 51% share of SLR with small and medium farm accounting for around 22% each.
Grazing Livestock (LFA)
Figure H7 indicates that in Wales and particularly Scotland an increasing percentage of total SLR is accounted for by larger farms suggesting a relatively high level of intensity in these countries. By contrast in Northern Ireland the percentage of total SLR decreases as farm size increases suggesting more extensive systems. The profile in England is relatively flat with around 20% total SLR accounted for in each of the very small, small and medium size categories.
Grazing Livestock (lowland)
Figure H8 illustrates that compared to LFA holdings; there is a flatter structure of farm size in lowland livestock farms, although the same decreasing profile of SLR share and size category can be observed in
15
The Standard Labour Requirement (SLR) for a farm business represents the labour requirement (in full-time
equivalents) for all the agricultural activities on the farm, based on standard coefficients for each commodity on the farm. The SLR is representative of labour requirement under typical conditions for enterprises of average size and performance.
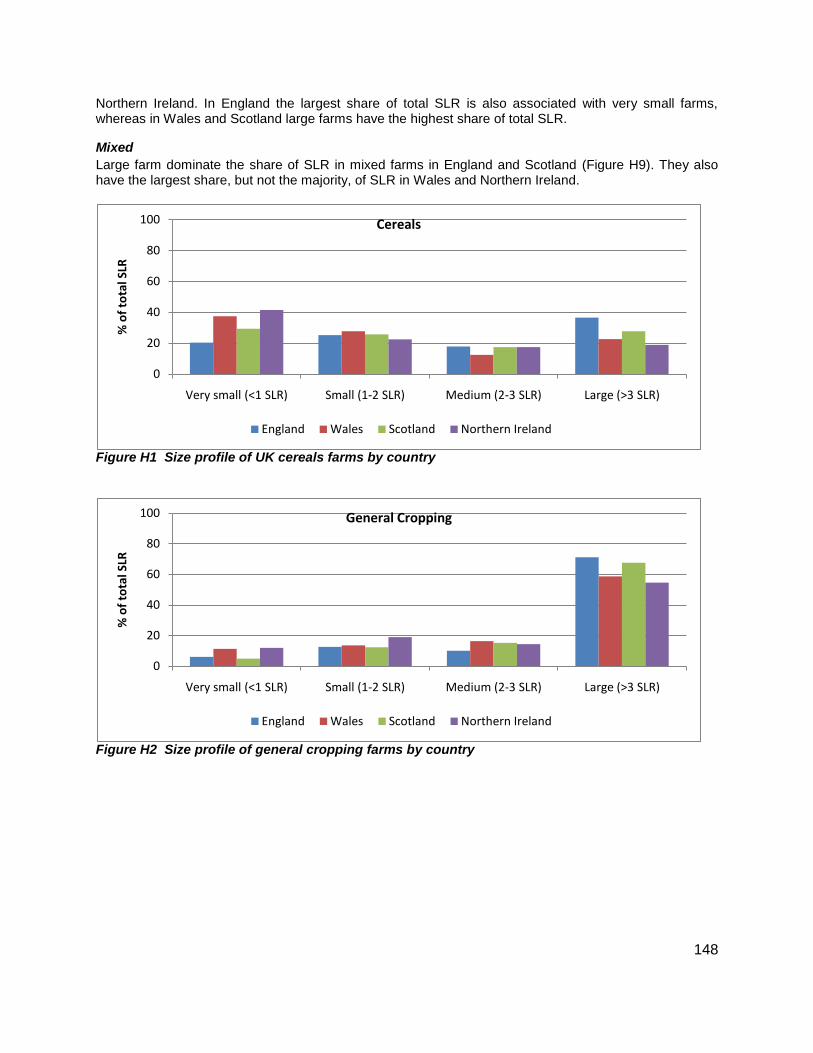
148
Northern Ireland. In England the largest share of total SLR is also associated with very small farms, whereas in Wales and Scotland large farms have the highest share of total SLR.
Mixed
Large farm dominate the share of SLR in mixed farms in England and Scotland (Figure H9). They also have the largest share, but not the majority, of SLR in Wales and Northern Ireland.
Figure H1 Size profile of UK cereals farms by country
Figure H2 Size profile of general cropping farms by country
0
20
40
60
80
100
Very small (<1 SLR) Small (1-2 SLR) Medium (2-3 SLR) Large (>3 SLR)
% o
f to
tal S
LR
Cereals
England Wales Scotland Northern Ireland
0
20
40
60
80
100
Very small (<1 SLR) Small (1-2 SLR) Medium (2-3 SLR) Large (>3 SLR)
% o
f to
tal S
LR
General Cropping
England Wales Scotland Northern Ireland
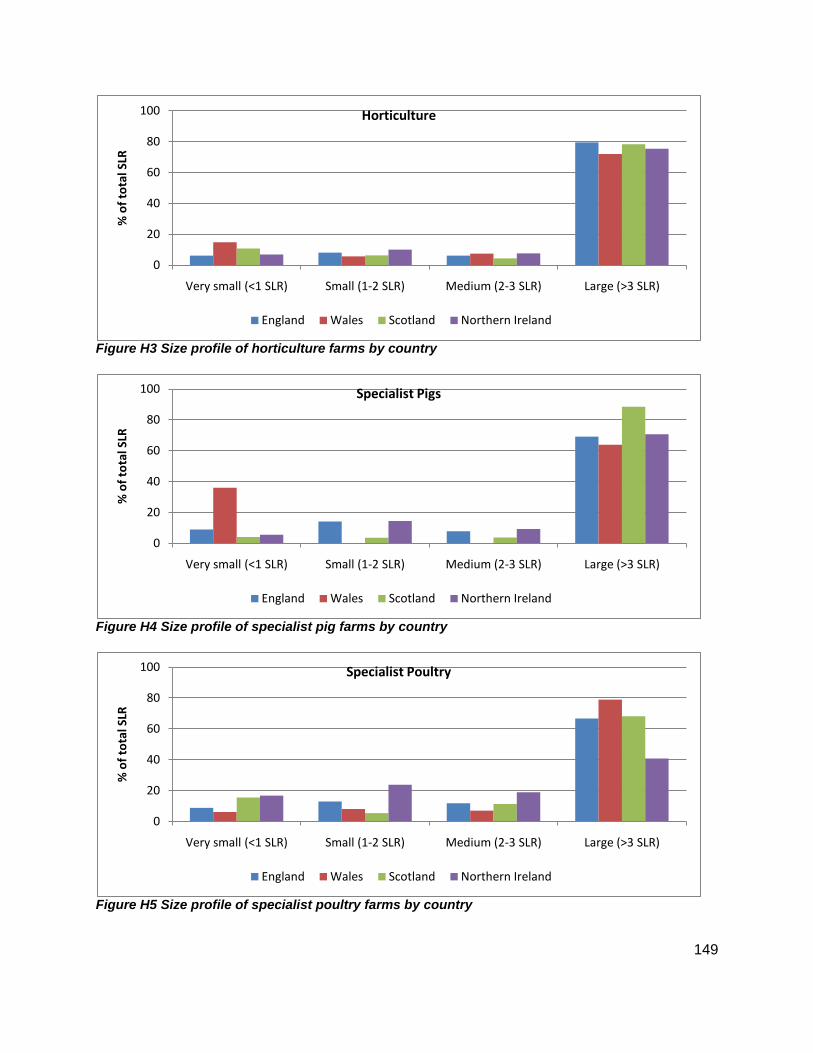
149
Figure H3 Size profile of horticulture farms by country
Figure H4 Size profile of specialist pig farms by country
Figure H5 Size profile of specialist poultry farms by country
0
20
40
60
80
100
Very small (<1 SLR) Small (1-2 SLR) Medium (2-3 SLR) Large (>3 SLR)
% o
f to
tal S
LRHorticulture
England Wales Scotland Northern Ireland
0
20
40
60
80
100
Very small (<1 SLR) Small (1-2 SLR) Medium (2-3 SLR) Large (>3 SLR)
% o
f to
tal S
LR
Specialist Pigs
England Wales Scotland Northern Ireland
0
20
40
60
80
100
Very small (<1 SLR) Small (1-2 SLR) Medium (2-3 SLR) Large (>3 SLR)
% o
f to
tal S
LR
Specialist Poultry
England Wales Scotland Northern Ireland

150
Figure H6 Size profile of UK dairy farms by country
Figure H7 Size profile of UK grazing livestock (LFA) farms by country
Figure H8 Size profile of UK grazing livestock (lowland) farms by country
0
20
40
60
80
100
Very small (<1 SLR) Small (1-2 SLR) Medium (2-3 SLR) Large (>3 SLR)
% o
f to
tal S
LRDairy
England Wales Scotland Northern Ireland
0
20
40
60
80
100
Very small (<1 SLR) Small (1-2 SLR) Medium (2-3 SLR) Large (>3 SLR)
% o
f to
tal S
LR
Grazing Livestock (LFA)
England Wales Scotland Northern Ireland
0
20
40
60
80
100
Very small (<1 SLR) Small (1-2 SLR) Medium (2-3 SLR) Large (>3 SLR)
% o
f to
tal S
LR
Grazing Livestock (lowland)
England Wales Scotland Northern Ireland

151
Figure H9 Size profile of mixed farms by country
0
20
40
60
80
100
Very small (<1 SLR) Small (1-2 SLR) Medium (2-3 SLR) Large (>3 SLR)
% o
f to
tal S
LRMixed
England Wales Scotland Northern Ireland

152
APPENDIX I. Background information on timelines
This section provides greater detail on the development of timelines for mitigation measures to achieve abatement potential at a cost lower than £100/tCO2e to 2022 at levels described in Table 6.1.
Option1. Education/
advice/barrier removalEffect of RTD
Option 2. Extension of existing
incentive based approachesOption 3. Command and control Option 4. New incentive based approaches Summary Assumption 2022-2027
Nutrient
management
Crops-Soils-
AvoidNExcess
Yes - financial savings
provide incentive
Gradual improvement in advice,
regional/soil specific etc based
on RTD findings
Payments likely to be of limited
effectiveness due to difficulty of
monitoring compliance.
Unlikely to achieve significant
additional uptake due to the
difficulty of monitoring compliance.
Fertiliser tax an option, but may be
politically difficult given the relative price-
inelasticity of fertiliser demand. Difficulty of
monitoring compliance a barrier to trading.
Most abatement likely to be achieved with
education/advice, with some additional
abatement possible using a fertiliser tax.
Assumption of 5% per annum growth
(to 2027) from the level achieved by
options 1,2,3
Nutrient
management
Crops-Soils-
FullManure
Yes - financial savings
provide incentive
Gradual improvement in advice,
regional/soil specific etc based
on RTD findings
Payments likely to be of limited
effectiveness due to difficulty of
monitoring compliance. Fertiliser
tax an option, but may be
politically difficult given the relative
price-inelasticity of fertiliser
demand.
Unlikely to achieve significant
additional uptake due to the
difficulty of monitoring compliance.
Fertiliser tax an option, but may be
politically difficult given the relative price-
inelasticity of fertiliser demand. Difficulty of
monitoring compliance a barrier to trading.
Most abatement likely to be achieved with
education/advice, with some additional
abatement possible using a fertiliser tax.
Assumption of 5% per annum growth
(to 2027) from the level achieved by
options 1,2,4
Nutrient
management
Crops-Soils-
MineralNTiming
Yes - financial savings
provide incentive
Gradual improvement in advice,
regional/soil specific etc based
on RTD findings
Payments likely to be of limited
effectiveness due to difficulty of
monitoring compliance.
Unlikely to achieve significant
additional uptake due to the
difficulty of monitoring compliance.
Fertiliser tax unlikely to be effective, given
small fertiliser savings arising from this
measure. Difficulty of monitoring
compliance a barrier to trading.
Most abatement likely to be achieved with
education/advice, with a little additional
abatement possible using payments.
Assumption of 5% per annum growth
(to 2027) from the level achieved by
options 1,2,5
Nutrient
management
Crops-Soils-
OrganicNTiming
Yes - financial savings
provide incentive
Gradual improvement in advice,
regional/soil specific etc based
on RTD findings
Payments likely to be of limited
effectiveness effective due to
difficulty of monitoring
compliance.
Unlikely to achieve significant
additional uptake due to the
difficulty of monitoring compliance.
Fertiliser tax unlikely to be effective, given
small fertiliser savings arising from this
measure. Difficulty of monitoring
compliance a barrier to trading.
Most abatement likely to be achieved with
education/advice, with a little additional
abatement possible using payments.
Assumption of 5% per annum growth
(to 2027) from the level achieved by
options 1,2,6
Nutrient
management
Crops-Soils-
SlurryMineralNDelaye
d
Unlikely - no financial
incentive
Could guidelines be improved?
Any role for RTD to improve
efficacy of this?
Payments likely to be of limited
effectiveness due to difficulty of
monitoring compliance.
Unlikely to achieve significant
additional uptake due to the
difficulty of monitoring compliance.
Fertiliser tax unlikely to be effective, given
small fertiliser savings arising from this
measure. Difficulty of monitoring
compliance a barrier to trading.
Likely to have a low uptake, regardless of
the policy approach.
Assumption of 5% per annum growth
(to 2027) from the level achieved by
options 1,2,7
Nutrient
management
Crops-Soils-
UsingComposts
Unlikely - no financial
incentive
RTD required to, e.g., improve
understanding of compost
emissions compared to
manure, and to clarify yield
effects of using composts
Payments could be effective given
the relative ease of monitoring
compliance and low cost
Could in theory be mandated, but
in order to achieve abatement
additional to incentive -based
approaches, penalties would have
to be significantly higher than the
incentives.
Fertiliser tax unlikely to be effective, given
small fertiliser savings arising from this
measure.
Uptake will vary significantly depending on
the policy approach adopted.
Assumption of 5% per annum growth
(to 2027) from the level achieved by
options 1,2,3
Soil
management
Crops-Soils-
Drainage
Unlikely- little incentive
to undertake surveys of
plannnig for drainage -
Need for a national
survey of current
drainage status &
introduction of drainage
improvement plan
Potential improvements in
sampling methods to provide a
clearer national picture of
drainage conditions
Potential for drainage plans to be
included in RDP cross
compliance regimes
Potential mandatory requirement
for cross-compliance - to enrol in
a rolling program of maintenance Unlikely to be applicable
Current uncertainty about percentage of
land that might benefit from improved
drainage. To be resolved by on-going
Defra project. Drainage investments are
periodic requirement since infrasture
needs to be renewed
Assumption of 7% per annum growth
(to 2027) from the level achieved by
options 1,2,3
Soil
management
Crops-Soils-
ReducedTill Unlikely to be applicable
Nitrification
inhibitors Crops-Soils-Nis
Possible - anecdotal
evidence of yield gains
Singificant potential in
developing current fertiliser
design and use guidelines
Potential for drainage plans to be
included in RDP cross
compliance regimes
Potential mandatory requirement
for cross-compliance - to enrol in
a rolling program of maintenance Unlikely to be applicable
Apparent disparties in research findings on
the cost of development and application
(e.g. between UK and NZ) need to be
quicky resolved to unlock potential
.Awaiting findings of Defra and RERAD
funded research
Assumption of 10% per annum growth
(to 2027) from the level achieved by
options 1,2,3
Using more N
eff. Plants
Crops-Soils-
ImprovedN-
UsePlants
Possible yield
enhancement but
currently yield losses
while crops in
development
Highly significant - but gains not
expected for around 15 years
since 10 years of development
and 5 years to improve uptake
Applicable when new plants
available
Potential mandatory requirement
for cross-compliance - to enrol in
a rolling program of maintenance Unlikely to be applicable
10 years of further research before plants
ready for uptake. Accelerated use
thereafter
Assumption of 20% per annum growth
(to 2027) from the level achieved by
options 1,2,3
Using more N
eff. Plants
Crops-Soils-
SpeciesIntro Unlikely to be applicable
10 years of further research before plants
ready for uptake.

153
Option1. Education/
advice/barrier removalEffect of RTD
Option 2. Extension of existing
incentive based approachesOption 3. Command and control Option 4. New incentive based approaches Summary Assumption 2022-2027
AD CAD-Poultry-5MW
Cost sharing potential
with other feedstock
producers (e.g.
municipal/commercial
organic waste
disposal)
Optimise feedstock
mix/systems to provide
improved economic returns
Potential for digestate market
support. Potential for inclusion in
RDP measures
Potential planning regulations
mandating CAD as CHP biomass
source for new developments.
Potential for mandatory digestate
standards (and removal of
classification as waste) to
Potential for finance for partial off-setting
from expanded carbon market (full off-
setting would mean zero agricultural
mitigation)
Assumption of 5% per annum growth
(to 2027) from the level achieved by
options 4
AD OFAD-PigsLarge
Unlikely - no financial
incentive
Optimise feedstock
mix/systems to provide
improved economic returns
Potential for digestate market
support. Potential for inclusion in
RDP measures
Potential for mandatory digestate
standards (and removal of
classification as waste) to
encourage appication to
agricultural land.
Potential for finance for partial off-setting
from expanded carbon market (full off-
setting would mean zero agricultural
mitigation)
Assumption of 5% per annum growth
(to 2027) from the level achieved by
options 4
AD OFAD-PigsMedium
Unlikely - no financial
incentive
Optimise feedstock
mix/systems to provide
improved economic returns
Potential for digestate market
support. Potential for inclusion in
RDP measures
Potential for mandatory digestate
standards (and removal of
classification as waste) to
encourage appication to
agricultural land.
Potential for finance for partial off-setting
from expanded carbon market (full off-
setting would mean zero agricultural
mitigation)
Assumption of 2% per annum growth
(to 2027) from the level achieved by
options 4
Manure
management
BeefManure-
CoveringLagoons Unlikely - no financial incentive
Gradual improvement in advice
and demonstration of
environmental impacts as well
as nutreient value of the
manure/slurry for fertiliser use
Potential for inclusion in
RDP/GAEC measures
Potential for mandatory
manure/slurry stoage standards
(and removal of classification as
waste) to encourage appication to
agricultural land.
Differential taxes on organic vs inorganic
fertilisers, combined with environmental
legislation, may increase the value and the
effort placed on managing waste from
livestock
Assumption of 2% per annum growth
(to 2027) from the level achieved by
options 4
Manure
management
BeefManure-
CoveringSlurryTanks Unlikely - no financial incentive
Gradual improvement in advice
and demonstration of
environmental impacts as well
as nutreient value of the
manure/slurry for fertiliser use
Potential for inclusion in
RDP/GAEC measures
Potential for mandatory
manure/slurry stoage standards
(and removal of classification as
waste) to encourage appication to
agricultural land.
Differential taxes on organic vs inorganic
fertilisers, combined with environmental
legislation, may increase the value and the
effort placed on managing waste from
livestock
Assumption of 2% per annum growth
(to 2027) from the level achieved by
options 4
Manure
management
DairyManure-
CoveringLagoons Unlikely - no financial incentive
Gradual improvement in advice
and demonstration of
environmental impacts as well
as nutreient value of the
manure/slurry for fertiliser use
Potential for inclusion in
RDP/GAEC measures
Potential for mandatory
manure/slurry stoage standards
(and removal of classification as
waste) to encourage appication to
agricultural land.
Differential taxes on organic vs inorganic
fertilisers, combined with environmental
legislation, may increase the value and the
effort placed on managing waste from
livestock
Assumption of 2% per annum growth
(to 2027) from the level achieved by
options 4
Manure
management
DairyManure-
CoveringSlurryTanks Unlikely - no financial incentive
Gradual improvement in advice
and demonstration of
environmental impacts as well
as nutreient value of the
Potential for inclusion in
RDP/GAEC measures
Potential for mandatory
manure/slurry stoage standards
(and removal of classification as
waste) to encourage appication to
Differential taxes on organic vs inorganic
fertilisers, combined with environmental
legislation, may increase the value and the
effort placed on managing waste from
Assumption of 2% per annum growth
(to 2027) from the level achieved by
options 4
Livestock
breeding
BeefAn-
ImprovedGenetics
Yes - prodcutivity gain,
but currently low uptake
due to information
barriers
Large potential for cumulative
and permanent improvements
in productivity
Payment possible under RDP
options for support in purchasing
improved genetics (e.g., buying
bulls based on minimum
breeding worth level for desired
Potential mandatory requirement
for cross-compliance - to enrol in
a rolling program of maintenance
Potential for supply chain regulations to be
put in place wither from drivers from the
supermarkets/large purchasers and/or
comsumers.
Assumption of 2.5% per annum growth
(to 2027) from the level achieved by
options 4
Livestock
breeding
DairyAn-
ImprovedFertility
Yes - system wide
productivity gain.
Current widely used
genetic tools could be
retailored to address
this. Farmers would
need to be
educated/incentivised
to move away from
solely economic goal
Large potential for cumulative
and permanent improvements
in system productivity
Payment possible under RDP
options to encourage farmers
shift from current breeidng goal
Potential mandatory requirement
for cross-compliance - to enrol in
a rolling program of maintenance
Potential for supply chain regulations to be
put in place wither from drivers from the
supermarkets/large purchasers and/or
comsumers.
Assumption of 2.5% per annum growth
(to 2027) from the level achieved by
options 4
Livestock
breeding
DairyAn-
ImprovedProductivity
Yes - system wide
prodcutivity gain.
Current widely used
genetic tools could be
retailored to address
this. May reuire
eductaion to shift from
the current goals
Large potential for cumulative
and permanent improvements
in productivity
Payment possible under RDP
options to encourage farmers
shift from current breeidng goal
Potential mandatory requirement
for cross-compliance - to enrol in
a rolling program of maintenance
Potential for supply chain regulations to be
put in place wither from drivers from the
supermarkets/large purchasers and/or
comsumers.
Assumption of 2.5% per annum growth
(to 2027) from the level achieved by
options 4
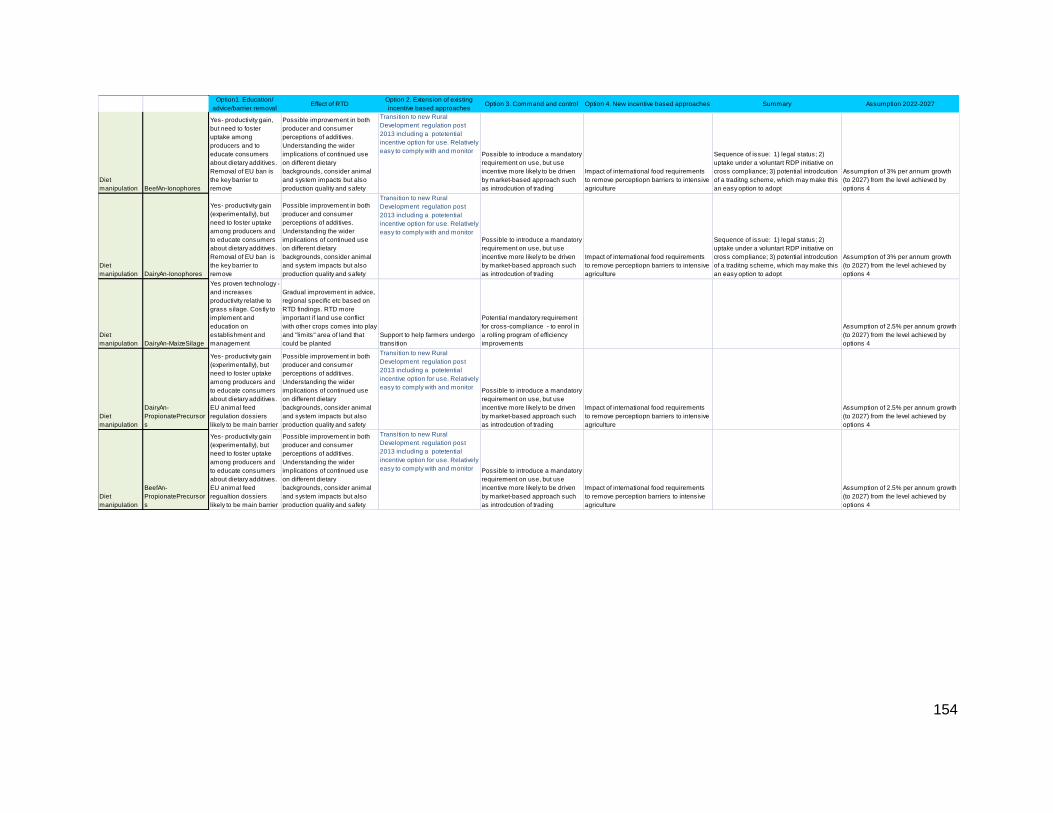
154
Option1. Education/
advice/barrier removalEffect of RTD
Option 2. Extension of existing
incentive based approachesOption 3. Command and control Option 4. New incentive based approaches Summary Assumption 2022-2027
Diet
manipulation BeefAn-Ionophores
Yes- productivity gain,
but need to foster
uptake among
producers and to
educate consumers
about dietary additives.
Removal of EU ban is
the key barrier to
remove
Possible improvement in both
producer and consumer
perceptions of additives.
Understanding the wider
implications of continued use
on different dietary
backgrounds, consider animal
and system impacts but also
production quality and safety
Transition to new Rural
Development regulation post
2013 including a potetential
incentive option for use. Relatively
easy to comply with and monitor Possible to introduce a mandatory
requirement on use, but use
incentive more likely to be driven
by market-based approach such
as introdcution of trading
Impact of international food requirements
to remove perceptiopn barriers to intensive
agriculture
Sequence of issue: 1) legal status; 2)
uptake under a voluntart RDP initiative on
cross compliance; 3) potential introdcution
of a traditng scheme, which may make this
an easy option to adopt
Assumption of 3% per annum growth
(to 2027) from the level achieved by
options 4
Diet
manipulation DairyAn-Ionophores
Yes- productivity gain
(experimentally), but
need to foster uptake
among producers and
to educate consumers
about dietary additives.
Removal of EU ban is
the key barrier to
remove
Possible improvement in both
producer and consumer
perceptions of additives.
Understanding the wider
implications of continued use
on different dietary
backgrounds, consider animal
and system impacts but also
production quality and safety
Transition to new Rural
Development regulation post
2013 including a potetential
incentive option for use. Relatively
easy to comply with and monitorPossible to introduce a mandatory
requirement on use, but use
incentive more likely to be driven
by market-based approach such
as introdcution of trading
Impact of international food requirements
to remove perceptiopn barriers to intensive
agriculture
Sequence of issue: 1) legal status; 2)
uptake under a voluntart RDP initiative on
cross compliance; 3) potential introdcution
of a traditng scheme, which may make this
an easy option to adopt
Assumption of 3% per annum growth
(to 2027) from the level achieved by
options 4
Diet
manipulation DairyAn-MaizeSilage
Yes proven technology -
and increases
productivity relative to
grass silage. Costly to
implement and
education on
establishment and
management
Gradual improvement in advice,
regional specific etc based on
RTD findings. RTD more
important if land use conflict
with other crops comes into play
and "limits" area of land that
could be planted
Support to help farmers undergo
transition
Potential mandatory requirement
for cross-compliance - to enrol in
a rolling program of efficiency
improvements
Assumption of 2.5% per annum growth
(to 2027) from the level achieved by
options 4
Diet
manipulation
DairyAn-
PropionatePrecursor
s
Yes- productivity gain
(experimentally), but
need to foster uptake
among producers and
to educate consumers
about dietary additives.
EU animal feed
regulation dossiers
likely to be main barrier
Possible improvement in both
producer and consumer
perceptions of additives.
Understanding the wider
implications of continued use
on different dietary
backgrounds, consider animal
and system impacts but also
production quality and safety
Transition to new Rural
Development regulation post
2013 including a potetential
incentive option for use. Relatively
easy to comply with and monitorPossible to introduce a mandatory
requirement on use, but use
incentive more likely to be driven
by market-based approach such
as introdcution of trading
Impact of international food requirements
to remove perceptiopn barriers to intensive
agriculture
Assumption of 2.5% per annum growth
(to 2027) from the level achieved by
options 4
Diet
manipulation
BeefAn-
PropionatePrecursor
s
Yes- productivity gain
(experimentally), but
need to foster uptake
among producers and
to educate consumers
about dietary additives.
EU animal feed
regualtion dossiers
likely to be main barrier
Possible improvement in both
producer and consumer
perceptions of additives.
Understanding the wider
implications of continued use
on different dietary
backgrounds, consider animal
and system impacts but also
production quality and safety
Transition to new Rural
Development regulation post
2013 including a potetential
incentive option for use. Relatively
easy to comply with and monitor Possible to introduce a mandatory
requirement on use, but use
incentive more likely to be driven
by market-based approach such
as introdcution of trading
Impact of international food requirements
to remove perception barriers to intensive
agriculture
Assumption of 2.5% per annum growth
(to 2027) from the level achieved by
options 4

155
APPENDIX J. Brief descriptions of the mitigation measures
Type Measure Description C
rop
s/s
oils
Mineral N timing and organic N timing
Matching the timing of application with the time the crop will make most use of the fertiliser reduces the likelihood of N2O emissions by ensuring there is a better match between supply and demand. This can be achieved by avoiding time delays between the application of N and its uptake by the plants, i.e. by avoiding applying fertiliser when the crop is not growing, or when there is no crop.
Avoid N Excess
Reducing N application in areas where it is applied in excess reduces N in the system and therefore reduces N2O emissions. There are various schemes and advisory activities to help farmers apply N at optimum recommended rates, for example: Defra‟s RB209 guidance. Unlike simply reducing N fertiliser application rates, avoiding N excess should not lead to reductions in yield.
Full Manure
This involves using manure N as far as possible. The fertiliser requirement is adjusted for the manure N, which potentially leads to a reduction in fertiliser N applied. In addition, the manure N is more likely to be applied when the crop is going to make use of the N, and therefore N2O emissions will be reduced.
Using Composts
Composts provide a more steady release of N than slurries which increase soil moisture content and provide a source of easily degradable products, which in turn increases microbial demand. Both these increase anaerobic conditions and thereby loss of nitrous oxide which is avoided by use of composts. Composts also have a higher C:N ratio so that released N is more likely to be immobilised temporarily and thereby reduce N2O emissions. It is assumed that composts contain enough N to provide fertiliser, and that the composts will not immobilise soil or fertiliser N and reduce crop productivity.
Slurry Mineral N Delayed
Applying slurry and fertiliser together brings together easily degradable compounds in the slurry and increased water contents, which can greatly increase the denitrification of available N and thereby the emission of nitrous oxide. It is assumed that weather conditions allow separation of the applications, that slurry can be stored before spreading or is available for spreading at the appropriate time.
Nitrification inhibitors
Nitrification inhibitors slow the rate of conversion of fertiliser ammonium to nitrate. This means that the rate of reduction of nitrate to nitrous oxide (or dinitrogen) is decreased and emissions of nitrous oxide decrease. It is assumed that the inhibitor makes good contact with the fertiliser or urine patch to be effective, and that the inhibitor will be applied at the right time and to the right fertiliser type.
Drainage Wet soils can lead to anaerobic conditions favourable to the direct emission of N2O. Improving drainage can therefore reduce N2O emissions by increasing soil aeration. Improving land drainage has significant one-off costs.
Reduced Tillage
No tillage, and to a lesser extent, minimum (shallow) tillage reduces release of stored carbon in soils because of decreased rates of oxidation. The lack of disturbance by tillage can also increase the rate of oxidation of methane from the atmosphere. It is assumed that nitrous oxide emissions are not increased due to concentration of microbial activity and nitrogen fertiliser near the surface and due to increase soil wetness associated with the greater compactness of the soil, and that crop growth and hence net primary productivity is not reduced by use of these techniques. This measure requires specialist machinery and therefore has significant one-off costs.
Improved N-Use Plants
Different plant species utilise N with different levels of efficiency. There should therefore be scope for selectively breeding plants that utilise N more efficiently. Adopting new plant varieties that can produce the same yields using less N would reduce the amount of fertiliser required and the associated emissions.
Species Introduction
The species that are introduced are either legumes or they are taking up N from the system more efficiently and there is therefore less available for N2O emissions. This measure differs from the measure "biological fixation" in that the species introduced are varieties that are not commonly used in the UK at present.

156
Liv
es
toc
k
BeefAn-Improved Genetics DairyAn-Improved Fertility DairyAn-Improved Productivity
Generally, selection for efficiency of production in livestock species will help to reduce emissions. In many cases this can be achieved simply through selection on production traits and traits related to the efficiency of the entire production system (e.g., fertility and longevity traits). The impact of selection on these traits is twofold • Reducing the number of animals required to produce a fixed level of output. • Increasing the efficiency of production will help reduce the finishing period for meat animals, therefore reducing emissions per unit output.
Beef and dairy ionophores
Ionophore antimicrobials (e.g., monensin) are used to improve efficiency of animal production by decreasing the dry matter intake (DMI) and increasing performance and decreasing CH4 production. It should be noted that the use of these additives are forbidden in the EU but they have been routinely used as a growth promoter in some non-EU countries. The effect of these types of feed additives on production and/or CH4 output varies from study to study. The values used in this study are a 25% reduction in CH4 production coupled with a 25% improvement in production (van Nevel & Demeyer, 1995). This option was studied for beef and dairy cattle. There have been some reports of potential unfavourable side-effects with the application of this treatment with an increase in metabolic disorders in the animal (McGuffey et al., 2001; Duffield et al., 2008). This option was studied for beef and dairy cattle.
DairyAn-Maize Silage
Methane emissions from ruminant species can be reduced by replacing the roughage proportion of the diet with concentrates (e.g., Blaxter and Claperton, 1965). A higher concentrate diet may increase the methane produced by an individual animal but will, however, reduce the amount of methane produced per unit of product. Animals fed a concentrate based diet tend to produce more (e.g., higher milk yields in dairy cattle) and/or reach final weight faster (i.e., meat sheep and cattle reach slaughter weight at a younger age). Overall, the impact of this is that fewer animals are required and meat animals are kept for a shorter period thereby reducing emissions at a fixed output level. Estimates of the impact on production for dairy of using high starch feeds in the diet were obtained from the IGER study (IGER, 2001). The study examined the impact of production and methane emissions if the proportion of grass: maize silage in the diet was changed from 3:1 to 1:3. The outcome of the model estimated a 7% increase in milk yield and a 2% increase in CH4 production. These values were used to estimate the abatement potential of increasing the proportion of maize silage in a typical dairy diet.
Beef and dairy propionate precursors
Hydrogen produced in the rumen through fermentation can react to produce either CH4 or propionate. By adding propionate precursors (e.g., fumarate) to animal feed, more hydrogen is used to produce propionate and less CH4 is produced. There is also a favourable effect on milk yield (15%). This option was studied for beef and dairy cattle.
AD
CAD-Poultry-5MW 5MW Centralised Anaerobic Digestion units on poultry farms
OFAD-Pigs Large On-farm Anaerobic Digestion units on farms with over 1000 fattening pigs
OFAD-Pigs Medium
On-farm Anaerobic Digestion units on farms with 200 to 999 fattening pigs
OFAD-Beef Large On-farm Anaerobic Digestion units on farms with over 50 cattle
OFAD-Dairy Large On-farm Anaerobic Digestion units on farms with over 100 cattle
OFAD-Beef Medium
On-farm Anaerobic Digestion units on farms with 20-49 cattle
OFAD-Dairy Medium
On-farm Anaerobic Digestion units on farms with 50-99 cattle
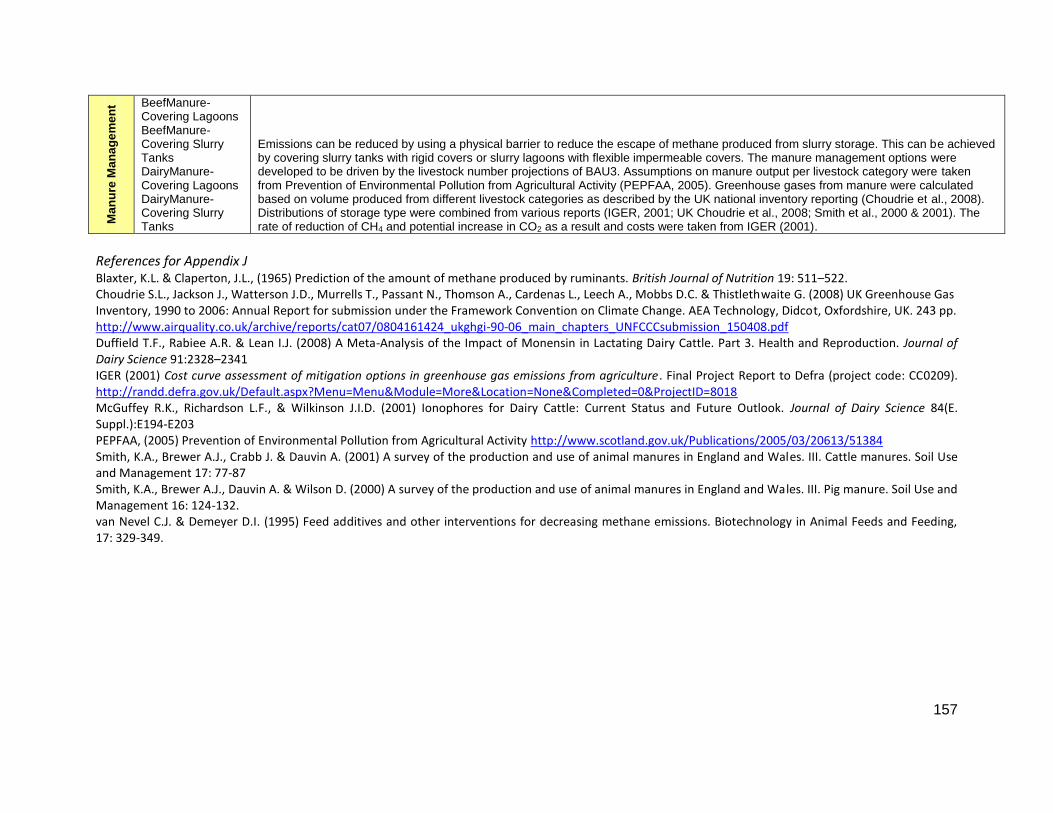
157
Ma
nu
re M
an
ag
em
en
t BeefManure-Covering Lagoons BeefManure-Covering Slurry Tanks DairyManure-Covering Lagoons DairyManure-Covering Slurry Tanks
Emissions can be reduced by using a physical barrier to reduce the escape of methane produced from slurry storage. This can be achieved by covering slurry tanks with rigid covers or slurry lagoons with flexible impermeable covers. The manure management options were developed to be driven by the livestock number projections of BAU3. Assumptions on manure output per livestock category were taken from Prevention of Environmental Pollution from Agricultural Activity (PEPFAA, 2005). Greenhouse gases from manure were calculated based on volume produced from different livestock categories as described by the UK national inventory reporting (Choudrie et al., 2008). Distributions of storage type were combined from various reports (IGER, 2001; UK Choudrie et al., 2008; Smith et al., 2000 & 2001). The rate of reduction of CH4 and potential increase in CO2 as a result and costs were taken from IGER (2001).
References for Appendix J Blaxter, K.L. & Claperton, J.L., (1965) Prediction of the amount of methane produced by ruminants. British Journal of Nutrition 19: 511–522. Choudrie S.L., Jackson J., Watterson J.D., Murrells T., Passant N., Thomson A., Cardenas L., Leech A., Mobbs D.C. & Thistlethwaite G. (2008) UK Greenhouse Gas Inventory, 1990 to 2006: Annual Report for submission under the Framework Convention on Climate Change. AEA Technology, Didcot, Oxfordshire, UK. 243 pp. http://www.airquality.co.uk/archive/reports/cat07/0804161424_ukghgi-90-06_main_chapters_UNFCCCsubmission_150408.pdf Duffield T.F., Rabiee A.R. & Lean I.J. (2008) A Meta-Analysis of the Impact of Monensin in Lactating Dairy Cattle. Part 3. Health and Reproduction. Journal of Dairy Science 91:2328–2341 IGER (2001) Cost curve assessment of mitigation options in greenhouse gas emissions from agriculture. Final Project Report to Defra (project code: CC0209). http://randd.defra.gov.uk/Default.aspx?Menu=Menu&Module=More&Location=None&Completed=0&ProjectID=8018 McGuffey R.K., Richardson L.F., & Wilkinson J.I.D. (2001) Ionophores for Dairy Cattle: Current Status and Future Outlook. Journal of Dairy Science 84(E. Suppl.):E194-E203 PEPFAA, (2005) Prevention of Environmental Pollution from Agricultural Activity http://www.scotland.gov.uk/Publications/2005/03/20613/51384 Smith, K.A., Brewer A.J., Crabb J. & Dauvin A. (2001) A survey of the production and use of animal manures in England and Wales. III. Cattle manures. Soil Use and Management 17: 77-87 Smith, K.A., Brewer A.J., Dauvin A. & Wilson D. (2000) A survey of the production and use of animal manures in England and Wales. III. Pig manure. Soil Use and Management 16: 124-132. van Nevel C.J. & Demeyer D.I. (1995) Feed additives and other interventions for decreasing methane emissions. Biotechnology in Animal Feeds and Feeding, 17: 329-349.
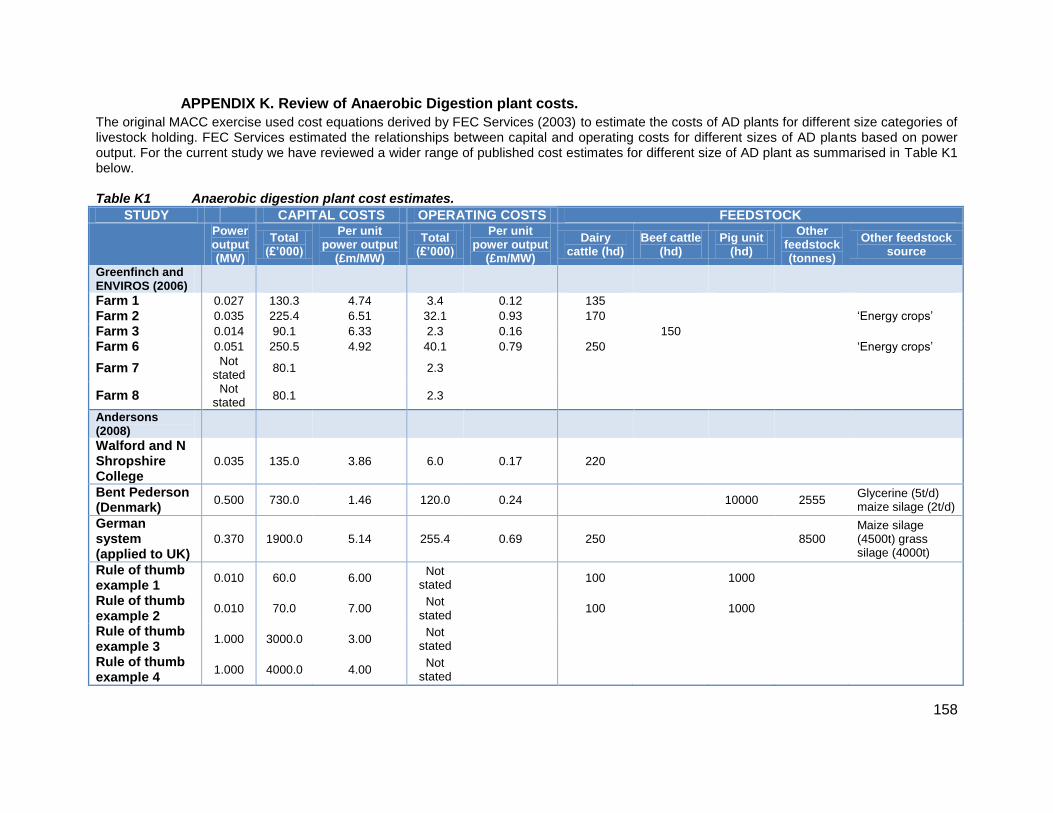
158
APPENDIX K. Review of Anaerobic Digestion plant costs.
The original MACC exercise used cost equations derived by FEC Services (2003) to estimate the costs of AD plants for different size categories of livestock holding. FEC Services estimated the relationships between capital and operating costs for different sizes of AD plants based on power output. For the current study we have reviewed a wider range of published cost estimates for different size of AD plant as summarised in Table K1 below. Table K1 Anaerobic digestion plant cost estimates.
STUDY CAPITAL COSTS OPERATING COSTS FEEDSTOCK
Power output (MW)
Total (£’000)
Per unit power output
(£m/MW)
Total (£’000)
Per unit power output
(£m/MW)
Dairy cattle (hd)
Beef cattle (hd)
Pig unit (hd)
Other feedstock (tonnes)
Other feedstock source
Greenfinch and ENVIROS (2006) Farm 1 0.027 130.3 4.74 3.4 0.12 135
Farm 2 0.035 225.4 6.51 32.1 0.93 170
„Energy crops‟
Farm 3 0.014 90.1 6.33 2.3 0.16
150
Farm 6 0.051 250.5 4.92 40.1 0.79 250
„Energy crops‟
Farm 7 Not
stated 80.1
2.3
Farm 8 Not
stated 80.1
2.3
Andersons (2008)
Walford and N Shropshire College
0.035 135.0 3.86 6.0 0.17 220
Bent Pederson (Denmark)
0.500 730.0 1.46 120.0 0.24
10000 2555 Glycerine (5t/d) maize silage (2t/d)
German system (applied to UK)
0.370 1900.0 5.14 255.4 0.69 250
8500 Maize silage (4500t) grass silage (4000t)
Rule of thumb example 1
0.010 60.0 6.00 Not
stated 100
1000
Rule of thumb example 2
0.010 70.0 7.00 Not
stated 100
1000
Rule of thumb example 3
1.000 3000.0 3.00 Not
stated
Rule of thumb example 4
1.000 4000.0 4.00 Not
stated

159
FEC Services Ltd (2003)
Boyd (2001)
0.010 60.0 6.00 3.0 0.30
0.010 70.0 7.00 6.3 0.63
1.000 3000.0 3.00 150.0 0.15
1.000 4000.0 4.00 360.0 0.36
Higham (1998) 0.025 310.0 12.40 15.5 0.62
1.000 5650.0 5.65 508.5 0.51
Morgan (2008)
Lowbrook farm 0.340 900.0 2.65 81.0 0.24 500
3700 Green crop biomass
Weltec (German system)
0.500 1531.0 3.06 292.2 0.58
Not stated
10000 Maize silage
Greenfinch (Ludow)
0.200 1800.0 9.00 Not
stated 5000
Municipal food waste
Mistry and Misselbrook (2005)
Dairy 0.034 154.1 4.51 3.1 0.09 168
Beef 0.010 137.6 14.23 2.8 0.28
102
Pigs 0.180 185.5 1.03 3.7 0.02
2196

160
The costs per unit of power output were then plotted against the associated power output and best fit lines plotted using Excel. These plots are presented in Figure K1: a) capital costs, and b) operating costs. It should be noted that there is considerable variation within the data that most likely reflects case specific nature of these costs. For example these might be influenced by the methane production capability of different slurry inputs or the quantity and quality of additional feedstock (typically silages). The variation is particularly pronounced at the lower end of the power output scale; this is where the majority of on-farm AD plants are likely to be located and adds further emphasis to the uncertainty surrounding the costs of AD plants. A number of best fit lines were estimated for both capital and operating costs with either log or power functions proving to be the most suitable in terms of R
2. For capital costs the best performing specification
was a log function: y = -0.939ln(x) + 3.1714 This had a R
2 value of 0.32 and is illustrated in Figure K2 together with high and low cost functions
estimated by FEC Services (2003). A power function derived from the current data is also illustrated as this is consistent with the functional form used by FEC Services, although this was not the best performing specification with the current dataset (R
2 = 0.29).
The best fit line estimated for the operating costs data in Figure K1(b) is flat and does not reveal the increasing economies to scale we would expect as we move towards larger plants; the flat trajectory of the line reflects the wide dispersion of observations at lower power outputs. To account for this dispersion we considered the effect of additional feedstock cost on the operating costs of plants as these can be considerable (either in purchase or opportunity cost terms). Figure K3 presents plots of the operating cost data for studies where the costs of additional feedstock can be identified. For each case a separate best fit line was estimated and the following power functions were found to have the best explanatory power: Without feedstock costs: y = 0.0691x
-0.285, R
2 = 0.16
With feedstock costs: y = 0.3108x-0.331
, R2 = 0.59
The cost functions indicated by these functions are plotted in Figure K4 together with the operating cost function estimated by FEC Services (2003). The inclusion of additional feedstock has a considerable effect on per unit output costs, particularly at lower power outputs. However the purpose of using additional feedstock is to improve the biogas yield of the digester and also extends the operating period of the plant to times when livestock are not housed and slurry is not being collected.
Figure K1 Capital (a) and operating (b) costs of anaerobic digestion plants.
0.0
2.0
4.0
6.0
8.0
10.0
12.0
14.0
16.0
0 0.2 0.4 0.6 0.8 1
Cap
ital
co
st (
£m
/MW
)
Power output (MW)
a) Cost per unit power (£m/MW)
0.0
0.2
0.4
0.6
0.8
1.0
0 0.2 0.4 0.6 0.8 1
Op
era
tin
g co
sts
(£m
/MW
)
Power output (MW)
b) Operational cost per unit power (£M/MW)

161
Figure K2 Cost functions for capital costs of anaerobic digestion plants.
Figure K3 Operating costs of anaerobic digestion plants with and without additional feedstock.
0
1
2
3
4
5
6
7
8
0.0 0.1 0.2 0.3 0.4 0.5 0.6 0.7 0.8 0.9 1.0
Cap
ital
co
st (
£m
/MW
)
Power output (MW)
Capital cost of AD plant
Data (log function R^2 = 0.3153) Data (power function R^2 = 0.2934)
FEC Services low estimate FEC Services high estimate
0
0.2
0.4
0.6
0.8
1
1.2
1.4
1.6
0 0.1 0.2 0.3 0.4 0.5 0.6 0.7 0.8 0.9 1
Op
era
tin
g co
sts
(£m
/MW
)
Power output (MW)
Operating costs of AD plant
Without feedstock costs With feedstock costs

162
Figure K4 Cost functions for operating costs of anaerobic digestion plants.
References for Appendix K
Andersons (2008) A Detailed Economic Assessment of Anaerobic Digestion Technology and its Suitability to UK Farming and Waste Systems, report for the National Non-Food Crops Centre, The Andersons Centre Boyd J (2001) Energy from Agricultural Wastes, SAC draft divisional note FEC Services Ltd (2003) Anaerobic Digestion, Storage, Oligolysis, Lime, Heat and Aerobic Treatment of Livestock Manures, final Report Provision of research and design of pilot schemes to minimise livestock pollution to the water environment in Scotland QLC /2, FEC Services Ltd Greenfinch & ENVIROS (2006) Farm Scale Biogas and Composting to Improve Bathing Water Quality, final report to the Scottish Executive, Water Division, Greenfinch Ltd & Enviros Consulting Ltd Higham (1998) Economics of Anaerobic Digestion of Agricultural Waste, AEA Technology Mistry P & Misselbrook T (2005) Assessment of Methane Management and Recovery Options for Livestock Manures and Slurries, final report to Defra, AEA Technology Ltd and IGER Morgan J (2008) Agriculture’s Role in Energy Production from Biomass and Waste, Nuffield Farming Scholarships Trust
0
0.2
0.4
0.6
0.8
1
1.2
0.0 0.1 0.2 0.3 0.4 0.5 0.6 0.7 0.8 0.9 1.0
Op
era
tin
g c
ost
(£
m/M
W)
Power output (MW)
Operating cost of AD plant
Data (feedstock costs R^2 = 0.5916) Data (no feedstock costs R^2 = 0.1593) FEC Services estimate