using archived truck gps data for freight performance analysis on
TRANSCRIPT

Using Archived Truck GPS Data for Freight Performance Analysis on
I-94/I-90 from the Twin Cities to Chicago
Final Report
Prepared by:
Chen-Fu Liao
Department of Civil Engineering University of Minnesota
CTS 09-27

Technical Report Documentation Page 1. Report No. 2. 3. Recipients Accession No. CTS 09-27 4. Title and Subtitle 5. Report DateUsing Archived Truck GPS Data for Freight Performance Analysis on I-94/I-90 from the Twin Cities to Chicago
November 2009 6.
7. Author(s) 8. Performing Organization Report No. Chen-Fu Liao 9. Performing Organization Name and Address 10. Project/Task/Work Unit No. Department of Civil Engineering University of Minnesota 500 Pillsbury Drive, SE Minneapolis, MN 55455-0116
CTS Project #2009069 11. Contract (C) or Grant (G) No.
(c) 89261 (wo) 150
12. Sponsoring Organization Name and Address 13. Type of Report and Period Covered Minnesota Department of Transportation Office of Freight and Commercial Vehicle Operations 395 John Ireland Boulevard, St. Paul, Minnesota 55155-1899
Final Report 14. Sponsoring Agency Code
15. Supplementary Notes http://www.cts.umn.edu/Publications/ResearchReports/ 16. Abstract (Limit: 250 words) Interstate 94 is a key freight corridor for goods transportation between Minneapolis and Chicago. This project proposes to utilize the FPM data and information from ATRI to study the I-94/I-90 freight corridor. Freight performance will be evaluated and analyzed to compare truck travel time with respect to duration, reliability, and seasonal variation. This data analysis process can be used for freight transportation planning and decision-making and potentially will be scalable for nationwide deployment and implementation on the country’s significant freight corridors.
17. Document Analysis/Descriptors 18. Availability Statement Freight transportation, Trucking, Performance measurement, Data analysis, Data processing, Global Positioning System, GPS/AVL, Travel time, Congestion measure, Traffic congestion
No restrictions. Document available from: National Technical Information Services, Springfield, Virginia 22161
19. Security Class (this report) 20. Security Class (this page) 21. No. of Pages 22. Price Unclassified Unclassified 98

Using Archived Truck GPS Data for Freight Performance Analysis on
I-94/I-90 from the Twin Cities to Chicago
Final Report
Prepared by
Chen-Fu Liao Minnesota Traffic Observatory
Department of Civil Engineering University of Minnesota
November 2009
Published by
Intelligent Transportation Systems Institute Center for Transportation Studies
University of Minnesota 200 Transportation and Safety Building
511 Washington Ave SE Minneapolis, MN 55455
The contents of this report reflect the views of the authors, who are responsible for the facts and the accuracy of the information presented herein. This document is disseminated under the sponsorship of the Department of Transportation University Transportation Centers Program, in the interest of information exchange. The U.S. Government assumes no liability for the contents or use thereof. This report does not necessarily reflect the official views or policy of the Minnesota Department of Transportation, the Intelligent Transportation Systems Institute, or the University of Minnesota. The authors, the Minnesota Department of Transportation, the Intelligent Transportation Systems Institute, the University of Minnesota, and the U.S. Government do not endorse products or manufacturers. Trade or manufacturers’ names appear herein solely because they are considered essential to this report.

ACKNOWLEDGEMENTS
This project is sponsored by the Federal Highway Administration (FHWA) and Minnesota Department of Transportation (Mn/DOT) in collaboration with the American Transportation Research Institute (ATRI) under the Mn/DOT contract. The ATRI research on Freight Performance Measure (FPM) system is funded by the U.S. Department of Transportation Federal Highway Administration. I would like to thank the FHWA, ATRI and Mn/DOT for supporting this freight performance data analysis. I also would like to thank the following people for their support.
• Crystal Jones at FHWA for her efforts to produce FPM collaboration with universities and making this type of work possible.
• Jeff Short and Dan Murray at ATRI for providing truck data and support on the ATRI FPM data processing systems.
• John Tompkins from Mn/DOT freight office for his coordinating effort with data requests from other state DOTs.
• Jesse Larson from Mn/DOT Freeway Operations for providing I-94 traffic data. • John Benda from Illinois State Toll Highway Authority (ISTHA) and William Hereth from
Wilbur Smith Associates for providing I-90 traffic data.

TABLE OF CONTENTS 1. INTRODUCTION .................................................................................................................................. 1
1.1 Background ....................................................................................................................................... 1 1.2 Research Objectives .......................................................................................................................... 2 1.3 Literature Review.............................................................................................................................. 2
2. DATA PROCESSING METHODOLOGY ............................................................................................ 5 2.1 Data Processing Procedures .............................................................................................................. 5 2.2 Data Analysis .................................................................................................................................... 7
3. RESULTS OF DATA ANALYSIS ........................................................................................................ 9 3.1 Truck Speed Analysis along I-94/I-90 Corridor ............................................................................... 9 3.2 Truck Speed and Volume Analysis by Location ............................................................................ 12
3.2.1 St. Paul, MN ............................................................................................................................. 12 3.2.2 O’Hare Airport, IL ................................................................................................................... 13 3.2.3 Truck Volume on I-90 Toll Highway ...................................................................................... 15
3.3 Performance Index .......................................................................................................................... 18 3.3.1 Travel Time Index (TTI) .......................................................................................................... 19 3.3.2 Buffer Time Index (BTI) ......................................................................................................... 21
3.4 Trip Destination Inference .............................................................................................................. 22 3.5 Truck vs. General Traffic ................................................................................................................ 23
3.5.1 I-94 between St. Paul and Hudson ........................................................................................... 24 3.5.2 I-90 between South Beloit and O’Hare .................................................................................... 25
3.6 Truck Stops and Rest Durations ..................................................................................................... 27 3.6.1 Truck Stop Locations ............................................................................................................... 27 3.6.2 Truck Stop Durations ............................................................................................................... 28
4. POTENTIAL OF FPM DATA ............................................................................................................. 29 5. APPLICATIONS AND RESEARCH OPPORTUNITIES ................................................................... 31
5.1 Travel Time Reliability and Prediction ........................................................................................... 31 5.2 Route Performance Measurement ................................................................................................... 31 5.3 Future Research Topics................................................................................................................... 31
6. SUMMARY AND CONCLUSIONS ................................................................................................... 33 REFERENCES ......................................................................................................................................... 35 APPENDIX A: AVERAGE TRUCK SPEED APPENDIX B: PERFORMANCE INDEX APPENDIX C: TRIP DESTINATIONS APPENDIX D: TRUCK SPEED VS. GENERAL TRAFFIC SPEED APPENDIX E: TRUCK STOPS AND STOP DURATIONS APPENDIX F: I-90 HOURLY TRUCK VOLUME APPENDIX G: DATA PROCESSING SCRIPT AND CODE SAMPLES

LIST OF FIGURES Figure 1. Forecasted Average Annual Daily Truck Traffic: 2020[16] ....................................................... 2 Figure 2. Data Processing Flow Chart ........................................................................................................ 6 Figure 3. Data Processing and Analysis Interface ...................................................................................... 6 Figure 4. Average Travel Speed along I-94/I-90 ...................................................................................... 10 Figure 5. Standard Deviation of Travel Speed along I-94/I-90 ................................................................ 10 Figure 6. Visualization of EB Average Speed in April 2009 Using GIS Software (Apr. 09) .................. 11 Figure 7. Visualization of WB Average Speed in April 2009 Using GIS Software (Apr. 09) ................. 11 Figure 8. Truck Speed Distributions nearby St. Paul ................................................................................ 12 Figure 9. Average Speed Variations by Hour of Day nearby St. Paul...................................................... 13 Figure 10. Truck Volume Variations by Hour of Day nearby St. Paul .................................................... 13 Figure 11. Truck Speed Distributions nearby O’Hare Airport ................................................................. 14 Figure 12. Average Speed Variations by Hour of Day nearby O’Hare Airport ....................................... 15 Figure 13. Truck Volume Variations by Hour of Day nearby O’Hare Airport ........................................ 15 Figure 14. I-90 Average Daily Truck Volumes (Eastbound) – Tier Rate 4 ............................................. 17 Figure 15. I-90 Average Daily Truck Volumes (Westbound) – Tier Rate 4 ............................................ 18 Figure 16. Travel Time Index between IL53 and O’Hare Airport, Jan. 09 .............................................. 20 Figure 17. Travel Time Index between Elgin Toll Plaza and IL53, Jan. 09 ............................................. 20 Figure 18. Travel Time Index between Marengo and Elgin Toll Plaza, Jan. 09 ...................................... 21 Figure 19. Buffer Time Index along I-94/I-90 Corridor in Jan. 2009 ....................................................... 21 Figure 20. Buffer Time Index along I-94/I-90 Corridor in Apr. 2009 ...................................................... 22 Figure 21. Distributions of Trip Destinations (Mar. 2009) ....................................................................... 23 Figure 22. Distributions of Trip Destinations (Apr. 2009) ....................................................................... 23 Figure 23. EB Truck Speed vs. General Traffic Speed from St. Paul to Hudson ..................................... 24 Figure 24. WB Truck Speed vs. General Traffic Speed from Hudson to St. Paul ................................... 25 Figure 25. EB Truck Speed vs. General Traffic Speed from South Beloit to O’Hare .............................. 26 Figure 26. WB Truck Speed vs. General Traffic Speed from O’Hare to South Beloit ............................ 26 Figure 27. Truck Stop Counts at Location (Apr. 2009), N=93,686 .......................................................... 27 Figure 28. Distribution of Truck Stop Duration in Apr. 2009 .................................................................. 28 Figure A-1. Eastbound Average Truck Speed of Each Month ............................................................... A-1 Figure A-2. Eastbound Truck Speed Standard Deviation of Each Month .............................................. A-1 Figure A-3. Westbound Average Truck Speed of Each Month .............................................................. A-2 Figure A-4. Westbound Truck Speed Standard Deviation of Each Month ............................................ A-2 Figure A-5. Truck Speed Distributions nearby Hudson, WI .................................................................. A-3 Figure A-6. Average Speed Variations by Hour of Day nearby Hudson, WI ........................................ A-3 Figure A-7. Truck Volume Variations by Hour of Day nearby Hudson, WI ......................................... A-4 Figure A-8. Truck Speed Distributions nearby Eau Claire, WI .............................................................. A-4 Figure A-9. Average Speed Variations by Hour of Day nearby Eau Claire, WI .................................... A-5 Figure A-10. Truck Volume Variations by Hour of Day nearby Eau Claire, WI ................................... A-5 Figure A-11. Truck Speed Distributions nearby Tomah, WI ................................................................. A-6 Figure A-12. Average Speed Variations by Hour of Day nearby Tomah, WI ....................................... A-6 Figure A-13. Truck Volume Variations by Hour of Day nearby Tomah, WI ........................................ A-7 Figure A-14. Truck Speed Distributions nearby Madison, WI ............................................................... A-7 Figure A-15. Average Speed Variations by Hour of Day nearby Madison, WI ..................................... A-8 Figure A-16. Truck Volume Variations by Hour of Day nearby Madison, WI ...................................... A-8

Figure A-17. Truck Speed Distributions nearby Rockford, IL ............................................................... A-9 Figure A-18. Average Speed Variations by Hour of Day nearby Rockford, IL ..................................... A-9 Figure A-19. Truck Volume Variations by Hour of Day nearby Rockford, IL .................................... A-10 Figure A-20. Truck Speed Distributions nearby IL53 .......................................................................... A-10 Figure A-21. Average Speed Variations by Hour of Day nearby IL53 ................................................ A-11 Figure A-22. Truck Volume Variations by Hour of Day nearby IL53 ................................................. A-11 Figure B-1. Travel Time Index between Belvidere and Marengo Toll Plaza, Jan. 09 ........................... B-1 Figure B-2. Travel Time Index between South Beloit and Belvidere Toll Plaza, Jan. 09 ...................... B-1 Figure B-3. Travel Time Index between IL53 and O’Hare Airport, Mar. 09 ......................................... B-2 Figure B-4. Travel Time Index between Elgin Toll Plaza and IL53, Mar. 09 ........................................ B-2 Figure B-5. Travel Time Index between Marengo and Elgin Toll Plaza, Mar. 09 ................................. B-3 Figure B-6. Travel Time Index between Belvidere and Marengo Toll Plaza, Mar. 09 .......................... B-3 Figure B-7. Travel Time Index between South Beloit and Belvidere Toll Plaza, Mar. 09 .................... B-4 Figure B-8. Travel Time Index between IL53 and O’Hare Airport, Oct. 08 .......................................... B-4 Figure B-9. Travel Time Index between Elgin Toll Plaza and IL53, Oct. 08 ........................................ B-5 Figure B-10. Travel Time Index between Marengo and Elgin Toll Plaza, Oct. 08 ................................ B-5 Figure B-11. Travel Time Index between Belvidere and Marengo Toll Plaza, Oct. 08 ......................... B-6 Figure B-12. Travel Time Index between South Beloit and Belvidere Toll Plaza, Oct. 08 ................... B-6 Figure B-13. Travel Time Index between IL53 and O’Hare Airport, Jul. 08 ......................................... B-7 Figure B-14. Travel Time Index between Elgin Toll Plaza and IL53, Jul. 08 ........................................ B-7 Figure B-15. Travel Time Index between Marengo and Elgin Toll Plaza, Jul. 08 ................................. B-8 Figure B-16. Travel Time Index between Belvidere and Marengo Toll Plaza, Jul. 08 .......................... B-8 Figure B-17. Travel Time Index between South Beloit and Belvidere Toll Plaza, Jul. 08 ................... B-9 Figure B-18.. Buffer Time Index along I-94/I-90 Corridor in Jul. 2008 ................................................ B-9 Figure B-19.. Buffer Time Index along I-94/I-90 Corridor in Oct. 2008 ............................................. B-10 Figure B-20.. Buffer Time Index at MM18 nearby St. Paul in Apr. 09 ............................................... B-10 Figure B-21.. Buffer Time Index at MM24 nearby Hudson in Apr. 09 ............................................... B-11 Figure B-22.. Buffer Time Index at MM96 nearby Eau Claire in Apr. 09 ........................................... B-11 Figure B-23.. Buffer Time Index at MM171 nearby Tomah in Apr. 09 ............................................... B-12 Figure B-24.. Buffer Time Index at MM264 nearby Madison in Apr. 09 ............................................ B-12 Figure B-25.. Buffer Time Index at MM333 nearby Rockford in Apr. 09 ........................................... B-13 Figure B-26. Buffer Time Index at MM393 West of O’Hare Airport in Apr. 09 ............................... B-13 Figure B-27.. Buffer Speed Index in Jul. 2008 ..................................................................................... B-14 Figure B-28.. Buffer Speed Index in Oct. 2008 .................................................................................... B-14 Figure B-29.. Buffer Speed Index in Jan. 2009 .................................................................................... B-15 Figure B-30.. Buffer Speed Index in Apr. 2009 ................................................................................... B-15 Figure C-1. Distributions of Trip Destinations (May & Jun. 2008) ....................................................... C-1 Figure C-2. Distributions of Trip Destinations (Jul. & Aug. 2008) ........................................................ C-1 Figure C-3. Distributions of Trip Destinations (Sep. & Oct. 2008) ....................................................... C-2 Figure C-4. Distributions of Trip Destinations (Nov. & Dec. 2008) ...................................................... C-2 Figure C-5. Distributions of Trip Destinations (Jan. & Feb. 2009) ........................................................ C-3 Figure D-1. I-94 EB Average Truck Speed vs. General Traffic Speed (May 2008) .............................. D-1 Figure D-2. I-94 WB Average Truck Speed vs. General Traffic Speed (May 2008) ............................. D-1 Figure D-3. I-94 EB Average Truck Speed vs. General Traffic Speed (Sep. 2008) .............................. D-2 Figure D-4. I-94 WB Average Truck Speed vs. General Traffic Speed (Sep. 2008) ............................. D-2 Figure D-5. I-94 EB Average Truck Speed vs. General Traffic Speed (Jan. 2009) ............................... D-3 Figure D-6. I-94 WB Average Truck Speed vs. General Traffic Speed (Jan. 2009) .............................. D-3 Figure D-7. I-90 EB Average Truck Speed vs. General Traffic Speed (May 2008) .............................. D-4

Figure D-8. I-90 WB Average Truck Speed vs. General Traffic Speed (May 2008) ............................. D-4 Figure D-9. I-90 EB Average Truck Speed vs. General Traffic Speed (Sep. 2008) .............................. D-5 Figure D-10. I-90 WB Average Truck Speed vs. General Traffic Speed (Sep. 2008) ........................... D-5 Figure D-11. I-90 EB Average Truck Speed vs. General Traffic Speed (Jan. 2009) ............................. D-6 Figure D-12. I-90 WB Average Truck Speed vs. General Traffic Speed (Jan. 2009) ............................ D-6 Figure D-13. I-94 EB Annual Median Truck Speed vs. General Traffic Speed ..................................... D-7 Figure D-14. I-94 WB Annual Median Truck Speed vs. General Traffic Speed ................................... D-7 Figure E-1. Truck Stop Counts at Location (Jul. 2008), N=82,042 ........................................................ E-1 Figure E-2. Truck Stop Counts at Location (Oct. 2008), N=77,748 ....................................................... E-1 Figure E-3 Truck Stop Counts at Location (Jan. 2009), N=65,070 ......................................................... E-2 Figure E-4. Distribution of Truck Stop Duration in Jan. 2009 ................................................................ E-2 Figure F-1. Hourly Truck Volume at South Beloit .................................................................................. F-1 Figure F-2. Hourly Truck Volume at Marengo/Belvidere ....................................................................... F-1 Figure F-3. Hourly Truck Volume at Elgin ............................................................................................. F-2 Figure F-4. Hourly Truck Volume at River Road/Devon Avenue .......................................................... F-2
LIST OF TABLES Table 1. List of I-90 Toll Plazas ............................................................................................................... 16 Table 2. Classification of I-90 Rate Tier .................................................................................................. 17

EXECUTIVE SUMMARY One of the key measures of freight performance on interstate highways in the United States is travel time reliability. The Federal Highway Administration (FHWA) has established a partnership with the American Transportation Research Institute (ATRI) to measure average travel rates for over 25 freight-significant corridors since 2002. Currently, the developed Freight Performance Measure (FPM) system from ATRI has the capability to derive average truck travel speed and travel time on all national highways. I-94/I-90 is a key freight corridor for goods transportation between Minneapolis and Chicago in the Upper Midwest. There are increasing volumes of freight being shipped to Chicago then sent by air through Chicago O’Hare Airport rather than being sent by air through the Minneapolis-St. Paul Airport. The Minnesota Department of Transportation (Mn/DOT) freight office is interested in using the FPM data to study the growing freight activities along I-94/I-90 from the Twin Cities to Chicago. This project utilizes the truck location data obtained from ATRI to study the freight activities along I-94/I-90. This report documents the analysis results of heavy trucks (mostly class 8 trucks over 20,000 lbs.) traveling along the I-94/I-90 corridor. Truck location data collected by private data providers from May 2008 to April 2009 were obtained from ATRI. General traffic data along the corridor were also acquired from corresponding state DOTs for comparison. Data analysis methodology and data processing procedures were developed. Travel Time Index (TTI), defined as the peak travel time over the free flow travel time, is proposed to measure the level of congestion and Buffer Time Index (BTI), defined as the difference between the 95th percentile of travel time and average travel time divided by the average travel time, is used to measure the travel time reliability along the freight corridor. Truck speed, speed variation, truck volume variation, distribution of destinations, stop location, and rest duration derived from each individual trip were processed and analyzed using statistical software in this study. The derived travel time performance index from Automatic Vehicle Location (AVL) and cellular/wireless communications technologies implemented on trucking fleets can support freight operation and management on the national surface transportation system. Current Freight Analysis Framework [14] provides freight data based on the Commodity Flow Survey (CFS) conducted every five years (2002, 2007), from data collected by state DOTs and other proprietary data sources. Travel time, speed and truck volume derived from the FPM system have the potential to provide timely updates to the FAF at city or county level. Freight performance was evaluated and analyzed to compare truck travel time with respect to duration, reliability, and seasonal variations. Results from FPM analysis can timely support freight transportation planning and decision-making. Potential applications of the FPM data analyses include measuring truck travel time reliability and impact of congestion on cost of freight, identifying truck stop/parking facility needs, and studying the impact of traffic volume with respect to speed gap difference between cars and trucks. In addition to CFS and FAF data, there is a need to develop national standard to report freight performance measure more regularly.

Additional graphs of freight performance measures such as truck travel time reliability and level of congestion along the corridor, such as comparing by location, month of year and time of day, were included in the appendices.

1. INTRODUCTION One of the key measures of freight performance along interstate corridors in the United States is travel time reliability. The FHWA has established a partnership with the American Transportation Research Institute (ATRI) to measure average truck travel speed for over 25 freight-significant corridors since 2002. Analyzing truck speed, volume and travel time by location can potentially help identify network bottlenecks and impediments, variations of seasonal flow changes, and calibrate freight model to support freight delivery and planning. The derived vehicle speed and travel time from satellite-based location system and terrestrial wireless system used by the trucking industry can support freight planning and operation on the surface transportation system. Analysis results of heavy trucks (mostly class 8 trucks) traveling along the I-94/I-90 corridor between St. Paul and Chicago were documented in this report. Truck data collected by private data providers from May 2008 to April 2009 were obtained from the ATRI. General traffic data along the corridor were also acquired from corresponding state DOTs. Data analysis methodology and data processing procedures were developed. Travel Time Index (TTI) is proposed to measure the level of congestion and Buffer Time Index (BTI) is used to measure the travel time reliability along the freight corridor. Truck speed, speed variation, truck volume variation, distribution of destinations, stop location, and rest duration derived from each individual trip were processed and analyzed using statistical software R [15] in this study. Detailed performance measures such as truck travel time reliability and level of congestion along the corridor, such as comparing by location, month of year and time of day, were included in the appendices.
1.1 Background
In 2005, the Minnesota Department of Transportation (Mn/DOT) adopted its statewide freight plan [1]. This multi-modal plan identifies significant freight system trends, needs and issues. The freight plan provides a framework that includes recommended freight policies, strategies and performance measures to guide decision-making on future investments. The interstate 94/90 corridor carries significant amounts of freight from Chicago to Minnesota for consumption and distribution throughout the Upper Midwest. Interstate 94/90 also carries Minnesota-produced freight destined for Chicago, as well as national and international markets. Consolidated air cargo from Minnesota moves on the highway to Chicago for access to dedicated international air freighter service. Major regional distribution centers along the corridor in Wisconsin also drive truck traffic in both directions. According to a report from the FHWA, the volume of heavy commercial vehicles (vehicles with at least two axles and at least six tires) traversing I-94/I-90 continues to increase. The Annual Average Daily Truck Traffic (AADTT) of heavy commercial vehicles along the I-94 segment between the Twin Cities and Chicago reached nearly 10,000 trucks per day in 1998. By 2020, the forecasted AADTT will increase to almost 20,000 trucks per day as illustrated in Figure 1.
1

Figure 1. Forecasted Average Annual Daily Truck Traffic: 2020[16]
Recurring and non-recurring traffic congestions have an adverse effect on personal and commercial vehicle mobility. With the advent of “just-in-time” or “almost-just-in-time” deliveries, warehousing inventory has been reduced significantly or shifted from the manufacturer to a transportation intermediary. However, as the supply chain continues to be examined for potential cost control, increasing traffic congestion, with attendant freight delays, and/or unreliable deliveries, serves to increase overall transportation costs and decrease shipper competitiveness.
1.2 Research Objectives
The availability and accuracy of freight data frequently drives what is measured, rather than identifying which freight system attributes need to be measured and benchmarked in order to track performance. With the massive truck data gathered by FHWA and ATRI, processed freight performance data offers tremendous opportunities for developing new and relevant measures related to truck performance on highways and overall traffic mobility, including congestion and capacity bottlenecks [17]. FPM data from ATRI can provide continuous trip information of trucks needed to study the variations of freight traffic, travel time reliability, stop location, congestion trend, bottlenecks, etc. We obtained 12-month of truck AVL data from ATRI to analyze freight activity along the I-94/I-90 corridor and compare variations of truck speed and travel time reliability in order to identify potential freight bottleneck and forecast future freight demand. We hope the analyzed results can help identify the needs of local highway infrastructure improvement to sustain growing freight demand in the future.
1.3 Literature Review
McCormack and Hallenbeck [2] used 25 portable data collection GPSs with 1-second polling rate to collect truck data for measuring freight movements along corridors in Washington State. The study concluded that GPS data can be collected cost effectively and can provide an indication of roadway performance. Based on processed truck speed data, a route model
2

including analyses of truck travel time, delay and reliability can be developed to better understand current freight network performance, freight origin to destination flows, and to study possible solutions to future freight demand growth [3]. Initial phase of the FPM initiatives is to measure average travel rates on five freight-significant corridors [4]. ATRI recently analyzed the severity of 30 key freight bottlenecks in the US interstate system [5]. Freight bottlenecks occurred at highway interchanges were analyzed using the freight congestion value. Possible causes for the bottlenecks may include roadway geometry (e.g., grade, curvature, and sight distance), capacity (number of lanes), toll booths, required lane of travel for trucks, speed limit, weather, and truck volume vs. general traffic volume. Minnesota State DOT (Mn/DOT) recently completed a study on truck parking analysis. The goal was to develop the information necessary to support decisions regarding future approaches to the truck parking issues in Minnesota [6]. Short and Murray demonstrated the capability of utilizing FPM data for truck parking analysis [7]. Another application is to utilize the FPM data to evaluate the travel time and delay at border crossing. FHWA conducted a study to address the need to reduce the hours of delay for commercial motor vehicles passing through ports-of-entry [8]. However, manually truck data collection at border crossing plaza [9] is labor intensive and expensive. Application tools built upon the FPM system can be useful to assist freight decision support, operation and planning. For example, processed truck AVL data can generate freight average travel time and truck volumes that can utilized as inputs to a mesoscopic freight simulation model for comparison between different freight policies. The derived FPM data can be utilized to enhance local, regional and national freight planning and support decision making.
3

4

2. DATA PROCESSING METHODOLOGY As identified in the previous report on FPM system evaluation [10], data joining, storage, and segmentation methodologies can be improved to further enhance the FPM data processing efficiency. Currently ATRI received over 2 billion data points each year. The truck AVL data is expected to be doubled in couple years. The effectiveness and efficiency of FPM system becomes critical when processing all National Highway Systems (NHS) at larger scale and providing web-based query applications. Although, enhancement can be investigated by using an objected-oriented data structure to reference different trip speed to each 3-mile segment without the tedious segmentation and data table storage currently practices, we will focus on the usage of the FPM data for monitoring surface freight performance rather than improvement of the FPM data processing system.
2.1 Data Processing Procedures
Truck GPS data from May 2008 to April 2009 were obtained from the ATRI. A route geo-spatial database of I-94/I-90 from the Twin Cities to Chicago was created using the ArcGIS[18] software. The monthly raw truck GPS data were imported into the ArcGIS software to snap the GPS latitude-longitude points to nearest route and locate linear referencing measurement and distance. Individual vehicle trip speed was computed by grouping vehicle ID and sorting the location data by time. Average speed of a network segment is calculated by dividing the linear distance difference over time difference between two consecutive GPS data points within the same trip. The data processing flow chart is displayed in Figure 2. Processed data does not meet the speed filtering parameters are set aside for truck stops and stop durations analysis. A data processing and analysis program, as shown in Figure 3, was developed to interface with the database server and visualized the analyzed data systematically.
5

Figure 2. Data Processing Flow Chart
Figure 3. Data Processing and Analysis Interface
6

2.2 Data Analysis
Truck speed variations by location and by hour of day were analyzed. Speed and volume variations at specified mile mark location were analyzed to compare the changes over the hour of day. Computed truck speed versus the general traffic speed collected by state DOTs were compared to evaluate the speed difference between trucks and passenger vehicles. Raw truck GPS data did not pass through the data quality filter were trucks that might stop for service or rest. Truck stop locations along the I-94/I-90 corridor and their stop durations can be derived to better understand truck parking activity and service availability. The following analyses were performed and discussed in section 3.
• Monthly speed average and speed deviation along the corridor • Vehicle speed and volume variation at selected location by time of the day • Travel time and buffer time performance measures • Distribution of trip destinations • Speed gap difference by comparing truck speed vs. general traffic speed • Truck stop locations and rest durations
7

8

9
3. RESULTS OF DATA ANALYSIS Processed data were analyzed using customized application developed by the author and open-source statistics software. Results of the data analysis were discussed as follows.
3.1 Truck Speed Analysis along I-94/I-90 Corridor
Average truck travel speed along I-94/I-90 in both directions in April 2009 from 6 to 9 AM was plotted in Figure 4. Between St. Paul and Madison, average speed in eastbound is generally higher than that in westbound. The average speeds in both east and westbound directions are relatively close between Madison and Chicago. The average truck speed declines averagely from 55 to 40 MPH from Madison to Chicago. Average truck travel speed with the I-90 toll highway segment is relatively lower than speed in non-toll highway segment. The economic impact of freight cost and environmental impact of air quality caused by truck delay and congestion can be estimated. Figure 5 illustrated the corresponding standard deviation of truck speed along the I-94/I-90 corridor. The westbound traffic has lower speed deviation than the variations in eastbound between St. Paul and Madison. The standard deviations of truck speed increases (from 16 to 21 MPH) from South Beloit plaza toward Chicago on I-90 toll highway. Average daily truck traveling speeds of April 2009 in both directions were visualized using ArcGIS software as shown in Figure 6 and 7, respectively. The average truck speed dips slightly nearby Hudson, Tomah, Madison, and Beloit area. The average speed drops further (below 35 MPH) as trucks moving toward Chicago area. The speed drops in the I-90 toll highway segment is caused by toll booths. For example, average speed over 60 minutes will be significantly decreased if a vehicle is traveling 0-1 mph for 5 minutes while waiting at a toll booth. Similar average speed profile was observed from the analyzed results in the other months in 2008 and 2009. More figures of speed analysis along the corridor are included in Appendix A. According to the analysis results, truck average traveling speed in rural highway is relatively higher than the speed in urban and suburban highways. However, speed variation at rural area is higher than the deviations in urban and suburban area. Truck traveling in the suburban and urban highway has lower average speed and relatively lower speed deviations. Later, in Section 3.3, we will introduce and discuss the travel time reliability and level of congestion along the corridor.

Figure 4. Average Travel Speed along I-94/I-90
Figure 5. Standard Deviation of Travel Speed along I-94/I-90
10

Figure 6. Visualization of EB Average Speed in April 2009 Using GIS Software (Apr. 09)
Figure 7. Visualization of WB Average Speed in April 2009 Using GIS Software (Apr. 09)
11

12
3.2 Truck Speed and Volume Analysis by Location
Variations of truck speed and volume at a particular location within each 3-mile segment from May 2008 to April 2009 were analyzed in this study. Couple locations were presented and discussed in this section as examples for the analysis. More figures of speed and volume analysis by location are included in Appendix A.
3.2.1 St. Paul, MN Truck speed distributions in both directions at mile mark east of St. Paul were plotted in Figure 8. Both distributions are left skewed with mean speed about 8.2 (WB)/10.8 (EB) MPH lower than the median speed. The average speeds are 46.9 and 46.4 MPH in EB and WB. And the median speeds are 57.7 and 54.6 MPH in EB and WB, respectively. Both histograms indicated bi-modal distributions with peak frequencies at 10 and 60 MPH. Average speed by hour of day based on the 12-month of truck data were plotted in Figure 9 for both directions. The average truck speed in EB is mostly lower than the speed in WB before 11 AM as illustrated in Figure 9. From 11AM to 9PM, the EB truck speed exceeds the WB speed up to 5 MPH. The truck data from ATRI includes only a portion of actual trucking activities along I-94/I-90. We do not know the exact percentage of trucking activities were collected in the ATRI dataset. Inferring actual truck volume from the ATRI dataset could be misleading. We decided to analyze the volume variation by comparing hourly truck volume to the annual truck volume at each location. Figure 10 illustrated the hour by hour distribution of trucks passing through mile marker 18 with respective to the annual volumes from the 12-month dataset. At this location, most of truck traffic occurs in the afternoon with EB peak volume of 8.4% at 7PM and WB peak volume of 7% around 4PM.
Figure 8. Truck Speed Distributions nearby St. Paul

Figure 9. Average Speed Variations by Hour of Day nearby St. Paul
Figure 10. Truck Volume Variations by Hour of Day nearby St. Paul
3.2.2 O’Hare Airport, IL Truck speed distributions in both directions at mile mark west of O’Hare airport were plotted in Figure 11. The average speeds are 28.5 and 32.7 MPH in EB and WB. And the median speeds are 23.3 and 32.2 MPH in EB and WB, respectively. Both histograms indicated kind of bi-modal distributions with peak frequencies at 10 and 55 MPH. The histogram indicated a significant amount of truck (over 30%) traveling under the speed of 20 MPH nearby O’Hare airport.
13

14
Average speed by hour of day based on the 12-month of truck data were plotted in Figure 12 for both directions. Speed profile in each direction is similar to each other. The average truck speed in EB is mostly lower than the speed in WB. During the AM peak hours, average truck speeds in both EB and WB are around 40 MPH. However, the average truck speed declines from 40 MPH (at 10AM) to 25 MPH (at 1PM). The truck speed increases in the early afternoon to about 32 MPH and drops again after PM peak hours. Figure 13 illustrated the hour by hour distribution of trucks passing through mile marker 402 with respective to the annual volumes from the 12-month dataset. At this location, most of truck traffic occurs in the afternoon with EB peak volume of 7.5% of daily truck volume at 5PM and WB peak volume of 7.4% of daily truck volume around 8PM.
Figure 11. Truck Speed Distributions nearby O’Hare Airport

Figure 12. Average Speed Variations by Hour of Day nearby O’Hare Airport
Figure 13. Truck Volume Variations by Hour of Day nearby O’Hare Airport
3.2.3 Truck Volume on I-90 Toll Highway Traffic volumes on I-90 were collected by Illinois State Toll Highway Authority (ISTHA) at each toll plaza. Location and mile mark of each toll plaza in each direction is listed in Table 1. Vehicle classification and traffic volumes were collected according to the rate tier used by ISTHA as listed in Table 2. Trucks with 5 or more axles are classified as tier 4. Although, there may be commercial trucks in rate tier 3, we only consider heavy trucks in rate tier 4 in this study.
15

Figure 14 and 15 illustrated the variations of truck volumes nearby each toll plaza in both directions. Both figures display similar profile of truck volumes in 4 different months with consistent offset between from 2008 to 2009. Average truck volume nearby South Beloit area ranges from 5,600 to 6,800 vehicles per day in both directions. In eastbound, truck volumes drop down by about 2,000 vehicles per day to around 3,850~4,700 at Marengo, which implied that many eastbound trucks exiting between South Beloit and Marengo plaza. Truck daily volumes increase by about 1,000 vehicles at Elgin plaza which indicated that there are many trucks enter between the Marengo and Elgin plaza in eastbound. Truck volume decreases to around 2,000 vehicles per day at River road in the EB direction. Truck volume in the WB direction at Devon Ave. ranges from 3,700 to 4,500 vehicles per day. The WB volume surges to around 4,800 and 5,800 vehicles per day at Elgin road then drops down to around 3,800 and 4,500 vehicles per day at Belvidere due to stops or other trucking activities between Elgin and Belvidere plaza. Tuck volume increases up to around 5,800 and 6,800 in the WB direction at South Beloit plaza. Generally, the average truck daily volume on I-90 in both directions decreases by about 1,000 trucks between 2008 (Jul. and Oct.) and 2009 (Jan. and Apr.). This is probably due to the change in economic conditions between 2008 and 2009. According to ISTHA, there has seen a substantial decrease in truck traffic. Additional hourly truck volume analysis at each I-90 toll plaza is included in Appendix F.
Direction I‐90 Mile Mark Mile Mark* Plaza Name
EB 75.5 327 South Beloit Toll Plaza EB 41 361.5 Marengo‐Hampshire Toll Plaza EB 25 377.5 Elgin Toll Plaza
EB 0.5 402 River Road Toll Plaza
WB 2 400.5 Devon Avenue Toll Plaza WB 25 377.5 Elgin Toll Plaza WB 55.5 347 Belvidere Toll Plaza
WB 75.5 327 South Beloit Toll Plaza
Mile Mark*: Mile mark referenced in this study Table 1. List of I-90 Toll Plazas
16

Table 2. Classification of I-90 Rate Tier
Figure 14. I-90 Average Daily Truck Volumes (Eastbound) – Tier Rate 4
17

Figure 15. I-90 Average Daily Truck Volumes (Westbound) – Tier Rate 4
3.3 Performance Index
The Travel Time Index (TTI) is introduced to measure level of congestion as defined in Equation (1). TTI is the ratio of peak period travel time to free flow travel time. The free flow travel time is computed as the minimum travel time within a given travel distance during a day. The TTI measure represents the average amount of time it requires to travel within a highway segment with respect to free-flow travel speed. For example, a TTI of 1.2 indicates a 30-minute free-flow trip will take 36 minutes at a given time of day, a six-minute (20%) travel time increase. The Buffer Time Index (BTI), as defined in Equation (2), measures the travel time reliability by comparing the 95th percentile travel time to average travel time. In addition to current Travel Time Index (TTI) and Buffer Time Index (BTI), segment level travel time model can be developed based on the empirical FPM data to study the travel time reliability and delay for any given origin and destination pair in a network. By incorporating the demand model, segment travel time model and regional O-D information, a freight simulation model can potentially be developed to study the impact of different management strategy (for example, truck only lane) or other freight policy. The FPM system provides rich freight data resources for various freight research and applications. The resulting effort of FPM study and data analysis will lead to significant improvement in freight management, operation, planning and decision-support for local, regional, and national freight agencies.
18

Eq. (1)
Eq. (2)
The travel time index and buffer time index were measured along the I-94/I-90 corridor and discussed as follows to compare the level of congestion and the travel time reliability at different location and time of day.
3.3.1 Travel Time Index (TTI) The travel time index between IL-53 and O’Hare airport in Jan. 2009 was plotted against the free flow travel time as shown in Figure 16. In average, the primary peak index (congestion) occurred around 8AM in eastbound direction with travel time 2.2 times of the free flow travel time. In westbound, the peak congestion occurred at 5PM which took almost twice the free flow travel time to travel from O’Hare airport to IL-53. There is also secondary peak value around 5PM in eastbound (9AM in westbound), but the congestion level is less severe (TTI value around 1.45 and 1.3 respectively). Similar pattern was observed between the Elgin toll plaza and IL-53 as shown in Figure 17. The EB traffic averagely took twice the free flow travel time at 8 AM to travel from Elgin plaza to I-290. The WB traffic averagely spent over 1.8 times of the free flow travel time at 5 PM to travel from I-290 to Elgin plaza. The travel time index in Figure 18 indicated that there is less congestion during the AM and PM peak hours between the Marengo and Elgin toll plaza as compared to the link segment closer to Chicago metro area. The EB traffic averagely took over 1.5 times of the free flow travel time at 8 AM to travel from Marengo to Elgin plaza. The average WB travel time in this segment ranges from 1.1 to 1.3 times of the free flow travel time as shown in Figure 18. Additional travel time index at other locations and month of year are included in Appendix B.
19

Figure 16. Travel Time Index between IL53 and O’Hare Airport, Jan. 09
Figure 17. Travel Time Index between Elgin Toll Plaza and IL53, Jan. 09
20

Figure 18. Travel Time Index between Marengo and Elgin Toll Plaza, Jan. 09
3.3.2 Buffer Time Index (BTI) As defined in Equation (2), a smaller buffer time index (smaller variability) represents higher trip travel reliability. Truck BTI in Jan. 2009 along the I-94/I-90 corridor, as displayed in Figure 19, indicated that at 95 percentile of travel time, it averagely takes 2.5 to 3 times of the average travel time within a 3-mile segment between mile marker 18 (St. Paul) and 378 (Elgin toll plaza). The BTI index nearby west of the O’Hare airport (MM378Z~402) is around 2, which means the 95 percentile travel time in this area is more reliable than the rest of corridor even though its average speed is relatively lower as shown in Figure A.1 and A.3.
Figure 19. Buffer Time Index along I-94/I-90 Corridor in Jan. 2009
21
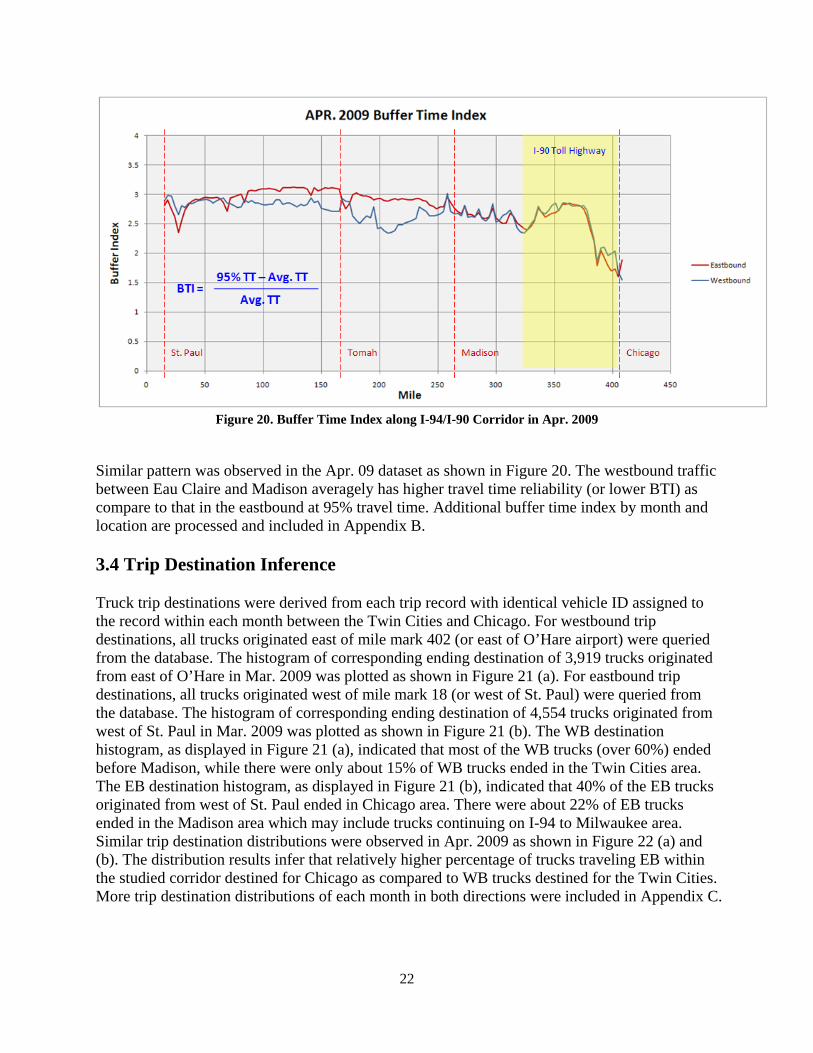
Figure 20. Buffer Time Index along I-94/I-90 Corridor in Apr. 2009
Similar pattern was observed in the Apr. 09 dataset as shown in Figure 20. The westbound traffic between Eau Claire and Madison averagely has higher travel time reliability (or lower BTI) as compare to that in the eastbound at 95% travel time. Additional buffer time index by month and location are processed and included in Appendix B.
3.4 Trip Destination Inference
Truck trip destinations were derived from each trip record with identical vehicle ID assigned to the record within each month between the Twin Cities and Chicago. For westbound trip destinations, all trucks originated east of mile mark 402 (or east of O’Hare airport) were queried from the database. The histogram of corresponding ending destination of 3,919 trucks originated from east of O’Hare in Mar. 2009 was plotted as shown in Figure 21 (a). For eastbound trip destinations, all trucks originated west of mile mark 18 (or west of St. Paul) were queried from the database. The histogram of corresponding ending destination of 4,554 trucks originated from west of St. Paul in Mar. 2009 was plotted as shown in Figure 21 (b). The WB destination histogram, as displayed in Figure 21 (a), indicated that most of the WB trucks (over 60%) ended before Madison, while there were only about 15% of WB trucks ended in the Twin Cities area. The EB destination histogram, as displayed in Figure 21 (b), indicated that 40% of the EB trucks originated from west of St. Paul ended in Chicago area. There were about 22% of EB trucks ended in the Madison area which may include trucks continuing on I-94 to Milwaukee area. Similar trip destination distributions were observed in Apr. 2009 as shown in Figure 22 (a) and (b). The distribution results infer that relatively higher percentage of trucks traveling EB within the studied corridor destined for Chicago as compared to WB trucks destined for the Twin Cities. More trip destination distributions of each month in both directions were included in Appendix C.
22

Figure 21. Distributions of Trip Destinations (Mar. 2009)
Figure 22. Distributions of Trip Destinations (Apr. 2009)
3.5 Truck vs. General Traffic
The Ministry of Transportation and Infrastructure of British Columbia, Canada, did a study on truck speed analysis using GPS-based technology in 2004 and 2005 [11]. The results indicated that the average speed of heavy long-distance trucks on the provincial primary highway system was about 71 km/h (44 MPH) in 2004 and 69 km/h (43 MPH) in 2005, respectively. The average posted speed limit was 88 km/h (55 MPH). Averagely, heavy trucks travel 18 km/h (11 MPH) below the posted speed in British Columbia. Garber et al. [12] and Chen et al. [13] studied the safety impact of speed differential between trucks and passenger cars. The average truck speed
23

and general traffic speed along the studied freight corridor are compared and discussed in this section. General traffic data along I-94 were obtained from the Mn/DOT using the online traffic data extract tool [19] between St. Paul and Hudson. General traffic data along I-90 in Illinois between South Beloit toll plaza and O’Hare airport were obtained from the Illinois State Toll Highway Authority (ISTHA) [20] and Gary-Chicago-Milwaukee Corridor Transportation Information [21].
3.5.1 I-94 between St. Paul and Hudson The annual average truck speed and general traffic speed on I-94 eastbound from St. Paul, MN to Hudson, WI were plotted in Figure 23. Speed data from 6AM to 9PM were aggregate in 3-hour interval for trucks and all vehicles. The posted speed limited is 65 MPH. The average truck speed is around 45 MPH with slightly decrease to 40 MPH toward the Hudson area. Free flow speed data of all traffic collected from Mn/DOT traffic detectors indicated an average speed of 58 MPH at US52 east of St. Paul. The average free flow speed increased to around 75 MPH between highway 694 and TH-95. Average free flow speed increases up to 78 MPH nearby eastern state border. Averagely, there is a speed difference of over 20 MPH between the average truck speed and general traffic speed on I-94 EB.
Figure 23. EB Truck Speed vs. General Traffic Speed from St. Paul to Hudson
In the westbound, the average free flow speed of general traffic ranges between 58 and 78 MPH on I-94 as plotted in Figure 24, while the average truck speed varies between 40 and 50 MPH. Annual average speed difference between trucks and all vehicles is around 25 to 30 MPH from 6AM to 9PM. Additional analysis on truck speed vs. all traffic speed on I-94 are included in Appendix D. Median truck speed compared with free flow speed is included in Figure D.13 & 14.
24

Figure 24. WB Truck Speed vs. General Traffic Speed from Hudson to St. Paul
3.5.2 I-90 between South Beloit and O’Hare The annual average truck speed and general traffic speed on I-90 eastbound from South Beloit to O’Hare airport were plotted in Figure 25. Speed data from 6AM to 9PM were aggregate in 3-hour interval for both truck and all vehicles. The posted truck speed limited is 55 MPH on I-90. Other passenger vehicle speed limit is 65 MPH west of Marengo and 55 MPH east of Marengo. The annual average truck speed is around 45 MPH with significant decrease after Elgin plaza (MM 377) toward the Chicago area to 30 MPH. Speed of all traffic from ISTHA loop detectors indicated an increasing average speed from 55 MPH nearby South Beloit to 65 MPH toward Marengo toll plaza. Most general traffic average speed drops down to 60 MPH from Marengo toll plaza toward O’Hare area except the annual average speed during 6 AM and 9AM peak hours. All traffic speed between 6 and 9AM from Marengo to O’Hare drops from 65 MPH to 50 MPH as illustrated in Figure 25. The average speed differences between the average truck speed and general traffic speed on I-90 EB ranges from 10 to 30 MPH. The EB speed differential increase as the traffic moving toward O’Hare airport. During peak hours along I-90, the average speed may vary quite a bit due to a combination of congestion, construction, weather, etc. We observed the similar pattern in the WB on I-90. The average speed of general traffic ranges between 55 and 65 MPH on I-90 except the speed from O’Hare to Marengo toll plaza during 6 to 9AM peak hours. As displayed in Figure 26, the average truck speed varies between 40 and 45 MPH with larger variation during different time of day nearby O’Hare airport. Annual average speed difference between trucks and all vehicles is around 10 to 25 MPH from 6AM to 9PM. The speed difference between trucks and all traffic decreases as the traffic moves toward South
25

Beloit. Additional analyses on truck speed vs. all traffic speed on I-90 were included in Appendix D.
Figure 25. EB Truck Speed vs. General Traffic Speed from South Beloit to O’Hare
Figure 26. WB Truck Speed vs. General Traffic Speed from O’Hare to South Beloit
26

3.6 Truck Stops and Rest Durations
As illustrated in the data processing flow chart in Figure 2, truck trip data does not meet the speed filtering parameters are considered for truck stop location and stop duration analysis. Computed truck speed less than 5 MPH and traveling distance between two consecutive data points less than 100 meters is considered as stopped trucks in this analysis. We studied the distribution of truck stop locations and the corresponding rest duration in the following section.
3.6.1 Truck Stop Locations In April 2009, there were over 93,000 truck stops along the I-94/I-90 corridor in both EB and WB directions. Truck stop count at location along the corridor is visualized using ArcGIS software as shown in Figure 27. Within each 3-mile segment, number of truck stops ranging from 2001 to 4000 is plotted with a larger red dot. The medium orange dot represents 1001 to 2000 truck stops in both directions. According to the Apr. 2009 data shown in Figure 27, there are major truck stops nearby the Hudson, Tomah, Portage, Madison, Beloit and Chicago area. Similar stop location distribution was observed from the analysis results of different month. Additional analysis on truck stops in different month is included in Appendix E.
Twin Cities
Tomah
Madison
Beloit
Chicago
Eau Claire
Hudson
Belvidere
Mauston
Black River Falls
Portage
Figure 27. Truck Stop Counts at Location (Apr. 2009), N=93,686
27

3.6.2 Truck Stop Durations Histogram of truck stop durations in Apr. 2009 were analyzed and plotted in Figure 28. About 68% of the 144,212 truck stops were less than half hour and 28% of the truck stops were between 0.5 and 1.5 hours. The remaining 4% of truck stops were over 1.5 hours. The histogram indicated that most of the trucks do not take long stops. The travel time between the Twin Cities and Chicago is less than 8 hours which does not exceed the federal limit of 11 hours for truck drivers. It is possible that most of long distance (for example, coast to coast) truck drivers take longer rest (sleeping) outside the I-94/I-90 corridor. Additional histograms of truck stop durations in Jan. 2009 were included in Appendix E.
Figure 28. Distribution of Truck Stop Duration in Apr. 2009
28

4. POTENTIAL OF FPM DATA The FPM data collected from ATRI contains rich trip level information with relatively high data resolution as compared to the commodity flow survey conducted by FHWA every 5 years. Potentially, city or county level freight flow data can be estimated from freight model based on the FPM data. Regional O-D matrix derived directly from the truck AVL data may not be precise depending on the definition of origin and destination zones and trucking company privacy issue. For example, trucks often drop off or pick up at multiple locations as part of a trip. However, adjustments to the estimated O-D matrix can be made by including the Bureau of Transportation Statistics (BTS) and Commodity Flow Survey (CFS) data. Current FPM system does not include commodity value, freight type, tonnage and other information from the trucking companies for commodity flow analysis. With additional data verification and validation, FPM data can provide timely data updates to calibrate the FAF2 or future FAF3 system. Current FPM data contains the significant amount AVL data for class 7 and 8 vehicles in US. Currently, there are over 2 billion AVL/GPS data points each year and over 500,000 trucks in the database. The freight performance data processes currently focus on major interstate or freight significant corridors. Additional analysis on other interstate highways or primary state highways can be performed to support regional freight planning and operation. In addition to travel time reliability and congestion measures, other freight performance measure may be derived from the FPM data to support national freight initiatives. Truck speed and travel time derived from FPM are also useful in supporting freight scheduling and routing for trucking company. Even though current FPM does not include all truck AVL data, the average travel speed at each segment and volume counts can be modeled to forecast future demand when comparing to other data sources from state DOTs. Minnesota State DOT (Mn/DOT) recently completed a study on truck parking analysis [6]. The objective is to gather necessary information to support decisions regarding future approaches to the truck parking issues in Minnesota. Capability of utilizing FPM data for truck parking analysis has been demonstrated by Short et al. [7]. Limited amount of heavy truck data were collected at trip level in the past. Truck volume and limited speed information were only collected at selected wayside to estimate the annual average truck volume. With the advancement of satellite-based technology and installation of AVL system on most of trucking fleets, tremendous amount of truck location data were gathered at trip level with relatively high resolution. The FPM system can automate the data processing analysis systematically and thereafter generates performance measures that provide opportunities for potential freight applications such as estimation of commodity flow patterns for smaller geographic unit, timely updates of demand and variations of network flows by season.
29

30

5. APPLICATIONS AND RESEARCH OPPORTUNITIES FPM system has demonstrated its capability and potential to supplement or calibrate the current FAF database and to support local, interregional, and domestic freight planning and operation. Models and applications can be developed using the FPM data to enhance and improve current freight forecast model.
5.1 Travel Time Reliability and Prediction
Truck travel time, reliability, and delay at trip level in a region can be derived from the FPM data. Statistical models can be deployed to estimate origin to destination travel time by considering key parameters that have significant contribution to the travel time reliability. Freight travel time prediction model and analytical tools can be developed based on the empirical FPM data to support the next generation of FAF system. Travel time prediction model has the potential to support applications such as policy analysis, truck demand study, freight travel time simulation, identification and forecast of potential freight bottlenecks, possible causes of delay and pattern of seasonal variations.
5.2 Route Performance Measurement
FPM data collected at trip level can offer timely freight demand and travel pattern updates that could eliminate current FAF limitations. A statistical model based on the tremendous amount of empirical AVL data, weather, traffic information can be formulated to characterize a freight corridor. Based on the monitored route performance and estimated demand from the FPM, a route performance model can be used to forecast the system performance affected by the demand, flow pattern, location, traffic condition and other factors. A route based freight travel time model based on the FPM data will empower many applications to support freight planning along a freight corridor or within a network.
5.3 Future Research Topics
Current Travel Time Index (TTI) and Buffer Time Index (BTI) provide performance index at route level. Performance indices based on given origin and destination pair at regional level will provide more valuable measures for public and private agencies. FPM data has demonstrated its capability to develop freight travel time and prediction model to calibrate the current FAF database for freight planning and forecast. FPM data will provide opportunities for various research topics, including:
• Freight bottleneck analysis • Truck travel time delay and reliability based on given origin and destination • Estimation of freight transportation cost • Freight simulation model for scheduling, planning and decision support • Border crossing activity (delay and reliability)
31

• Analysis of regional and national freight policies • Impact and benefit of truck-only lane on freight significant corridors
32

6. SUMMARY AND CONCLUSIONS FHWA has established a partnership with the American Transportation Research Institute (ATRI) to measure average truck travel speed for over 25 freight-significant corridors since 2002. We obtained one year of truck GPS/AVL location data along the I-94/I-90 corridor from ATRI and general traffic data from Mn/DOT and Illinois State Toll Highway Authority (ISTHA). A data processing methodology was developed to process massive truck data and produce measures for freight performance analysis. Analyses, such as truck speed, speed variation, truck volume variation, truck destination inference, stop location and rest duration derived from individual trip, were processed in this study. Performance measures including truck travel time reliability and level of congestion along the corridor were included and discussed. Comparison of performance measures by location, month of year and time of day were also analyzed and discussed. To ensure the accuracy of the computed truck traveling speed and flow data, it is helpful to compare and validate the derived performance measures with general traffic data collected by the state DOTs. Particularly in urban area, satellite receptions may be limited and traffic congestions are more common. This freight analysis on heavy trucks can support surface freight planner in identifying freight bottleneck, truck stop locations, destinations, infrastructure improvement needs, and operational strategy to promote efficient freight movement. Current Travel Time Index (TTI) and Buffer Time Index (BTI) provide important performance indices at route or link level. However, performance indices based on given origin and destination region, i.e., from user’s perspective, will provide more valuable measures to public and private agencies for freight scheduling, planning and operation. Current Freight Analysis Framework (FAF) provides freight data based on the Commodity Flow Survey (CFS) conducted every five years with commercial vehicle data collected from state DOTs and other proprietary data sources. Freight demand and travel time resulting from the FPM calculations can potentially provide timely updates and calibrations to the FAF at regional or interregional level.
33

34

35
REFERENCES [1] Minnesota Department of Transportation, (2005) Minnesota Statewide Freight Plan,
http://www.dot.state.mn.us/ofrw/PDF/MN_SFP_Final_Report_05.pdf, accessed July 2009. [2] E. McCormack and M.E. Hallenbeck, (2006) “ITS Devices used to Collect Truck Data for
Performance Benchmarks”, Transportation Research Record: Journal of the Transportation Research Board, No. 1957, TRB, National Research Council, Washington, D.C., pp. 43-50.
[3] J. Short and C. Jones, (2008) “Utilization of Wireless Truck Position Data to Estimate Transportation System Demand”, 10th International Conference on Applications of Advanced Technologies in Transportation, Athens, Greece.
[4] C. Jones, D. Murray, and J. Short, (2005) “Methods of Travel Time Measurement in Freight-Significant Corridors”, Transportation Research Board 84th annual meeting, Compendium of Papers, Washington, D.C., January 2005, http://www.atri-online.org/research/results/Freight%20Performance%20Measures%20TRB%20for%20atri-online.pdf, accessed June 2009.
[5] J. Short, R. Pickett, and J. Christianson, (2009) “Freight Performance Measures Analysis of 30 Freight Bottlenecks”, American Transportation Research Institute, Arlington, VA, http://www.atri-online.org/index.php?option=com_content&view=article&id=227&Itemid=75, accessed August 2009.
[6] T. Maze, (2008) The Minnesota Interstate Truck Parking Study, http://www.ctre.iastate.edu/reports/truck-parking.pdf, accessed April 2009.
[7] J. Short and D. Murray, (2008) “Assessment of Interstate Truck Parking Needs Using Wireless Truck Position Data”, 15th World Congress on Intelligent Transport Systems, New York, NY, Nov. 16-20.
[8] FHWA, (2002) Commercial Vehicle Travel Time and Delay at U.S. Border Crossings, http://ops.fhwa.dot.gov/freight/freight_news/travel_time/travel_time_delay.htm, accessed July 2009.
[9] FHWA, (2002) Evaluation of Travel Time Method to Support Mobility Performance Monitoring, http://ops.fhwa.dot.gov/freight/documents/blue_water_report.pdf, accessed July 2009.
[10] C. Liao, (2008) Freight Performance Measure Systems (FPMS) System Evaluation and Data Analysis, http://www.cts.umn.edu/Publications/ResearchReports/reportdetail.html?id=1550, accessed July 2009.
[11] Ministry of Transportation and Infrastructure, (2005) Satellite-Based Provincial Truck Travel Speed Analysis, British Columbia, Canada. http://www.th.gov.bc.ca/publications/planning/Provincial%20Highways/Truck_Travel_Time_Study.pdf, accessed July 2009.
[12] N.J. Garber, J.S. Miller, B. Yuan, and X. Sun, (2003) “The Safety Impacts of Differential Speed Limits on Rural Interstate Highways”, Compendium of the 82nd Annual Meeting of the Transportation Research Board, Washington, D.C.
[13] Y. Chen, X. Sun, L. Zhong, and G. Zhang, (2007) “Speed Difference and Its Impact on Traffic Safety of One Freeway in China”, Transportation Research Record, Volume 2038, pp.105-110.
[14] FHWA, Freight Analysis Framework, http://ops.fhwa.dot.gov/freight/freight_analysis/faf/index.htm, accessed July 2009.
[15] The R Project for Statistical Computing, http://www.r-project.org/, accessed July 2009.

36
[16] Image adopted from FHWA Freight Management and Operations – State Profile – Minnesota, http://ops.fhwa.dot.gov/freight/freight%5Fanalysis/state%5Finfo/minnesota/profile_mn.htm#fig4.
[17] ATRI, http://www.atri-online.com/, accessed July 2009. [18] ArcGIS is a GIS product of ESRI, http://www.esri.com/, accessed July 2009. [19] Mn/DOT Data Extract Tool, http://data.dot.state.mn.us/datatools/dataextract.html, accessed July
2009. [20] Illinois State Toll Highway Authority (ISTHA) http://www.illinoistollway.com/ accessed July
2009. [21] The Gary-Chicago-Milwaukee Corridor Transportation Information,
http://www.gcmtravel.com/gcm/traveltimes.jsp, accessed July 2009.

APPENDIX A: AVERAGE TRUCK SPEED

A-1
Figure A-1. Eastbound Average Truck Speed of Each Month
Figure A-2. Eastbound Truck Speed Standard Deviation of Each Month

Figure A-3. Westbound Average Truck Speed of Each Month
Figure A-4. Westbound Truck Speed Standard Deviation of Each Month
A-2

A-3
Figure A-5. Truck Speed Distributions nearby Hudson, WI
Figure A-6. Average Speed Variations by Hour of Day nearby Hudson, WI

A-4
Figure A-7. Truck Volume Variations by Hour of Day nearby Hudson, WI
Figure A-8. Truck Speed Distributions nearby Eau Claire, WI

A-5
Figure A-9. Average Speed Variations by Hour of Day nearby Eau Claire, WI
Figure A-10. Truck Volume Variations by Hour of Day nearby Eau Claire, WI

A-6
Figure A-11. Truck Speed Distributions nearby Tomah, WI
Figure A-12. Average Speed Variations by Hour of Day nearby Tomah, WI

A-7
Figure A-13. Truck Volume Variations by Hour of Day nearby Tomah, WI
Figure A-14. Truck Speed Distributions nearby Madison, WI

A-8
Figure A-15. Average Speed Variations by Hour of Day nearby Madison, WI
Figure A-16. Truck Volume Variations by Hour of Day nearby Madison, WI

A-9
Figure A-17. Truck Speed Distributions nearby Rockford, IL
Figure A-18. Average Speed Variations by Hour of Day nearby Rockford, IL

A-10
Figure A-19. Truck Volume Variations by Hour of Day nearby Rockford, IL
Figure A-20. Truck Speed Distributions nearby IL53
A-11
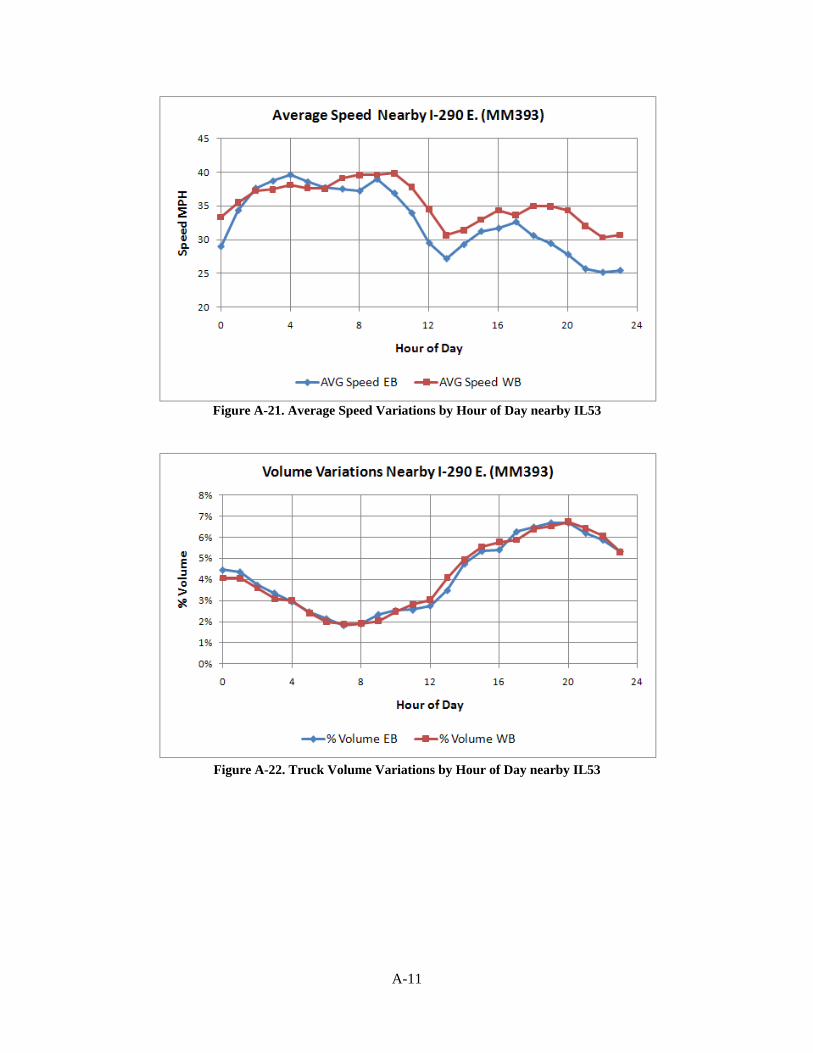
Figure A-21. Average Speed Variations by Hour of Day nearby IL53
Figure A-22. Truck Volume Variations by Hour of Day nearby IL53

APPENDIX B: PERFORMANCE INDEX

Figure B-1. Travel Time Index between Belvidere and Marengo Toll Plaza, Jan. 09
Figure B-2. Travel Time Index between South Beloit and Belvidere Toll Plaza, Jan. 09
B-1

Figure B-3. Travel Time Index between IL53 and O’Hare Airport, Mar. 09
Figure B-4. Travel Time Index between Elgin Toll Plaza and IL53, Mar. 09
B-2

Figure B-5. Travel Time Index between Marengo and Elgin Toll Plaza, Mar. 09
Figure B-6. Travel Time Index between Belvidere and Marengo Toll Plaza, Mar. 09
B-3

Figure B-7. Travel Time Index between South Beloit and Belvidere Toll Plaza, Mar. 09
Figure B-8. Travel Time Index between IL53 and O’Hare Airport, Oct. 08
B-4

Figure B-9. Travel Time Index between Elgin Toll Plaza and IL53, Oct. 08
Figure B-10. Travel Time Index between Marengo and Elgin Toll Plaza, Oct. 08
B-5

Figure B-11. Travel Time Index between Belvidere and Marengo Toll Plaza, Oct. 08
Figure B-12. Travel Time Index between South Beloit and Belvidere Toll Plaza, Oct. 08
B-6

Figure B-13. Travel Time Index between IL53 and O’Hare Airport, Jul. 08
Figure B-14. Travel Time Index between Elgin Toll Plaza and IL53, Jul. 08
B-7

Figure B-15. Travel Time Index between Marengo and Elgin Toll Plaza, Jul. 08
Figure B-16. Travel Time Index between Belvidere and Marengo Toll Plaza, Jul. 08
B-8

Figure B-17. Travel Time Index between South Beloit and Belvidere Toll Plaza, Jul. 08
Figure B-18. Buffer Time Index along I-94/I-90 Corridor in Jul. 2008
B-9

Figure B-19. Buffer Time Index along I-94/I-90 Corridor in Oct. 2008
Figure B-20. Buffer Time Index at MM18 nearby St. Paul in Apr. 09
B-10

Figure B-21. Buffer Time Index at MM24 nearby Hudson in Apr. 09
Figure B-22. Buffer Time Index at MM96 nearby Eau Claire in Apr. 09
B-11

Figure B-23. Buffer Time Index at MM171 nearby Tomah in Apr. 09
Figure B-24. Buffer Time Index at MM264 nearby Madison in Apr. 09
B-12

Figure B-25. Buffer Time Index at MM333 nearby Rockford in Apr. 09
Figure B-26. Buffer Time Index at MM393 West of O’Hare Airport in Apr. 09
B-13

Figure B-27. Buffer Speed Index in Jul. 2008
Figure B-28. Buffer Speed Index in Oct. 2008
B-14

B-15
Figure B-29. Buffer Speed Index in Jan. 2009
Figure B-30. Buffer Speed Index in Apr. 2009

APPENDIX C: TRIP DESTINATIONS

Figure C-1. Distributions of Trip Destinations (May & Jun. 2008)
Figure C-2. Distributions of Trip Destinations (Jul. & Aug. 2008)
C-1

Figure C-3. Distributions of Trip Destinations (Sep. & Oct. 2008)
Figure C-4. Distributions of Trip Destinations (Nov. & Dec. 2008)
C-2

C-3
Figure C-5. Distributions of Trip Destinations (Jan. & Feb. 2009)

APPENDIX D: TRUCK SPEED VS. GENERAL TRAFFIC SPEED

Figure D-1. I-94 EB Average Truck Speed vs. General Traffic Speed (May 2008)
Figure D-2. I-94 WB Average Truck Speed vs. General Traffic Speed (May 2008)
D-1

Figure D-3. I-94 EB Average Truck Speed vs. General Traffic Speed (Sep. 2008)
Figure D-4. I-94 WB Average Truck Speed vs. General Traffic Speed (Sep. 2008)
D-2
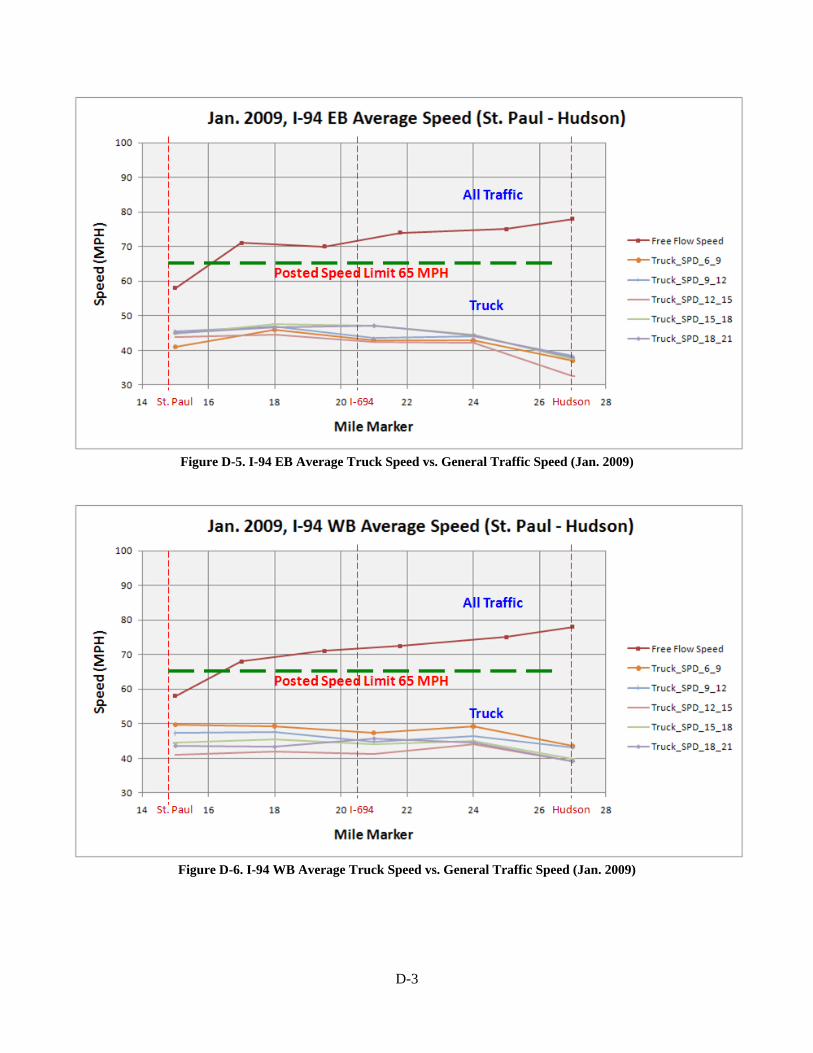
Figure D-5. I-94 EB Average Truck Speed vs. General Traffic Speed (Jan. 2009)
Figure D-6. I-94 WB Average Truck Speed vs. General Traffic Speed (Jan. 2009)
D-3

Figure D-7. I-90 EB Average Truck Speed vs. General Traffic Speed (May 2008)
Figure D-8. I-90 WB Average Truck Speed vs. General Traffic Speed (May 2008)
D-4

Figure D-9. I-90 EB Average Truck Speed vs. General Traffic Speed (Sep. 2008)
Figure D-10. I-90 WB Average Truck Speed vs. General Traffic Speed (Sep. 2008)
D-5

Figure D-11. I-90 EB Average Truck Speed vs. General Traffic Speed (Jan. 2009)
Figure D-12. I-90 WB Average Truck Speed vs. General Traffic Speed (Jan. 2009)
D-6

D-7
Figure D-13. I-94 EB Annual Median Truck Speed vs. General Traffic Speed
Figure D-14. I-94 WB Annual Median Truck Speed vs. General Traffic Speed

APPENDIX E: TRUCK STOPS AND STOP DURATIONS

Figure E-1. Truck Stop Counts at Location (Jul. 2008), N=82,042
Figure E-2. Truck Stop Counts at Location (Oct. 2008), N=77,748
E-1

E-2
Figure E-3. Truck Stop Counts at Location (Jan. 2009), N=65,070
Figure E-4. Distribution of Truck Stop Duration in Jan. 2009

APPENDIX F: I-90 HOURLY TRUCK VOLUME

Figure F-1. Hourly Truck Volume at South Beloit
Figure F-2. Hourly Truck Volume at Marengo/Belvidere
F-1

F-2
Figure F-3. Hourly Truck Volume at Elgin
Figure F-4. Hourly Truck Volume at River Road/Devon Avenue

APPENDIX G: DATA PROCESSING SCRIPT AND CODE SAMPLES

G.1 Query EB Speed by Location (12-month) create view tmp_0508 as select 'I94_90' RID, FromMeas*1609.344 FrMeas,ToMeas*1609.344 ToMeas, avg(speedMPH) avg_spd_0508 FROM I94_std_line_Raw where dir='east' and readyear=2008 and readmonth=5 group by FromMeas,tomeas go create view tmp_0608 as select 'I94_90' RID, FromMeas*1609.344 FrMeas,ToMeas*1609.344 ToMeas, avg(speedMPH) avg_spd_0608 FROM I94_std_line_Raw where dir='east' and readyear=2008 and readmonth=6 group by FromMeas,tomeas go create view tmp_0708 as select 'I94_90' RID, FromMeas*1609.344 FrMeas,ToMeas*1609.344 ToMeas, avg(speedMPH) avg_spd_0708 FROM I94_std_line_Raw where dir='east' and readyear=2008 and readmonth=7 group by FromMeas,tomeas go create view tmp_0808 as select 'I94_90' RID, FromMeas*1609.344 FrMeas,ToMeas*1609.344 ToMeas, avg(speedMPH) avg_spd_0808 FROM I94_std_line_Raw where dir='east' and readyear=2008 and readmonth=8 group by FromMeas,tomeas
go create view tmp_0908 as select 'I94_90' RID, FromMeas*1609.344 FrMeas,ToMeas*1609.344 ToMeas, avg(speedMPH) avg_spd_0908 FROM I94_std_line_Raw where dir='east' and readyear=2008 and readmonth=9 group by FromMeas,tomeas go create view tmp_1008 as select 'I94_90' RID, FromMeas*1609.344 FrMeas,ToMeas*1609.344 ToMeas, avg(speedMPH) avg_spd_1008 FROM I94_std_line_Raw where dir='east' and readyear=2008 and readmonth=10 group by FromMeas,tomeas go create view tmp_1108 as select 'I94_90' RID, FromMeas*1609.344 FrMeas,ToMeas*1609.344 ToMeas, avg(speedMPH) avg_spd_1108 FROM I94_std_line_Raw where dir='east' and readyear=2008 and readmonth=11 group by FromMeas,tomeas go create view tmp_1208 as select 'I94_90' RID, FromMeas*1609.344 FrMeas,ToMeas*1609.344 ToMeas, avg(speedMPH) avg_spd_1208 FROM I94_std_line_Raw where dir='east' and readyear=2008
G-1

and readmonth=12 group by FromMeas,tomeas go create view tmp_0109 as select 'I94_90' RID, FromMeas*1609.344 FrMeas,ToMeas*1609.344 ToMeas, avg(speedMPH) avg_spd_0109 FROM I94_std_line_Raw where dir='east' and readyear=2009 and readmonth=1 group by FromMeas,tomeas go create view tmp_0209 as select 'I94_90' RID, FromMeas*1609.344 FrMeas,ToMeas*1609.344 ToMeas, avg(speedMPH) avg_spd_0209 FROM I94_std_line_Raw where dir='east' and readyear=2009 and readmonth=2 group by FromMeas,tomeas go create view tmp_0309 as select 'I94_90' RID, FromMeas*1609.344 FrMeas,ToMeas*1609.344 ToMeas, avg(speedMPH) avg_spd_0309 FROM I94_std_line_Raw where dir='east' and readyear=2009 and readmonth=3 group by FromMeas,tomeas go create view tmp_0409 as select 'I94_90' RID, FromMeas*1609.344 FrMeas,ToMeas*1609.344 ToMeas, avg(speedMPH) avg_spd_0409 FROM I94_std_line_Raw where dir='east' and readyear=2009
and readmonth=4 group by FromMeas,tomeas go select 'East' Dir,a.*, b.avg_spd_0608, c.avg_spd_0708, d.avg_spd_0808, e.avg_spd_0908, f.avg_spd_1008, g.avg_spd_1108, h.avg_spd_1208, i.avg_spd_0109, j.avg_spd_0209, k.avg_spd_0309, l.avg_spd_0409 from tmp_0508 a inner join tmp_0608 b on a.rid=b.rid and a.frmeas=b.frmeas and a.tomeas=b.tomeas inner join tmp_0708 c on a.rid=c.rid and a.frmeas=c.frmeas and a.tomeas=c.tomeas inner join tmp_0808 d on a.rid=d.rid and a.frmeas=d.frmeas and a.tomeas=d.tomeas inner join tmp_0908 e on a.rid=e.rid and a.frmeas=e.frmeas and a.tomeas=e.tomeas inner join tmp_1008 f on a.rid=f.rid and a.frmeas=f.frmeas and a.tomeas=f.tomeas inner join tmp_1108 g on a.rid=g.rid and a.frmeas=g.frmeas and a.tomeas=g.tomeas inner join tmp_1208 h
G-2

G-3
on a.rid=h.rid and a.frmeas=h.frmeas and a.tomeas=h.tomeas inner join tmp_0109 i on a.rid=i.rid and a.frmeas=i.frmeas and a.tomeas=i.tomeas inner join tmp_0209 j on a.rid=j.rid and a.frmeas=j.frmeas and a.tomeas=j.tomeas inner join tmp_0309 k on a.rid=k.rid and a.frmeas=k.frmeas and a.tomeas=k.tomeas inner join tmp_0409 l on a.rid=l.rid and a.frmeas=l.frmeas and a.tomeas=l.tomeas order by a.FrMeas go
drop view tmp_0508 go drop view tmp_0608 go drop view tmp_0708 go drop view tmp_0808 go drop view tmp_0908 go drop view tmp_1008 go drop view tmp_1108 go drop view tmp_1208 go drop view tmp_0109 go drop view tmp_0209 go drop view tmp_0309 go drop view tmp_0409 go
G.2 Sample R-code for Trip Destination Histograms # percent density par(mfrow=c(2,2)) #Mar 09 data<‐read.csv("C:/Chenfu/ATRI_MnDOT/UMN_Data/Chen_OD/Mar09_MM408_WB_avl.csv", header=F) origin=data$V1/1609.344 dest=data$V2/1609.344 r=hist(dest, breaks=10, plot=FALSE) len=length(dest) x=r$breaks[1:10] y=r$counts[1:10]/len y[10]=y[9] plot(x, y, type="s", xlim=c(0,450), ylim=c(0, 0.4), xlab="Mile", ylab="% Density", main=paste("Mar. 09 WB, N=", as.character(len))) lines(x, y, type="h") abline(h=0) data<‐read.csv("C:/Chenfu/ATRI_MnDOT/UMN_Data/Chen_OD/Mar09_MM24_EB_avl.csv", header=F) origin=data$V1/1609.344 dest=data$V2/1609.344 r=hist(dest, breaks=10, plot=FALSE) len=length(dest)

x=r$breaks[1:10] y=r$counts[1:10]/len y[10]=y[9] plot(x, y, type="s", xlim=c(0,450), ylim=c(0, 0.4), xlab="Mile", ylab="% Density", main=paste("Mar. 09 EB, N=", as.character(len))) lines(x, y, type="h") abline(h=0) #April 09 data<‐read.csv("C:/Chenfu/ATRI_MnDOT/UMN_Data/Chen_OD/Apr09_MM408_WB_avl.csv", header=F) origin=data$V1/1609.344 dest=data$V2/1609.344 r=hist(dest, breaks=10, plot=FALSE) len=length(dest) x=r$breaks[1:10] y=r$counts[1:10]/len y[10]=y[9] plot(x, y, type="s", xlim=c(0,450), ylim=c(0, 0.4), xlab="Mile", ylab="% Density", main=paste("Apr. 09 WB, N=", as.character(len))) lines(x, y, type="h") abline(h=0) data<‐read.csv("C:/Chenfu/ATRI_MnDOT/UMN_Data/Chen_OD/Apr09_MM24_EB_avl.csv", header=F) origin=data$V1/1609.344 dest=data$V2/1609.344 r=hist(dest, breaks=10, plot=FALSE) len=length(dest) x=r$breaks[1:10] y=r$counts[1:10]/len y[10]=y[9] plot(x, y, type="s", xlim=c(0,450), ylim=c(0, 0.4), xlab="Mile", ylab="% Density", main=paste("Apr. 09 EB, N=", as.character(len))) lines(x, y, type="h") abline(h=0)
G.3 Compute EB Truck Speed by Hour IF EXISTS(SELECT TABLE_NAME FROM INFORMATION_SCHEMA.TABLES WHERE TABLE_NAME = 'Apr09_I94_STD_LINE') DROP TABLE Apr09_I94_STD_LINE go create table Apr09_I94_STD_LINE(ReadYear int,ReadMonth int,ReadHour int,Dir varcahar(10),AVG_SPD float,SD_SPD float,Cnt int) go insert into APR09_I94_STD_LINE select ReadYear,ReadMonth,ReadHour,'East' Dir, avg(velocityMPH) AVG_SPD,stdev(velocityMPH) SD_SPD,count(velocityMPH) N from Apr09_I94_AVL_Line_Event where (fromMeas>=25000 or toMeas<=30000 )and
G-4

velocityMPH>=5 and velocityMPH<=85 group by readyear, readmonth, readhour go
G.4 Query I-90 WB Traffic Speed by Hour create view tmp1 as select mile_mark, avg(speed_mph) avg_spd_6_9 from I90_traffic_speeds where [year]=2008 and [month]=9 and direction='W' and [hour]>=6 and [hour]<9 group by mile_mark go create view tmp2 as select mile_mark, avg(speed_mph) avg_spd_9_12 from I90_traffic_speeds where [year]=2008 and [month]=9 and direction='W' and [hour]>=9 and [hour]<12 group by mile_mark go create view tmp3 as select mile_mark, avg(speed_mph) avg_spd_12_15 from I90_traffic_speeds where [year]=2008 and [month]=9 and direction='W' and [hour]>=12 and [hour]<15 group by mile_mark go create view tmp4 as select mile_mark, avg(speed_mph) avg_spd_15_18 from I90_traffic_speeds where [year]=2008 and [month]=9 and direction='W' and [hour]>=15 and [hour]<18 group by mile_mark
go create view tmp5 as select mile_mark, avg(speed_mph) avg_spd_18_21 from I90_traffic_speeds where [year]=2008 and [month]=9 and direction='W' and [hour]>=18 and [hour]<21 group by mile_mark go select a.*, b.avg_spd_9_12,c.avg_spd_12_15, d.avg_spd_15_18,e.avg_spd_18_21 from tmp1 a inner join tmp2 b on a.mile_mark=b.mile_mark inner join tmp3 c on a.mile_mark=c.mile_mark inner join tmp4 d on a.mile_mark=d.mile_mark inner join tmp5 e on a.mile_mark=e.mile_mark order by a.mile_mark go drop view tmp1 go drop view tmp2 go drop view tmp3 go drop view tmp4 go drop view tmp5 go
G-5