disclaimer uses of nonlinear... · 2/3/2017 1 practical uses of nonlinear pushover analysis jerod...
TRANSCRIPT

2/3/2017
1
PRACTICAL USES OF NONLINEAR PUSHOVER ANALYSIS
Jerod G. Johnson, PhD, SE
SEAU Education Conference February 22, 2017
SEAU: 2017 Education Conference
Disclaimer
This presentation is meant to neither explicitly endorse nor discourage
the use of the nonlinear pushover analysis method for any given design
scenario. As with any method, nonlinear pushover has its benefits and
limitations. Whether nonlinear pushover analysis is appropriate lies at
the discretion of the engineer in responsible charge.

2/3/2017
2
SEAU: 2017 Education Conference
Presentation Outline1. What is Nonlinear Analysis?
2. What is Nonlinear Pushover Analysis?
3. Why Use Nonlinear Pushover Analysis?
4. What are the Common Perceptions?
5. Embracing Innovation.
6. Embracing Nonlinearity.
7. Nonlinear Pushover Analysis – A Good First Step.
8. Nonlinear Element Modeling
9. Examples
10. Nonlinear Pushover Limitations
11. Time History – Quick Summary
12. Software
SEAU: 2017 Education Conference
1. What is Nonlinear Analysis?
Simple Definition of Nonlinearity:
An alteration of material, element or system modeling properties as a function of load (including direction of load), displacement, deformation or velocity.
Wikipedia:
In physical sciences, a nonlinear system is a system in which the output is not directly proportional to the input.
Simple example – a tension only element.
2/3/2017
3
SEAU: 2017 Education Conference
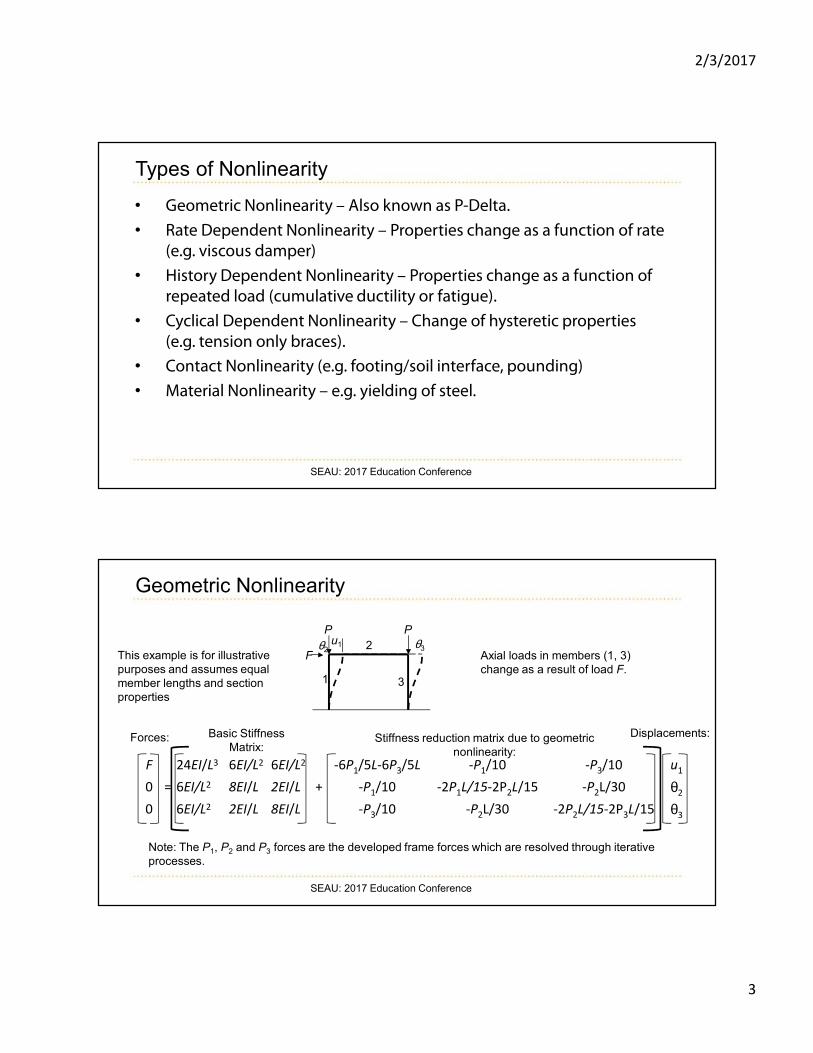
Types of Nonlinearity
• Geometric Nonlinearity – Also known as P-Delta.
• Rate Dependent Nonlinearity – Properties change as a function of rate
(e.g. viscous damper)
• History Dependent Nonlinearity – Properties change as a function of
repeated load (cumulative ductility or fatigue).
• Cyclical Dependent Nonlinearity – Change of hysteretic properties
(e.g. tension only braces).
• Contact Nonlinearity (e.g. footing/soil interface, pounding)
• Material Nonlinearity – e.g. yielding of steel.
SEAU: 2017 Education Conference
1
P
F2
3
P
θ2θ3
F 24EI/L3 6EI/L2 6EI/L2 -6P1/5L-6P3/5L -P1/10 -P3/10 u1
0 = 6EI/L2 8EI/L 2EI/L + -P1/10 -2P1L/15-2P2L/15 -P2L/30 θ2
0 6EI/L2 2EI/L 8EI/L -P3/10 -P2L/30 -2P2L/15-2P3L/15 θ3
Basic Stiffness Matrix:
Stiffness reduction matrix due to geometric nonlinearity:
Forces: Displacements:
Axial loads in members (1, 3) change as a result of load F.
This example is for illustrative purposes and assumes equal member lengths and section properties
Note: The P1, P2 and P3 forces are the developed frame forces which are resolved through iterative processes.
u1
Geometric Nonlinearity
2/3/2017
4
SEAU: 2017 Education Conference
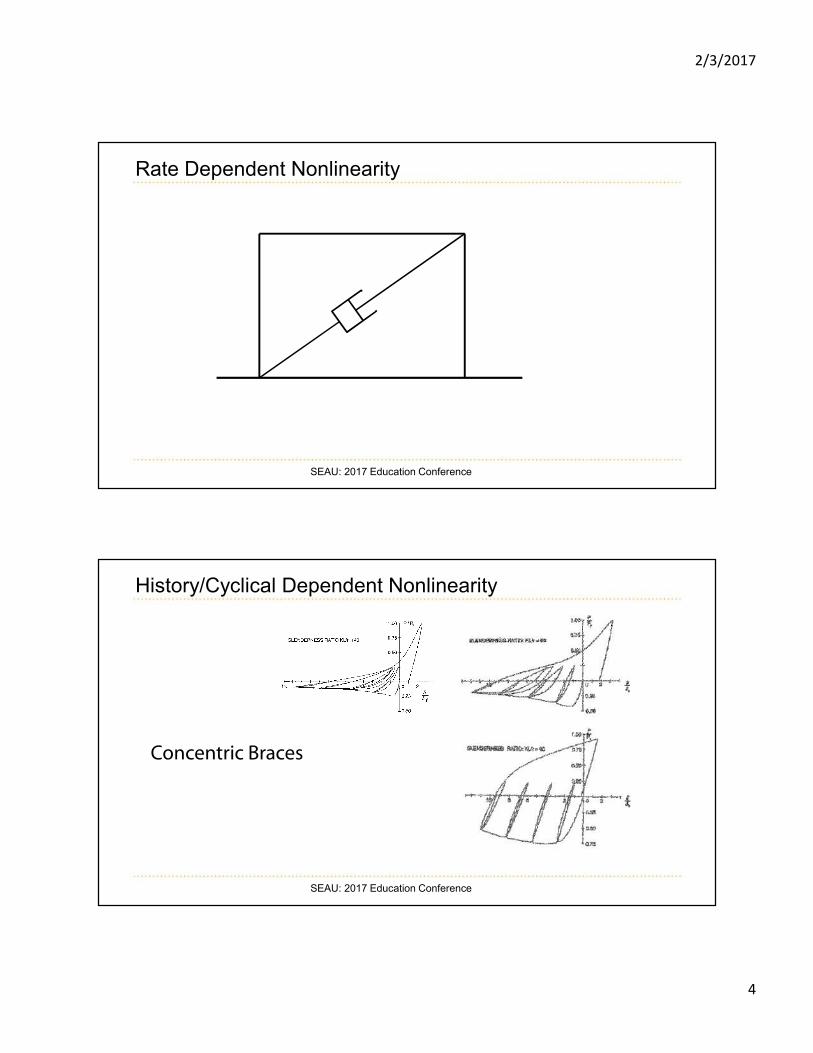
Rate Dependent Nonlinearity
SEAU: 2017 Education Conference
History/Cyclical Dependent Nonlinearity
Slen
derIntermediate
StockyConcentric Braces

2/3/2017
5
SEAU: 2017 Education Conference
Contact Nonlinearity
-1
0
1
2
3
4
5
6
7
8
0 5 10 15 20 25 30
Footing Deflection
Pounding
SEAU: 2017 Education Conference
Material Nonlinearity
Some materials are more ductile than others….Some materials behave better when confined….
Structural Steel – Fy = 50ksi Rebar– fy = 60ksi

2/3/2017
6
SEAU: 2017 Education Conference
Material Nonlinearity (cont.)
Some materials are less ductile than others….Some materials behave better when confined….
Unconfined Concretef’c = 4000psi
Confined Concretef’c = 4000psi
Mander Concrete Model
SEAU: 2017 Education Conference
Material Nonlinearity (cont.)
“Ductile” systems are driven to enable material nonlinearity.
This is the basis behind:• Ties and confinement in “Special”
reinforced concrete sections.• Lateral bracing of moment frame beams in
SRMF and OMF.• Lateral bracing of beams in other BF
systems.• The casing and grout of a BRB.• Definitions of seismic compactness.

2/3/2017
7
SEAU: 2017 Education Conference
Material Nonlinearity (cont.)
“Ductile” systems are driven to enable:
Element Nonlinearity
Repeated cycles of stable (material) nonlinearity are preferred and even encouraged in the codes. This is reflected in the R factors. Let’s observe…
R R R R R R R R R R R R??Non-Degrading Stiffness Degrading Pinched Buckling
∆
F F F F
∆ ∆ ∆
BRB/SRMF SCSW OCBF

2/3/2017
8
SEAU: 2017 Education Conference
2. What is Nonlinear Pushover Analysis?
Piecewise monotonically displacing a structure consistent
with a rational loading pattern while explicitly accounting for
nonlinearity of specific lateral force resisting elements
(plastic hinges). The displacement magnitude of the
structure is compared against the reactions that develop as
nonlinear mechanisms develop.
SEAU: 2017 Education Conference
What is Nonlinear Pushover Analysis?
∆
rxnrxn
0
200
400
600
800
1000
1200
0 2 4 6 8 10
Base S
hear
Rooftop Displacement
Base Shear vs. Displacement
Nonlinear
Linear
∆
�� � �����������
4���
How is this performed?
C0 – SDOF to MDOF Modifier.C1 – Elastic to Inelastic Modifier.C2 – Pinched Hysteresis Modifier.C3 – P-Delta Modifier
2/3/2017
9
SEAU: 2017 Education Conference
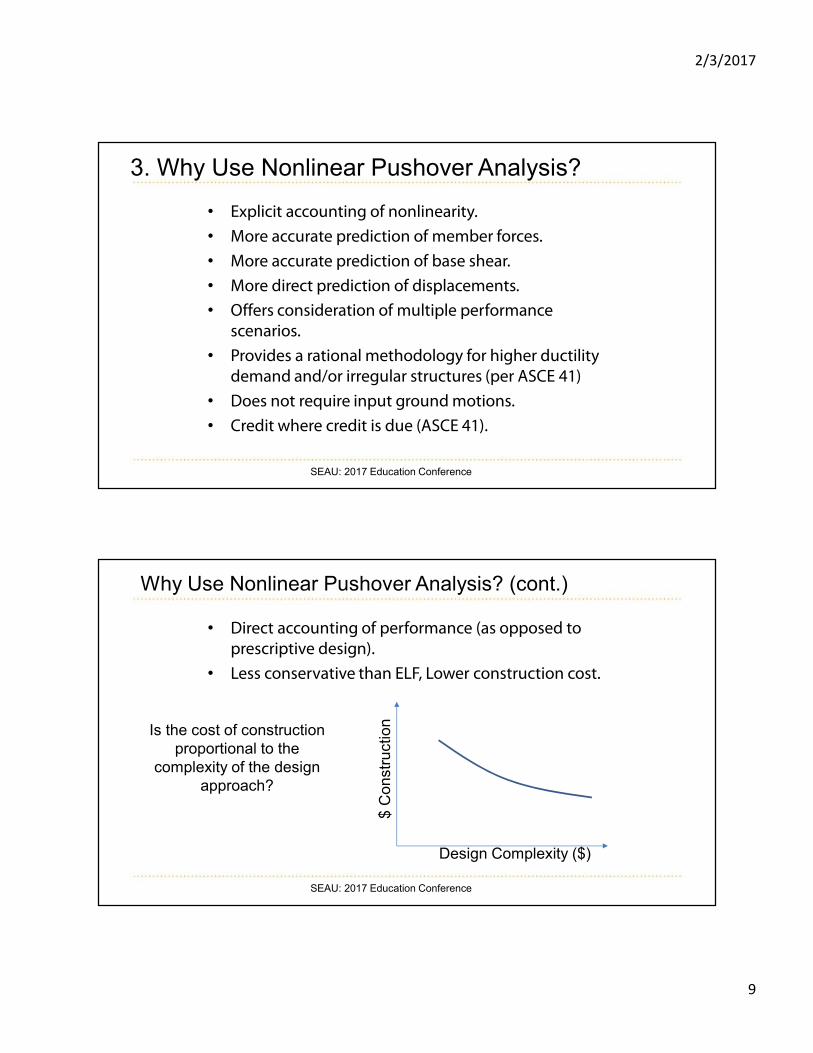
3. Why Use Nonlinear Pushover Analysis?
• Explicit accounting of nonlinearity.
• More accurate prediction of member forces.
• More accurate prediction of base shear.
• More direct prediction of displacements.
• Offers consideration of multiple performance
scenarios.
• Provides a rational methodology for higher ductility
demand and/or irregular structures (per ASCE 41)
• Does not require input ground motions.
• Credit where credit is due (ASCE 41).
SEAU: 2017 Education Conference
Why Use Nonlinear Pushover Analysis? (cont.)
• Direct accounting of performance (as opposed to
prescriptive design).
• Less conservative than ELF, Lower construction cost.
Is the cost of construction proportional to the
complexity of the design approach?
$ C
on
str
uctio
n
Design Complexity ($)

2/3/2017
10
SEAU: 2017 Education Conference
Performance can be better than expected:
“…observed seismic performances of three existing buildings in
Christchurch subjected to the 2011 Lyttleton event were compared
to the predicted performance of the analytical nonlinear models of
the subject buildings. In general, the observed performance of the
buildings was found to be better than that predicted by the
analytical models.”
SEAU: 2017 Education Conference
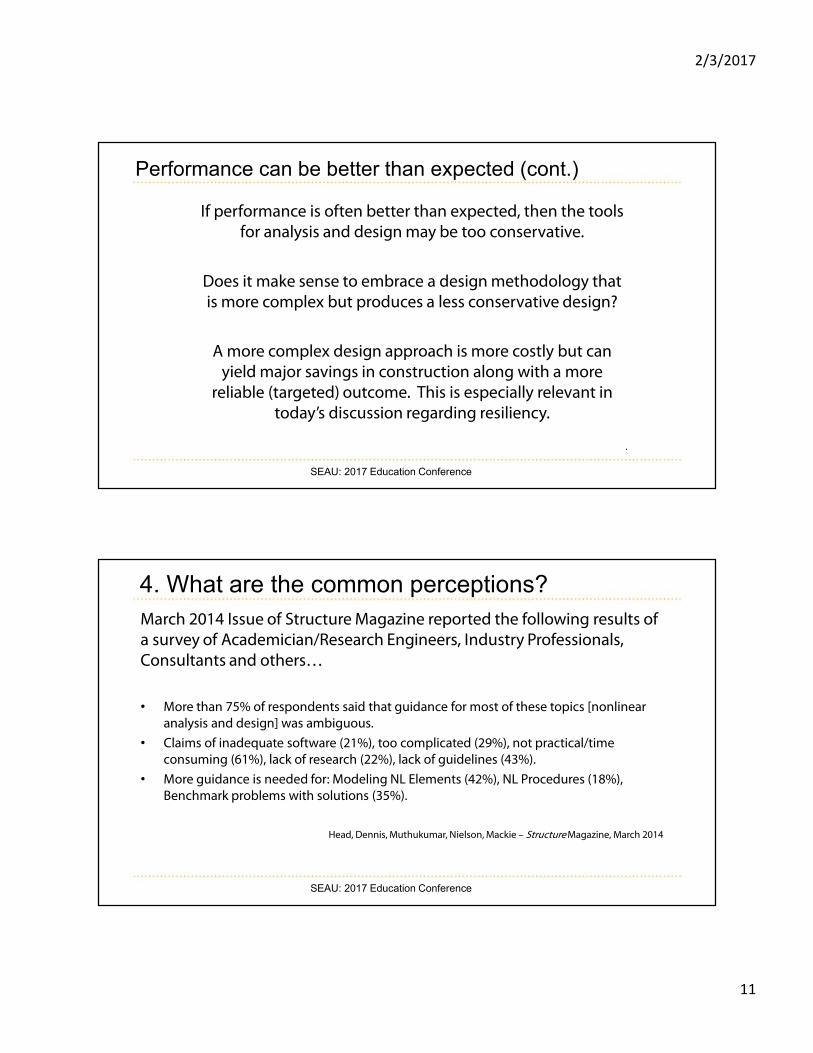
Performance can be better than expected (cont.)
If performance is better than predicted by the most sophisticated of
nonlinear analysis procedures then how conservative are the
provisions using equivalent lateral force static methods?
2/3/2017
11
SEAU: 2017 Education Conference
If performance is often better than expected, then the tools
for analysis and design may be too conservative.
Does it make sense to embrace a design methodology that
is more complex but produces a less conservative design?
A more complex design approach is more costly but can
yield major savings in construction along with a more
reliable (targeted) outcome. This is especially relevant in
today’s discussion regarding resiliency.
.
Performance can be better than expected (cont.)
SEAU: 2017 Education Conference
4. What are the common perceptions?
March 2014 Issue of Structure Magazine reported the following results of
a survey of Academician/Research Engineers, Industry Professionals,
Consultants and others…
• More than 75% of respondents said that guidance for most of these topics [nonlinear
analysis and design] was ambiguous.
• Claims of inadequate software (21%), too complicated (29%), not practical/time
consuming (61%), lack of research (22%), lack of guidelines (43%).
• More guidance is needed for: Modeling NL Elements (42%), NL Procedures (18%),
Benchmark problems with solutions (35%).
Head, Dennis, Muthukumar, Nielson, Mackie – StructureMagazine, March 2014
2/3/2017
12
SEAU: 2017 Education Conference
What are the common perceptions? (cont.)
“…there is a need to be able to communicate to the importance of doing nonlinear analysis
to the owners, as the apparent gain to pay for a more extensive analysis is not always clear.”
“Nonlinear analysis can be used when owners request ways to reduce costs (for new
construction) by optimizing material use, more likely though as demonstrating a building
retrofit is perhaps not even necessary (or if it is, that only minor changes/systems are
needed rather than what the code would require), or even as a way of quantifying
performance for owners, insurance and risk managers that may look at inventories of
structures. So, the major question to the owner is whether they’d prefer to pay now or pay
later?”
SEAU: 2017 Education Conference
From the Experts… (March 2016 Structure Magazine)
When to conduct NL Analysis
• Irregular building type
• Assumptions of code-based linear are not valid
• Retrofitting
• Viscous dampers, isolators or new type of LFRS

2/3/2017
13
SEAU: 2017 Education Conference
From the Experts… (March 2016 Structure Magazine)
• NL Procedures are “time consuming, computationally demanding and required added
cost of a peer review” Not to mention the added cost of design.
• Pushover analysis should not be used as the sole measure and not be needed if one is
performing a nonlinear time history.
• Pushover is less useful for drift/ductility, but rather to help proportion the structure to
activate any intended ductile mechanism.
• Pushover not appropriate for multi-mode buildings.
• “…the need for more education and training on advanced topics like nonlinear analysis
cannot be overstated.”
• “Pay now or pay later?”
Head, Pathak, Muthukumar, Mackie– StructureMagazine, March 2016
5. Embracing Innovation

2/3/2017
14
A Tip Calculator?
Much more than a tip calculator!....

2/3/2017
15
What do we do…fundamentally?
Design Buildings?
How?
Mathematical Models…

2/3/2017
16
What was the basis of these equations?:
� � ��� �� �����
�� ���
���
�� � ���� ��� �����
�
∑ ������
� �
� � �����
Mathematical Models:
� � ��� �� �����
�� ���
���
�� � ���� ��� �����
�
∑ ������
� �
� � �����

2/3/2017
17
We Use Mathematical Models to:
• Predict behavior of structural systems with respect to theoretical load.
• Ensure structures are sufficiently strong to resist the anticipated load.
• Reliably predict loads a structure may experience.• Reliably predict the minimum strength of structural elements.
Mathematical Models:
Mn=FyZx Mn=Asfy(d-a/2)
T� 2�"
#
F 24EI/L3 6EI/L2 6EI/L2 u1
M2 = 6EI/L2 8EI/L 2EI/L θ2
M3 6EI/L2 2EI/L 8EI/L θ3
$%& ' (%) ' *% � +,-.
φPn,max = 0.80φ[0.85f ’c(Ag-Ast) + fy(Ast)]

2/3/2017
18
Tools of the Trade…Today:
� � ���
�� �����
�� ���
���
�� � ���� ��� �����
�
∑ ������
� �
� � �����
Evolution of Computer Power:
Moore’s Law: The number of transistors in a dense integrated circuit doubles approximately every two years.-Gordon E. Moore – co-founder of Intel Corporation and Fairchild Semiconductor.
This law is now used in the semiconductor industry to guide long-term planning and to set targets for research and development.
What does this say about the advancement of computer power over the last 20 years?
Increase = 210 = 1,024
How about the last 40 years?
Increase = 220 = 1,048,576

2/3/2017
19
Moore’s Law:https://en.wikipedia.org/wiki/Moore%27s_law
Embracing Nonlinearity
It can do more than equivalent lateral forces!

2/3/2017
20
6. Embracing Nonlinearity
Re: ASCE 41, FEMA P695, Others
Lumped Plasticity Models
Embracing Nonlinearity
Professor Ed Wilson:
“The enormous increase in speed and memory capacity of inexpensive personal computers and the development of new numerical methods allow structural engineers to conduct earthquake response analysis of large and complex three-dimensional structures. Therefore, I am
optimistic many structural engineers will
realize linear and non-linear time-history
dynamic analysis of structures is not difficult
and performance based design is now a
reality.”

2/3/2017
21
Embracing Nonlinearity
Professor Ed Wilson (cont.):
“After fifty years of conducting linear and non-linear earthquake analyses of many different types of structures, I am concerned with the increase in use of the approximate Response Spectrum Method. The fundamental equilibrium equations are not satisfied for systems over one-degree-of-freedom. In addition, the application of the method to
nonlinear structural analysis has no theoretical or physical
justification.”
So, what is Dr. Wilson Talking About?

2/3/2017
22
SEAU: 2017 Education Conference
Higher Mode Response
Multi-Degree of Freedom Systems
1.4 Seconds 0.67 Seconds
0.38 Seconds 0.28 Seconds
91% Mass
Activation
SEAU: 2017 Education Conference
Higher Mode Response
Multi-Degree of Freedom

2/3/2017
23
SEAU: 2017 Education Conference
The simple calculation of story drifts is not appropriate when using dynamic response spectrum analyses because combined modal displacements can be less than the combined modal story drift (signs are lost). This is a consequence of simplified approaches.
Higher Mode Response
SEAU: 2017 Education Conference
“…..the application of the method to nonlinear structural analysis has
no theoretical or physical justification.”
In other words, what happens to these mode
shapes when yielding occurs?
1.4 Seconds 0.67 Seconds
91% Mass
Activation
0.38 Seconds 0.28 Seconds

2/3/2017
24
7. Nonlinear Pushover Analysis – A Good First Step
• A good ‘first step’ into the larger world of nonlinear analysis.
• A good ‘first step’ into the advanced capabilities of the tools we use.
• A good tool for helping us understand the basis behind many code provisions.
• Primary Shortcoming; how to handle higher mode effects.
SEAU: 2017 Education Conference
A Nonlinear Model:
• Includes explicit modeling of mechanisms (ductile and brittle) that are likely to occur as material limit states are reached and surpassed.
• Remember, a material or element reaching to a limit state doesn’t necessarily mean collapse. A system failure means collapse.
What has been asked in regions of low seismicity?
Why would you want something to yield?-Targeted nonlinearity, fuse, system control, reduction of forces.
2/3/2017
25
SEAU: 2017 Education Conference
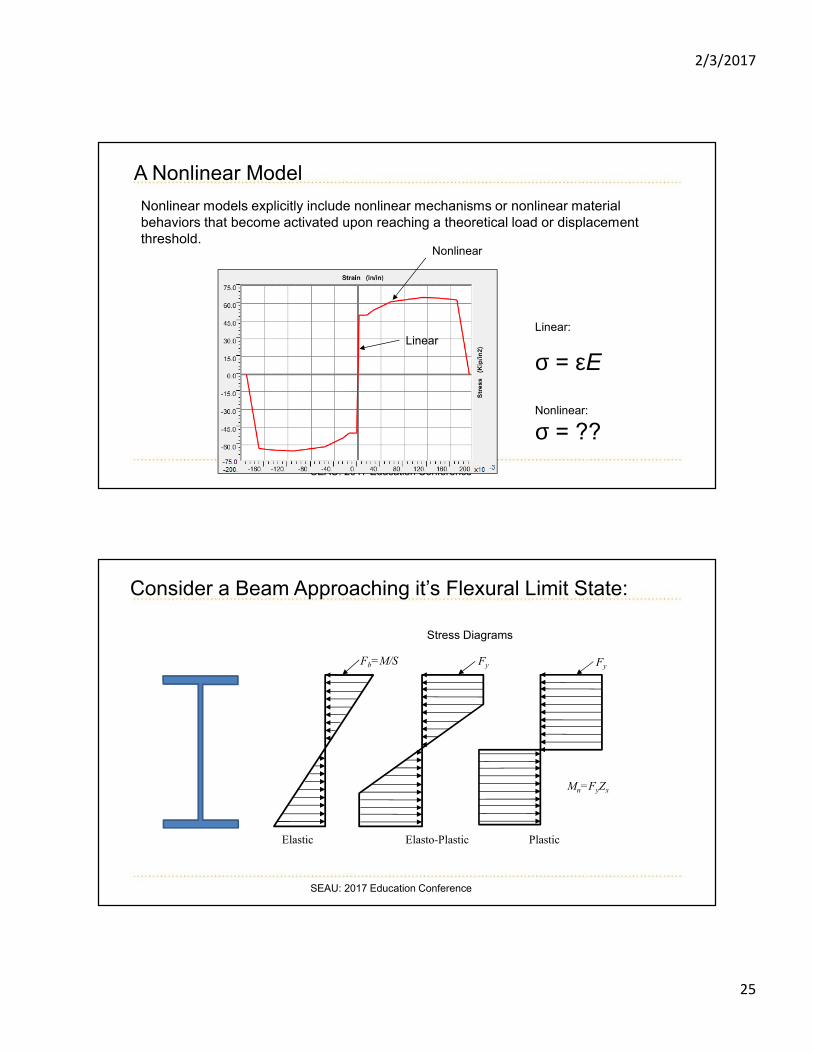
A Nonlinear Model
Nonlinear models explicitly include nonlinear mechanisms or nonlinear material behaviors that become activated upon reaching a theoretical load or displacement threshold.
Linear
Nonlinear
Linear:
σ = εE
Nonlinear:
σ = ??
SEAU: 2017 Education Conference
Consider a Beam Approaching it’s Flexural Limit State:
Mn=FyZx
Fb=M/S
Elastic Elasto-Plastic Plastic
Stress Diagrams
Fy Fy
2/3/2017
26
SEAU: 2017 Education Conference
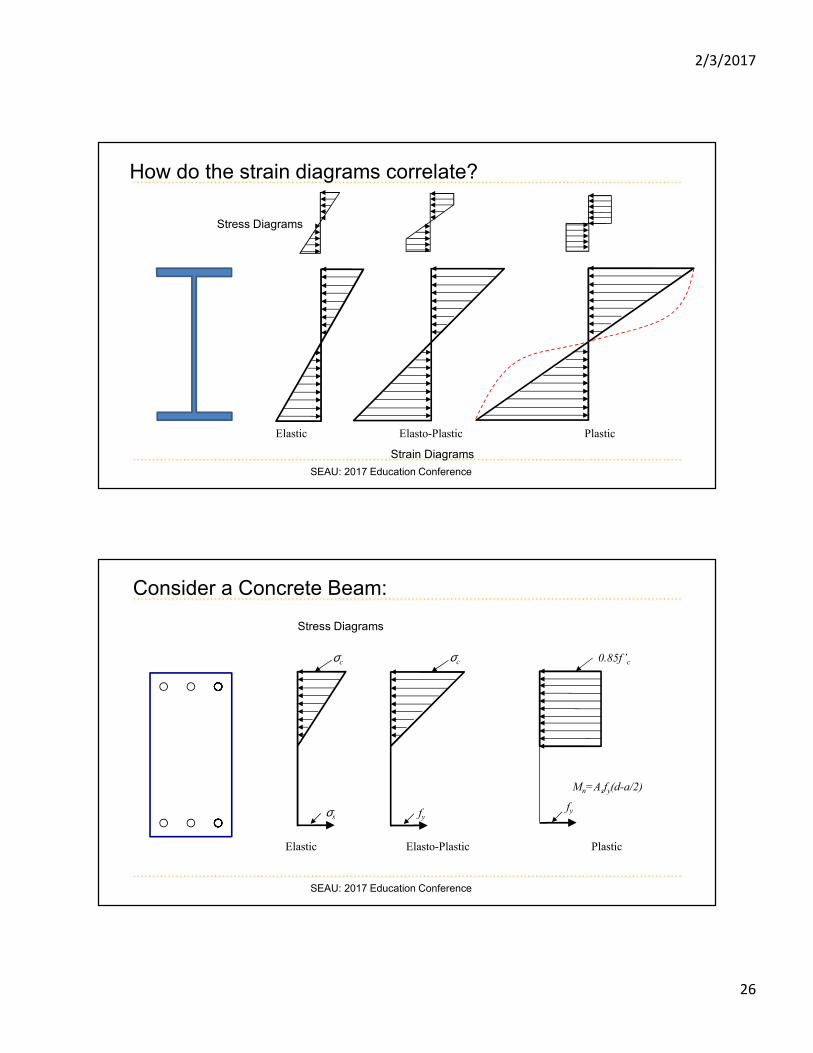
Elastic Elasto-Plastic Plastic
Strain Diagrams
How do the strain diagrams correlate?
Stress Diagrams
SEAU: 2017 Education Conference
Consider a Concrete Beam:
Mn=Asfy(d-a/2)
σc
Stress Diagrams
0.85f’c
σs
Elastic Elasto-Plastic Plastic
fy
σc
fy
2/3/2017
27
SEAU: 2017 Education Conference
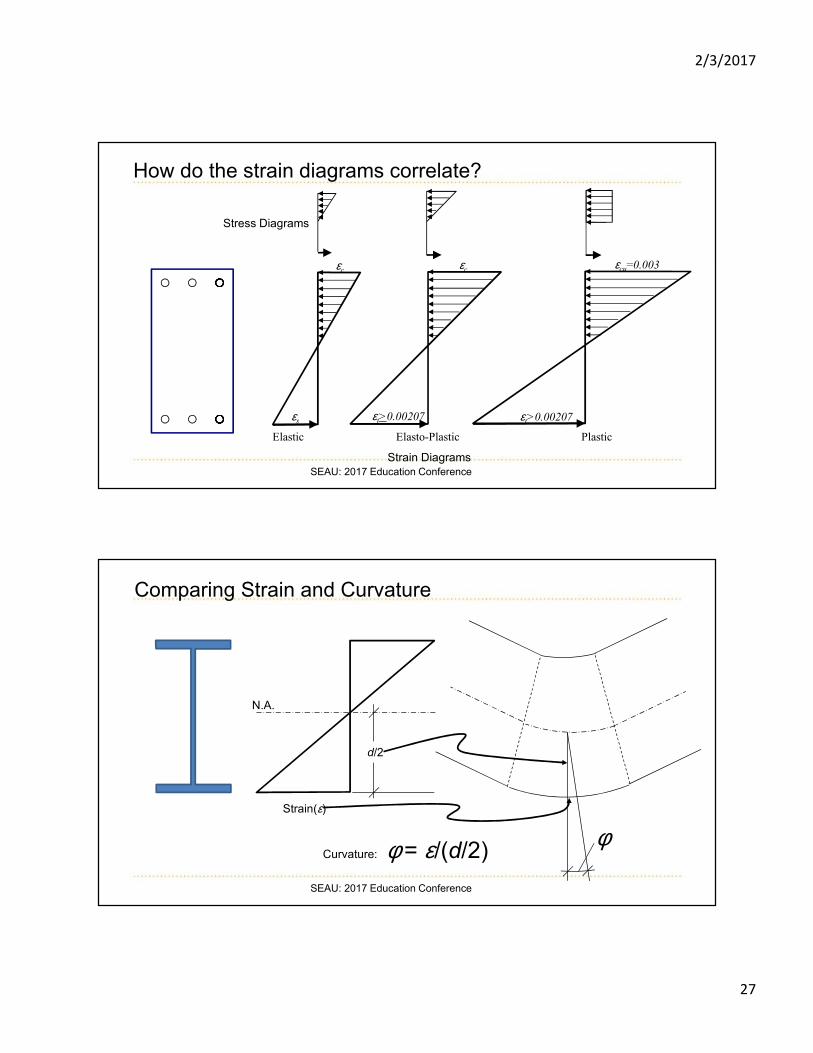
Strain Diagrams
How do the strain diagrams correlate?
Stress Diagrams
Elastic Elasto-Plastic Plastic
εcu=0.003
εt>0.00207εt>0.00207εs
εc εc
SEAU: 2017 Education Conference
Comparing Strain and Curvature
Strain(ε)
d/2
φCurvature: φ = ε/(d/2)
N.A.
2/3/2017
28
SEAU: 2017 Education Conference
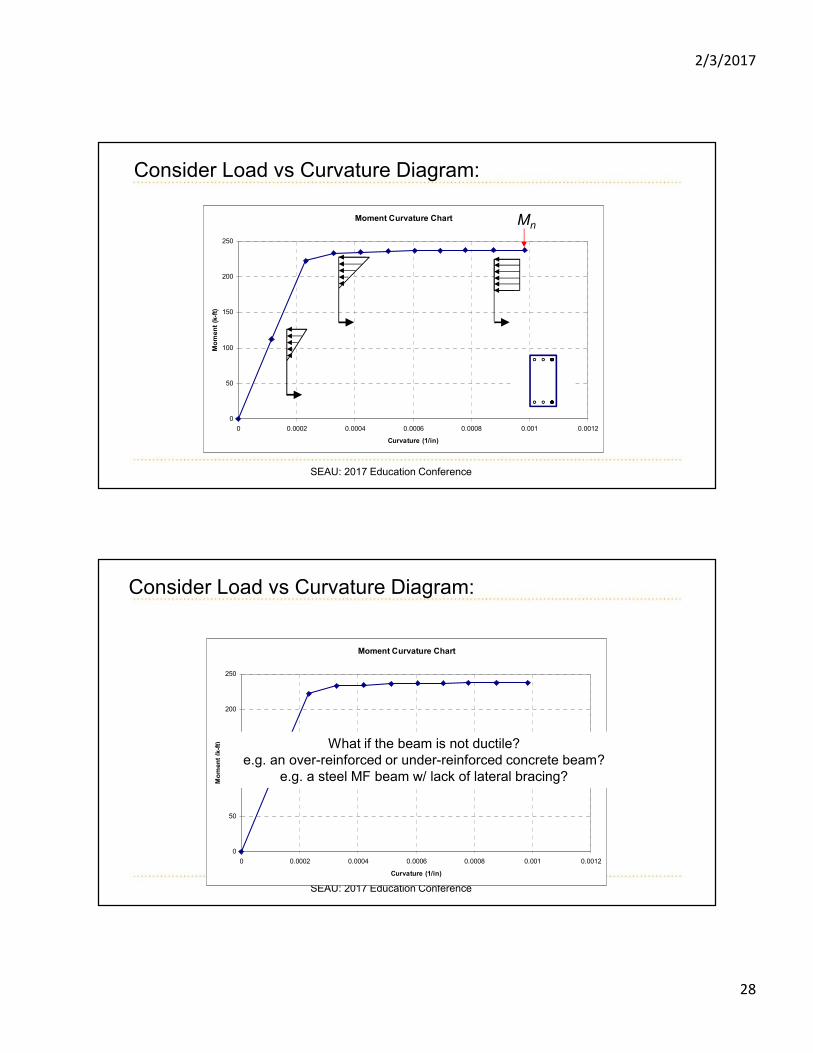
Consider Load vs Curvature Diagram:
Moment Curvature Chart
0
50
100
150
200
250
0 0.0002 0.0004 0.0006 0.0008 0.001 0.0012
Curvature (1/in)
Mo
men
t (k
-ft)
Mn
SEAU: 2017 Education Conference
Consider Load vs Curvature Diagram:
Moment Curvature Chart
0
50
100
150
200
250
0 0.0002 0.0004 0.0006 0.0008 0.001 0.0012
Curvature (1/in)
Mo
men
t (k
-ft) What if the beam is not ductile?
e.g. an over-reinforced or under-reinforced concrete beam?e.g. a steel MF beam w/ lack of lateral bracing?

2/3/2017
29
SEAU: 2017 Education Conference
Consider Load vs Curvature Diagram:
Moment Curvature Chart
0
50
100
150
200
250
0 0.0002 0.0004 0.0006 0.0008 0.001 0.0012
Curvature (1/in)
Mo
men
t (k
-ft)
Some other unstable behavior may occur before stable hysteretic nonlinearity develops.
SEAU: 2017 Education Conference
8. Nonlinear Element Modeling
• Lumped (Concentrated) Plasticity
• Distributed Plasticity (forced based fiber nonlinearity)

2/3/2017
30
SEAU: 2017 Education Conference
Nonlinear Building Modeling
• Lumped (Concentrated) Plasticity vs• Distributed Plasticity (forced based fiber
nonlinearity)
+
• Nonlinear Static Analysis (Pushover) vs• Nonlinear Dynamic Analysis
SEAU: 2017 Education Conference
Nonlinear Static vs. Nonlinear Dynamic?
Key Differentiators:• Geoseismic Input• Time• Complexity• Project Needs• $$• Software
-20000
-15000
-10000
-5000
0
5000
10000
15000
20000
-0.05 -0.04 -0.03 -0.02 -0.01 0 0.01 0.02 0.03 0.04 0.05
Beam Rotation (rad)
Beam
Fo
rce (
kip
-in
)
Nonlinear Static Pushover Curve
0
50
100150
200250
300
350400
450500
0 10 20 30 40 50 60
Roof Displacement (inches)
Base
Fo
rce (
kip
s)
Element Hysteretic Response

2/3/2017
31
SEAU: 2017 Education Conference
Nonlinear Analysis
• Explicitly includes either lumped plasticity elements or distributed plasticity elements to predict a system’s response
to an input function.
• May use either piecewise static analysis (pushover) or a full response-history analysis.
SEAU: 2017 Education Conference
Lumped (Concentrated) Plasticity:
Mn=FyZx
Fy
Mn=Asfy(d-a/2)
0.85f’c
fy
These very familiar models represent the ultimate strength limit state of these beams.

2/3/2017
32
SEAU: 2017 Education Conference
Lumped Plasticity Example:
Plastic flexural hinge will develop at the support
W14x159
SEAU: 2017 Education Conference
Lumped Plasticity Example
Force

2/3/2017
33
SEAU: 2017 Education Conference
Nonlinear Pushover:
Force
Reaction
Pattern
∆
Force
SEAU: 2017 Education Conference
Nonlinear Pushover:

2/3/2017
34
SEAU: 2017 Education Conference
Nonlinear Pushover:
SEAU: 2017 Education Conference
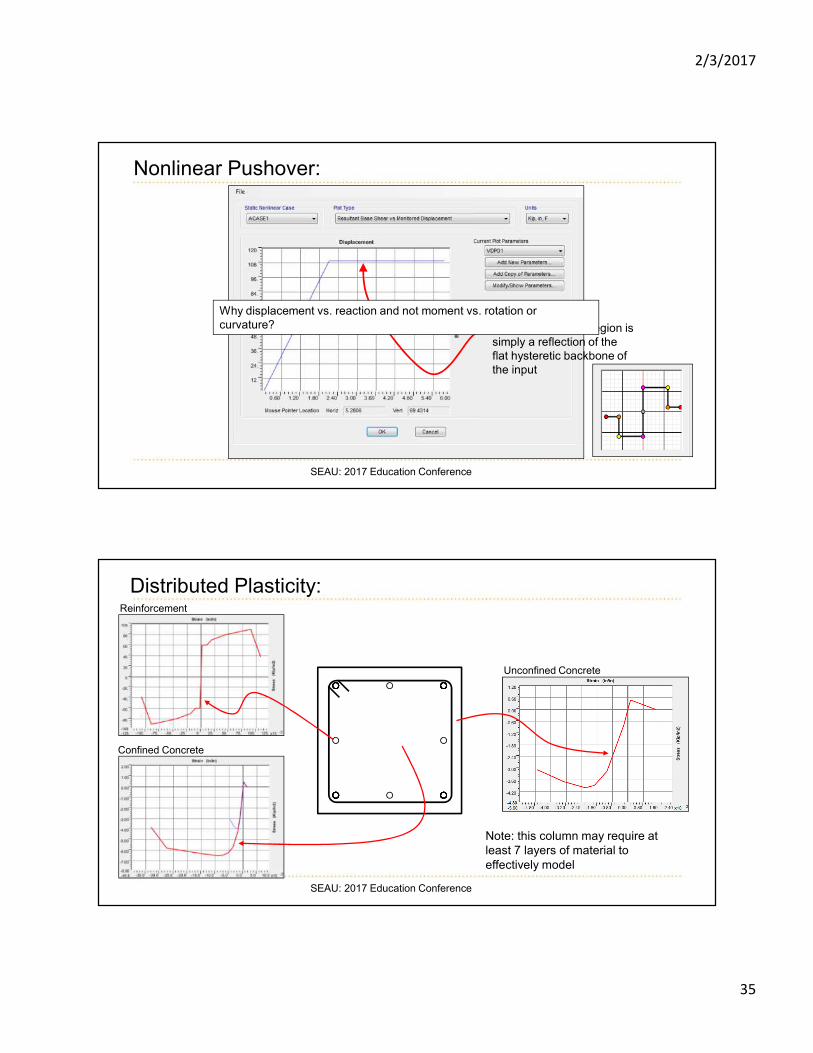
Nonlinear Pushover:
The ‘flat’ nonlinear region is simply a reflection of the flat hysteretic backbone of the input
2/3/2017
35
SEAU: 2017 Education Conference
Nonlinear Pushover:
The ‘flat’ nonlinear region is simply a reflection of the flat hysteretic backbone of the input
Why displacement vs. reaction and not moment vs. rotation or curvature?
SEAU: 2017 Education Conference
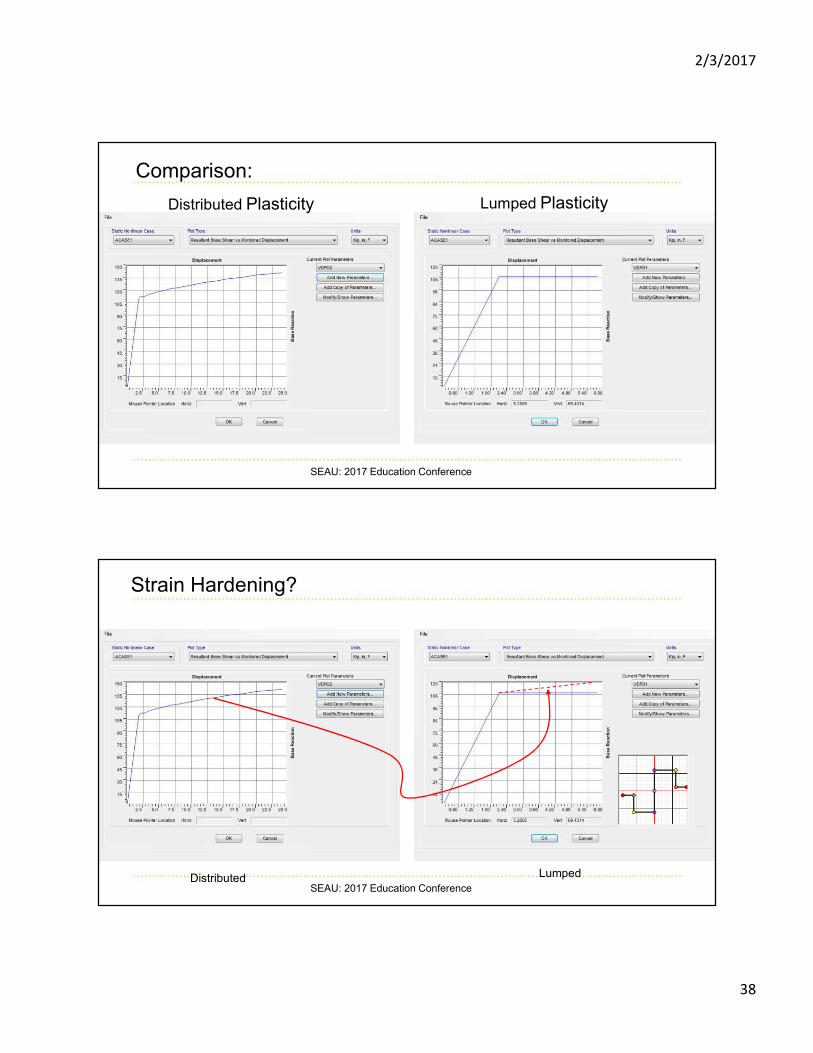
Distributed Plasticity:Reinforcement
Confined Concrete
Unconfined Concrete
Note: this column may require at least 7 layers of material to effectively model

2/3/2017
36
SEAU: 2017 Education Conference
Distributed Plasticity Example:
SEAU: 2017 Education Conference
Distributed Plasticity Example:

2/3/2017
37
SEAU: 2017 Education Conference
Distributed Plasticity Example:
SEAU: 2017 Education Conference
Distributed Plasticity Example – Pushover:
2/3/2017
38
SEAU: 2017 Education Conference
Comparison:
Distributed Plasticity Lumped Plasticity
SEAU: 2017 Education Conference
Strain Hardening?
Distributed Lumped

2/3/2017
39
SEAU: 2017 Education Conference
Comparison
Distributed Lumped
2 Min. 52 Sec. 0.14 Sec.
SEAU: 2017 Education Conference
Key Differentiators:• Time• Complexity• Project Needs• $$• Accuracy• Software
Lumped Plasticity vs. Distributed?

2/3/2017
40
SEAU: 2017 Education Conference
Nonlinear Dynamic – Distributed Plasticity
SEAU: 2017 Education Conference
Nonlinear Pushover
Can use either lumped (discrete) plasticity models, sometimes called “links” or “hinges” or the elements may be included with
specific material nonlinearities with explicit modeling using nonlinear fiber or shell type elements.

2/3/2017
41
SEAU: 2017 Education Conference
Nonlinear Pushover
Can, in more explicit terms than elastic analysis, identify and quantify specific mechanisms and the order in which they are
expected to occur.
Nonlinear Pushover Larger Application:

2/3/2017
42
Base Reaction
Roof Displacement
Nonlinear Static Analysis (Pushover)
Nonlinear Static Analysis (Pushover)

2/3/2017
43
Nonlinear Static Analysis (Pushover)
Nonlinear Static Analysis (Pushover)

2/3/2017
44
Nonlinear Static Analysis (Pushover)
Nonlinear Static Analysis (Pushover)

2/3/2017
45
Knowing the order of hinge occurrence may or may not be important, but knowing that beam hinging is likely to dominate the nonlinear behavior is important
Nonlinear Static Analysis (Pushover)
Nonlinear Static Pushover Curve
050
100150
200250300
350400
450500
0 10 20 30 40 50 60
Roof Displacement (inches)
Ba
se
Fo
rce
(k
ips
)
�� � �����������
4���
Nonlinear Static Analysis (Pushover)

2/3/2017
46
Nonlinear Static Pushover Curve
050
100150
200250300
350400
450500
0 10 20 30 40 50 60
Roof Displacement (inches)
Bas
e F
orc
e (
kip
s)
Imm
ed
iate
Occu
pan
cy
Lif
e
Safe
ty
Co
llap
se
Pre
ven
tio
n
Dam
ag
e
Co
ntr
ol
Nonlinear Static Analysis (Pushover)
SEAU: 2017 Education Conference
Nonlinear Pushover
• Can help us understand the basis behind code provisions.
• Can help us understand the consequences of element failure (e.g. brace buckling).

2/3/2017
47
SEAU: 2017 Education Conference
Nonlinear Pushover
Braced Frame – Unbalanced Forces:AISC 341-10 F1-4a, F2-3.
In ‘V’ and inverted ‘V’ configurations, beams in braced frames must account for unbalanced effects of braces reaching full yield strength and post-buckled compression strength.
SEAU: 2017 Education Conference
Frame 1 Frame 2 Frame 3
Simple Frame ComparisonsA case study in the consequences of buckling
Nonlinear Static Analysis (Pushover)

2/3/2017
48
SEAU: 2017 Education Conference
Frame 1
SEAU: 2017 Education Conference
Frame 1

2/3/2017
49
SEAU: 2017 Education Conference
Frame 1
SEAU: 2017 Education Conference
Frame 1

2/3/2017
50
SEAU: 2017 Education Conference
Frame 1
SEAU: 2017 Education Conference
Frame 1

2/3/2017
51
SEAU: 2017 Education Conference
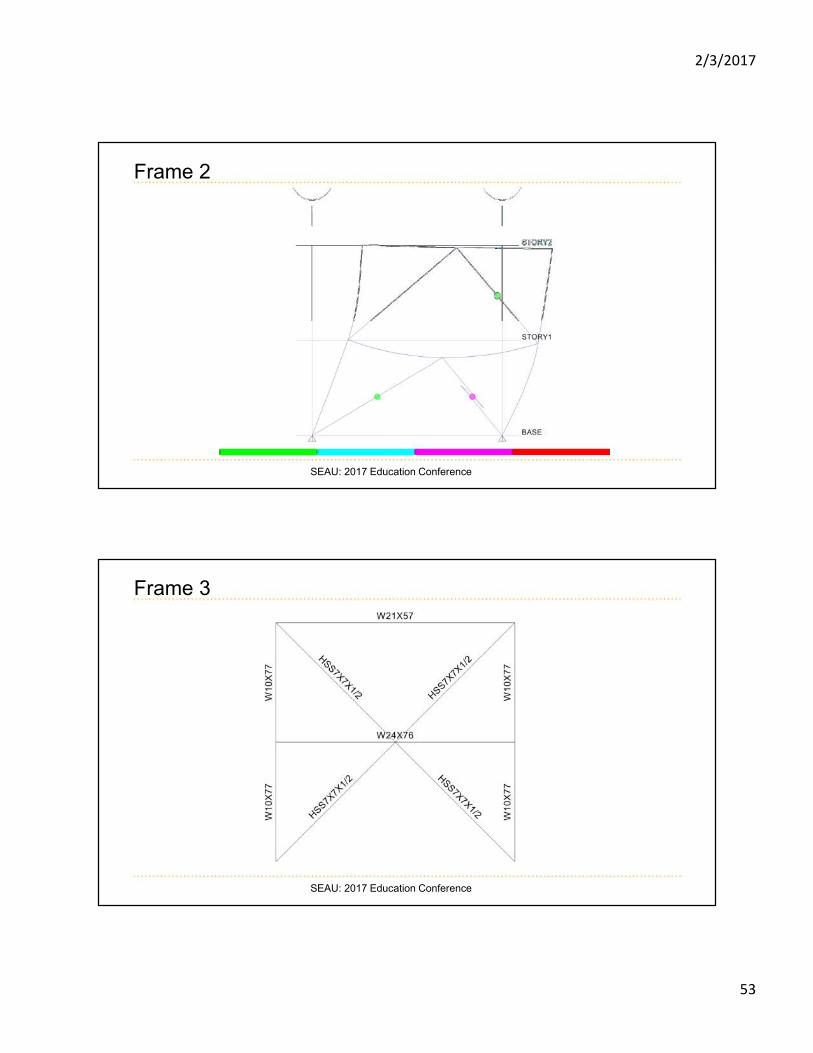
Frame 2
SEAU: 2017 Education Conference
Frame 2

2/3/2017
52
SEAU: 2017 Education Conference
Frame 2
SEAU: 2017 Education Conference
Frame 2
2/3/2017
53
SEAU: 2017 Education Conference
Frame 2
SEAU: 2017 Education Conference
Frame 3

2/3/2017
54
SEAU: 2017 Education Conference
Frame 3
SEAU: 2017 Education Conference
Frame 3

2/3/2017
55
SEAU: 2017 Education Conference
Frame 3
SEAU: 2017 Education Conference
Frame 3

2/3/2017
56
SEAU: 2017 Education Conference
Pushover Curves Superimposed
0
100
200
300
400
500
600
700
0 2 4 6 8 10 12 14
Ba
se S
he
ar
(kip
s)
Rooftop Displacement (inches)
Frame 1
Frame 2
Frame 3
1
2
3
SEAU: 2017 Education Conference
A Caveat…
While this example corroborates the requirements of AISC 341, research by Sen, Roeder, Lehman & Berman at University of Washington shows much better performance in braced frames when quasistatically loaded under a fully reversed increasing amplitude cyclical protocol…
See Structure Magazine – July 2015

2/3/2017
57
SEAU: 2017 Education Conference
Nonlinear Pushover
Strong column/weak beam:AISC 341-10 E3-4a
Requires that the sum of nominal flexural strengths of columns at a joint must be greater than the sums of the flexural strengths of the beams (with over-strength included) at the same joint.
Why?
Beam mechanisms are preferred over column mechanisms.
SEAU: 2017 Education Conference
The Stability Issue
1
P
F 2
3
Pθ2 θ3
What happens if the geometric nonlinear stiffness matrix overpowers the initial matrix?
24EI/L3 6EI/L2 6EI/L2 -6P1/5L-6P3/5L -P1/10 -P3/10
6EI/L2 8EI/L 2EI/L + -P1/10 -2P1L/15-2P2L/15 -P2L/30
6EI/L2 2EI/L 8EI/L -P3/10 -P2L/30 -2P2L/15-2P3L/15
The effects of geometric nonlinearity can become greater than the effects of strain hardening.

2/3/2017
58
SEAU: 2017 Education Conference
Pushover Analysis:
Base Reaction
Roof Disp.
0
50
100
150
200
250
300
350
400
0 2 4 6 8 10B
ase S
hear
Rooftop Displacement
Base Shear vs. Displacement
SEAU: 2017 Education Conference
The Stability Issue
What is happening here?:
0
50
100
150
200
250
300
350
400
0 2 4 6 8 10
Base S
hear
Rooftop Displacement
Base Shear vs. Displacement
W/O P-delta
W/ P-delta
Residual column forces create reduced stiffness which creates increased displacements which create even more residual column forces.
This is a consequence of columns which yield in flexure before beams yield in flexure.
1
P
F2
3
Pθ2 θ3
Geometric nonlinearity
controls over strain hardening

2/3/2017
59
SEAU: 2017 Education Conference
Problems with Beam/Column Strength Ratios
Base Reaction
Roof Disp.
0
50
100
150
200
250
300
350
400
0 2 4 6 8 10B
ase S
hear
Rooftop Displacement
Base Shear vs. Displacement
W/O P-delta
W/ P-delta
SEAU: 2017 Education Conference
Nonlinear Pushover
A more elaborate demonstration.
Nonlinear Pushover can help us understand the effectiveness of a reinforcement scenario…
2/3/2017
60
SEAU: 2017 Education Conference
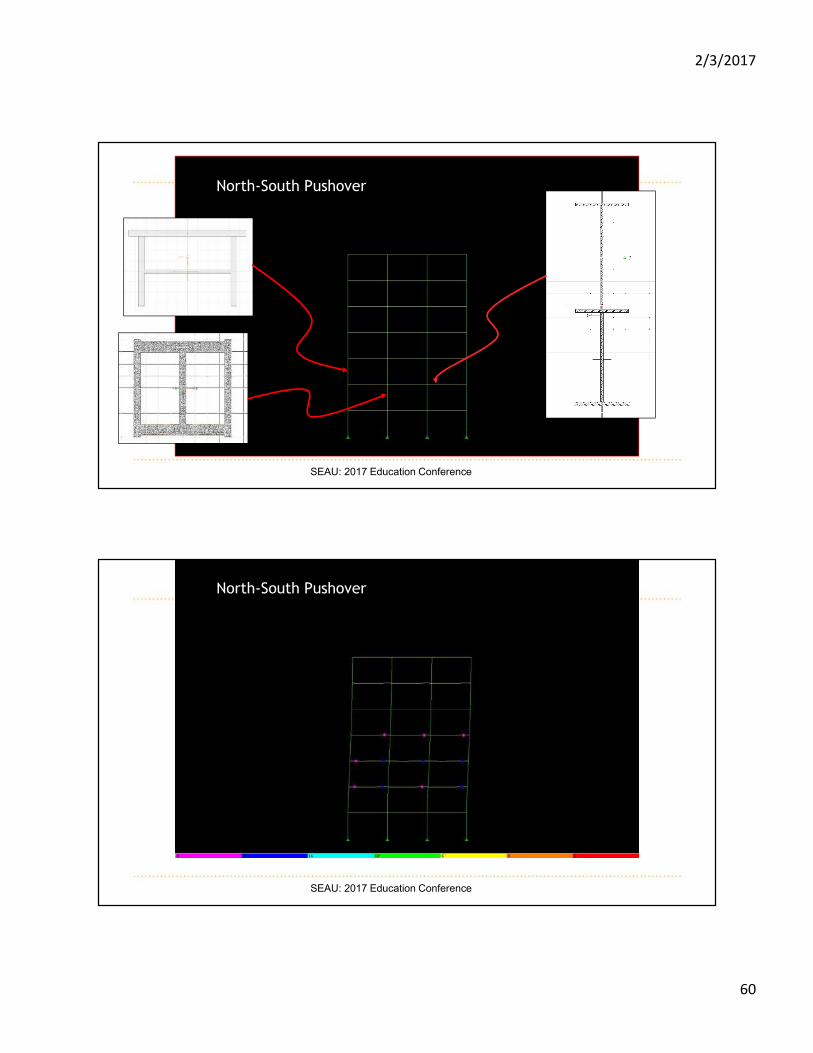
North-South Pushover
SEAU: 2017 Education Conference
North-South Pushover

2/3/2017
61
SEAU: 2017 Education Conference
North-South Pushover
SEAU: 2017 Education Conference
North-South Pushover

2/3/2017
62
SEAU: 2017 Education Conference
North-South Pushover
SEAU: 2017 Education Conference
North-South Pushover
2/3/2017
63
SEAU: 2017 Education Conference
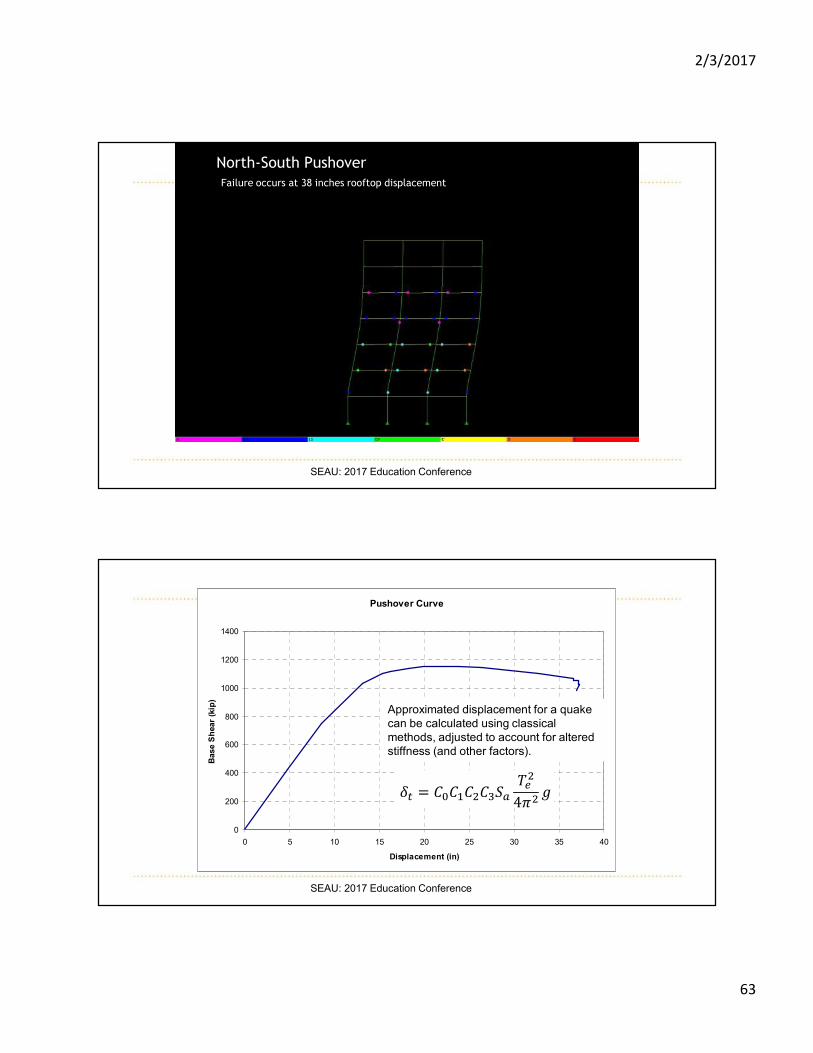
North-South Pushover
Failure occurs at 38 inches rooftop displacement
SEAU: 2017 Education Conference
North-South Pushover Curve
Pushover Curve
0
200
400
600
800
1000
1200
1400
0 5 10 15 20 25 30 35 40
Displacement (in)
Base S
hear
(kip
)
Approximated displacement for a quake can be calculated using classical methods, adjusted to account for altered stiffness (and other factors).
�� � �����������
4���

2/3/2017
64
SEAU: 2017 Education Conference
Nonlinear Pushover
Can help us understand alternate load paths that may develop as members are pushed to failure…
SEAU: 2017 Education Conference
Nonlinear Pushover
Consider a multi-tiered braced frame with pseudo-static lateral forces:

2/3/2017
65
SEAU: 2017 Education Conference
Nonlinear Pushover
Member forces based strictly upon the input loads would be:
Do these forces really reflect the design level earthquake?
SEAU: 2017 Education Conference
What are the consequences of braces buckling in compression?
Nonlinear Pushover

2/3/2017
66
SEAU: 2017 Education Conference
A typical brace hysteretic backbone:
What happens in the frame as these axial mechanisms begin to form?
-400
-300
-200
-100
0
100
200
300
400
500
600
-2 -1 0 1 2 3 4 5Axi
al F
orc
e (
kip
)
Axial Deformation (in)
Brace Hysteretic Backbone
Nonlinear Pushover
SEAU: 2017 Education Conference
-400
-300
-200
-100
0
100
200
300
400
500
600
-2 0 2 4 6
Axi
al F
orc
e (
kip
)
Axial Deformation (in)
Brace Hysteretic Backbone
Concept courtesy of Brent Maxfield, SE
Nonlinear Pushover

2/3/2017
67
SEAU: 2017 Education Conference
A ‘pseudo’ nonlinear approach?
Nonlinear Pushover
SEAU: 2017 Education Conference
Can help us demonstrate the validity of a new approach…
Nonlinear Pushover

2/3/2017
68
Bennett Federal BuildingSalt Lake City

2/3/2017
69
Buckling Restrained Brace Concept
Images Courtesy of Corebrace
tension
compression
Axial force-displacement behavior
unbondedbrace
typicalbuckling
brace
displacement
-80
-60
-40
-20
0
20
40
60
80
-3 -2 -1 0 1 2 3
Str
ess
(k
si)
Strain (%)
Unbonded Brace Hysterisis Backbone
Fye=51.7 ksi
Fmax=62.8 ksi
Fye=-51.7 ksi
Fmax=-65.2 ksi
TENSION
COMPRESSION
Intermediate
Local buckling less criticalthan inelast ic buckling
-60
-40
-20
0
20
40
60
80
-1.5 -1 -0.5 0 0.5 1 1.5 2 2.5 3 3.5
Str
ess
(ksi
)
Strain (%)
Special Concentric Brace Hysterisis Backbone
TENSION
COMPRESSION
Fye=55 ksi
Fmax=68.8 ksi
27.5 ksi
-42.24 ksi
-8.45 ksi
Buckling Restrained Brace Concept

2/3/2017
70

2/3/2017
71

2/3/2017
72

2/3/2017
73

2/3/2017
74
05000
100001500020000250003000035000400004500050000
0 5 10 15
Base S
hear
-kip
s
Roof Displacement - Inches
Bennett Federal BuildingN-S Push-over V vs Roof Displacement
SCBF
BRBF
BRBF Braces Begin to Yield
SCBF Braces Begin to Buckle
Nonlinear Pushover

2/3/2017
75
SEAU: 2017 Education Conference
Nonlinear Pushover
Can help us understand what happens with combinations of systems in a more explicit manner…
SEAU: 2017 Education Conference
Horizontal Combinations
In the same direction, along the same line - Shear Wall and Moment frame:
12’
20’20’
w18x60
w1
4x1
20
w1
4x1
20
strut
12” thick wallf’c=4,000psiI = 0.35Ig
100k
w18x60
0.98k0.98k 98.04k
2/3/2017
76
SEAU: 2017 Education Conference
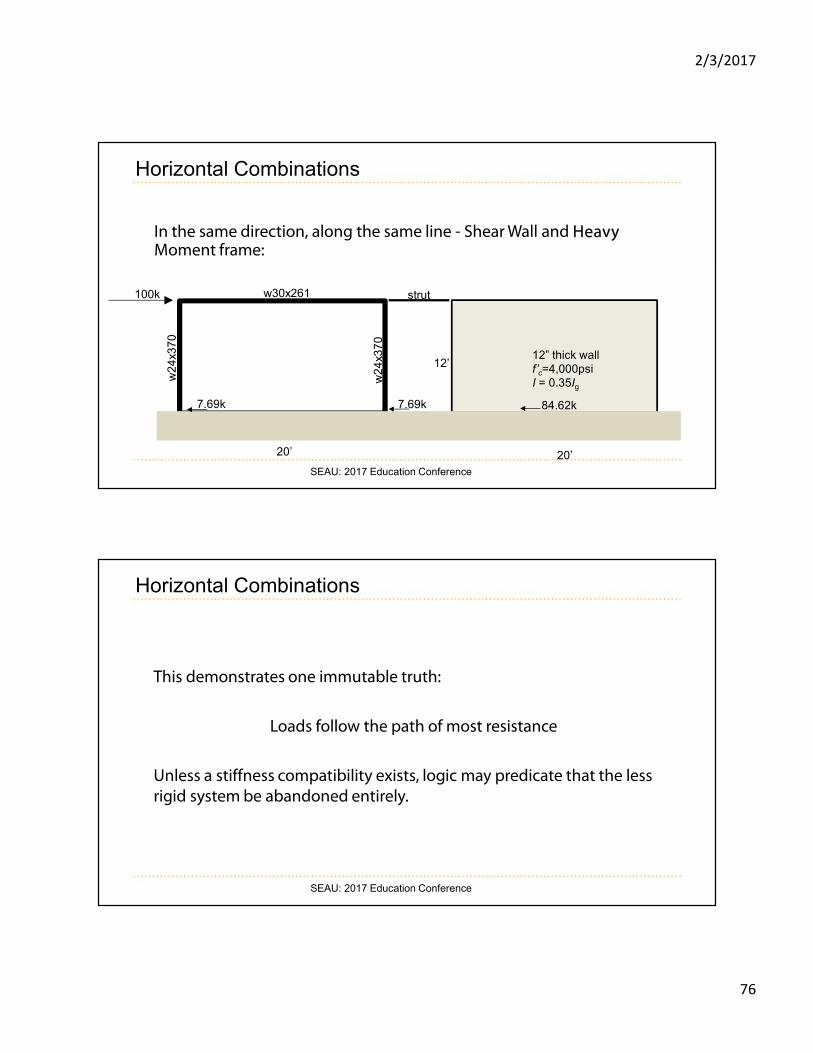
In the same direction, along the same line - Shear Wall and HeavyMoment frame:
12’
20’20’
w30x261
w2
4x3
70
w2
4x3
70
strut
12” thick wallf’c=4,000psiI = 0.35Ig
100k
7.69k7.69k 84.62k
Horizontal Combinations
SEAU: 2017 Education Conference
This demonstrates one immutable truth:
Loads follow the path of most resistance
Unless a stiffness compatibility exists, logic may predicate that the less
rigid system be abandoned entirely.
Horizontal Combinations
2/3/2017
77
SEAU: 2017 Education Conference
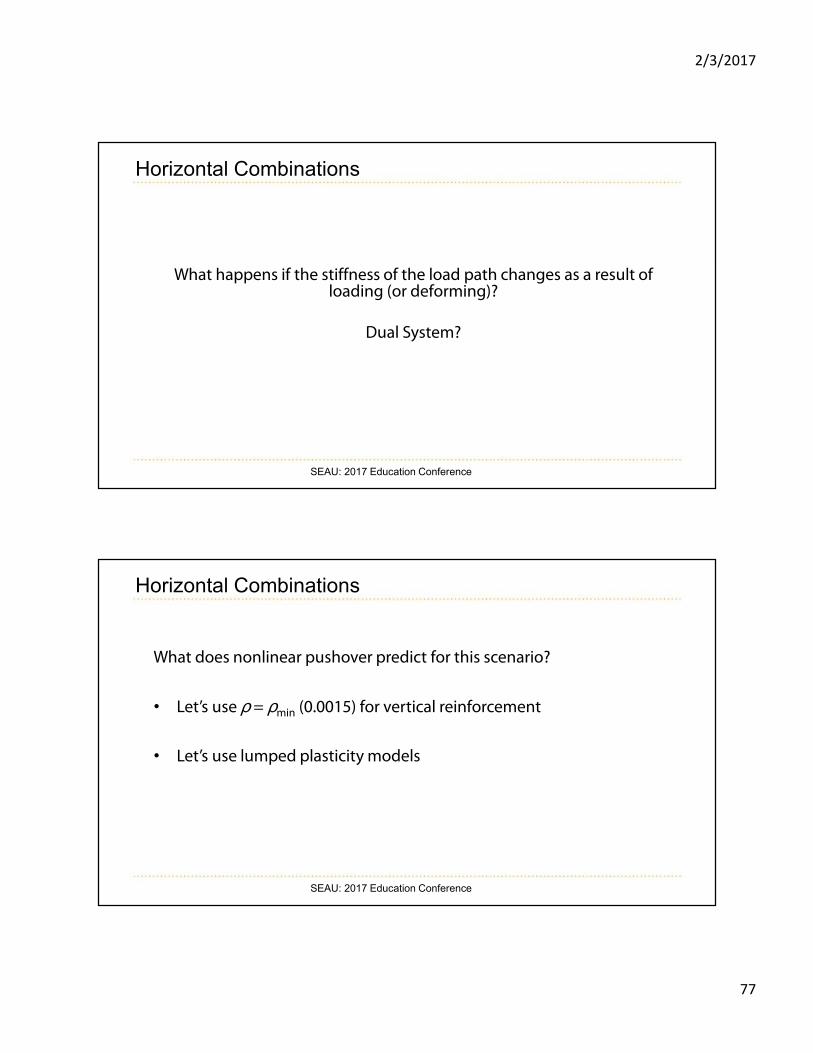
What happens if the stiffness of the load path changes as a result of loading (or deforming)?
Dual System?
Horizontal Combinations
SEAU: 2017 Education Conference
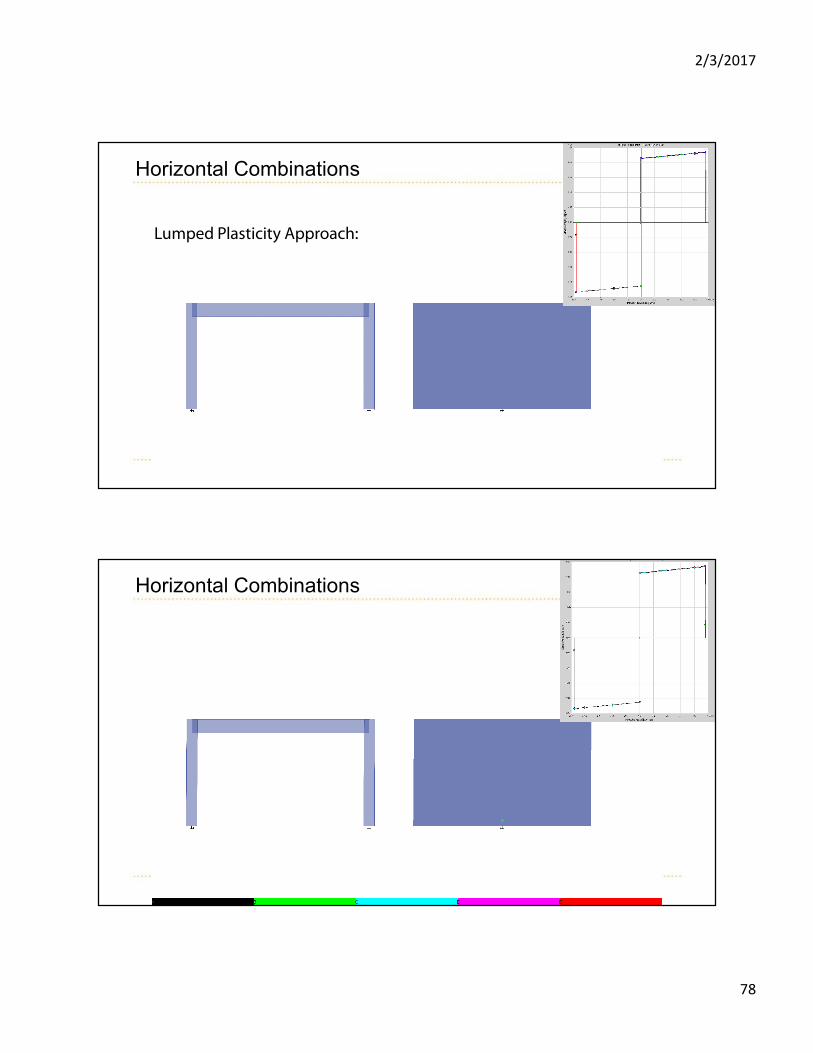
What does nonlinear pushover predict for this scenario?
• Let’s use ρ = ρmin (0.0015) for vertical reinforcement
• Let’s use lumped plasticity models
Horizontal Combinations
2/3/2017
78
SEAU: 2017 Education Conference
Lumped Plasticity Approach:
Horizontal Combinations
SEAU: 2017 Education Conference
Horizontal Combinations

2/3/2017
79
SEAU: 2017 Education Conference
Horizontal Combinations
SEAU: 2017 Education Conference
Horizontal Combinations

2/3/2017
80
SEAU: 2017 Education Conference
Horizontal Combinations
SEAU: 2017 Education Conference
Horizontal Combinations

2/3/2017
81
SEAU: 2017 Education Conference
Horizontal Combinations
SEAU: 2017 Education Conference
Horizontal Combinations

2/3/2017
82
SEAU: 2017 Education Conference
Horizontal Combinations
SEAU: 2017 Education Conference
0
100
200
300
400
500
600
0 1 2 3 4 5 6 7
Base S
hear
(kip
)
Displacement (in)
Pushover Curve
Horizontal Combinations

2/3/2017
83
SEAU: 2017 Education Conference
Nonlinear pushover demonstrates that the concrete wall does virtually all of the work and must literally become compromised before the steel frame begins to act.
Unless a stiffness compatibility exists, logic may predicate that the less rigid system be abandoned entirely.
Horizontal Combinations
SEAU: 2017 Education Conference
Another Approach?
Use of distributed plasticity elements in lieu of lumped plasticity…
Account for nonlinearity of materials instead of nonlinearity of sections…
Horizontal Combinations

2/3/2017
84
SEAU: 2017 Education Conference
concrete
reinforcement
12” thick wall with ρvert = 0.0015
Horizontal Combinations
SEAU: 2017 Education Conference
Stress in Reinforcement
Stress in Concrete
Horizontal Combinations

2/3/2017
85
SEAU: 2017 Education Conference
Stress in Reinforcement
Stress in Concrete
Horizontal Combinations
SEAU: 2017 Education Conference
Stress in Reinforcement
Stress in Concrete
Horizontal Combinations

2/3/2017
86
SEAU: 2017 Education Conference
Stress in Reinforcement
Stress in Concrete
Horizontal Combinations
SEAU: 2017 Education Conference
Stress in Reinforcement
Stress in Concrete
Horizontal Combinations

2/3/2017
87
SEAU: 2017 Education Conference
0
50
100
150
200
250
300
350
400
0 1 2 3 4 5 6 7
Base S
hear
(kip
)
Displacement (in)
Pushover Curves
Horizontal Combinations
SEAU: 2017 Education Conference
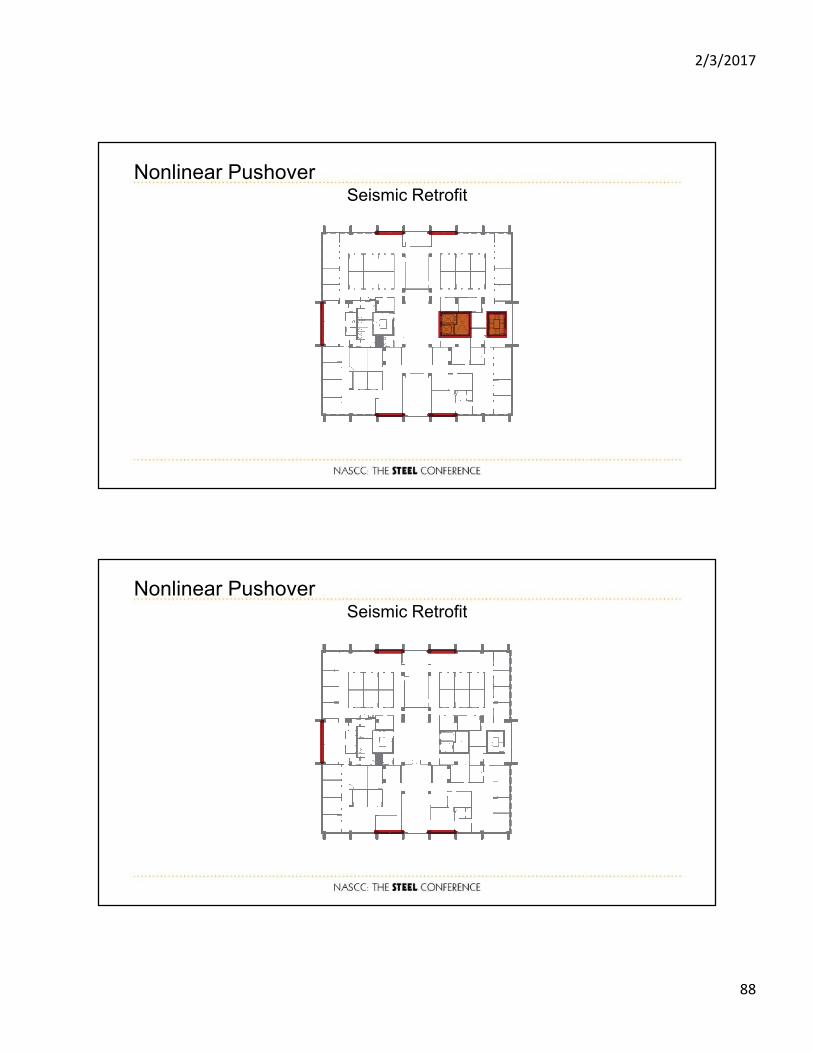
Nonlinear Pushover
Can help us demonstrate that a system or geometry can work.
Large scale example – Combination of Systems
2/3/2017
88
Seismic Retrofit
Nonlinear Pushover
Nonlinear PushoverSeismic Retrofit

2/3/2017
89
Case Study – College of Nursing
Case Study – College of Nursing

2/3/2017
90
Case Study – College of Nursing
Seismic Retrofit
Pushover demonstrated that the existing core walls could satisfy performance objectives while working in concert with new braced frames.
Nonlinear Pushover

2/3/2017
91
SEAU: 2017 Education Conference
10. Nonlinear Pushover Analysis Limitations…
• Does not directly account for cyclic behavior.
• Does not adequately capture higher mode effect.
• Does not have an explicit accounting for displacement.
• Does not account for highly transient effects (near field,
unidirectional pulse).
• No accounting for cumulative ductility or cumulative
energy.
-0.6
-0.4
-0.2
0
0.2
0.4
0.6
0.8
1
0 10 20 30 40 50 60
Time (sec)
Accele
ration (g)
-1
-0.8
-0.6
-0.4
-0.2
0
0.2
0.4
0.6
0.8
1
0 10 20 30 40 50 60 70 80
Time (sec)
Accele
ration (g)
SEAU: 2017 Education Conference
10. Nonlinear Time History – Quick Summary

2/3/2017
92
SEAU: 2017 Education Conference
Nonlinear Dynamic Analysis - MF
SEAU: 2017 Education Conference
Nonlinear Dynamic Analysis - MF
-20000
-15000
-10000
-5000
0
5000
10000
15000
20000
-0.05 -0.04 -0.03 -0.02 -0.01 0 0.01 0.02 0.03 0.04 0.05
Beam Rotation (rad)
Beam
Fo
rce
(kip
-in
)
Area within the enclosed force vs. displacement loop is energy dissipated

2/3/2017
93
SEAU: 2017 Education Conference
Nonlinear Dynamic Analysis – BF/BRBF
Red = Yielding and/or Buckling
SEAU: 2017 Education Conference
Keeping it Simple?
Successful & efficient nonlinear modeling requires a targeted
approach.

2/3/2017
94
SEAU: 2017 Education Conference
So, why not use Nonlinear Time History?
• Time• $$• Ground Motions• Owner Objectives• Computing Power• Review
SEAU: 2017 Education Conference
Software
• Hand 1.0 (by Ron Hamburger)• SAP 2000 Ultimate• ETABS Ultimate• Perform 3D• STAAD Pro• Opensees (Open System for Earthquake Engineering Simulation,
NEES)• ANSYS• LS Dyna• ANSR (proprietary)
• RISA?

2/3/2017
95
SEAU: 2017 Education Conference
The End