user's manual: inspection and rating of steel … · report documentation page emb no 07040?rr...
TRANSCRIPT

•.- 0REPAIR, EVALUATION, MAINTENANCE, AND
REHABILITATION RESEARCH PROGRAM
US ~ AryCrs
o Engineers TECHNICAL REPORT REMR-OM-3
USER'S MANUAL: INSPECTION AND RATING OFSTEEL SHEET PILE STRUCTURES
by
Lowell GriemannJames Stecker
ENGINEERING RESEARCH INSTITUTESDT .Iowa State UniversityD-- C Ames, Iowa 50011
FECTE0I UJUL 2 41989
~JUNE 1989
Final Report
~Approved For Public Release; Distribution Unlimited
~Prepared for DEPARTMENT OF THE ARMYUS Army Corps of EngineersWashington, DC 20314-1000
Under Civil Works Research Work Unit 32280
Monitored by Engineering and Materials DivisionU.S. Army Construction Engineering Research Laboratory
P.O. Box 4005, Champaign, Illinois 61824-4005
K , '-

The following two letters used as part of the number designating technical reports of research published under theRepair, Evaluation, Maintenance, and Rehabilitation (REMR) Research Program identify the problem area underwhich the report was prepared:
Problem Area Problem Area
CS Concrete and Steel Structures EM Electrical and Mechanical
GT Geotechnical El Environmental Impacts
HY Hydraulics OM Operations Management
CO Coastal
Destroy this report when no longer needed. Do not returnit to the originator.
The findings in this report are not to be construed as an officialDepartment of the Army position unless so designated
by other authorized documents
The contents of this report are not to be used foradvertising, publication, or promotional purposes.Citation of trade names does not constitute an officialendorsement or approval of the use of such commercial
products.
COVER PHOTOS:
TOP - Lock and Dam -17 on the Mississippi River at New Boston, IL. Upper transition wall under repair.
BOTTOM - Lock and Dam -3 on the Monongahela River. Intermediate lower guidewall.

1:NUCLASS IF I ED,,:.-R 'y CQA!SS.;FCAroN OF rHIS PAGE
sot.' Approved
REPORT DOCUMENTATION PAGE eMB No 07040?RREI p Dare fian0 ?986
'a - SEC R V
C ASSr',CA-'ON 1b RESTRICTIVE MARKiNGS
i'nc lassif ied
" _ .A C.ASS CA' ON Au',ORrY 3 DISTRIBuTiON AVAILABILiTY OF REPORT
Approved For Public Release; Distribution-. 'O DOWNGRADING SCHEDULE Unlimited
- C'qV' N ORGA 'NA ON REPORT V.M8ER(S) S MONTOR.NG ORGAN'ZAr ON REPORT NJMBER6S)
REN, R- vO- ; RLMR- OM-3
;E-7,FORV %G ORCA% ZAT ON 6b OFiCE SYMRO3 7. NAME O MON OR NC. ORGAN!gA'iON
:nerin?, esearch (If apphcable) U.S. Army Construction Engr Research
__ __ __ __ __ __ __ I Laboratory, :-i-') C -V 5rare and ZiPCoe) "b ADtiI-S, ty. State and ZIP Code)
, , _3(0 i P.O. Box /400
Campaig, IL 1182 - 4- 003_,
Q ' D li
3 'Ft'CE S~rv'BOL 9 PFCCt. RE'.1'
r iNSTR..% ' ID AN',FIC4T ON %UV: E-
-; A I f anpicab/e,
__._.__-, CECW-tN4 jCivil Works Research Work Unit 32280
i :c > j iod IP NJe. '1 $Ou"CE Ci P:JF, DING NMBtRS
e~ta' e* . A IPRO RAM PROAECT TAV ORK NtSt A314-1 ELEMENT NO NO N : CCESSO0. %0
, - ,- U oCrt ar. lnsprt o. n Rtngo
Ls ialnuai; Inspcction and Rating of Steel Sheet 2Pile Structures (U)
; a, LweIl; Szecker, JamesM-vE vERD ... l a E O REORT (Year Month. Day) f15 PAGE COUNT
S F ,M TO ..... 1939, JL ,e I 112
,' : %%l', %O'a,)NN A report of the Operations Management problem area of the Repair,N L-uaior., Yainteaance, and Rehabilitation (REMR) Research Program. Available from
2Ur .hnicai information Service, 5285 Port Royal Road, Springfield VA 22161.v-SS r :3DE | 8 SuB;EC7
rtERMS (Continue on revefse if necessary and identify by block number)
S -.D 3RoL ' I' .KRO,;P steel inspectioni~~~ " '3ple structures
repair
, ,.Con nue on ,ve,se if necessary and identi y by lock number)
For much of its early history the U.S. Army Corps of Engineers was
Iheaviv involved in the design and construction of new facilities, but now
:ye mission of the Corps is shifting from construction to the maintenance of
existing iaciLities. The Corps has addressed its changing role by institut-
ijg a Repair, Evaluation, Maintenance, and Rehabilitation (REMR) program. As
1 part of this program, a project team at Iowa State University has undertaken
a research effort that focuses on the evaluation and repair of the steel sheet
pile structures within the Corps' civilian projects. These structures do not
(Continued)
''R 6 J, .'A B ' -- - A s'RVPA( 21 ABSTRACT SiCuRi7 CLASSFCATON
, 7 ,, Fi M ": %. E as SQ C Enr,( , ' A S Unclassified, , t N , A. D22b rELEPHOE (In(lude Area Codp) 2 ' o Il .E 'YMqO
,r W. Wnk, 1(217)352-6511 (ext3531
DD FORM 1473, " " . ,n'aybeuwd It' ha. ted ,;( , AV, (A ON ' S ' .A], oter edtons are ,h.i.,et UNCLASSIFIED
UNCLASSIFIED
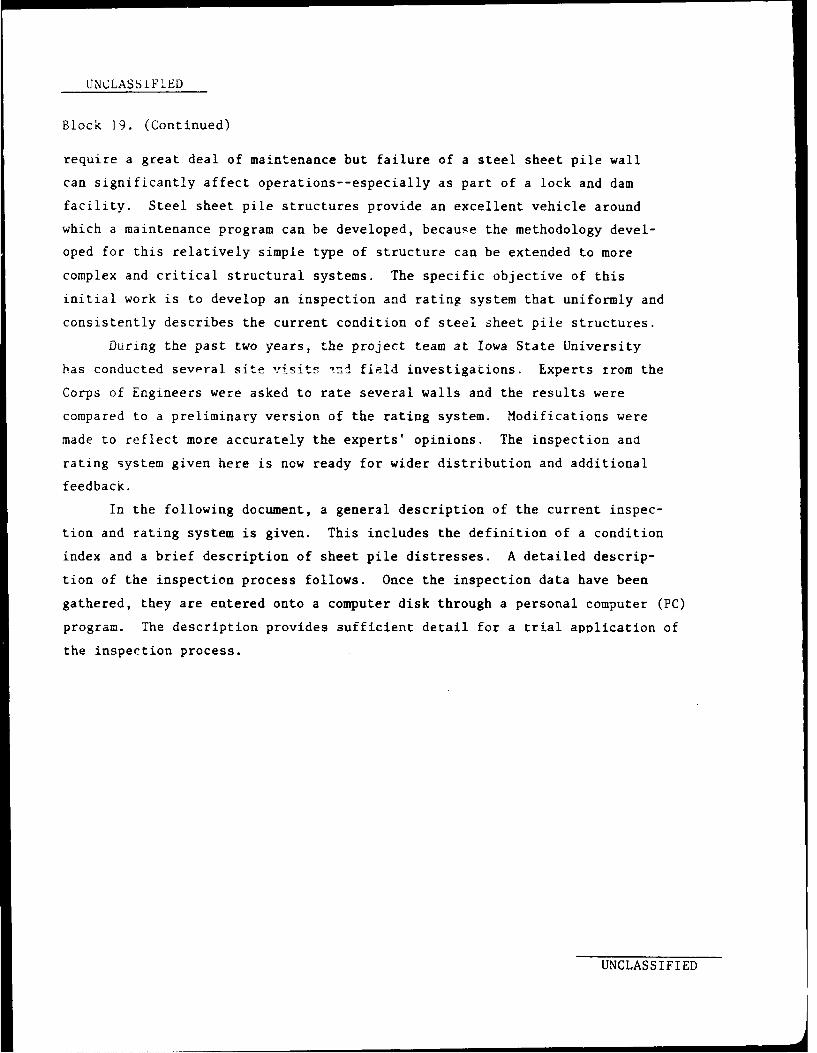
Block 19. (Continued)
require a great deal of maintenance but failure of a steel sheet pile wall
can significantly affect operations--especially as part of a lock and dam
facility. Steel sheet pile structures provide an excellent vehicle around
which a maintenance program can be developed, because the methodology devel-
oped for this relatively simple type of structure can be extended to more
complex and critical structural systems. The specific objective of this
initial work is to develop an inspection and rating system that uniformly and
consistently describes the current condition of steel sheet pile structures.
During the past two years, the project team at Iowa State University
has conducted sevpral site visits -n! field investigations. Experts trom the
Corps of Engineers were asked to rate several walls and the results were
compared to a preliminary version of the rating system. Modifications were
made to reflect more accurately the experts' opinions. The inspection and
rating system given here is now ready for wider distribution and additional
feedback.
In the following document, a general description of the current inspec-
tion and rating system is given. This includes the definition of a condition
index and a brief description of sheet pile distresses. A detailed descrip-
tion of the inspection process follows. Once the inspection data have been
gathered, they are entered onto a computer disk through a personal computer (PC)
program. The description provides sufficient detail for a trial application of
the inspection process.
UNCLASSIFIED

PREFACE
The study reported herein was authorized by Headquarters, U S Army
Corps of Engineers (HQUSACE), under Civil Works Research Work Unit 32280,
"Development of Uniform Evaluation for Procedures/Condition Index for
Deteriorated Structures and Equipment," for which Mr. Anthony M. Kao is
Principal Investigator. This work unit is part of the Concrete and Steel
Structures Problem Area of the Repair, Evaluation, Maintenance, and
zehabi itation (REMR) Research Program sponsored by HQUSACE. Mr. Jim Crews
(CECW-OM) is the REMR Technical Monitor for this work.
Xr. Jesse A. Pfeiffer, Jr. (CERD-C) is the REMR Coordinator at the
Dir-ctorae of Research and Development, HQUSACE; Mr. Jim Crews and Dr. Tony
C. (CEEC-ED) serve as the REMR Overview Committee; Mr. William F. McCleese
fCFWnS-SC-A), U S Army Engineer Waterways Experiment Station, is the REMR
Prcegr i Manager; DL. Kao is ais3 the Problem Area Leader for the Operations
Manpgemen problem area.
The study was performed by the College of Engineering, Iowa State
University, under contract to the U.S. Army Construction Engineering Research
:aboratory (USA-CERL). Principal Investigators for Iowa State University were
Messrs. Lowell Creimann and James Stecker.
T.e study was conducted under the general supervision of Dr. R. Quat-
Lrone, Chief of the Engineering and Materials (EM) Division of USA-CERL, and
under the direct supervision of Mr. Anthony M. Kao, EM, who was the
Contracting Officer's Representative.
COL Carl 0. Magnell was Commander and Director of USA-CERL and Dr. L. R.
Shaffer was Technical Director.
hI
1 i
' -- , - m mnlnmmnnmn nnmm mnnmmm l mm m~l mam N~lN Io n olC

CONTENTSPage
PREFACE ........................................................... ILIST OF FIGURES................................................... 3
LIST OF TABLES.............................................. 4CONVERSION FACTORS, NON-SI TO SI (METRIC) UNITS OF MEASUREMENT ............. 5PART I: INTRODUCTION.................................................... 6
Background........................................................... 6Objectives........................................................... 7Overview and Scope................................................... 7Mode of Technology Transfer.......................................... 8
PART II: OVERVIEW OF INSPECTION AND RATING PROCEDURES................... 9
Steel Sheet Pile Component Identification........................... 9Inspection Concepts.................................................. 13Condition Index...................................................... 14Steel Sheet Pile Distresses......................................... 18
PART II: THE INSPECTION FORM AND EVALUATION MODEL....................... 19
Overview of the Inspection Form..................................... i9Computer-Based Model................................................. 46
PART IV: FIELD TESTING............................................ ..... 50
Descriptions...................... .................................. 50Expert Rating..................................................... 56
PART V: SUMMARY AND CONCLUSIONS........................................ 63
Summary............................................................. 63Conclusions and Recommendations........................... ...... 64
REFERENCES......................................................... 65
APPENDIX A: BASIC DATA................................. .. . . . .. . . .... Al
APPENDIX B: STRUCTURAL SAFETY............................ . ....... Bi
Structural Analysis............................................... BlSafety Condition Index.............................................. B8
APPENDIX C: SERVICEABILITY AND SUBJECTIVE SAFETY ................... Cl
APPENDIX D: DISTRESS DESCRIPTIONS AND X ............. *............... DI
Distress Code 1--Misalignment.............................. DlDistress Code 2--Corrosion ................ .............. D3Distress Code 3--Settlement .......... .. . ... .. .. . ... .. . ........... D9
Distress Code 4--Cavity Formation ................................ DliDistress Codes 5-8--Interlock Separation, Holes, Dents, Cracks .... D12
APPENDIX E: EXPERT RATINGS FOR CHICAGO FIELD TEST ...................... El
2

LIST OF FIGURES
No. Page
I Lock and dam facility.............................. ................ 102 Terminal facility................................................... 103 Typical components of steel sheet pile structures.................. 114 Cellular walls.................... .............. ............ ...... 145 Inspection form and comments ........................................ 226 Summary report...................................................... 487 Wall AandB........................................................ 518 Wall C.............................................................. 519 Wall D..................... ........................................ 53
10 Wall E............ ................................................. 53i1 Wall F and C...................... ............................... 55
12 Thomas J. O'Brien lock wall............................ ............ 513 Thomas J. O'Brien lower guide wall................... ............. 5714 Misalignment raing comparison with experts ......................... 5815 Corrosion rating comparison with experts........................... 58i6 Settlement rating comparison with experts...................... ... 59
17 Cavity rating comparison with experts..............................9Interlozk 3,eparation rating comparison with experts................ 60
19 qole rating comparison with experts................................ 6010 Dent ratingcomparison with experts................................ 6121 Crack rating comparison with experts............................... 6122 Wall subjective condition index rating comparison with experts 62B1 Anchored wall design by equivalent bearn method (granular soil) B232 Cantilever wall..................................................... 3333 Failure modes for cellular structures.............................. B7B4 Water level worst case .............................................. B9B5 Relationship between factor of safety and safety condition
index............................................................ BiOCl Subjective condition index related to xiXx.................... C2C2 Weight adjustment factor for subjective condition index ............ C4DI Causes of misalignment............................................. D2D2 Zones of corrosion................................................. D5D3 Photos of levels of corrosion in atmospheric zone....--.........D6El Misalignment condition index by experts............................ E2E2 Corrosion condition index by experts............................... E2E3 Settlement condition index by experts ............................. E3E4 Cavity condition index by experts.................................. E3E5 InterLock separation condition index by experts.................... E4E6 Hole condition index by experts.................................... E4E7 Dent condition index by experts........................... ......... E5E8 Crack condition index by experts................................... E5E9 Overall wall condition index by experts............................ E6
3

LIST OF TABLES
No. Page
1 Condition Index Scale .................... ...................... 66
2 Condition Index Zones ............................................ 66
3 Distresses in Steel Sheet Pile Structures ........................ 67
4 Main Menu ........................................................ 67
5 Wall Evaluation Form for SSP Inspection Field Test ............... 68
B1 Assumed Properties of Soil ...................................... B5
Dl Xmax Values for Misalignment ..................................... D4
D2 Levels of Corrosion .............................................. D6
D3 Maximum Limits for Settlement .................................... DI0
D4 Maximum Volume Limits for Cavities ............................... D12
D5 Current Weighting Factors for Distresses for Eq (C.5) ............ D14
El Average Weighting Factors by Experts ............................. El
4

CONVERSION FACTORS, NON-SI TO SI (METRIC)
UNITS OF MEASUREMENT
Non-SI units of measurement used in this report can be converted to SI
(metric) units as follows:
Multiply By__ To Obtain
degrees 0.0174533 radians
cubic feet (ft3 ) 0.0283 cubic metres
feet 0.3048 metres
inches 25.4 millimetres
pounds (force) 4.448222 newtons
pounds (force) per square foot 47.88026 pascals
pounds (furce) per square inch 0.006894757 megapascais
ourids (mass) per cubic foot 16.01846 kilograms percubic metre
5

USER'S MANUAL: INSPECTION AND RATING OF
STEEL SHEET PILE STRUCTURES
PART I: INTRODUCTION
Background
1. The U S Army Corps of Engineers has acquired a large inventory
of civilian work projects over the past 100 years. For much of this time
the Corps was heavily involved in the design and construction of new facili-
ties, such as locks and dams on the navigable inland waterways and coastal
systems, and power generation. Recently, the mission of the Corps has been
shifting from the construction of new facilities to the maintenance of exist-
ing facilities. Several factors have prompted this shift: many existing
structures are nearing the end of their design life and fewer opportunities
for expansion of Corps projects are available. The Corps has addressed its
changing role by instituting a Repair, Evaluation, Maintenance, and Rehabili-
tation (REMR) program. As the name implies, there are several aspects to the
general topic of maintenance. To some extent, each aspect requires the
development of a new technology and methodology.
2. As a part of this program, a project team at Iowa State University
has undertaken a research effort that focuses on the evaluation and repair of
the steel sheet pile structures within the Corps' civilian projects. Steel
sheet pile structures are certainly not the most critical items in a lock and
dam facility. These structures, which have a long design life and are not a
Dart of the operating machinery of the lock and dam facility, do not require
a great deal of maintenance. On the other hand, failure of a steel sheet
pile wall can significantly affect operations--especially as part of a lock
and dam facility. As such, these structures provide an excellent vehicle
around which a maintenance program can be developed. The methodology
developed for this relatively simple type of structure can be extended to
more complex and critical structural systems.
3. In the overall scheme of REMIR, the steel sheet pile work will be
coupled with studies on other components to describe the condition of the
entire lock and dam facility. At least on a theoretical basis, the condition
information can be fit with concepts of life-cycle costs (and many other
factors) to assess priorities and to plan long-term maintenance.
6

Objectives
!..e obiectives of this work are twofold:
d. To develop a uniform procedure to describe the current condi-
tion of steel sheet pile structures.
b. To develop guidelines for the repair of these structures.
These objectives are being accomplished over a period of several years. The
t ,cus ut this users' guide is the first objective: to develop an inspection
-di rting system that uniformly and consistently describes the current con-
diti-o of steel sheet pile structures. Work on the second objective has
hequn. A prtliminary set of repair guidelines has been collected. It is
premituiie to report on these suggestions until they have been mcrte thoroughly
,evi,,,i by experts in the field.
Ovurviv_ and Scope
,. -ur:ni trie past A nears, several meetirgs have been held between,rps p'rsonnel, ISU persornci, and others. The project team at Iowa State
,ivesitv fhas conducted several site visits and field investigations. A
f vi1 trip was conducted in the Chicago area in July, 1987. Experts from the
Corps ut Engtrineers were asked to rat' nine walls. The results were compared
to a priminary version of the rating system and modifications were made to
, ot (iore accurately the experts' opinion. In this users' guide, the
, rrenL version of the inspection and rating system is described. The
!msLpction and rading system is now ready fur wider distribution. Feedback
wl h' s0(1 to modify the system before final implementation.
h. in this report, a gernral description of the current inspection
and r,,t'n4 s'Le, is first given. This includes the definition of
Scondit on index and a brief description of sheet pile distresses. A
Mltailed (lscription of the inspection process follows. Once the inspection
,,ta have been gathered, they are entered onto a computer disk through a PC
(ompiter prgram. The description provides sufficient detail for a trial
application of the inspection process. ihe calculation of the co. lition
index is done within the computer program and will he printed out at the
user's request. The scope of this project has been specifically limited
to steel sheet pile structures associated with lock and dam facilities.

Mode of Technology Transfer
7. It is recommended that the inspection procedures developed in this
study for steel sheet piles be incorporated into ER 1110-2-100, "Periodic
Inspection and Continuing Evaluation of Completed Civil Works Structures."
• , mlm mmulnnm~nnnannumumlln R m m m

PART II: OVERVIEW OF INSPECTION AND RATING PROCEDURES
8. A general overview of the inspection and rating procedures and
background is presented in this section. Several details regarding the
rating system are presented in the Appendixes.
Steel Sheet Pile Component Identification
9. To inspect and rate steel sheet pile structures, their functions
and components must be clearly identified.
Functions
10. Lock Chamberwall--One of two long parallel walls that forms the
lock chamber. The lock chamberwalls will generally extend just beyond the
recesses for the lock gates (Figure 1).
I!. Lock Guidewall--A wall used to guide barge traffic into and out of
the lock; this wall begins at the end of the lock chamberwall. The guidewall
may be upstream or downstream from the lock and on the land side or river
side ot the lock approach (Figure 1).
12. Transition Wall--A retaining wall used in the transition from the
lock guide walls to the natural bank or levee (Figure 1).
i3. Cutoff Wall--A wall used to retard the flow of water under a lock
dam or other structure. The wall is usually completely buried and has no
anchocage system.
14 . Mooring Structure--A structure to which a barge is tied. The most
common type is a steel sheet pile cell filled with concrete or coarse aggre-
gate (Figure 2).
15. Protection Structure--A structure used to prevent damage from barge
collisions to bridge piers, lock facilities, and the like. The most common
type is a steel sheet pile cell filled with aggregate and covered with a con-
crete cap.
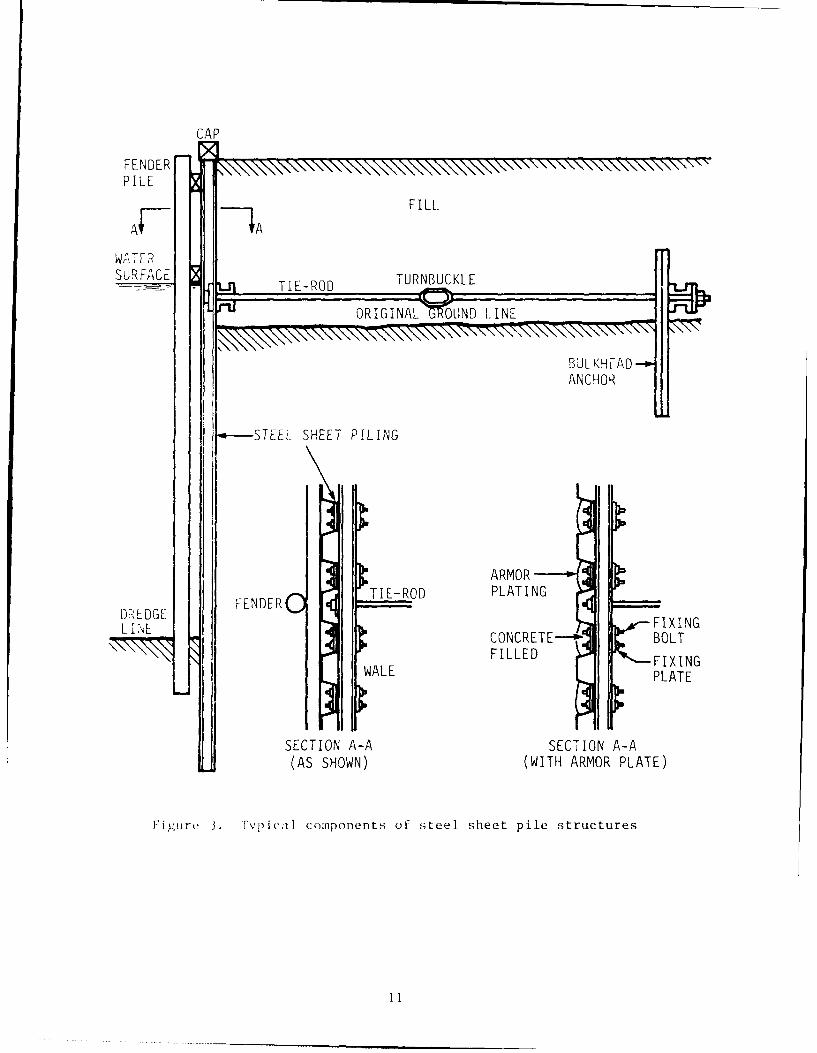
Components (Figure 3)
16. Steer Sheet Pile--lot-rolled steel sections that may have a variety
of shapes (Z, drch, straight) or method of interlock (thumb and finger, ball
and socket). The sections are driven vertically into the soil. Each sheet
9

L- BANK PROTECTION
FLOWS
TRANSITION WALL
UPPER LANDGUIDE WALL
L. BULL NOSE
UPPER RIVER WALLD D MUPPER LOCK GATE
0 CONTROL HOUSE
LOCK WALL
FUTURE LOCK 'ATEI
LOWER LOCK GATE
LOWER LAND GUIDE WALL
BANK PROTECTION
Figure 1. Lock and dam facility
MOORING LANDCELLS WALL
LOAD, UNLOADFACILITIES
Figure 2. Terminal facility
10
FENDERP ILE
_7A FILL
STWASHETPIIN
1j3 DE TIE-RODPLTN
WAEFILLED K FIXINGWALE PLATE
SECTION A-A SECTION A-A(AS SHOWN) (WITH ARMOR PLATE)
Figuire 3. 'Ivpic1] components of steel sheet pile structures

is interlocked continuously from top to bottom with adjacent sheets. (See
Appendix A.)
17 . Wale--Rolled-steel section running horizontally along a steel sheet
pile wall and used to transfer loads from the steel sheet pile wall to a tie-
rod and anchor system. The wale generally consists of two channels back to
back with 2 in. or 3 in. spacers. The sheets are often bolted to the wale.
18. Tie-Rod--Steel rod used to transfer loads from the wale to an
anchor system. The rod is threaded at each end in order to bolt it to the
wale and anchor it with a turnbuckle in between. The tie-rod is usually a
2 in. to 3 in. diameter rod. A steel cable may also be used.
19. Anchor--A structure that transmits the tie-rod loads to the soil.
It may consist of a sheet pile wall and wale, a concrete block, or some
battered pile and cap arrangement. A battered pile bolted directly to the
wale may also be used for an anchor.
_0. Cap--A wood, steel, or concrete structure placed on top of the
sheet piles. A railing may be attached to the cap.
21. Fenders--Structures used to prevent damage to the piles from
barges. These may be wood or steel and are usually bolted horizontally to
the sheets above the water level.
22. Armor Plating--A curved steel section welded between flanges of Z
piles to help protect the wall from barge collisions. The void is usually
filled with concrete.
Structural Form
23. Cantilever Wall--Wall that resists active earth pressure, or water
and/or ice forces as a vertical cantilever. The horizontal force and moment
resistance are provided by the passive soil pressure on the embedded portion.
24. Anchored Wall--wall that resists active earth pressure as a beam
spanning between the passive soil pressure on the embedded portion and the
anchor tie-rods near the top. (Figure 3).
25. Single Cells--A series of interconnected, straight-web steel sheet
piles usually arranged in a circular plan shape. The interior is filled with
soil, concrete, and/or stone. The structure resists the applied forces, for
example, mooring and impact as well as wave and ice loads, principally by
gravity and sliding forces.
12

26. Cellular Wall--A wall formed by interconnected cells. Figure 4 illus-
trates some of the possible plan views. A cellular wall resists forces in a manner
similar to single cells.
Inspection Concepts
27. A basic idea behind the inspection procedure is simplicity. As meetings
with Corps personnel progressed and field tests with Corps personnel confirmed, it
became increasingly clear that any steel sheet pile inspection program must be
simple to learn and not time-consuming. Two factors force this conclusion: Steel
sheet pile structures are not the most critical item in a lock and dam facility and
Corps personnel who work with lock and dam facilities generally feel they will have
little time to devote to this work. Current inspection procedures ranged signif-
icantly between districts. No district that was involved in this pilot pro,>ct now
spends much time inspecting steel sheet pile structures. In districts where steel
sheet pile is used for floodwalls or dams, the situation may be different.
28. With these restrictions, the field inspection had to be based on easily
obtainable data. In this case, easily obtainable data were taken to be those that
could be obtained by walking along the land side of the wall or boating along the
water side. The normal inspection would involve no excavation or diving. No ultra-
sonic or other "sophisticated" devices could be used. All data would be measured by
subjective observation (poor, average, good, excellent, etc.), a tape measure, a
level, a string line, a camera, and the like. (Figure 5, p. 22, lists equipment
requirements for each task.) As a goal, the data would be recorded by technicians
with no particular engineering training or experience in the design or construction
of steel sheet pile structures. Certain components such as the wale, anchor rod,
and anchor system are not visible and hence cannot be part of this inspection.
29. The rating process generally follows this pattern:
a. Historical information, such as drawings and previous inspections, is
reviewed and recorded before a site visit.
b. A site inspection is conducted and specific visual data are recorded.
c. The inspection data are entered into a personal computer (PC) program.
d. The steel sheet pile condition index is calculated.
The time period between inspections has not been established, but will probably be
between 3 and 5 years.
13

(a) CIRCULAR CELLS (b) DIAPHRAGM CELLS (c) CLOVERLEAF TYPE CELL
Figure 4. Cellular walls
30. The results of the inspection, for example, the condition index,
are intended to be indicative only of the existing condition and must be
viewed as such. As is pointed out above, the results are based only on
visual information. For some cases, it may be necessary to return and
conduct a more detailed inspection, for example, by excavation, diving, or
surveying. This will clearly be the case if a dangerous condition is indi-
cated by the initial inspection. It is beyond the scope of this portion of
the project to describe a detailed inspection.
Condition Index
31. A condition index (CI) is a numerical measure of the current state
of a structure. It is part of the objective of this project to define a condi-
tion index that uniformly and consistently describes and ranks the condition of
steel sheet pile structures. The condition index is primarily a planning
tool, with the index values serving as an indicator of the general condition
level of the structure. The index is meant to focus management attention
on those structures most likely to warrant immediate repair or further
14

evaluation. In addition, the CI values can be used to monitor general condi-
tion change over time and can serve as an approximate comparison of the con-
dition of different structures.
32. During the many meetings and discussions that have been held on
this subject, a common definition of condition index for the REMR work has
evolved. The REMR Condition Index is a numbered scale, from a low of 0
to a high of 100. The numbers indicate the relative need to perform REMR
work because of deterioration of the functional and safety characteristics of
the structure. The condition index scale in Table 1 has been adopted. For
management purposes, the condition index scale is calibrated to group struc-
tures into three basic categories or zones, as listed in Table 2.
Structural Condition Index
33. As this project progressed, too general criteria for evaluating
Lhe condition index of a structure evolved. First was the safety aspect.
The safety of a structure relates to its performance beyond normal service
conditions, for example, under abnormal conditions such as excessive load or
unexpectedly poor soil conditions. Safety often refers Lo potential loss of
life and/or significant property damage. If a structure is unsafe, it is in
ddngir of collapse. Structural safety has traditionally been measured by a
factor of :afety. Hence, uncertainties in loading and structural strength,
that is, abnormal conditions, are covered by selecting an appropriately high
factor of safety to ensure a sufficient margin between the applied loads and
tLe structural resistance. For example, the design criteria for steel sheet
pile typically require a far to of safety of two. (See Appendix B.)
34. In this project a structural condition index is defined which is a
measure of the safety of the structure or risk of failure of the structure.
It is based directly on the factor of safety of the structure (Appendix B).
The factor of safety calculation is often perceived as a fairly rational,
objective process. This is so, in spite of the many simplifying assumptions
that must be made. Presumably, the structural condition index would be
reasonably repeatable if everyone was given the same beginning information.
Functional Condition Index
35. The second set of criteria that evolved were much more subjective.
They involved "engineering judgment" and depended upon the experience of the
15
person making the evaluation. These aspects of the condition index were much
more diIficult to capture. Experts in this field were interviewed and dis-
cussions continued for some time until a consensus began to develop.
36. The experts took many factors into account as they evaluated the
functional condition index. One aspect was the serviceability of the struc-
ture, that is, its performance at and belov normal service conditions on a
day-to-day basis. For example, if a lock wall is significantly out of align-
ment, the movement of barges through the lock will be affected. Aesthetics
is also an aspect of serviceability. The appearance of the wall in its
particular location is important.
37. Another factor involved in the functional condition index is, for
lack of a better phrase, subjective safety. Subjective safety refers to the
idea that an engineer, using his subjective engineering judgment, may decide
that a safety problem is likely. However, there is only an indication of the
problem and the exact problem cannot be confirmed objectively without further
detailed information.
38. Again, using misalignment as an example, if misalignment exists it
may not significantly affect serviceability but it may be an indication that
a structural failure--such as a tie-rod failure, sheet bending failure, or
passive soil failure at the toe--has occurred or is in progress. Thus,
although the exact cause and effect of the misalignment cannot be pinpointed
without further investigation, the condition index of the structure should
reflect some increased safety risk. For this example and many others, the
increased risk cannot be evaluated by a simple analytical means; thus, it
cannot be included in the structural condition index. It is, therefore,
appropriate to reduce the functional condition index. As one can conclude, a
distress such as misalignment may be included in the structural condition index
or the functional condition index depending upon the level of investigation,
that is, objective versus subjective information. Since the analysis in this
investigation is at an elementary level (see Appendix B), only one distress
(scour) is included in the safety condition index.
39. Typically, each distress will be measured by some geometric or
numerical quantity X, such as misalignment, settlement, or number of holes.
Hence, in the case of misalignment, X will be the deviation of the wall from
its design condition. Appendix C describes X in more detail. Such measurable
16

X must be reasonably repeatable. In Appendix C, the functional condition
index is related to the ratio
Xxmax
where X is some limiting value of X. Referring to the above descriptionmax
of action zones (Table 2), X is selected as the point at which the subjec-max
tive condition index is 40, that is, the dividing point between Zone 2 and 3.Following the discussion in the paragraphs above, X for misalignment has
max
been seiected by experts to be the point at which the misalignment requires
immediate repair or, at a minimum, a more detailed inspection and condition
index evaluation must be made. It is a potentially hazardous siLuation. The
expert will nave made the judgment for X based on serviceability and/ormax
subjective safety considerations. Tables of X are given in Appendix D formax
several distresses.
.OiibiflAC Cundition Index
40. As the condition index zones in Table 2 indicate, one purpose of
the condition index is to draw attention to a particular problem that may
require further investigation (Zone 3). In this regard, the combined condi-
tion index or, simply, the condition index will be defined as
Condition Index = Minimum of:Structural Condition IndexFunctional Condition Index
Hence, if the structure has a poor condition index, a flag is raised and the
engineer can trace back to determine whether the cause is a low structural or
functional condition index. Indeed, the engineer would presumably trace back
through the entire rating process and, possibly, conduct a more detailed field
inspection and/or structural analysis to establish the basic cause.
17

Steel Sheet Pile Distresses
41. If a steel sheet pile structure is designed and constructed
properly, it has an initial condition index of 100. As time passes and the
structure is exposed to varying environmental and operational situations, its
condition will deteriorate. The condition index will degrade as various
distresses are incurred. A total of eight distresses has been identified for
categorization in this project. Each is described briefly in Table 3 and in
more detail in Appendix D. Each of these distresses can detract from the
safety and serviceat' lity of the steel sheet pile. For each of these cases,
the magnitude of the distress is recorded during the inspection, as discussed
in Part I. Consistent with the guidelines in the section called "Inspection
Concepts," the field measurement is kept as simple as possible. The effect
ot the distress on the condition index depends upon the value of this measure-
ment. The ratio of the field measurement to the limit X is used to calcu-max
late zhe serviceability condition index (see the section called "Functional
Condition Index" and Appendix C). The limits for each distress are presented
in Appendix D.
18

PART Ill: THE INSPECTION FORM AND EVALUATION MODEL
42. A concept behind the inspection form and the computer-based eval-
uation model is to keep the procedures and tools of implementation as simple
as possible. While this might imply the end result is also "simple," this is
not the case with the evaluation model. The "expert opinion" rules embedded
in the computer-based evaluation model have been designed to interpret
straightforward visual observation data in much the same manner as a seasoned
engineer would interpret field observations. This section outlines the
imylementation piocedures for the inspection form and the computer-based
eIvaiuation model.
Overview of the Insp ection Forr
43. The inspectiun lorm in Figure 5 has been designed to provide flex-
ibi-ity in documenting a variety of field conditions within one uniform form.
Understanding the condition index requires thorough documentation of several
characteristics of the steel sheet pile structure: (1) the history of the
structure, (2) the structural components and related factors, and (3) the
incidence of distresses that detract from the original condition of the steel
sheet pile structure. Each of these characLeristics is addressed by individ-
,ial paris of the inspection form. Though there are seven pages in the inspec-
tion form, not all pages are used for every structure nor will every question
have an answer. The following section illustrates the use of the inspection
form. The following paragraphs briefly outline the inspection form.
Historical Information
44. Historical information related to the steel sheet pile structure
being inspected is recorded on pages I and 2. Information requested includes
project reference data to identify and to locate the specific structure.
Further data categorize the structure into a particular type and function.
This information assists the inspector to determine which of the structural
component forms (page 3, 4, or 5) is to be completed. The information is
also used to sort through the expert rules base in the evaluation model. The
recent history of maintenance, modifications, inspections, and the like is
recorded. Finally, a section to record present-day physical conditions of
19

nonessential steel sheet pile accessories is also provided in this part of
the inspection form.
Structural Components
45. Information relative to the structural components of specific steel
sheet pile structures is recorded on page 3, 4, or 5 of the inspection form:
Page 3 is used for anchored (tied-back) or cantilevered wall types, page 4
for single cells, and page 5 for multiple-cell walls or bulkheads. The page
is determined by the structure type and/or wall system type selected on page
I of the inspection form. The information compiled on these pages provides
the basis for an elementary review of the structural adequacy of the struc-
ture. This review is done automatically in the evaluation model as described
ia Appendix B. Most of the structural data will be recorded on the form prior
to the site visit and verified during field inspection. The prior informa-
tion may be taken from original design drawings, as-built construction draw-
ings. or drawings of field modifications to the structure. The structural
data forms are set up to record multiple subsections of wall types or cellular
structures. Whenever there is a change in steel sheet pile components or
construction conditions along a wall length, the subsection changes. It is
not unusual in a steel sheet pile project for a wall section to be composed
of two or three subsections of wall with variable sized components or differ-
ent construction conditions. For example, the first 500 feet of wall might
be a PZ27 steel sheet pile cross-section and the second 500 feet a PZ32. Or
another example: the overall length of the steel sheet pile might become
shorter over the length of the wall because the pile steps up with the rising
grade of the river bottom. A separate structural data sheet is filled out
for each subsection, that is, as many copies of page 3 as required. The use
of station-to-station references for distance location of subsection changes
further identifies the wall characteristics.
Loading and Dredge Line
46. Page 6 of the inspection form provides additional information
required to review the structural adequacy of the steel sheet pile
structure. The format of the sheet allows one section for specific
information regarding load magnitudes (surcharges) and location by station
reference along the structure length. The second section, for dredge depths,
20

ic,'ids LIit -(X ,' L sL g111 91 l t veIs oI L Ith dredgt' I i ii ot i IiVer boLLolk. 'll I
information is correlated with the structural component data from pages 3, 4,
or 5 to give a safety condition evaluation along all points of the structure
length.
Distress Profile
47. The distress profile form, page 7 of the inspection form, is a
record of distresses in the SSP structure. The distresses are listed at the
bottom of page 7 for easy reference. Refer to Paragraph 41 and Appendix D
for more complete descriptions of the distresses and their limits.
Generali Notes
48. The lavout of the inspection form in Figure 5 has been designed to
:,:.iliate both the daEa collection process and the computer input and evalu-
tin model_. After the initial inspection and computer modeling of a structure,
the data on pages 1 through 5 will become relatively permanent and will
r,,,uire only nominal editing of computer data files to make them current
again. Pages 6 and 7, however, are data pages that, in general, must be
filleti out in the field during the inspection because the information is
sdif;Wi to (}nange. The following pages of this manual duplicate the actual
inspection form with entries from an actual test inspection. The side-by-
side r--aiigement of Lhe following pages displays specific explanations
adacent to the entry on the inspection form. Pages 6 and 7 also have notes
ii Lh, to m.asure and record critical data.
49. For all pages on the inspection form, station coordinates are used
t, ',,cate tructur, characteristics or distresses. This reference is the
.. i :.r civiI onginecring standard of 0+00 equals a starting point and 1+50
.s *5 feet away fr',, li the starting poinL. It is important that the station
- . . .'., , -. gc's of t:e insiction form be consistent. This should be
,-:.SctSed .iid agreci winr. before the field inspection. The sketch on Attach-
-t p ct ,rM ia ascri to identify the beginning station
.i - locations should be entered as whole numbers,
t, iv i ' I ic, 1 l) .
21

U.S. ARMY CORPS OF ENGINEERSSTEEL SHEET PILE STRUCTURE INSPECTION PAGE 1
NAME OF CIVIL WORKS PROJECT:
(1): 444"!AC 4SA
(2) : U PP" I /40/E to AZ-
LOCATION OF CIVIL WORKS PROJECT:(I. Indicate body of water, and 2. nearest town)
(2): AbT -Mw AJ Of YTZ
DATE OF INSPECTION: _-____ INSPECTED BY: . ,-, 5 5( -
PLEASE INDICATE THE TYPE OF STEEL PILE STRUCTURE INSPECTED(N(TE: Use one inspection form per structure. Later data collected on thisform is specific to only one structure type.)
1. Lock Chamber Wall 4. Guard Wall2. Lock Guldt, Wall 5. Single Cell3. Transition or Retaining Wall
STRUCTURE TYPE: (No.) ?
TYPE OF WALL SYSTEM: (Ignore if single cell structure)
1. Anchored (tie-back) or Cantilever
2. Cellular:
WALL SYSTEM: -No.) /LENGTH OF WALL OR CIRCUMFERENCE OF CELL STRUCTURE (ft): (NO.)
LOCATION OF STRUCTURE:FACING DOWNSTREAM, WHICH SIDE IS THE STRUCTURE? (I.Right 2.Left):(No.) 2--IN RELATION TO THE LOCK. IS IT? (I. Upstream 2. Downstream): (No.) !PROXIMITY TO LOCK PROJECT SITE? (1. Near Lock 2. Remote): (No.) p
LENGTH OF LOCK CHAMBER (ft): (NO.)
CONSTRUCTION DATE: /?S?
ARE DRAWINGS AVAILABLE FOR REFERENCE?: (YES/NO) YtSARE THE DRAWINGS INCLUDED WITH THIS FILE?: (YES/NO) AJO
PRESENT WATER LEVEL: . 0 (Reference to mean sea level elevation)
RECORD LOW WATER LEVEL:RECORD HIGH WATER LEVEL:
Figure 5. Inspection form and comments (Sheet 1 of 24)
22

Page I Comments: Historical arid/or Recordkeeping Data
Completed prior to the site inspection and verified and/or changed during the
site inspection.
Data blanks on page I prefaced by (No.) must be recorded as numbers.
Enter in (I) the CORPS OF ENGINEER PROJECT TITLE (55 characters). Line (2)
is for additional title description.
Indicate the BODY OF' WATER (1). This may be a river, canal or improved
channel, lake, or coastline.
irolicate SSP STRUCTURE TYPE and WALL SYSTEM TYPE by entering the appropriate
nunbe: in the blank following each name. Refer to the section called "Steel
Sheet Pile Component Identification" for descriptions and illustrative figures
if additional information is required to identify structure or wall types.
NOTE: Only one structure type is allowed on one inspection form. Page 3, 4,
or 5 (of this inspection form) is selected for further data collection based
on the selections made in these two questions.
Actual length of SSP STRUCTURE to nearest whole foot. For SINGLE CELL
STRUCTURES, the circumference of the cell is recorded.
Enter nominal LENGTH OF LOCK CHAMBER (e.g., 600 ft or 1200 ft).
Information from the design or as-built drawings is necessary to complete
structural data sections on page 3, 4, or 5 later in this form. The drawings
may be useful for review in the field during an inspection.
Water level gauge readings referenced to mean sea level. PRESENT and RECORD
LOW and HIGH WATER LEVELS are important for reference at a later date. Low
and high water levels are used in some safety calculations. Include the date
if known.
Figure 5. (Sheet 2 of 24)
23

U.S. ARMY CORPS OF ENGINEERSSTEEL SHEET PILE STRUCTURE INSPECTION PAGE 2
GENERAL INFORMATION - Use the back of this page to list addJtional Informationthat will not fit in spaces provided.
PAST 10 YEAR HISTORY OF:
MAJOR MAINTENANCE, REPAIRS. OR OTHER MODIFICATIONSDATE DESCRIPTION
(1): 7___ &4W~EI J na ~F.A P~4~(2): _____U lp.*j. b~w1446e(3):
CHANGES IN BACKFILL, BUILDING STRUCTURES, ROADS, EQUIPMENT. STOCK PILES, ETC.ADJACENT TO STRUCTURE. OR BEHIND STRUCTURE UP TO A DISTANCE OF 1/2 THE SSPSTRUCTURE HEIGHT
DATE DESCRIPTION
(1): ___ A€r(2):
(3):
PREVIOUS INSPECTIONS OR STRUCTURAL REVIEWS (Attach copies if available)DATE DESCRIPTION
(I): ____ r).,4Ja., A
(2):(3):
PRESENT DAY: - Use this section of the Inspection Form to describe the locationand physical condition of SSP accessories such as Cap, Railing. ArmorProtection. Fender, Mooring Posts, Rings, etc.
STATIONSFROM TO DESCRIPTION (Materials, type connections. etc.)
Ex.1 0 600 Fenders. 3 Rows 8 x 8 Oak TimbersEx.2 250 300 Steel Channel Cap is missing
(3): dt A &*.4#'
(4): _._,.h va.J E*f(5):
(6):(7):18):(9):
(10):
Attach a general site plan of the civil works project. Use ATTACHM4ENT FORM Aor other available plan and include with the Inspection Form.
Attach a sketch of the particular SSP section covered by this Inspection.Use ATTACHMENT FORM 8 or other plan and Include with the Inspection Form.
Figure 5. (Sheet 3 of 24)
24
(5): mmim _mmmm _______a __ __ __m__ __i_ _ __ __ __ _ __ __ _m _ __ _m
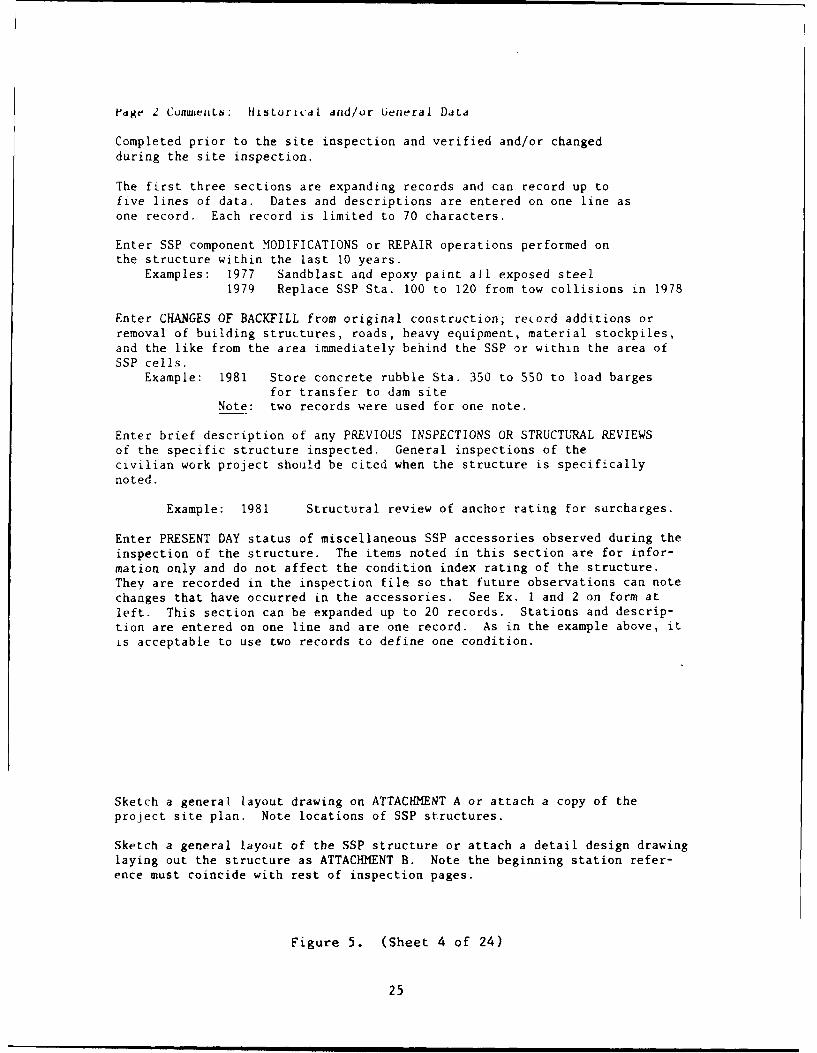
Vdge 2 CUuelLb t: HIStuLiCaL anad/or General DaLa
Completed prior to the site inspection and verified and/or changedduring the site inspection.
The first three sections are expanding records and can record up tofive lines of data. Dates and descriptions are entered on one line asone record. Each record is limited to 70 characters.
Enter SSP component MODIFICATIONS or REPAIR operations performed onthe structure within the last 10 years.
Examples: 1977 Sandblast and epoxy paint all exposed steel1979 Replace SSP Sta. 100 to 120 from tow collisions in 1978
Enter CHANGES OF BACKFILL from original construction; reLord additions orremoval of building struLtures, roads, heavy equipment, material stockpiles,and the like from the area immediately behind the SSP or within the area ofSSP cells.
Example: 1981 Store concrete rubble Sta. 350 to 550 to load bargesfor transfer to dam site
Note: two records were used for one note.
Enter brief description of any PREVIOUS INSPECTIONS OR STRUCTURAL REVIEWSof the specific structure inspected. General inspections of thecivilian work project should be cited when the structure is specificallynoted.
Example: 1981 Structural review of anchor rating for surcharges.
Enter PRESENT DAY status of miscellaneous SSP accessories observed during theinspection of the structure. The items noted in this section are for infor-mation only and do not affect the condition index rating of the structure.They are recorded in the inspection file so that future observations can notechanges that have occurred in the accessories. See Ex. I and 2 on form atleft. This section can be expanded up to 20 records. Stations and descrip-tion are entered on one line and are one record. As in the example above, itis acceptable to use two records to define one condition.
Sketch a general layout drawing on ATTACHMENT A or attach a copy of theproject site plan. Note locations of SSP structures.
Sketch a general layout of the SSP structure or attach a detail design drawinglaying out the structure as ATTACHMENT B. Note the beginning station refer-ence must coincide with rest of inspection pages.
Figure 5. (Sheet 4 of 24)
25

U.S. ARMY CORPS OF ENGINEERSSTEEL SHEET PILE STRUCTURE INSPECTION PAGE 3
ANCHORED OR CANTILEVER WALL CROSS-SECTION
NOTES FOR USE OF THIS DATA PAGE:1. Use this Data Page for recording dimensions if the wall system selected on
Page 1 Is an anchored or cantilevered wall.2. Use more than one sheet for recording data on multiple subsections of the
wall components or measurements for the cross-section change.
FROM STATION: e Figure 1.TO STATION: Fgr1
WALL TYPE:-- r1. Anchored , --
2. Cantilever _
(No.) /
ANCHOR SYSTEM DRAWINGS ATTACHED?(YES/NO) A O
SOiL COMPOSITION: 7_1. Sand 5. Medium Clay2. Gravel 6. Stiff Clay
3. Rock 7. Unknown4. Soft Clay
SOIL(A): (No.) Z-SOIL(B): (No.)
SOIL(C): (No.) 5
WALL CROSS-SECTION: (Refer to Figure 1)
(I) DATUM ELEVATION: 43 .6(2) PILE LENTH(ft):(3) TOP-TO-DREDGE(ft):
4 TOP-TO-SOIL(B) (ft): Z Figure 2.(5) TOP-TO-WATER(ft): IF -(6) TOP-TO-SOIL(A) (ft): 0(7) TOP-TO-ANCHOR ROD(ft): 7-0\(8) ANCHOR ROD DIAMETER(In): 7S(9) ANCHOR ROD SPACING(ft):
(10) ANCHOR DEPTH(ft): 7-0
(11) ANCHOR ROD COATING:
PILE CROSS-SECTION: Provide the Design SSP SECTIONSHAPE DESIGNATION (Ex. PZ32 or PSA28) in (I.)or dimension the appropriate section as shownat the right in Pig. 2 in blanks (2) thru (6). _"
(I) SECTION DESIGNATION: ,.((2) DRIVING WIDTH(in):
(3) FLANGE WIDTH(In): _--_--_
(4) FLANGE THICKNESS(In): ____',
(5) WEB THICKNESS(In):(6) CROSS-SECTION DEPTH(in): ______
(7) YIELD STRENTH:
(If left blank, 36,000 is assumed)
Figure 5. (Sheet 5 of 24)
26

Page 3 Comments: Structural Components Data
Complete data entry on page 3 if:* Structure type noted on page I is Type 1, 2, 3, or 4 and* Wall type noted on page 1 is No. I (anchored or cantilever).
Complete prior to the site inspection and verify and/or change dataduring the site inspection. Data blanks on page 3 prefaced by (No.)must be recorded as numbers.
It is possible to have more than one configuration (or cross-sectiondetail) of an SSP structure. When the configuration changes, use additionalsheets -,f this form to record the separate subsections of the wall.
Examples: Use two forms for the following condition
Sta. 0 to 250 Design pile length is 28 ft
Sta. 250 to 600 Design pile length is 34 ft
NOTE: The beginning station reference for the first subsection must bethe same as the beginning station on the other inspection formpages.
WALL TYPE: Select 3nchored or cantilever. If unsure of condition, reviewdesign drawings. This selection is used in the safety conditionindex analysis.
SOIL COMPOSITION: Select the appropriate soil type from informationusually found on the as-built construction drawings. If Type 7(unknown) is selected, the soil is assumed to be soft clay.
WALL CROSS-SECTION: Provide the information requested based on dimensionsavailable on the design drawings. The dimensions must be enteredin the order noted and in the units noted.
PILE CROSS-SECTION: Figure 2 on the opposite page illustrates the severalSSP shapes that have been and are currently available. The sectiondesignation (1) must be entered into the computer program. If itis not available on the drawings, record the field dimensions forthe actual SSP sheet, i.e., (2) through (6), and see Appendix A forseveral tables of SSP sheet sections. Select the section thatmatches most closely the dimensions (2) through (6) and enter thissection designation in (1).
YIELD STRENGTH: Several yield strength steels are used in SSP sheets. If ayield strength is known, e.g., 55,000 psi, enter the value in thisentry. The default is 36,000 psi.
Figure 5. (Sheet 6 of 24)
27

U.S. ARMY CORPS OF ENGINEERSSTEEL SHEET PILE STRUCTURE INSPECTION Ax:r 4PP~ ueA4 1 PAGE 4
SINGLE CELL CROSS-SECTION LA e. 6L /A dwa (4 L--
NOTES FOR USE OF THIS DATA PAGE:1. Use this Data Page for, recording dimensions if a single cell is the structure
type selected on Page 1.2. Only one cell can be recorded on this Data Page. Use a separate inspection
form, Pages 1, 4, etc., to record each individual cell.
CELL CROSS-SECTION: (Refer to Figure I or 2) FIGURE 1: ROCK OR STFF CLAY(1) DATUM ELEVATION: (ft.) FOUNDATION
(2) TOP-TO-WATER: (ft.) 02(3) TOP-TO-DREDGE: (ft.) -(I) _____
(5) CELL DIAMETER: (ft.) ____CAP,
LOADING ON CELL: (Refer to Figure 1 or 2) SOIL AP = HORIZONTAL: (Ibs) ______'
(Concentrated pull or impact load) /
Q2- SURCHARGE: (Uniform PSF)___ ____4'
INTERIOR BACKFILL AND FOUNDATION MATERIAL: SOIL SiO C-
1. Sand 2. Gravel 3. Rock4. Soft Clay 5. Medium Clay 6. Stiff Clay7. Unknown SOIL B ROCK OR STIFF CLA'
SOIL (A): No.) Interior backfill NOTE:*SOIL C MAY BE ABSENT .!T)
SOIL (B): INO.) Foundation soil or rock ROCK OR COULD SE AN'SOIL (C): Soil layer over rock OTHER SOIL TYPE
PILE CROSS-SECTION: (Refer to Figure 3) FIGURE 2: SAND, GRAVEL. ORProvide the Design SSP SECTION SHAPE SOFT TO MEDIUM CLAYDESIGNATION (1) (Ex. PSA28); or dimension Q2the DRIVING WIDTH (2) & FLANGFTHICKNESS (3). ,, ' (1) DATUm
(1) SECTION DESIGNATION: "CA P (2)(2) DRIVING WIDTH: (IN.) _ ____.._
(3) APPROX. THICKNESS: (IN.) SOIL A* ' (3)
CELL CAP:TYPE (None, Concrete, Asphalt, etc.): ______(_)
THICKNESS OF CELL CAP: (ft.) .____(_____ __ _ _ _
ACCESS MANHOLE/PORT EXIST?: (YES or NO)_____SOIL 8: i SOIL B
CELL PURPOSE: 4(I. Protection, or 2. Mooring): (No.).
SOIL B SAND, GRAVEL, OPSOFT TO MEDIUM CLAY
FIGURE 3: PILE CROSS-SECTION
()
PLAN - BOTH FIG.
Figure 5. (Sheet 7 of 24)
28

Page 4 Comments: Structural Components Data
Complete data entry on page 4 if structure type noted on page 1 is
Type 5.
Complete prior to the site inspection and verify and/or change dataduring the site inspection.
Data blanks on page 4 prefaced by (No.) must be recorded as numbers.
It is not likely to have more than one configuration of steel sheetpile within one cellular SSP structure. However, if the configuration
changes, use additional sheets of this form to record the separatesubsections of the cell.
CELL CROSS-SECTION: Provide the information requested based on dimensions
available on the design drawings. The dimensions must be entered
in the order noted and in the units noted. These data are usedin analysis of factors of safety for the SSP components. Occa-
sionally the pile lengths will vary around the circumference ofthe cell. When that occurs, enter the shortest pile length (4).
LOADING ON CELL: The force P represents a concentrated force applied tothe cell, for example, by a barge. It may include impact. Q2 is auniform surcharge applied to the top at the cell.
INTERIOR BACKFILL MATERIAL: Select the appropriate soil type from information
usually found on the as-built construction drawings. If Type 7
(unknown) is selected, the soil is assumed to be soft clay. Figure 1
opposite is used if the foundation is rock or soft clay; otherwise,Fig. 2 opposite is used.
PILE CROSS-SECTION: Figure 3 on the opposite page illustrates the typical
SSP shape that has been used for cells and is currently available.
The SSP section designation (1) must be entered into the computer
program. If it is not available on the drawings, reccrd thefield dimensions for the actual SSP sheet (2) and (3) and see
Appendix A for several tables of SSP sheet sections. Selectthe section that most closely matches the dimensions (2) and
(3) and then enter this section designation in (1) and the computer
program.
CELL PURPOSE: The purpose of the single cell is significant in theevaluation of the service condition index for the cell structure.See Appendix D.
Figure 5. (Sheet 8 of 24)
29

U.S. ARMY CORPS OF ENGINEERSSTEEL SHEET PILE STRUCTURE INSPECTION PAGE 5
MULTIPLE CEL. CROSS SECTION PROFILB A4v i
NOTES FOR USE OF THIS DATA PAGE:1. Use this Data Page for recording dimensions if the wall system selected on
Page 1 is a cellular wall.2. Use more than one sheet for recording data on multiple subsections of the
wall components or measurements for the cross-section change.
FROM STATION:
TO STATION:
CROSS-SECTION TYPE: (Case No.)Refer to Figure 1 on the back of this page to select the Case Type No. 1 to 4appropriate to this subsection of wall.
CELL TYPE: (Refer to Fig. on back of 5)(1.DIAPHRAGM, 2. CIRCULAR): (No.)
CELL CROSS-SECTION (Refer to Figure 1 for 1 - 6, and Figure 2 for 7 - 9)(1) DATUM ELEVATION:
(2) TOP-TO-HIGH SIDE WATER(ft): (ft) (Cases 1 & 3 only)(3) TOP-TO-SOIL(C) in Cases I & 2 (ft.) (Soil(B) in Cases 3 & 4,(4) PILE LENGTH: (ft.)(5) TOP-TO-LOW SIDE WATER: (ft.)
(6) TOP-TO-DREDGE: (ft.) (Low water side)
(7) MAXIMUM CELL WIDTH: (ft.)
(8) CELL SPACING: (ft.)
(9) ARCS ANGLE: (Deg) (Circular Cell type only)
LOADING ON CELLULAR WALL: (Refer to Fig. on back of 5)Q2= SURCHARGE: (Uniform PSF)
Note: When a loading occurs on the soil behind the wall, e.g. as Q1 Isshown in Cases 2 & 3, this loading must be entered in the Loading Table inPage 6 of the Inspection Form.
INTERIOR BACKFILL AND FOUNDATION MATERIAL: (Refer to Fig. on back of 5)
1. Sand 2. Gravel 3. Rock4. Soft Clay 5. Medium Clay 6. Stiff Clay 7. UnknownSOIL (A): (No.) Interior backfillSOIL (B): (NO.) Foundation soil or rockSOIL (C): (No.) Soil layer over rockSOIL (D): (No.) Backfill behind wall
PILE CROSS-SECTION: (Refer to Fig. on back of 5)Provide the Design SSP SECTION SHAPE DESIGNATION (1) (Ex. PSA28);or dimension the DRIVING WIDTH (2) & FLANGE THICKNESS (3).
(1) SECTION DESIGNATION:
(2) DRIVING WIDTH: (IN.)(3) APPROX. THICKNESS: (IN.)
CELL CAP:TYPE (None, Concrete. Asphalt, etc.):
THICKNESS OF CELL CAP: (ft.)
ACCESS MANHOLE/PORT EXIST?: (YES or NO)
Figure 5. (Sheet 9 of 24)
30

Page 5 Comments: Structural Components Data
Complete data entry of page 5 if:" Structure type noted on page I is Type 1, 2, 3, or 4 and" Wall type noted on page 1 is No. 2 (cellular).
Complete prior to the site inspection and verify and/or change data during the
site inspection.
Data blanks on page 5 prefaced by (No.) must be recorded as numbers.
Multiple cell structures are similar to walls in that they have a linearconfiguration and function similar to a wall and thus can be identifiedreadily with station references.
It is possible to have more than one configuration (or cross-section detail)of a SSP structure. When the configuration changes, use additional sheets ofthis form to record the separate subsections of the wall.
NOTE: The beginning station reference for the first subsection must be thesame as the beginning station referenced on the other inspection formpages.
CROSS SECTION TYPE: See next page for description.
CELL TYPE: Select diaphragm or circular. If unsure, review design drawings.This selection is used in safety condition index analysis (see Fig. 2on next page).
CELL CROSS-SECTION: Provide the information requested based on dimensionsavailable on the design drawings. The dimensions must be entered inthe order noted and in the units noted. These data are used inanalysis of factors of safety for the SSP components.
LOADING ON CELLULAR WALL: Q2 is the surcharge on the top of the cell.Loadings behind the wall, e.g., Q1 in Case 2 and 3 are entered onpage 6.
BACKFILL MATERIAL: Select the appropriate soil type from information usuallyfound on the as-built construction drawings. If Type 7 (unknown) isselected, the soil is assumed to be soft clay.
PILE CROSS-SECTION: Figure 3 on the next page illustrates the typical SSPshape that has been used for cells and is currently available. TheSSP section designation (1) must be entered into the computer program.Also, see page 4 of Inspection Forms.
Figure 5. (Sheet 10 of 24)
31

BACK OF PAGE 5Fig. I. Wall cross-section conditions by case types.
CASE 1: ROCK OR STIFF CLAY FOUNDATION CASE 2: ROCK OR STIFF CLAY FOUNDATIONWITH DIFFERENT WATER LEVELS ON WITH WATER ON ONE SIDE AND EARTHEITHER SIDE OF CELLULAR WALL FILL ON THE BACK SIDE OF THE WALL
1) DATUMU Q2 i (I) DATUM i1
SOIL 0 I
SOIL A |iSOIL A3 (3)
(4) (6) (6) (4)
SOIL C _L SOIL C*SOIL C" SOIL C'
AA IlI!/11111!1, I/ /II!I I/III
SOIL B " ROCK OR STIFF CLAY SOIL B - ROCK OR STIFF CLAY*NOTE: SOIL C MAY BE ABSENT WITH *NOTE: SOIL C MAY BE ABSENT WITH
ROCK OR COULD BE ANY ROCK OR COULD BE ANYOTHER SOIL TYPE OTHER SOIL TYPE
CASE 3: SAND, GRAVEL. OR SOFT TO MEDIUM CASE 4: SAND, GRAVEL, OR SOFT TO MEDIUMCLAY FOUNDATION WITH DIFFERENT CLAY FOUNDATION WITH WATER ON CNEWATER LEVELS ON EITHER SIDE OF SIDE AND EARTH FILL ON THE BACKTHE CELLULAR WALL SIDE OF THE WALL
02 2 011, DATUM (1) DATUM 1
( (5) soIL D
soIL ASOIL A(3) ) , " '"(3)
(4) (6) (6) (4)SOIL BI 4 SOIL B
, SOIL 8 SOIL B 1
SOIL B - SOFT TO MEDIUM CLAY SOIL B SOFT TO MEDIUM CLAY
Fig. 2. Cell types.
(9)(7) (7) S /
8 Y-1 (8)
DIAPHRAGM TYPE WITH STRAIGHT CIRCULAR TYPEOR CURVED CROSS WALLS
Fig. 3. Pile cross-section.(3)
Figure 5. (Sheet 11 of 24)
32

CROSS SECTION TYPE: Figure 1 opposite is used to identify various cross-section cases that are utilized in the structural analysis. Differentassumptions and calculations are associated with each case (seeAppendix B). Generally, the cases differ by foundation type and loadingcondition on the back (right) side of the wall:
Case Foundation Right Side
I Rock or Stiff Clay Water2 Rock or Stiff Clay Soil3 Other Water4 Other Soil
Figure 5. (Sheet 12 of 24)
33

U.S. ARMY CORPS OF ENGINEERS
STEEL SHEET PILE STRUCTURE INSPECTION PAGE 6
LOADING AND DREDGE DEPTH PROFILE DATA SHEET
GENERAL INFORMATION - Use the back of this page or another data sheet to list
additional information that will not fit in spaces provided.
LOADING TABLE: Use this section to describe the location, loading weight per SFand a brief description of the type of loads applied to the SSP structure.
DISTANCE
STATIONS LOADING TO WALLFROM TO (psf) (ft) DESCRIPTION OF LOADING
Ex. 135 215 300 12 Rock Stockpile( 1): .... _. _ _,_" __ _ _ _ _ _ _ __ _ _ _ _ _ _ _ _
(2): 36' 4.5 577vM___ A4AaJt.J. jL 4
(4):(5):
(7):
DREDGE DEPTH ALONG STRUCTURE:
Measurement (or soundings) for Dredge Depth should be recorded at 50'intervals for walls along the entire length of the wall or at quarterpoints of the circumference of single cells. Specific station notation ofgreater depth holes, such as Ex. 2 should be noted at other than So'
Intervals.
STATION DEPTHEx.1 50 23Ex.2 8? 25.8( 1): /00, . 2(2): IS& 23(3): Zoo ' _
(4): _ -30 ._
(5): __ _ _ _ _ _ _ _ _ _ __ _ _ _ _ _ _ _ _ __0_ _ _ _ _ _ _ _ _ _ _
(6): 300
(7): ____ ___ ___ ____ __________0___________
(9): 4so z__
(10) Soo 30
(13):14):15):
(17):18):19):
(20):
Figure 5. (Sheet 13 of 24)
34
greater depth holesmmmmmmm suc as Ex. 2 shul benoe a thr hn 0

Page 6 Comments: Loading and Dredge Line Data
The LOADING TABLE: an expanding record field for up to 20 different combi-
nations of locations and surcharge loads. These data do not need to beentered in order of stations; the computer will sort the records after alldata are entered.
The factor of safety calculations outlined in Appendix B correlate SSP loadcapacities with the location of the loads and the recorded dredge depths frombelow. The station references must be in agreement with the subsectionreferences on page 3, 4, or 5, because the structural data are selected fromthe appropriate section of wall.
The LOADING value, or surcharge, is expressed in pounds per square foot (psf).It is an estimate of the actual uniform surcharge applied to the soil behindthe SSP structure. Surcharges of less than 150 psf can be ignored and riotrecorded. (A one-ft thick section of concrete, or a three-ft pile of woodmaterials weighs approximately 150 psf.) The DISTANCE TO WALL column liststhe distance from the wall to the point at which the loading begins. Thesafety calculation assumes that any load is applied directly behind the wall
and is a uniform intensity back from the wall. Applying the surcharges inthis manner is conservative- The engineer can review and adjust the loadingrates according to best jidgment. The DESCRIPTION OF LOADING should provideadditional information to the engineer to evaluate accurately the loads on
the SSP structure. The description record is limited to 44 characters.
The DREDGE DEPTH PROFILE is a data file of up to 60 records of the DEPTH of
the dredge line or river bottom relative to the top of the SSP structure.This dimension is the actual measurement of the exposed'height, given as TOPTJ DREDGE on the previous structural data pages. This measurement is directly
correlated with the loading information above in computing the safety condi-tion index. When this measurement varies from the design, it is said to havescoured".
Measurement of the dredge line depth can bc accomplished in a number of ways.The authors have used a weighted line to get reasonably accurate depth
records. Sounding records in navigable waters may be available and providereliable data, but these should be verified at several points. The authorsbelieve several of the commercially available depth finders could also beused effectively. The authors recommend depth measurements be taken at 50 ft
intervals except where sharply rising or falling grades suggest more frtquentmeasurements. The depth should be measured adjacent to the wall and at somedistance, say 5 ft, out from the wall to account for sloping fills, short bermareas, and/or walls adjacent to navigation channel lines. The lowest d:edge
valve should be entered. It should be noted that at least one depth recordmust be recorded to provide data for the safety analysis. The computer willsort the records according to station order after all data are entered.
Figure 5. (Sheet 14 of 24)
35
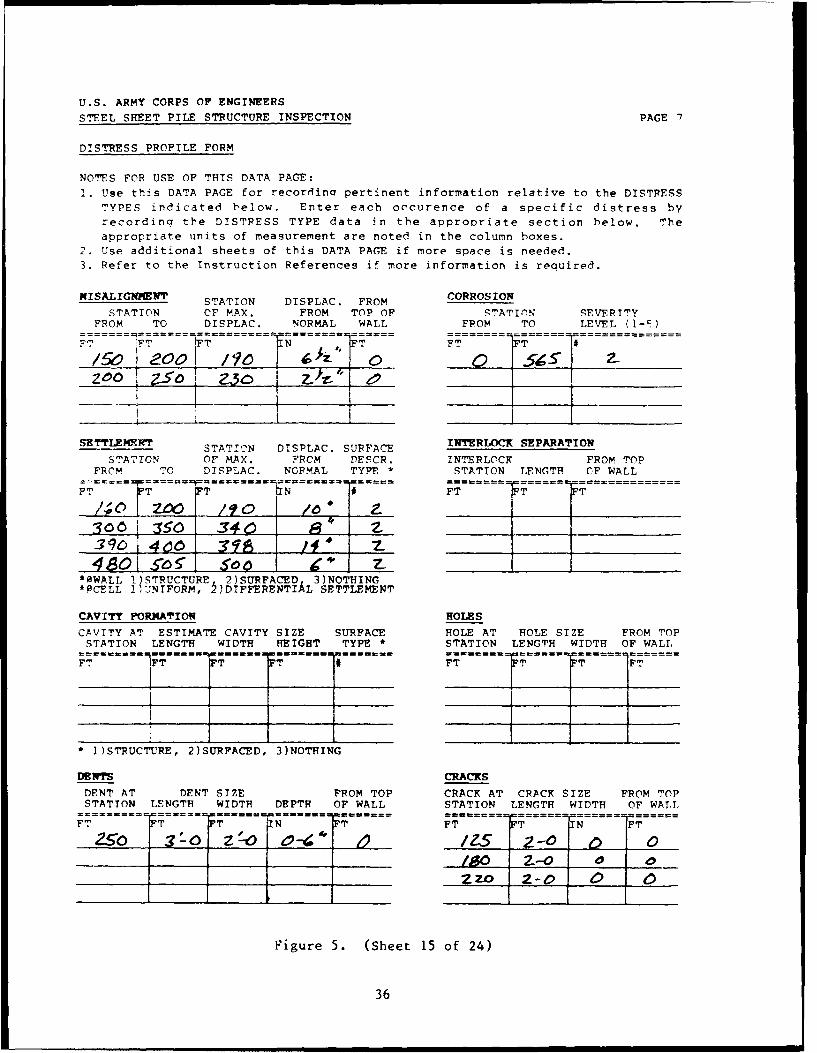
U.S. ARMY CORPS OF ENGINEERS
STEEL SHEET PILE STRUCTURE INSPECTION PAGE 7
DISTRESS PROFILE FORM
NOTES FOR USE OF THIS DATA PAGE:
1. Use this DATA PAGE for recording pertinent information relative to the DISTRESS
TYPES indicated below. Enter each occurence of a specific distress byrecording the DISTRESS TYPE data in the appropriate section below. The
appropriate units of measurement are noted in the column boxes.
2. Use additional sheets of this DATA PAGE if more space is needed.
3. Refer to the Instruction References if more information is required.
MISA5LIGNMENT STATION DISPLAC. FROM CORROSION
STATION OF MAX. FROM TOP OF STATIN SEVERITYFROM TO DISPLAC. NORMAL WALL FROM TO LEVEL (1-i)
FT-- != TTN FTFT T
T0 ?6 I056
zoo Z-50 Z_____ _ _ ____ ____
SETTIEMHWF STATION DISPLAC. SURFACE INTERLOCK SEPARATION
STATION OF MAX. FROM PESCR. INTERLOCK FROM TOPFROM TO DISPLAC. NORMAL TYPE * STATION LENGTH CF WALL
FT TT TN FT TT
306 :550 __40 A___ ___ _F_
4 0 6 5 1_ Soo_ ____ z____
*0WALL 1)STRUCTURE 2)SURFACED 3)NOTHINGPCELL 1,UNIFORM, 2)DIFFERENTIAL SETTLEMENT
CAVITY FORMATION HOLES
CAVITY AT ESTIMATE CAVITY SIZE SURFACE HOLE AT ROLE SIZE FROM TOPSTATION LENGTH WIDTH HEIGHT TYPE * STATION LENGTH WIDTH OF WALL
FF T T TFT ~ T 1 T FT
* I)STRUCTURE, 2)SURFACED, 3)NOTHING
DENTS CRACKS
DENT AT DENT SIZE FROM TOP CRACK AT CRACK SIZE FROM TOPSTATION LENGTH WIDTH DEPTH OF WALL STATION LENGTH WIDTH OF WAIL
FT T N FT FT FT N FT25o 2" z o j -6 IZS z-o
_zo 2-0 _
Figure 5. (Sheet 15 of 24)
36

Page 7 Comments: Distress Profile
Refer to Appendix D for more descriptive information about any distress type.
The equipment required to measure the distress characteristics are small handtools. It is also necessary to have access to a boat. In the course of atypical inspection, the inspector will walk the top of the structure and get
in the boat to observe all visible portions of the SSP structure.
The need for detailed accuracy in recording distress characteristics islimited. It is acceptable to record station references and location ofmaximum displacements to the nearest whole foot. The other dimensionsrequested as FT will generally be acceptable if recorded to the nearestwhole inch increment, for example, 2 ft, 6 in. Those dimensions requestedas IN. will generally be acceptable if recorded to the 1/2 in. increment.
The DISTRESS PROFILE FORM on the left is filled out with distress dataobserved at an actual test inspection and matches data on the previous pagesof the inspection form.
On the following pages, additional copies of page 7A are used to furtherillustrate an example entry for each of the distresses. The form will alsobe used to note other pertinent comments for each distress. The entries onthe following pages are not associated with any particular wall.
Figure 5. (Sheet 16 of 24)
37

U.S. ARMY CORPS OF ENGINEERS
STEEL SHEET PILE STRUCTURE INSPECTION PAGE 7A
DISTRESS PROFILE FORM
NOTES FOR USE OF THIS DATA PAGE:
Use this DATA PAGE for recording pertinent information relative to the DISTRESSTYPES indicated below. Enter each occurence of a specific distress byrecordina the DISTRESS TYPE data in the appropriate section below. Theappropriate units of measurement are noted in the column boxes.
2. Use additional sheets of this DATA PAGE if more space is needed.3. Refer to the Instruction References if more information is required.
MISALIGNMENT STATION DISPLAC. FROM CORROSION
STATION OF MAX. FROM TOP OF STATION SEVERITYFROM TO DISPLAC. NORMAL WALL FROM TO LEVEL (1-5)
SETTLEMENT STTO IPA.SRAEINTERLOCK SEPARATIONSTATION OF MAX. FROM DESCR. INTERLOCK FROM TOP
FROM TO DISPLAC. NORMAL TYPE * STATION LENGTH OF WALL
40 o zz 4IS TN # F ST F iF T
*@SWALL 1)STRUCTURE, 2)SURFACED, 3)NOTHING•*@CELL 1]UNIFORM, 2)DIFFERENTIAL SETTLEMENT
CAVITY FORMATION HOLESCAVITY AT ESTIMATE CAVITY SIZE SURFACE IOLE AT ROLE SIZE FROM TOPSTATION LENGTH WIDTH HEIGHT TYPE * STATION LENGTH WIDTH OF WALL
FT FT FT FT r FT FT FT T
____ ___ _ 1-__ 7- !!P :3 *
• 1)STRUCTURE, 2)SURFACED, 3)NOTHING
DENTS CRACKS
DENT AT DENT SIZE FROM TOP CRACK AT CRACK SIZE FROM TOPSTATION LENGTH WIDTH DEPTH OF WALL STATION LENGTH WIDTH OF WALL
== == -- ------- / f _
FT FT FT IN FT FT FT N FT
194! 2-f 0' e 4 ozo '
Figure 5. (Sheet 17 of 24)
38

Distress Type 1--Misalignment
Line 1: Misalignment of a WallThe measurement of misalignment can be made with a tape measure, a line, a two-ftlevel, and a straghtedge. The typical misalignment of a wall is represented by a bowor curvature in the wall that deviates from its initial alignment for some length.Refer to Appendix D (Figure DI) for types of misalignment and also illustrations ofcauses for failure. This line illustrates a bow in the wall that is 40 ft long. Thebow is from Station 125 to 165 with a horizontal displacement of 10 in. from thedesign alignment of the wall. The point of maximum misalignment is Sta. 145 at thetop of the wall.
Minimum Misalignment of a Wall:In most walls, a misalignment of 2 or 3 in. or less can be ignored. However, ifanother distress such as settlement, a cavity, or a missing fixing bolt occurs at thesame station location, then the misalignment should be recorded for monitoring itschange over time.
Line 3: Misalignment of a CellThe typical misalignment for a cellular structure, particularly a single cell, is out-of-plumbness. Cell misalignment is recorded by measuring the offset from the plumbline at the point of maximum offset. The location of this measurement must correspondwith other location criteria relating to the cell configuration. For this example,the station location of the misalignment, or out-of-plumbness, is from Station 35 to40 approximately one-third of the way around a 35-ft diameter cell. The beginningstation location is referenced on the plan view of the cell structure attached to Page2. The reading of the misalignment was 2.0 ft down from the top of the cell, and a 2-in. offset (from vertical line) was measured in the length of the 24-in. hand level.Cells will bulge and deform from an exact circle as they are filled. This naturallyoccurring bulge should not be interpreted as misalignment. An average of fourmeasurements at 90-degree intervals will average out this initial bulging.
Minimum Misalignment of a Cell:Constrution standards allow up to 1/8 in. per foot variance from plumb or 1/4 in. pertwo foot. A minimum standard to record vertical misalignment could be 1/2 in.ve:tical offset per two foot.
Distress Type 2--Corrosion
Line 1: CorrosionThe rating of the deterioration of the steel sheet pile (SSP) structure due tocorrosion is made in a subjective manner. Refer to Appendix D for a more detailed
description of the rating system. Selection of the corrosion level observed on aparticular section of a structure is made by comparing the observed condition tostandards in Table D2 and/or visually comparing it to the photographs in Figure D3.In the field inspection the only comparison that can be made is a visual inspection ofthe exposed areas of the structures. There are six levels of deterioration withinwhich to rate the structure. The default condition, Group 0, is new or nearly equalto new. This condition requires no entry on the Profile Form. For the remaining fivelevels, Groups 1 through 5, a selection must be made and assigned to specific loca-tions of the structure. In this example, the entire length of a 600-ft wall, Sta 0 toSta. 600, was rated at Level 2. An alternative example would be Sta. 0 to 300 ratedat Level 2 and Sta. 300 to 600 rated Level 4, if there had been a major difference indeteriorated condition between the two sections of wall.
Figure 5. (Sheet 18 of 24)
39

U.S. ARMY CORPS OF ENGINEERSSTEEL SHEET PILE STRUCTURE INSPECTION PAGE 7A
DISTRESS PROFILE FORM
NOTES FOR USE OF THIS DATA PAGE:1. Use this DATA PAGE for recording pertinent information relative to the DISTRESS
TYPES indicated below. Enter each occurence of a specific distress byrecordinq the DISTRESS TYPE data in the appropriate section below. The
appropriate units of measurement are noted in the column boxes.2. Use additional sheets of this DATA PAGE if more space is needed.3. Refer to the Instruction References if more information is recuired.
MISALIGNMENT STATION DISPLAC. FROM CORROSION
STATION OF MAX. FROM TOP OF STATION SEVERITYFROM TO DISPLAC. NORMAL WALL FROM TO LEVEL (1-5)
FT ~FT FT IN FT FT iT _______
coe~ 4, eez _ _ t_ _ _ _ _ _ __ _ _ _
SETTPLEMNT STATION DISPLAC. SURFACE INTERLOCK SEPARATION
STATION OF MAX. FROM DESCR. INTERLOCK FROM TOPFROM TO DISPLAC. NORMAL TYPE * STATION LENGTH OF WALL
FT FT 1 FT IN iFT 1FT ]T
400 347. #1 7 __ 3 0
* @WALL I STRUCTURE. 2 )SURFACED. 3 )NOTHING* @CELL 1)NIFORM, 2)DIFFERENTIAL SETTLEMENT
CAVITY FORMATION 1OLESCAVITY AT ESTIMATE CAVITY SIZE SURFACE HOLE AT HOLE SIZE FROM TOPSTATION LENGTH WIDTH HEIGHT TYPE * STATION LENGTH WIDTH OF WALL
FT FT T T FT FT FT FT
.q'O z__{___ I- jz ___ / l ~ 9* -47
* 1)STRUCTURE, 2)SURFACED, 3)NOTHING
DENTS CRACKSDENT AT DENT SIZE FROM TOP CRACK AT CRACK SIZE FROM TOPSTATION LENGTH WIDTH DEPTH OF WALL STATION LENGTH WIDTH OF WALL
FT T FTT ~ *N F
Figure 5. (Sheet 19 of 24)
40

Distress Type 3--Settlement
Line 1: Settlement Behind an Anchored or Cellular WallThe measurement of settlement can be made with a tape measure, a line, a two-ft level,and a straightedge. Measurement of settlement will be made at every location where adepression of soil occurs and where it appears to be inconsistent with the surroundingsoil grade conditions. The settlement condition noted in this line suggests adepression approximately 22 ft long and 4 ft wide occurring from Sta. 400 to 422. Themaximum depth of the settlement is 7 in. at Sta. 415. For settlement, it is alsoimportant to note what surface condition is met at the location of the settlement.For a wall, the program needs to know whether the backfill 1) is supporting a struc-ture, 2) is surfaced with paving or sidewalk, or 3) has nothing on the surface. Inthis example, the number 2 recorded in the last column suggests a pavement or sidewalkwas present at the time of the inspection.
In a cellular wall, settlment may occur under a cell cap structure without any visibleshifting of the cap. This would reflect a surfacing condition type 2) with settlmeritunder the paving. The only way this condition can be observed is by checking throughan access port or manhole in the cap structure. When the condition exists, itapproximates a large cavity until the cap settles down on the fill or the fill isreplaced. When this type of settlment occurs and is observed, it should be recordedand the void height should be measured as the settlement of the fill.
Minimum Settlement at a Wall:if the settlement occurs at or near the lock chamber, the minimum settlement thatshould be recorded is a 2 in. depression in less than 10 feet. If the settlementoccurs away from a lock site, the minimum settlement that should be recorded is a 4in. depression in less than 10 feet.
Line 3: Settlement of a Single Cell Interior FillSettlement of interior backfill material can occur and be observed as uniform settle-ment or as differential settlement. Uniform settlement of the top surface is measuredfrom the original construction level or design level to the current level of thebackfill material or cap at its highest point. Differential settlement of the topsurface is characterized by a tilted cap structure or uneven slopes that have onepoint significantly lower than any other point or surface level. Differentialsettlement is measured from the level of the original construction surface or designlevel to the current level of the lowest point. The settlement condition noted inthis line suggests that on a cell with a circumference of 105 ft, a differentialsettlement measuring 5 1/2 inches is located near Sta. 80 (going around the cell).For a cell, the type of settlement is recorded in the last column, "Surface Descrip-tion Type," as either 1) for uniform settlement, or 2) for differential settlement.
Settlement may also occur under a single cell cap structure without any visibleshifting of the cap. The only way this condition can be observed is by checkingthrough an access port or manhole in the cap structure. When the condition exists, itapproximates a large cavity until the cap settles down on the fill or the fill isreplaced. When this type of settlment occurs and is observed, it should be recordedand the void height should be measured as the measured displacement of the fill.
Minimum Settlement of Cell Interior Fill:If the settlement is uniform, the minimum settlement that should be recorded is achange of 2 in. or more. If the settlement is differential, any apparent settlementthat can be measured should be recorded. This provides a record for future observa-tion.
Figure 5. (Sheet 20 of 24)
41
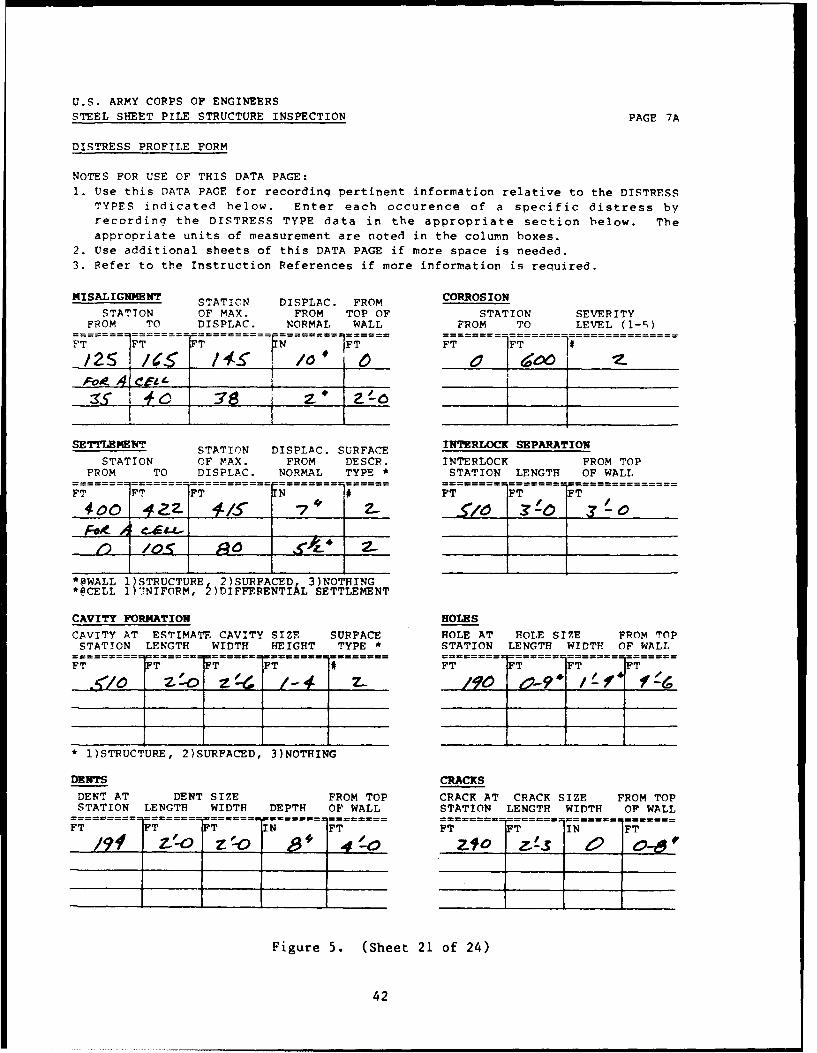
U.S. ARMY CORPS OF ENGINEERSSTEEL SHEET PILE STRUCTURE INSPECTION PAGE 7A
DISTRESS PROFILE FORM
NOTES FOR USE OF THIS DATA PAGE:1. Use this DATA PAGE for recording pertinent information relative to the DISTRESS
TYPES indicated below. Enter each occurence of a specific distress byrecording the DISTRESS TYPE data in the appropriate section below. The
appropriate units of measurement are noted in the column boxes.2. Use additional sheets of this DATA PAGE if more space is needed.3. Refer to the Instruction References if more information is required.
MISALIGNMENT STATION DISPLAC. FROM CORROSION
STATION OF MAX. FROM TOP OF STATION SEVERITYFROM TO DISPLAC. NORMAL WALL FROM TO LEVEL (1-5)
FT ~FT FT IN FT FT iFT #*
Foe 4 e!e I -
SETTLEMENT STATION DISPLAC. SURFACE INTERLOCK SEPARATION
STATION OF MAX. FROM DESCR. INTERLOCK FROM TOPFROM TO DISPLAC. NORMAL TYPE * STATION LENGTH OF WALL
FT FT ZZFT IN FT 1FT FT400 4Z 43 74 ___ ___o
* @WALL 1STRUCTURE 2)SURFACED 3)NOTHING*@CELL 1) .NIFORM, 2)DIFFERENTIAL SETTLEMENT
CAVITY FORMATION HOLES
CAVITY AT ESTIMATE CAVITY SIZE SURFACE HOLE AT HOLE SIZE FROM TOPSTATION LENGTH WIDTH HEIGHT TYPE * STATION LENGTH WIDTH OF WALLFT FT.. . F . . . T FT #.. . T FT 9 FT f FTf
* 1)STRUCTURE, 2)SURFACED, 3)NOTHING
DENTS CRACKS
DENT AT DENT SIZE FROM TOP CRACK AT CRACK SIZE FROM TOPSTATION LENGTH WIDTH DEPTH OF WALL STATION LENGTH WIDTH OF WALL
FT F T IN FT FT FT IN FT
Figure 5. (Sheet 21 of 24)
42

Distress Type 4--Cavity Formation
Line i: Cavity FormationThe measurement of a cavity that is present behind an SSP wall or within an SSP
cell is, at times, a difficult or impossible task. The access point to thecavity may prevent an accurate measurement of the length, depth, and height ofthe cavity. The equipment required to measure the cavity includes a flashlight,tape measure, and a length of wire that can be bent at angles to explore theconcealed sections of the cavity. This line of data describes a cavity, behir"4
a wall, that is 2 ft wide, 2 ft 6 in. high, and i ft 4 in. deep. The cavityoccurs at Sta. 510 which coincides with the interlock separation recorded atSta. 510. This illustrates the relationship that a cavity will normally havewith a hole, crack, or separated interlock. For cavity formation, it is also
important to note what the surface condition is above the cavity. For a wall orcellular structure, the program needs to know whether the backfill 1) is sup-
porting a structure, 2) is surfaced with paving or sidewalk, or 3) has nothingon the surface. In this example, the number 2 recorded in the last columnsuggests a pavement or sidewalk was present at the time of the inspection.
Minimum Cavity Formation:Any cavity formation with a depth exceeding 1 ft should be recorded. Theinspector may record cavities of a smaller size if other conditions suggest theyare increasing in size or could contribute to other problems.
Distress Type 5 --Interlock Separations
Line 1: The measurement of interlock separation is made with a tape measure.The incidence of interlock separation may occur in several different forms but
the measurement will always be the same, that is, the length of the interlockconnection that is no longer connected. The location of the interlock sep-araticn relative to the vertical dimensions of the structure is important,particularly in cellular-type structures. This line illustrates an interlockseparation that occurs at Sta. 510 beginning 3 ft down from the top of thewall. The separation is 3 ft long. Every effort should be made to document
accurately the total length of the interlock separation, particularly if the
separation extends below the water level. This can be done by feel, by inter-viewing local staff, or by requesting information from local staff when the
water level recedes.
Minimum Interlock Separation:On a wall-type SSP structure, any separation that exceeds 12 in. in lengthshould be recorded. On a cellular-type structure, all separations should berecorded.
Distress Type 6--Holes
Line 1: The measurement of holes is made with a tape measure. The relativeheight and width of the opening in the SSP section is recorded. The shape of
Figure 5. (Sheet 22 of 24)
43

U.S. ARMY CORPS OF ENGINEERSSTEEL SHEET PILE STRUCTURE INSPECTION PAGE 7A
DISTRESS PROFILE FORM
NOTES FOR USE OF THIS DATA PAGE:
1. Use this DATA PAGE for recording pertinent information relative to the DISTRESSTYPES indicated below. Enter each occurence of a specific distress byrecordino the DISTRESS TYPE data in the appropriate section below. Theappropriate units of measurement are noted in the column boxes.
2. Use additional sheets of this DATA PAGE if more space is needed.3. Refer to the Instruction References if more information is required.
MISALIGNMENT STATION DISPLAC. FROM CORROSION
STATION OF MAX. FROM TOP OF STATION SEVERITYFROM TO DISPLAC. NORMAL WALL FROM TO LEVEL (1-5)
FT ~ FT FT fIN FT FT i T/ 25 / ____ 4. /o" __ a, 6o z.
Fol 4 EL -____ ____ _____ _ _ _ ___
SE TTLEMENT INTERLOXCK SEPARATIONSTATION DISPLAC. SURFACE INTERLOCK
STATION OF MAX. FROM DESCR. INTERLOCK FROM TOPFROM TO DISPLAC. NORMAL TYPE * STATION LENGTH OF WALL
~~~-- - = == = ------ = ==-.
FT FT ~FT IN FTTT
400 4 4Z #/T 7 z- " 7!_,_
*@WALL 1 STRUCTURE 2)SURFACED 3)NOTHING*@CELL 1)t NIFORM, )DIFFERENTIAL SETTLEMENT
CAVITY FORMATION HOLESCAVITY AT ESTIMATE CAVITY SIZE SURFACE ROLE AT H4LE SIZE FROM TOPSTATION LENGTH WIDTH HEIGHT TYPE * STATION LLLVGLI.' WIDTH OF WALL
= ----------
FTT T# FT FT FT FT
</_ 7- / f 4
I i)STRUCTURE, 2)SURFACED, 3)NOTHING
DENTS CRACKS
DENT AT DENT SIZE FROM TOP CRACK AT CRACK SIZE FROM TOPSTATION LENGTH WIDTH DEPTH OF WALL STATION LENGTH WIDTH OF WALL
FT T FT IN FT FT T IN FT
S_0_ zC 0 --3
Figure 5. (Sheet 23 of 24)
44

the opening, circular or oblong, is not as crucial as is the occurrence of anopening that does not have an intended or obvious use. This line illustratesan oblong opening (hole) that occurs at Sta. 190 that begins 4 ft, 6 in. downfrom the top of the wall. Additional information recorded an opening that is9 in. long (measured horizontally) by 16 in. high or wide. The length of theopening is recorded as the horizontal dimension to indicate if more than onesection is affected by the opening.
Minimum Size of Holes:Any opening in an SSP section where the sum of the two recorded dimensions,length and height, will exceed approximately 8 in. should be recorded. Forexample, a round hole of 4 in. in diameter or an oblong hole 6 in. long by2 in. wide should be about the minimum size opening recorded. An exceptionto this might be a smaller opening that is the apparent cause of anotherdistress, such as settlement or cavity. The other distress should also berecorded for thorough documentation.
Distress Type 7--DentsLine I: Dents are measured with a tape measure. The relative height andwidth of the deformation is recorded. The shape of the deformation couldbe important if it is very large and affects several sections. However, ingenera!, the dimensions of the Length and height will be adequate. Thisline illustrates an approximately square deformation that occurs at Sta. 194.and begins 4 ft down from the top of the wall. Additional informationdescribes a deformation that is 2 ft long by 2 ft high or wide and is dis-placed from the normal plane of the SSP section approximately 8 in. at itsmaximum displacement. The length of the deformation indicates if more thanone section is affected by the deformation.
Minimum Size of Dent:Any dent in an SSP section where the sum of the two recorded dimensions,length and width, will exceed approximately 18 in. should be recorded. Forexample, an oblong dent 8 in. by 10 in. or a creased dent 3 in. by 24 in.should be recorded.
Distress Type 8--CracksLine 1: The measurement of cracks in an SSP section is made with a tapemeasure. The incidence of a crack and its ramifications are very much likethe discussion for interlock separation. Refer to that section, DistressType 5--Interlock Separations, for specifics about measurement and concerns.This line illustrates a crack occurring at Sta. 240 that begins 8 in. downfrom the top of the wall and which is 2 ft, 3 in. long. The dimensionsdescribe a horizontal crack traversing across the sheet.
Minimum Length of Crack:A crack is not intended to be present, so any crack that exceeds 6 in. inlongth should be recorded.
Figure 5. (Sheet 24 of 24)
45

Computer-based Model
50. Computer programs associated with the inspection procedures and
recordkeeping were developed on a personal computer. At some later date,
various modules of the completed system will be integrated into a much larger
maintenance management system currently under development by the U S Army
Corps of Engineers. However, during the initial testing period, the Mainte-
UoLC Naiiu.e ire1i p-ogfaam herein Ueci:.Jc,' was se, up to operate as a stand-
alone system. This system includes modules for forms generation, data input
procedures, evaluation of condition indexes, and report writing.
51. The program is designed to operate on an IBM-compatible personal
computer with at least 512K of installed memory and two 360K, floppy disk
drives. A hard disk is optional. The operating system is MS-DOS, Version
3.0. The program is written in MS-FORTRAN 77 language and is contained on
two 360K floppy disks.
52. Disk 1 is a self-booting systems disk that also contains the control
program and the main execution program. All command procedures required for
program and file handling features are on Disk 1. Disk 2 contains the safety
condition index evaluation. The user is instructed on the interaction of the
two disks as well as the use of a data disk to create and store file records
of the structure's inspection and the condition index data.
53. The structure of the project files is organized under the DOS direc-
tory and subdirectory system. The civilian work projects are the highest
level and many steel sheet pile structures can be grouped under this project
directory at a second level. Under each structure, data files pertaining to
that structure and specific inspection data are in a third level of files.
This file handling system allows the grouping of separate inspections on
different structures under the same work project.
54. Once the program is started and the project file structure is set
up, the program is menu-driven. In other words, all operations including
file management, operation selection, and report writing are controlled from
a main menu (e.g., see Table 4). Other menus further direct options.
55. After the program has been installed, the user begins by typing in
the responses entered on the inspection sheet. The computer monitor is set
up to look like the inspection sheet so that entry follows line by line.
46

Several editing features are available for correcLing or updating. Pages I
through 7 can be printed out as part of a report. They are not reproduced
here because they would duplicate the ones presented previously. Once all
data have been entered, the user may request the program to calculate the
functional and the structural condition indexes by appropriate menu selections
(Table 4). A SUMMARY REPORT, Page 8, that gives the condition indexes and
summarizes the problems associated with this structure can also be printed.
An 2xample fnr the inzp&'tion forms earlier in this section is in Figure 6.
47

PAGE 8
SIMARY REPORT
PROJECT NAME:LaGrange Lock & DamUpper Guide W11
LOCATION:Illinois WaterwayBeardstc i, IL.
INSPECTION DATE: Aug. 5,1986
INSPECTED BY: L. Greimann, J. Stecker
STRUCTURE TYPE: Lock Guide Wall
STRUCTURE LOCATION: Left side, Upstream
The overall subjective condition and safety condition have beenanalyzed and ccmpiled into the following indices:
FUNCTICNAL CONDITION INDEX = 35STRUCTURAL CCNDITICK INDEX = 87
COMBINED CONDITION INDEX = 3b
Additional intermediate data and evaluatior that were incorporated
into the calculation of the Functional Cor~mition Index follow:
NUMBER OF DISTRESSES PRESENT AND THEIR CALCULATED DISTRESS COEFFICIENTS
2 Misall m nt 351 Corrosion 694 Settlement 01 Dents 963 Cracks in Sheet 90
FUNCTIONAL CONDITION INDEX z 35
Additional intermediate data ud asstmt ions that wre incorporatedinto the calculation of the Structural Condition Index follow:
Station Soil Pile Rod SCI
400.00 1.28 7.96 3.77 87
Figure 6. Summary report (Continued)
48

SLt4ARY RWOR - (continued)
Problems on this structure:
The following problems have been noted by this inspectionand should be investigated further for maintenance orrepair alternatives.
Missalignment functional condition index of 47 at station 4.This missaligrmant condition is at or near themaximum allowable deviation and repair should begin soon.
Missaligrmwnt functional condition index of 75 at station 6.This missalignment condition is becoming significantand maintenance to this level may be necessary.
Corrosion functional condition index of 69 at station 7.This corrosion condition is deteriorated andrequires extensive repair procedures to be controlled.
Settlement functional condition index of 21 at station 8.This settlement condition exceeds the maximumallowable deviation. Other conditions may needto be corrected.
Settlement functional condition index of 29 at station 9.This settlement condition exceeds the maximumallowable deviation. Other conditions may needto be corrected.
Settlement functional condition index of 11 at station 10.This settlement r ondition exceeds the maximumallowable deviation. Other conditions may needto be corrected.
Settlemnt functional condition index of 40 at station 11.This settlement condition requires maintenance.
Figure 6. (Concluded)
49

PART IV. FIELD TESTING
56. The inspection and rating procedure described in this report has
been applied in two field tests. In July 1986 the procedure was applied to
the upper and lower guide wall at Peoria Lock and Dam in Peoria, Ill. Four
U S Army Corps of Engineer experts were involved in this testing: John Sirak
(C'hio River Division), Richard Atkinson (Rock Island uistrict), and Raymond
Horton (Rock Island District). Dr. Anthony Kao, CERL project monitor, was
also an observer. The results of that field test, although primarily quali-
tative in nature, were used to make several modifications to a previous
version of the rating procedure. The results of that test are not specifi-
cally addressed here.
57. In July 1987 another field test was conducted in the Chicago area
by four Corps engineers: Sirak, Atkinson, Horton, and Joseph Jacobazzi
(North Central Division). Kao was also present. Several quite different SSP
wall facilities were examined. Each expert was asked to rate the individual
distresses in each wall and the overall wall, that is, assign a functional
condition index. The results of this test are described below. As stated
previously, many of the comments and suggestions made during that test have
been incorporated into the current version of the procedure, that is, the
version described herein. Additional details appear in Appendix E.
Descriptions
58. Nine different wall locations and functions were inspected during
the Chicago field test.
Wall A (Figure 7)
59. Wall A is an anchored-type wall approximately 400 ft long that is
used as a loading dock retaining wall. The wall height exposed above water
was 7 ft and the overall height from top of wall to dredge averaged 24 ft.
Anchor rods appeared to be 2.25 in. in diameter at 6 ft spacings. The steel
sheet pile appeared to be PZ27. The observed distresses included two in-
stances of misalignment with displacements of 8 in. over 75 ft and 5 in. over
20 ft, seven instances of dents with six being small (1 to 2 ft across) and
one being much larger (9 ft by 3 ft and depressed 8 in.); and a general state
50

Figure 7. Wall A and B
Figure 8. Wall C
51

of corrosion judged to be about Level 2. No other distresses were noted for
the computer evaluation although several of the experts noted that they con-
sidered settlement behind the misalignment and also interlock damage and
cracks in conjunction with the dents.
Wall B (Figure 7)
60. Wall B was, in fact, the same wall as Wall A. However, the experts
were asked to rate the wall as if it were a guide wall in a lock and dam
facility.
Wall C (Figure 8)
61. Wall C is an anchored-type wall approximately 285 ft long that is
used as a loading dock retaining wall where salt is unloaded. The exposed
wall height was 9 ft and the overall wall height was approximately 19 ft.
The steel sheet pile appeared to be PDA27. No other data could be obtained.
The observed distresses were dominated by the severe corrosion. Different
levels of corrosion were recorded for sections of the wall and included
levels 2, 3, 4, and 5. One instance of misalignment with a displacement of
6 in. over 40 ft and one hole 2 ft long by 6 in. wide were also recorded. No
other distresses were noted although several experts noted they considered
the corrosion to be severe enough to have caused interlock damage and left
the stee] material so thin that holes were imminent.
Wall D (Figure 9)
62. Wall D is an anchored-type wall approximately 700 ft long that is
used as a retaining wall for a parking lot. The exposed wall height was
17 ft and the overall wall height was approximately 28 ft. The steel sheet
pile is PZ32. The original anchorage system was battered H-Pile at 4 ft-6 in.
centers. When a soil failure occurred at the toe of the wall, a misalignment
developed with the bottom of the wall moving out with a displacement of 24 in.
over 125 ft. Additional anchor rods were installed at 6 ft centers at a lower
elevation to hold this section of wall. The experts were aware of this
repair, which may have affected their judgment on the condition index. The
experts were not asked to judge the wall as if the repair had not been made.
One hole was present and the general state of corrosion was judged to be about
Level 2. The experts commented that settlement behind the misalignment might
be a problem.
52

Figure 9. Wall D
Figure 10. Wall E
53

Wall E (Figure 10)
63. Wall E is an anchored-type wall approximately 200 ft long used as a
retaining wall. The exposed wall height was 11 ft and tfle overall wall height
was approximately 21 ft. Anchor rods appeared to be 1.5 in. in diameter at
7 ft spacings. No other data could be obtained. The observed distresses
included four instances of holes about I ft across, one crack that was about
2 ft long and separated 1/2 in., and three small dents. A general state of
corrosion was judged to be about Level 4. No particular comments were noted
by the experts.
Wall F (Figure 11)
64. Wall F is an anchored-type wall approximately 400 ft long used as a
loading dock retaining wall. The exposed wall height was 8 ft and the overall
wall height was approximately 21 ft. No other data were obtained. The
observed distresses included one misalignment with a displacement of 18 in.
at the top of the wall over 65 ft of wall, 14 instances of dents that
were all in the small category (I to 2 ft across), and one instance of a
crack that was about 2 ft long but not separated. A general state of corro-
sion was judged to be about Level 2. No other distresses were recorded although
the experts noted they considered settlement behind the misalignment and
interlock damage and cracks in conjunction with the dents.
Wall G (Figure 11)
65. Wall G was in fact the same wall as Wall F above but the experts
were asked to evaluate and rate the wall as if it were a lock guide wall at a
lock site.
Thomas J. O'Brien Lock Wall (Figure 12)
66. The lock walls of the O'Brien Lock and Dam facility on the Little
Calumet River in South Chicago are cellular SSP structures. The river wall
of the lock chamber is 965 ft long and 23 ft wide, composed of diaphragm cells
(Figure 4). The land side wall of the lock chamber is similar in construction,
but the steel sheet pile is not normally exposed to view so no observation
can be made.
67 . The exposed sheet pile in the river wall appears to be in reasonably
good condition except for two observed distresses. There was a crack in one
54

Figure 11. Wall F and G
Figure 12. Thomas J. O'Brien lock wall
55

of the SSP cells running from the top of the cell, down about 5 ft. The con-
crete cap had settled up to 4 in. near the center of the cells. Little if
any settlement had occurred at the cell diaphragms, producing a slightly
uneven surface on top of the wall. Corrosion was at a low level.
Thomas J. O'Brien Lower Guide Wall (Figure 13)
68. The lower pool guide wall is an anchored-type wall 1000 ft long
used as a retaining wall and for barge alignment with the lock. The exposed
wall height was 7 ft and the overall wall height was 24 ft. The anchor rods
were 2.5 in. in diameter at 6 ft spacing. The steel sheet pile is PZ27. The
only observed distress was a general state of corrosion judged to be about
Level 2.
Expert Rating
59. During the field test, each expert was given a copy of the form
shown in Table 5 for each wall. As indicated on the form the expert was
first asked to estimate the functional condition index for each of the indi-
vidual distresses listed. The condition rating scale is summarized at the
bottom of the sheet and described in somewhat more detail in Part II. The
experts viewed each wall and then observed several distresses summarized
earlier in this section. The expert was also asked to assign a weight factor
(defined in Appendix C) to each distress, considering wall location and
function. Finally, an overall wall functional condition index was requested.
The results from each expert for each wall are presented graphically in
Appendix E.
70. The averages of the experts' ratings for the individual distresses
are present in Figures 14 through 21. When these averages were compared to
the subjective condition indexes in a previous version of the rating system,
several observations were apparent.
a. The previous version tended to overrate the wall. This was
corrected by introducing Eq. (C.1) for the functional condi-
tion index.
b. No expert gave a condition index of 100. Apparently, the
experts judged that no wall could be "perfect" if it had been
in existence for several years, even though no particular
56

Figure 13. Thomas J. O'Brien lower guide wall
57

EEXPERT AVERAGE RATING MODEL100
90
X 80-W/
7 0
zo 50 /
40
20
10
90?. 80 G /%
- s, it04-\
1 009 0
707
404
10//20/
Figure 15. Corrosion rating comparison with experts
58

MEXPERT AVERAGE RATING MODEL10090 K
X 80 'K'LI
8 0
S40/Z 30 'A/6
20/10 /~0-
Figure 16. Settlement rating comparison with experts
M EXPERT AVERAGE RATING MODEL100 Q/ //
90k A/
x 80 /;/4
Z 60 //
z -
2 50 /
40
30V20
10 A
V VV\,OO
Figure 17. Cavity rating comparison with experts
59

~EXPERT1 AVERAGE RATING MODEL
x80k :K<w o 70L
60o '~ ><-'. w7 7
0 so 4'~ 4 S/40/
10k ~Z J /
Figure r a~e L': S2 C1O,1c)n so ni ,4 th expertc
fEXPERT AVERAGE ZRATING MODEL100 1 -m r / A90K 2%7%' Y _A
80 A, 'W AY '
O70 i#J~ SjK'~'
o 50/.E40 H44/r viKVZ 30 V1 ,,
o 20 /ZWt.7's/4 ./
10 'A
VI'1 // A'C0
Figure 19. Hole rating comparison wich experts

ED EXPERT AVERAGE RATING MODEL
100
90
X 80 -O 70
60
0 20 INA/2 /'/
S 40Ni
100
0~~ .0 0) 1
Figure 20. Dent rating comparison with experts
M EXPERT AVERAGE RATING MODEL100
90 7X 80 P7 7
100 K 170
607
0so
40 / 7o 30
O O 201 i20
Figure 21. Crack rating comparison with experts
61

distresses could be documented. No correction was made to the
current ra t t ig model to re I Iect th is observatLi on.
C. No condition indexes of zero were recorded. Equation (C.1)
reflects this change.
With these modifications to the previous version, the walls were re-analyzed
ustu1g the current version and the result-ing individual distress, functional
condition indexes are compared to the expert averages in Figures 14 through 21.
7 i. With regard to the overall. wafl rating, one observation was very
clear--if a wall had a ma.'or dJistress, the cverall wall rating was greatly
affCct-ed. ThaL is, if a d4,istress became severe, 4ts importance was increased.
For tx~tmple. Wall C hadl o severe corrosion problemn. The experts gave the
wall a very low overall rating eveii taough they gave corrosion only about a
25'10 eighting factor. This w .f: to s ;..-ccotintad for by introducing the
6 U6L1i111flt IeLcor1 (Ieccribed _,i ~~~ The adj:ust ment factor
increases- tnh i.pt-c cf aiJs~s as _.n, distress becomes more severe.
A oLp: ;riI ti h xy ' ,i~;ve ra;,- aiil Oe ov -ral I func tional cond- t ion
index from the currenr vrrsim,, is sainnarizeJ in i'tglre 22.
72. The correc. \7er3.i, 'Ji o .1 e rating system now shows an improved
reflection of the experts' SUbjective rating. As one might expect, however,
there is still variar-e bLetween. the current version and the experts and, in
fact, bet,,;eeni individual expcfts (Apy-:ndix E). The results of any rating
mnust be interpreted in this li?,ht.
ED EXPERY AVERAGE E: RATING MODEL100 r90 1--
X 80
Q 70 _7 r7/- 60
40AZ 30 "0 0
10 K/~
0
Figure 22. Wall subjective condition Index rating comparison with experts
62

PART V. SUMMARY AND CONCLUSIONS
Summary
73. As a part of the U S Army Corps of Engineers REMR program, a
project team at Iowa State University has developed an inspection and rating
procedure for steel sheet pile structures. Steel sheet pile anchored, canti-
levered and cellular structures serve as lock walls, dams, guide walls,
protection structures, and mooring structures.
74. The inspection and rating procedure has intentionally been kept as
simple as possible. The inspection requires only simple hand tools such as a
tape measure, level, weighted rope, and string. An inspection form has been
developed upon which is recorded historical information (location, previous
inspections, or repair history, etc.), structural information (wall type, SSP
cross section, pile lengths, water depths, dredge line depth, surcharge
loadings, etc.) and distress documentation (misalignment, corrosion, settle-
ment interlock separation, etc.). PC software has been written to, first,
produce the inspection form and, after the inspection, to record the inspec-
tion information on disks.
75. A condition index is computed directly from the inspection records.
The condition index is a number scale from zero to 100 that indicates the
current state of the structure. It is primarily a planning tool that indi-
cates the relative need to perform REMR work. Condition indexes below 40
indicate that immediate repair is required or, possibly, that a more detailed
inspection and re-analysis are required.
76. Two separate condition indexes make up the condition index. The
structural zondition index is a reasonably objective measure of the structural
safety. It is related directly to the factor of safety, which is automati-
cally calculated by the PC software. A functional condition index, based
upon the opinion of several experts from the Corps of Engineers, is also
calculated. It involves at least two considerations: (1) serviceability, or
how the structure performs its function on a day-to-day basis and (2) subjec-
tive safety, or how, in the judgment of expert engineers, the safety of the
structure has been degraded by various distresses.
63

77. The inspection and rating procedure has been applied in two field
tests (July 1986 and July 1987). The results of these tests have been
incorporated into the current version of the procedure.
Conclusions and Recommendations
78. The current inspection and rating procedure for steel sheet pile
structures has had sufficient development and testing to warrant its distri-
bution on a wider basis. However, it should still be considered in a state
of development. Many of the concepts introduced herein, such as structural
condition inacx, functional condition i-idex, X values, and weightingmax
factors, should be exposed to a broader range of engineers who work in the
area. -odifications to the procedure are certainly expected and welcomed.
64

REFERENCES
Dawkins, William P. 1981. Users Guide: Computer Program for Design andAnalysis of Sheet Pile Walls by Classical Methods, U.S. Army Corps ofEngineers, Washington, D.C.
Terzaghi, K., and Peck, R. B. 1948. Soil Mechanics in Engineering Practice,Wiley and Sons.
U.S. Army Corps of Engineers. 1958. Design of Pile Structures andFoundations, Washington, D.C.
United States Steel Corporation. 1972. USS Steel Sheet Piling Design Manual.
Winterkorn, H. F., and Fang, H.-Y. 1975. Foundation Engineering Handbook,Van Nostrand Reinhold.
65

Table I
Condition Index Scale
Value Condition Description
85-100 Excellent--No noticeable defects, some aging or wear may bevisible.
70-84 Very Good--Only minor deterioration or defects are evident.
55-69 Good--Some deterioration or defects are evident, function isnot impaired.
40-54 Fair--Moderate deterioration, function is not seriouslyimpaired.
Poor--eious deterioration in at least some portions of
scructure, function is seriously impaired.
110-24 Verj Poor--Extensive deterioration, barely functional.
0-9 Failed--General failure or failure of a major component,no longer functicnal.
Table 2
Condition index Zones
Zone CI Range Action
70-100 Immediate action is not required.
2 40-69 Economic analysis of repair alternatives isrecommended to determine appropriate maintenanceaction.
3 0-39 Detailed evaluation is required to determine theneed for repair, rehabilitation, or reconstruction.Safety evaluation is recommended.
66

Table 3
Distresses In Steel Sheet Pile Structures
Distress Code Distress Brief Description
I Misalignment Horizontal or vertical devia-tion from the design alignment
2 Corrosion Loss of steel due to interac-tion with environment
3 Settlement Vertical movement of materialbehind sheet pile
4 Cavity formation Loss of fill material behind orwithin sheet pile
5 Interlock separation Failure of sheet interlocks
6 Holes Broad opening in sheet
7 Dents Depression in sheet withoutrupture
8 Cracks Narrow break in sheet
Table 4
Main Menu
Steel Sheet Pile (SSP)Main Menu
1. Create new job files
2. Update previously entered files
3. Print file contents
4. Calculate subjective condition index
5. Calculate safety condition index
6. Display summary report
7. Exit program
CHOICE:
67

Table 5
Wall Evaluation Form for SSP Inspection Field Test
WALL EVALUATION FORM FOR SSP INSPECTION FIELD TESTCHICAGO. IL. JULY 14 & 15. 1987
SSP STRUCTURE NAMEWALL
DISTRESS TYPES AND ESTIMATED CONDITION INDEX RATING
MISALIGNMENT NO. OF OCCURRENCES WEIGHT FACTOR 100 --- r---loo 90 80 70 60 50 40 30 20 10 0
90 -- i--
CORROSION NO. OF OCCURRENCES WEIGHT FACTOR
100 90 80 7u 60 50 40 30 20 0 0
-- - -. I ---- --- --- I - - 8 0CORROSION LEVEL 1 2 .3 .4 ,OR 5
SETTLEMENT NO. OF CC:URRENCES WEIGHT FACTOR 70 -- I--100 90 80 70 60 50 40 3u 20 10 0
I . . i - - . . . . __..__.. .__.. ._.. ... _.. . -. .
60 -- I--CAVITY FORMATION NO. Of OCCURRENCES WEIGHT FACTOR100 90 80 73 60 50 4U Zo 20 o 0
- . . . . . . . .. 50 -- I--
INTERLOCK SEPARATION NO. OF OCCURkENCES WEIGHT FACTOR I100 90 80 70 60 50 43 30 20 10 0 40 -- 1--
I . .. . .. . . . . . . . .. - - -1 i.. 1 -. . -I~ ... .. __... .__
HOLES NO. OF OCCURRENCES WEIGHT FACTOR 30 --I--100 90 80 70 60 50 40 30 20 10 0 1
20 --I--DENTS NO. OF OCCURRENCES WEIGHT FACTORIOU 90 80 70 60 50 40 30 20 10 0
. . . . . . . . . . .10 -- --
CRACKS IN SHEET NO. OF OCCURRENCES _ WEIGHT FACTOR100 90 80 70 60 50 40 30 20 10 0 0
I .. .. i. I-- ---- - i- ....- --- .... I------------...____...._
CONDITION RATING SCALE DESCRIPTION:
90 - 100 EXCELLENT, NO REPAIRS NEEDED80 - 89 GOOD, SOME AGING AND WEAR NOTICEABLE
70 - 79 GENERALLY GOOD, MINOR DETERIORATION OR DEFECTS ARE EVIDENT60 - 69 ACCEPTABLE. DETERIORATION & DEFECTS EVIDENT, FUNCTION NOT IMPAIRED
50 - 59 FAIR. MODERATE DETERIORATION, FUNCTION IS SATISFACTORY40 - 49 MARGINAL. SIGNS OF DISINTEGRATION, FUNCTIONS AT REDUCED EFFICIENCY30 - 39 POOR. EXTENSIVE DETERIORATION, FUNC'IIONAL BUI GREATLY REDUCED EFkILILNY20 - 29 VERY POOR. BARELY FUNCTIONAL: NEED IS URGENT FOR ACTION10 - 19 CRITICAL, GENERAL CONDITION FAILURE0 - 9 FAILED, BEYOND REASONABLE REPAIR
PROCEDURE:STEP 1: GENERAL OVERVIEW OF WALL AND iDENTIFY DISTRESSES PRESENTSTEP 2: ASSIGN A CONDITION INDEX TO EACH DISTRESS CATEGORY
STEP 3: ASSIGN A WEIGHT FACTOR % CONSIDERING ALL DISTRESSES, PRESENT OR NOT.STEP 4: ASSIGN AN OVERALL WALL RATING INDEX TAKING INTO ACCOUNT DISTRESS CI AND WF.
68
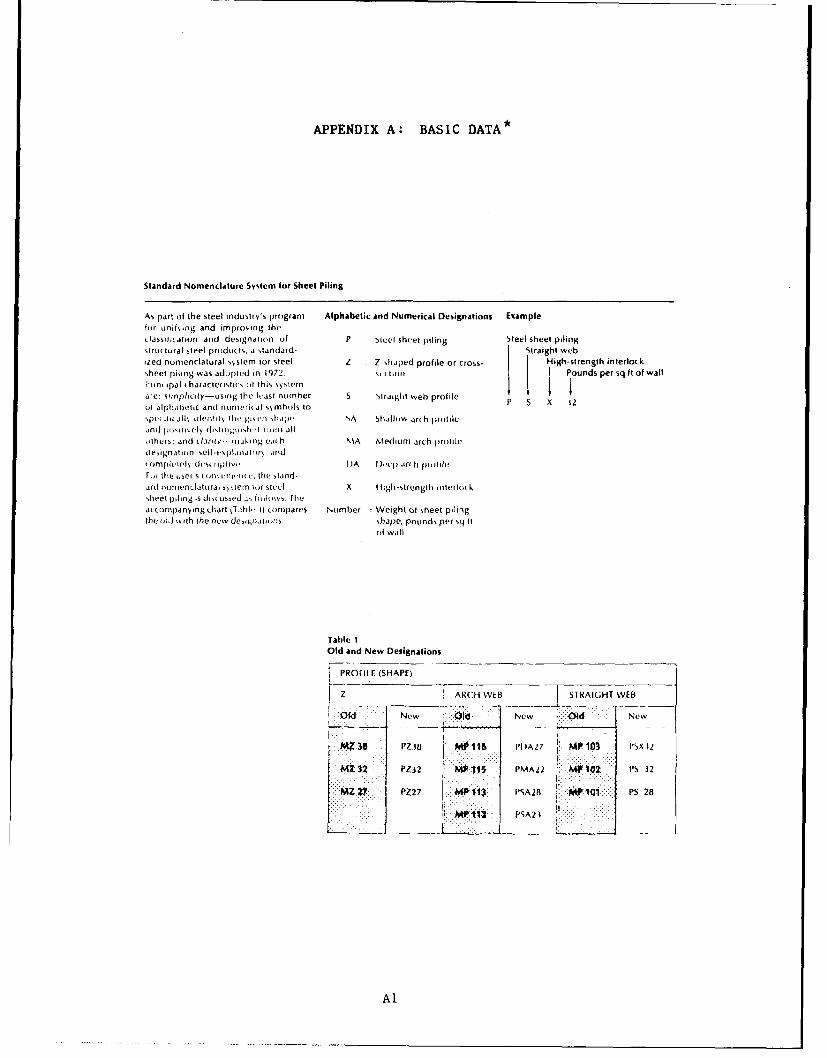
APPENDIX A: BASIC DATA*
Standard Nomenclature System lor Sheet Piling
As part of the steel industry's program Alphabetic and Numerical Designations Examplefor unifying and improring theclasslti(atlon and designation of P steel sheet piling Steel sheet pilingstructural steel prodclts. a standard- Straight webied nomenclatural s~stem tor steel Z - Z-shaped profile or cross- High-strength interlocksheet piling was adujited in 1972. 'titollI Pounds per sq Ift of wallPo ncpal i haracter ist ic, it this sy stemrnIIare: sinplicity-usirrg the least numbher S Straight sveh profileitt alIpha betic and nmireiat sysmhls to P 5 X 1
otthers; and uliavr'- akIng en h MA Mieditint arch protle(tesi gnation self -is plalta to r) anrd
Fw~ the user s con, ui ll-u thec stand-ard nomnncltUral 5 stein Ito steel X fi tgl-strength interll,sheet piling is discussed a, oi los Theaccompanying chart 5 Tibl, It compares Niumber Weight of sheet pilingthe- Ml a ih the netswe~itii shape, pounds per I~ ft
of wall
Tattle 1Old and New Designations
K-PROrFtL.E (SHAPE)
z e ARCH WEB J STRAIGHT WEB
IOld New Ne O::bld New
1Mz38 PZ~j8 W.116 DA2 MP 1103 l'SX 12
*MZ 32: PZ32 so. .115 I1MA2 02 PS 32
* 7 PIZ27 M13 I SA28 * M1iQ.i PS 28
MIZ PSIA21
Al

Basic Data
Table 2 American Engineering UnitsSlandard Sheet PilingA General Description
WEIGHT i I ION MODUtUSI
IIN.T 01- S T ARIA [)RIVING.1 PFR FTFT L A ~WIDTIH WALl E PL
DESIGNATION PROFILE L13 LI INCH2
INCH INC;' INCH'--- ---- ,- . -~ ... .~ -----
PZ38 < _- , < 57,0 3&80 1h8 18 46.8 70.2
PZ32 ! 36.0 21 383 67.0
PZ27 401 27.0 I 1 8 M.2 45.3
Pr -N27 1 160 27.0 10.6 1h 107 14A
PMA22 6 20 8.8
PSA28 37.3 28 0 1 i,n 16 25 .3
PSA23 " 30.7 23.0 9.0 1 16 2.4 2
PSX32 i 44.0 120 3.0 16!/ V 2A 3.3t2.PS32 4 320 11.8 9 2 4
PS28 135.0 28 10.3 5 1.9 2.4
A2
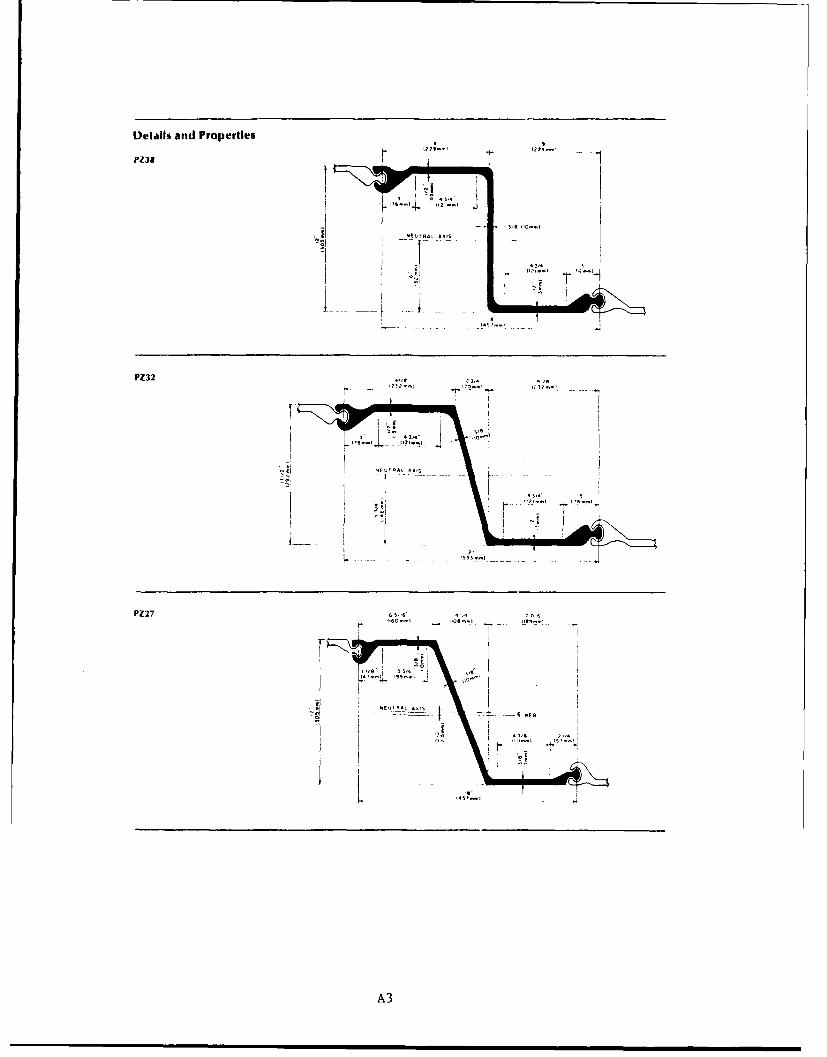
Details and PropertiesV
S
PZ38
t L .A.. A IS
PZ32
-I
i~
4 314iPZ27
, 5'6
11
4, '11 2
I ,4
II
_
-
A3*53.

Details and Properties
PDA27
PMA22
PSA28
PSA23
A4

Details and Properties
PSX37
PS32
PS26
A5

APPENDIX B: STRUCTURAL SAFETY
Structural Analysis
1. A basic part of the structural safety evaluation is a structural
analysis. As with all structural analyses, several assumptions must be made.
In this work, the basic assumption is that steel sheet piles behave in the
manner in which they were designed. With this assumption, the U S Army Corps
of Engineer design manual (1958) and the USS Steel Sheet Piling Design Manual
(1972) are used for the safety analysis. These sources are supplemented by a
U S Corps of Engineering computer program (Dawkins 1981) that implements
these rules. In summary, these documents describe how to calculate the active
and passive soil pressures on the steel sheet pile by the Coulomb theory.
Cantilever and Anchored Walls
2. For anchored walls, the equivalent beam method is used to calculate
the bending moments in the sheet pile and the anchor tension. In the equiva-
lent beam method, the sheet is assumed to act as a statically determinate
beam from the top to the inflection point below the dredge line (Figure BI).
This inflection point is assumed to occur at the point of zero net soil
pressure, that is, passive pressure equal to active pressure. In cantilever
wall design, the sheet is embedded to a sufficient depth to behave as a
vertical cantilever. With reference to Figure B2, the pile is assumed to
rotate about point 0, mobilizing passive pressure above and below the pivot
point 0. Equilibrium is satisfied for horizontal forces and moments about
any point.
3. Three failure modes are analyzed and three factors of safety are
computed:
Pile sheet bending mode
FS = /f b (B.1)
Anchor tension mode (anchored wall only)
FS = F y/ft (B.2)
BI

SURCHARGE
DEFLECTED ANCHORWALL /
//
//
/MAX IMUMMOMENT
ASSUMED \ZERO
POINT OF-- PRESSUREINFLECTION POINT
3 C
(a) NET PRESSURE (b) MOMENT DIAGRAM
Figure BI. Anchored wall design by equivalent beam method(granular soil)
B2

SURCHARGE
DEFLECTED - --J ,
WALL I
DREDGE
MAXIMUMMOMENT
PIVOT
POINT, 0
(a) NET PRESSURE (b) MOMENT DIAGRAM
Figure B2. Cantilever wall
B3

4. Soil failure at toe
FS3 =(c + tan *)/T (B.3)
in which
F = steel yield stressy
f = maximum pile-bending stress
f = tensile stress in anchors or bolts
= soil normal stress
c - soil cohesive strength
= soil friction angle
T = soil shear stress
To limit the program scope to the available time, some failure modes are not
analyzed: fixing bolt, wale bending, and anchor system failure. Also, only
uniform surcharge loadings are considered.
5. The steel yield strength is requested on the inspection form. If
it is not available, it is assumed to be 36,000 psi. The inspection form
lists various broad categories of soil descriptions. Table B1 lists the
soil properties that are used within this analysis for each of these descrip-
tions. These are approximate values selected by the authors as represent-
ative. As discussed in U S Steel (1972, p. 25), the cohesive strength for
clays may approach zero for long-term loading. Some suggest that an appro-
priate assumption for such cases is to take the cohesion equal to zero and a
friction angle between 15° and 250. Others state that this is too conserva-
tive (U S Steel 1972, p. 427). In any case, the long term behavior of the
soil behind a retaining wall is not well described (U S Army Corps of
Engineers 1958, p. 313). For this work, the properties listed in Table B1
will be used. If users wish to use a more conservative assumption, they may
enter a weaker soil into the inspection sheet.
6. A computer program has been written to calculate the factors of
safety listed above. The program interfaces with the disk prepared with the
inspection data. Hence, to calculate the safety of a steel sheet pile struc-
ture, one need only respond appropriately to the computer prompts (Table 4).
Within each section, the computer selects the worst case in terms of lowest
dredge depth or largest loading (page 6 of inspection form). The water level
B4

Table BI
Assumed Properties of Soil
Unit Friction Wall Cohesion
Weight Angle Friction (C)(PCF) (0) (6) (PSF)
Short-term Soil Properties
1. Sand 90 30 10 0
2. Gravel 110 35 11 0
3. Rock 90 45 15 0
4. Soft clay 95 5 0 400
5. Medium clay 105 10 3 800
6. Stiff clay 115 15 5 1500
7. Unknown 95 5 0 400
is assumed to be the same on both sides of the wall, since the water levels
usually change slowly enough to permit equalization of the water level on both
sides of the sheet. (This is not assumed for cellular lock walls.) Addition-
ally, the water is conservatively assumed to be at the low water level on page 1
of the inspection sheet. If users wish an analysis at a different water level,
they may enter another low water level on page 1 of the inspection sheet.
Cells and Cellular Walls
7. Single cells are designed to resist impact or mooring forces from
vessels, while cellular walls are usually designed to resist water and soil
pressures. While the applied forces on a single cell are different from
those on a cellular wall, the analysis for stability is the same for both.
Cellular structures consist of two different materials, steel and soil, which
interact in a complex way to resist forces. A totally rational design
approach is difficult. Designers rely heavily on past practice and experi-
ence. Generally, the design is performed by first establishing the control-
ling dimensions: the height of the structure, and the low and high water
elevations. The design of cellular structures is generally separated into
two categories: cellular structures on rock foundation and cellular struc-
tures on deep soil deposits.
B5

8. Three different factors of safety associated with three different fail-
ure modes are considered for all cellular structures (see Figure B3) (U S
Steel 1972):
9. Vertical shear on centerline of cell
FS, = ST/Q (E.4)
10. Sliding on foundation
FS2 = F R/FD (B.5)
11. Bursting
FS3 = tuitmax (B.6)
tfe re
S_ = shearing resistance of the cell fill and the interlocks
Q = shearing force per unit length of cellular structure
FR = horizontal resisting forces
FD = horizontal driving forces
t = minimum ultimate interlock strengch
L = maximum interlock tensionmax
For cellular structures founded on consolid3ting clay (soft to medium) the
foundation failure factor of safety is also considered (U S Steel 1972):
FS4 = 5.7c/yH (B.7)
where
y unit weight of fill
H height of cellular structure above ground surface.
B6

II
B 7

12. To determine the structural condition index of the cellular structure,
the high water level and the low water level that give the worst combination
are used to give the lowest factor of safety.
13. For cellular walls, the high water level is assumed to be on the
right side of the wall, but not higher than the top of the cell (see Figure B4(a)).
The low water level is assumed to be on the left side of the wall. In the
case of a lock chamber wall, the low water level is assumed to be at the
dredge line.
14. For a single ceil, the structural condition index is calculated at
both the low and the high water level (not higher than the top of the cell)
Oflt the rlimw of these two values is used (see Figure B4(b)).
15. In both cases, if users wish to make the analysis fo- different
water cevations, they may do so bj changing the low and high water level on
age. " o -. the inspection form.
Structural Condition Index
Th. The factor of safety is related directly to the structural condition
index using the condition index zones in Table 2. If the factor of safety is
equal tc the design value, the condition index is 100. If the factor of
safety falls below one, a Zone 3 (condition index less than 40) is indicated.
Figure B5 ilitstrates the two straight lines that are used to relate factor
o- safety and structural condition index:
(40 - F'S FS < 1ci = ' (B.8)
140 + 6(FS-) FS >1
'i~re ['S] is the desigin factor of safety.
17. As described in the previous section, several factors of safety
,ire calculated, one for each failure mode. The condition index for each
mode, CIi, is calculated using Eq. (B.8). The combined structural condition
tndex [or the wall section is found as
B8

TOP OF CELL
H.W.L. . _ H.W.L.
LW.L. L.W.L.
DREDGE
(a) (b)
Figure B4. Water level worst case: (a) cellular wall,
(b) single cell
< t : , r u a :I = \ ]-I 0 0 / \ -TI 60 / ... ( B .9 )
If a wall has more than one subsection, the minimum value from all of the
subsections is used.
18. Most distresses (Appendix D) are not included in the calculated
structural condition index. However, scour is directly included. Scour is
erosion of soil at the toe of the wall caused by water currents. The effect
of scour on safety can be dramatic, since the passive soil resistance at the
wall toe can be significantly reduced. Actual dredge line elevations from
the inspection sheet are used in the safety calculations.
B9

100Z
ZONE
80I
60 -
Iii
20 -
0 1 DESIGN VALUE
FACTOR OF SAFETY
Figure B5. Relationship between factor of safety and structural
condition index (Eq. B.8)
B1O
APPENDIX C: SERVICEABILITY AND SUBJECTIVE SAFETY
1. As discussed in the section called "Functional Condition Index", a
second condition index has been developed that describes more subjective
aspects of the rating system, that is, serviceability and subjective safety.
The functional condition index is qualified by relating it to X and Xmax
The quantity X is a measurement of the distress level that is recorded on the
inspection sheet. The value of X at which the condition index gives a Zone 3
value (Table 2) is called X . (See Appendix D for X values). Severalmax max
equations and curves have been suggested to relate the ratio X/X to themax
functional condition index. The current version of the program uses the
equation
X /IX m
Functional CI = 100(0.4) max (C.1)
P&art IV discusses the correlation of this equation with the collective
judgment of Corps engineers for nine walls. Figure CI illustrates the
equation. As defined, the condition index is 40 if X is equal to X . If X
is zero, that is, no distress, the condition index is 100. Note that the
functional condition index never quite reaches zero.
. If there are several occurrences of a single distress type i, the
condition index is found as
Distress Cl = lo0(CI- )( C I ) (C.2)i i-10 100) . .( .2
That is, the functional condition index for distress i is equal to the product
of the condition indexes for each individual occurrence of the distress.
This equation is used for all distresses except corrosion (see Appendix C).
3. When several types of distress occur, such as both misalignment and
settlement, the serviceability condition indexes must be combined into a
single value. Weighting factors are introduced to reflect the importance
of the various distresses. Hence, let wi be the weighting factor for the
C1

(0
CM)
N'z
cor
N' \o Ez z
,o X0St)
0 \N 6
C2C

functional condition index for distress i. For illustration purposes, sup-
pose the weighting factors for three distresses are selected as listed below:
w. W3. 1
Misalignment 2 50
Settlement 1 25
Corrosion 1 25
This means that misalignment carries twice the weight of corrosion and settle-
ment in the evaluation of the combined functional condition index. The selec-
tion of the weighting factors is probably an even more subjective process
than the selection of the X values. Tentative values are proposed withinmax
this document for the trial application of this procedure (Appendix D). The
normalized weighting factors are defined by
W.i = wi/1wi (100) (C.3)
Note that
W. = 100 (C.4)1
Illustrative values are listed above. The combined functional condition index
for all distresses is then given by
Functional CI = W CI1 + W 2CI 2 + (C.5)
4. During the field testing of a preliminary version of the above
rating procedure, it became clear that, as a distress became more severe, its
relative importance became larger. To account for this, a variable adjustment
factor was introduced to increase the distress weighting factor as its
functional condition index approached Zone 3 (Table 2). The adjustment
factor, plotted in Figure C2, has a maximum value of eight; that is, if a
listress has a condition index less than 40, its importance increases eight
times.
C3

wZ0
oVN O0
CDC
z C)O.0
0 4
CC-
41
C4
5. An illustrative example may be helpful. Suppose the following dis-
tresses are recorded:
CIX Xmax (Eq. C.1)
Misalignment 6 12 63
Settlement 2 12 85
Misalignment 4 6 54
Corrosion 3 5 58
Following Eq. (C.2), the functional condition index for misalignment is
100(0.63)(0.54) or 34. The initial weights from above, the adjustment factor
from Figure C2, and the revised weights are found as:
initial Adjustment Revised RevisedCI w. Factor w. W. (%)I1 1
Misalignment 34 2 8.0 16.0 76
Settlement 69 1 1.2 1.2 6
Corrosion 58 1 3.8 3.8 18
21.0
The final functional condition index is now found as
Functional CI = 0.76(34) + 0.06(85) + 0.18(58)
= 41
which would put the wall at the dividing point between Zone 2 and 3.
C5
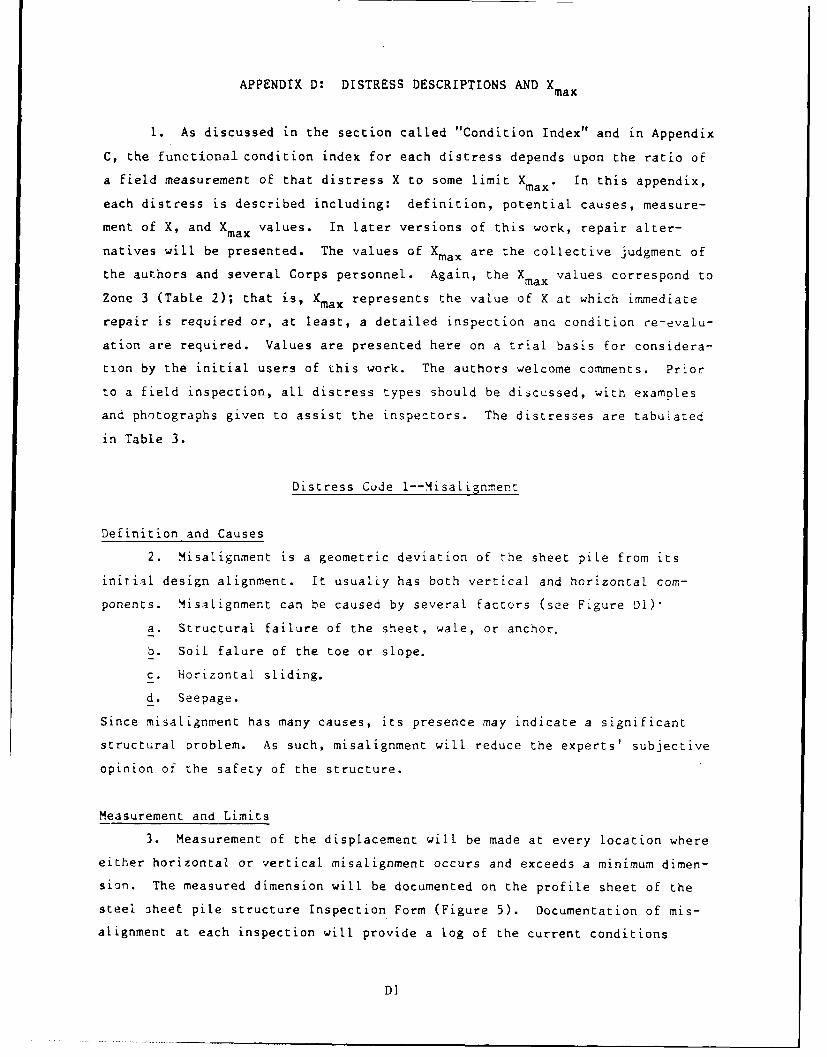
APPENDIX D: DISTRESS DESCRIPTIONS AND X x
1. As discussed in the section called "Condition Index" and in Appendix
C, the functional condition index for each distress depends upon the ratio of
a field measurement of that distress X to some limit Xmax* In this appendix,
each distress is described including: definition, potential causes, measure-
ment of X, and Xmax values. In later versions of this work, repair alter-
natives will be presented. The values of Xmax are the collective judgment of
the authors and several Corps personnel. Again, the Xmax values correspond to
Zone 3 (Table 2); that is, Xmax represents the value of X at which immediate
repair is required or, at least, a detailed inspection ana condition re-evalu-
ation are required. Values are presented here on a trial basis for considera-
tion by the initial users of this work. The authors welcome comments. Prior
to a field inspection, all distress types should be discussed, with examples
and photographs given to assist the inspectors. The distresses are tabulated
in Table 3.
Distress Cude 1--Misalignment
Definition and Causes
2. Misalignment is a geometric deviation of he sheet pile from its
initial design alignment. It usually has both vertical and horizontal com-
ponents. Misalignment can be caused by several factors (see Figure Dl)"
a. Structural failure of the sheet, wale, or anchor.
b. Soil falure of the toe or slope.
c. Horizontal sliding.
d. Seepage.
Since misalignment has many causes, its presence may indicate a significant
structural problem. As such, misalignment will reduce the experts' subjective
opinion of the safety of the structure.
Measurement and Limits
3. Measurement of the displacement will be made at every location where
either horizontal or vertical misalignment occurs and exceeds a minimum dimen-
sion. The measured dimension will be documented on the profile sheet of the
steel sheet pile structure Inspection Form (Figure 5). Documentation of mis-
alignment at each inspection will provide a log of the current conditions
Dl

EXAMwPLES OF FAILURES:
SHEET
WALE OR ANCHORt
TOESLP
ST4CELL SRUCTURE FAILURES:
/Z
TIPPING SLIDING UNDERSEEPAGE
Figure D1. Causes of misalignment
D2

as well as a record for future inspections to determine the rate of deflec-
tion. This rate can give information as to the severity of the misalignment
problem. The Xmax values for misalignment for various steel sheet pile
structures are listed in Table Dl.
Examples
4. a. A lock guide wall 1500 ft long has a bow from 5+00 to 7+00
with the maximum deflection of 8 in. at 6+00 (or 600 ft from the 1200 ft lock
chamber). From the formula in Table D1,
X =6+6 (600 9max 91200.
and the functional condition index for this case (Eq. C.1) is
CI 1 100(0.4)8/9 = 44
5. b. An erosion control wall 3000 ft long and 2 miles upriver from
a lock ha- an i8 in. bow that is 600 ft long. Select 40 in. for X frommax
Table DI. The functional condition index is
CI = 100(0.4)18/40 = 66
6. c. A cell 40 ft high and 32 ft in diameter is 3 in. out of plumb
in 24 in. within the exposed height. It is used for protection in the upper
pool. The ratio of cell diameter to height is 32 ft/40 ft or 0.80. Select
X = 4 in. from Table Dl. The functional condition index ismax
CI = 100(0.4)3/4 = 50
Distress Code 2--Corrosion
Definition and Cause
7. Corrosion is the loss of the steel material in the sheet pile due
to interaction with its environment. The rate of corrosion is dependent upon
D3

Table DI
X Values for Misalignmentmax
WALLS
Transition Wall orRetaining Wall or
Guard Walls
Length of Lock LockMisalignment Chamber Guide Wall Near Lock Remote
(ft) (ill.) (in.) (in.) (in.)
0 to 20 6 Formula 12 18
below20 to 100 6 18 24
100 to 500 6 24 32
500 6 24 40
Formula for Lock Guide Wall:
X 6 + 6 distance from lock in.max (length of lock chamber)
SINGLE CELLS
Misalignment (in./2 ft of height)
Upper Pool Lower PoolRatio of
Cell Protection Mooring Protection MooringDiam./Height* Cell Cell Cell Cell
-0.75 4 2 2 1
0.5 - 0.75 3 1.5 1.5 1
<0.50 2 1 1 0.67
*Height is distance from top of cell to dredge.
D4

the oxygen concentration and moisture in contact with the steel. A steel
sheet pile structure is exposed to different zones of corrosion (Figure D2).
While corrosion is usually very evident and easily noticed in the exposed
areas, it is the concealed components that are of most concern for safety
reasons, that is, those well below the water surface.
Measurement and Limits
8. The effect of corrosion in the atmospheric and splash zones is
used to evaluate the functional condition index because it is visible there.
A distress coefficient for corrosion must take into account that corrosion of
a steel sheet pile structure can seldom impede the successful or smooth opera-
tion of the structure. However, a corroded structure of some age is not in
as good a condition as a new structure. Its safety has been reduced. The
effect is a subjective evaluation of safety that is difficult to quantify by
ieasurements or testing. One way to evaluate the corrosion of a structure is
to set a series of standards, or levels of corrosion, with corresponding
numeric distress coefficients. The base for such an evaluation standard
would be new steel sheet pile or clean and painted steel sheet pile with no
scale or pitting. The various levels of corrosion are described in Table D2
and illustrated in the associated photographs in Figure D3. If more than one
level of corrosion is recorded for a wall, the corrosion condition index is
obtained as the length times the weighted average.
\ \ ATMOSPHERIC
FILLSPLASH v
SUBMERGED
UNDISTURBED SOIL
Figure D2. Zones of corrosion
D5

Table D2
Levels of Corrosion*
Level Description
0 New condition
I Minor surface scale or widely scattered small pits
2 Considerable surface scale and/or moderate pitting
3 Severe pitting in dense pattern, thickness reduction inlocal areas
4 Obvious uniforc; thickness reduction
5 Holes due to thickness reduction and general thicknessreduction
*Refer also to Figure D3.
(a) LEVEL 11MINOR SURFACE SCALE OR WIDELYSCATTERED SMALL PITS
Figure D3. Photos of levels of corrosion in atmospheric zone
(Sheet 1 of 3)
D6

(b) LEVEL 2:CONSIDERABLE SURFACE SCALE AND/OR MODERATE PITTING
40 ,: 11
(c) LEVEL 3:SEVERE PITTING IN DENSE PATTERN,THICKNESS REDUCTION IN LOCAL AREAS.
Figure D3. (Sheet 2 of 3)
D7
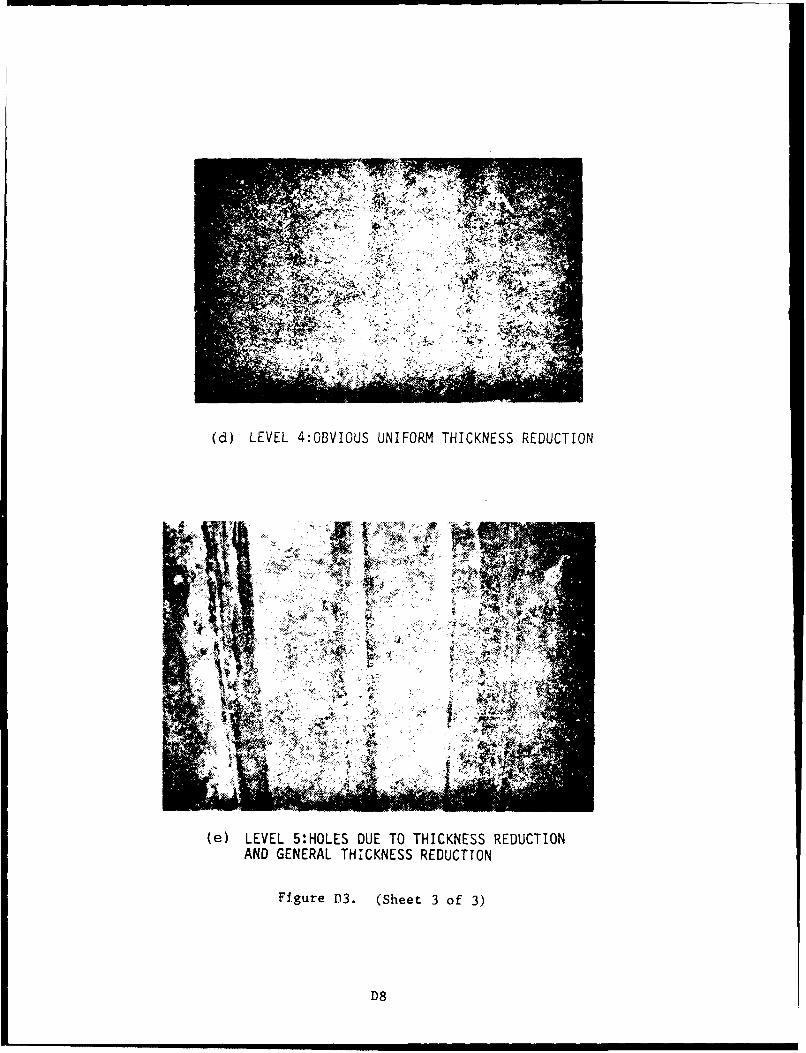
(d) LEVEL 4:OBVIOUS UNIFORM THICKNESS REDUCTION
(e) LEVEL 5:HOLES DUE TO THICKNESS REDUCTIONAND GENERAL THICKNESS REDUCTION
Figure D3. (Sheet 3 of 3)
D8

Example
9. A 600-ft steel sheet pile wall has a corrosion level of 1 over
500 ft and a corrosion level of 3 over 100 ft. The functional condition
index for the 500 ft length is calculated as
CI = 100(0.4)1/5 = 83
and for the 100 ft length as
Ci = 100(0.4)3 / 5 = 58
so that the final corrosion functional condition index is
CI = 83 (2-)+ 58(- =79
Distress Code 3--Settlement
Definition and Cause
10. Settlement is the vertical movement of the soil behind the sheet
pile. It can be caused by consolidation of the soil, loss of backfill, or
wall movement. Settlement can affect operation behind the wall. in cells it
can indicate a partial loss of strength, that is, a subjective reduction in
safety.
Measurement and Limits
11. Measurement will be made at every location where settlement occurs
and exceeds a minimum dimension. The measurements must note the location of
the depression on the profile sheet. The settlement depth is recorded and
used to calculate the functional condition index. Additional documentation
of the width behind the structure is also recorded. The X limits formax
settlement are listed in Table D3.
Examples
12. a. A lock guide wall (cantilevered, anchored, or cellular) is 1500
ft long and has no surfacing behind the wall. A depression 27 itt. deep by
D9

Table D3
Maximum Limits for Settlement
WALLS (anchored, cantilevered, and cellular)
AtLength of Lock Remote
Settlement & Chamber Near Lock (>1000 ft)Surface Cond. (in.) (in.) (in.)
Supporting a 4 6 6structure
<20 ft & hard 4 12 18surfaced
>20 ft & hard 4 18 24
surfaced
<20 ft & no 4 24 36surfacing
>20 ft & no 4 36 48surfacing
BACKFILL WITHIN SINGLE CELLS
Rule 1: For uniform settlement (from top of structure or designlevel)
X = 1/2 in. allowable increment per 1 ft of cell heightmax
Rule 2: For differential settlement (slopes across top surface or thecap if tilted from level)
X = 3 in. slope per 10 ft diametermax
DI0

35 ft long occurs behind the wall at 800 ft from the lock. From Table D3,
select Xmax = 36 in. and find the functional condition index as
CI = 100(0.4)27/36 = 50
13. b. A single cell has a 42 ft diameter and is 24 ft tall. If a
uniform settlement of 5 in. occurs, the functional condition index is
CI = 100(0.4)5/12 = 68
If a differential settlement of 5 in. occurs,
CI = 100(0.4)5/(4.2)(3) = 70
Distress Code 4--Cavity Formation
Definition and Cause
14. Cavity formation occurs behind the sheet when some of the fill
material is lost. Associated settlement may or may not occur, but a potential
for settlement does exist. The material may be lost through a hole in the
sheet or beneath the sheets. The loss of fill material could obstruct naviga-
tion, damage underground utilities, and reduce strength.
Measurement and Limits
15. A cavity behind a sheet is recorded during the inspection by
measuring its size: depth, length, height. Its location (station) will also
be recorded. The volume of the cavity is used as the measure of its effect
on functional condition index. The limiting values are listed as Table D4.
Example
16. A cavity is found under the concrete cap on a single cell. The
approximate dimensions of the cavity are 2 ft wide x 18 in. x 10 in. high.
X = (2)(1.5)(0.83) = 2.49 ft3
Dli

Table D4
Maximum Volume Limits for Cavities
Above GradeSurfacing Wal1s CelsCondition (ft ) (ft )
No surfacing 27 16
Surfacing 8 8
Supportedstructure 3.5 3.5
Ci = 100(0.4)2.5/8 = 75
Distress Codes 5-8:5. Interlock Separation6. Holes7. Dents8. Cracks
Definition and Cause
17. These four distresses represent openings in the steel sheet. They
can be caused by several factors but usually are caused by impact or corro-
sion. Large, major holes due to impact will, most likely, be fixed very
shortly after they occur. Generally, they will not be present at an inspec-
tion and are, therefore, not included.
18. These four distresses are grouped together in terms of their con-
sideration for service loss and safety to the steel sheet pile structure. In
general, there is no significant loss or impedance to operation of the struc-
ture. However, as is the situation with corrosion, the occurrence of these
distresses does cause the steel sheet pile structure to be in a less than
design condition. Subjectively, the safety has been reduced though it may be
difficult to quantify in an analytical manner. These distresses may contrib-
ute in a direct manner to the presence of other primary distresses, such as
settlement, which have safety and serviceability consequences. In this case,
D12
the effect of the opening is also accounted for in the primary distress con-
dition index.
Measurement and Limits
19. The sizes of all significant separations, holes, dents, or cracks
are recorded. Openings below a certain size are ignored, for example, bolt
holes or lifting holes.
20. For each singular occurrence of any of these distresses, little
effect would be noticed on serviceability. However, the cumulative effect of
five of these distresses would be significant if they occurred in, say, 100 ft
of steel sheet pile structure. Therefore, the Xmax limits for openings are
defined in a slightly different manner than other distresses. No size limits
are explicitly defined, that is, how big or long is the distress. Rather,
notes are made of one occurrence of an interlock separation, a hole, a dent,
or a crack. Dimensions for each are recorded on the profile sheet. The
density of the holes per given length of structure is defined as X. An Xmax
of 5 holes/QO0 ft is selected, that is, 5 or more holes per 100 ft is a Zone 3
condition.
Example
21. If 10 holes are recorded in a 700 ft wall, X is equal to 10/7 holes
per 100 ft and the functional condition index would be
CI = 100(0.4) 10/(7)(5) = 77
Weighting Factors
22. As discussed in Appendix C, par. 1, the functional condition index
for the entire wall is a linear combination of the distress subjective CI times
weighting factors (Eq. C.5). The initial weighting factors assign more value
to the more significant distresses. Relative and normalized initial weights
are listed in Table D5. They reflect, to some degree, the opinion of the
experts summarized in Appendix E (Table E5). These factors represent the
opinion of the authors and are subject to change, depending on input from the
users of this evaluation. Note that these weights must be adjusted by the
adjustment factor of Figure C2.
D13
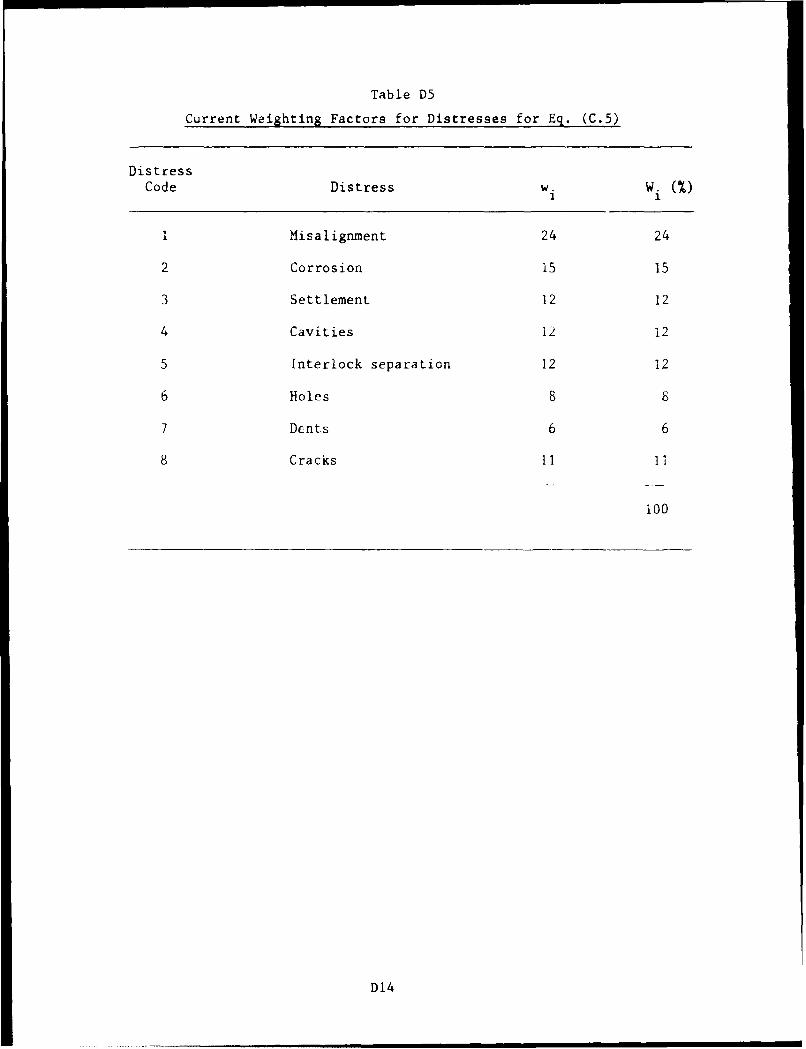
Table D5
Current Weighting Factors for Distresses for Eq. (C.5)
DistressCode Distress w w (%)
I Misalignment 24 24
2 Corrosion 15 15
3 Settlement 12 12
4 Cavities 12 !2
5 Interlock separation 12 12
6 Holes 8 8
7 Dents 6 6
8 Cracks 11 11
100
D14

APPENDIX E: EXPERT RATINGS FOR CHICAGO FIELD TEST
1. The results of the expert ratings of the nine walls listed in
Sec. 4 are presented in this appendix. Figures El through Eq show the func-
tional condition index of each expert from the forms in Table 5 for each of
eight distresses tor each wall. Figure El shows the overall wall ratings
given by each expert. The average weighting factors tabulated by the experts
are listed in Table El.
2. An overview of the data shows that one expert seemed to exaggerate
the wall distresses relative to the ratings of others. This most likely
3ccurrcd because it was his first exposure to the rating procedure and he may
not have been properly briefed on the rating scale. His results have not
been included in the averages presented in Part iV.
Tabie E
Average Weighting Factors by Experts
Average Weighting Factor (percent)
Distress Retaining Walls Guide Walls
Misalignment 14 29
Corrosion 18 10
Settlement 13 12
Cavities 11 9
interlock Separation 15 13
Holes 8 7
Dents 9 9
Cracks 12 10
El
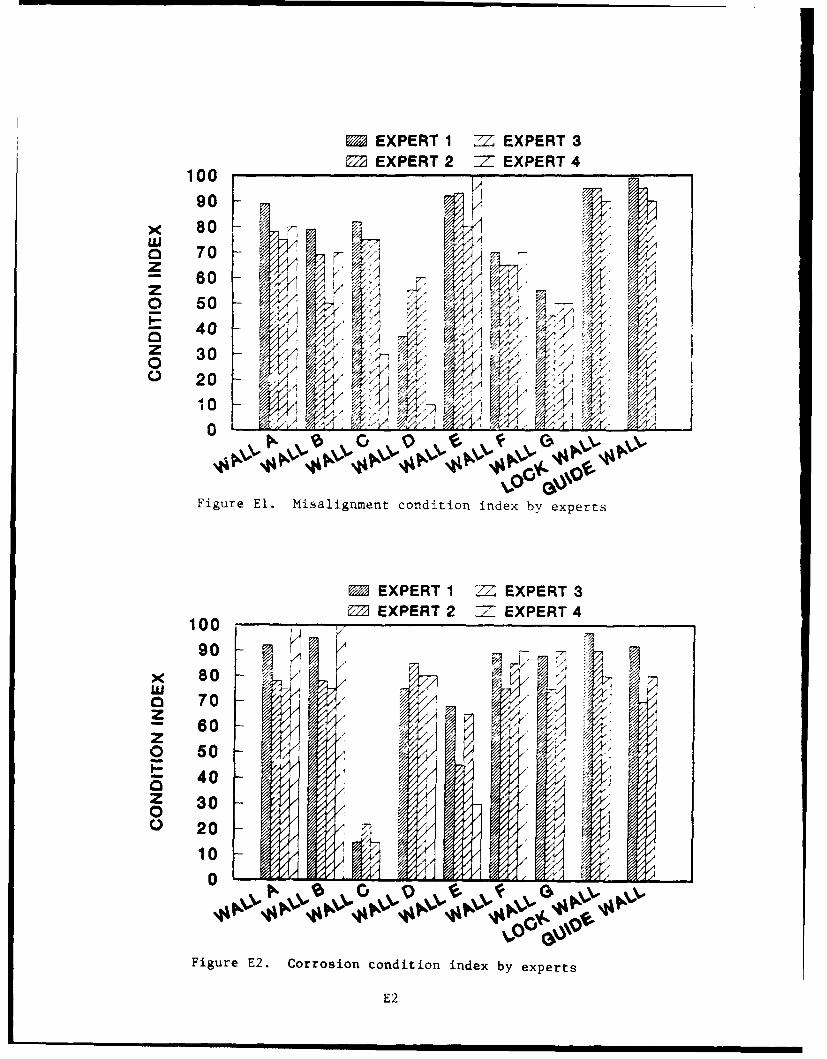
M EXPERT 1 = EXPERT 3, EXPERT 2 = EXPERT 4
10090 AKX 80Wj AO 70
60 V4
0 50
o 40 tA 3z 30 WQ 20 <2
10 ,_0
Figure El. Misalignment condition index by experts
EM EXPERT 1 EXPERT 3EXPERT 2 _T EXPERT 4
100
90x 80o 70 7
60 TAzV
o 50 613 40 , / ( 4
// I /
o 3020
10
0-0
op- v - • vvJ,#v -
Figure E2. Corrosion condition index by experts
E2

EXPERT 1 = EXPERT 3EXPERT 2 = EXPERT 4
100 ,
90
A A
5 0 -A ;70 $ A
/I
60
z II
o 0 -
40A . /v'Z 30
0/ I
S 20 / iA
Figure E3. Settlement condition index by experts
SEXPERT 1 EXPERT 3SEXPERT 2 17- EXPERT 4100
o 50
z/- 0 A:
40 /10
V
10 A 0 ' A
Figure E4. Cavity condition index by experts
E3
..... ...... ~ ~ ~ EX ER I =- EX ER 3,,, mI mmmml iamNlau m
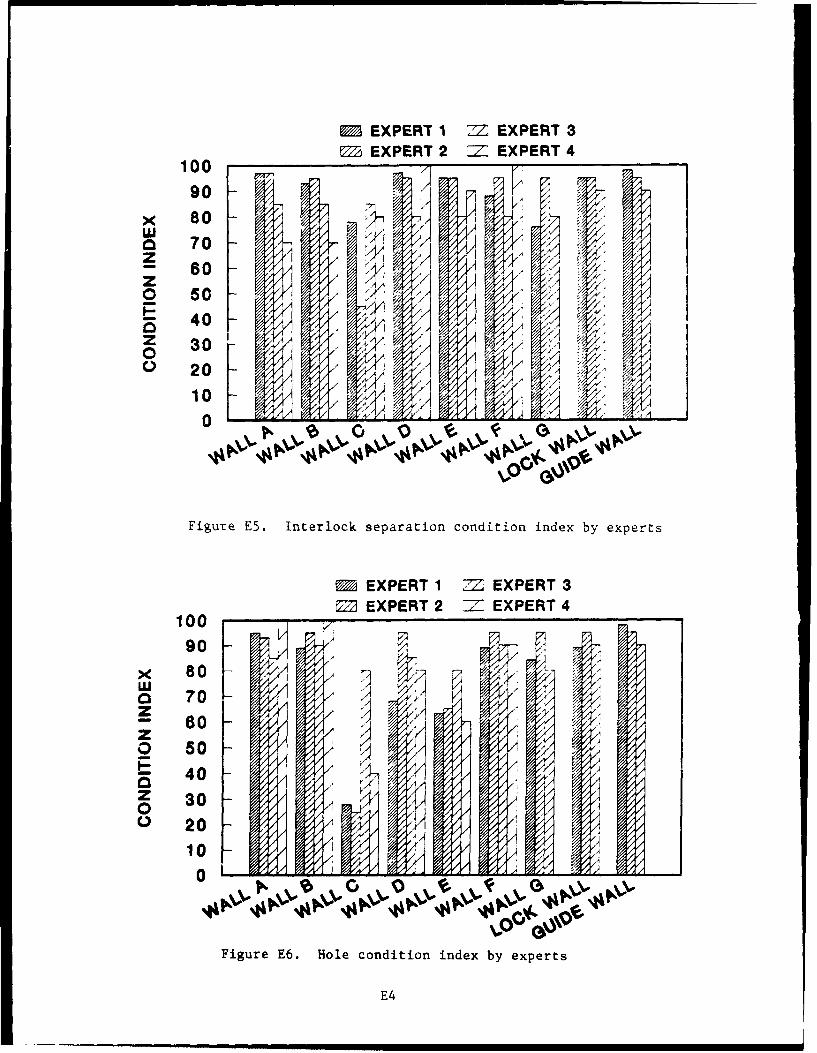
MEXPERT 1 = EXPERT 3M EXPERT 2 = EXPERT 4
100A
X 80ALU o 70
60Az0 s0 -
E 40 A'
Z 3S20~ A
10 /
0 0 o~
Figure E5. Interlock separation condition index by experts
M EXPERT 1 = EXPERT 3
100 =~ EXPERT 2 -/7 EXPERT 4
90X 80 [/LU A
Q 70z A
40 /
00
o 2010
Figure E6. Hole condition index by experts
E4

MEXPERT 1 = EXPERT 3SEXPERT 2 = EXPERT 4
10090
o 7080
zo 50
z 30 <
~20
10
80
o~ 70
40
70
10
40
10 0 -
Figure E8. Crack condition index by experts
E5

EXPERT 1 = EXPERT 3EXPERT 2 = EXPERT 4
100
90x 80
a 70z_- 60 -zo 50
400 300 3O 20
10
0
Figure E9. Overall wall condition index by experts
E6