inspection and rating of gusset plates – a response to the ... · inspection and rating of gusset...
TRANSCRIPT

Inspection and Rating of Gusset Plates – A Response to the I-35W Bridge Collapse
Justin M. Ocel1, Joseph L. Hartmann2, Robert Zobel3, Don White4, and Roberto Leon5
Abstract
On August 7, 2007 the I-35W Bridge collapsed in Minneapolis, Minnesota. The Federal Highway Administration worked cooperatively with the National Transportation Safety Board (NTSB) to investigate the cause of the collapse. Ultimately, the NTSB identified under-designed gusset plates at four nodes as the primary cause of the collapse. In their final report, five recommendations were issued to the FHWA. This paper will describe the collapse and FHWA’s response to the recommendations intended to prevent similar failures in the future.
Introduction
The I-35W Bridge consisted of a three span (81 meter – 139 meter – 81 meter) continuous Warren deck truss spanning across the Mississippi River. The north approach was made from two types of construction; a three span continuous multi-girder bridge abutting to a three span continuous voided slab. The south approach was made from two continuous multi-girder superstructure units; a two-span butting to a three-span. Both approaches were supported on the back spans of the deck truss. The total length of the approaches and deck truss was 581 meters. A plan view of the truss can be seen in Figure 1 along with the node labeling notation. The bridge carried four lanes of traffic in both the northbound and southbound directions.
At the time of the collapse, the deck on the bridge was actively being rehabilitated
by milling off the top 50 mm of concrete and replacing it with a low-slump overlay that had a quick set time. Due to the rehabilitation, half of the lanes were closed (the two leftmost lanes in the southbound direction and two rightmost lanes in the northbound direction). In order to successfully place this overlay within the time constraints of the specifications, the contractor decided to stockpile the raw materials and mix the overlay concrete on the bridge itself. On the morning of the collapse, approximately 1705 kN of sand and aggregate were dumped between panel points 8 and 11 in the closed southbound lanes and later in the afternoon the materials were condensed into an area approximately 4.3m wide
1 Structural Steel Research Program Manager, FHWA Turner-Fairbank Highway Research Center, McLean, VA. 2 Senior Research Structural Engineer, FHWA Turner-Fairbank Highway Research Center, McLean, VA. 3 Research Engineer, Professional Service Industries, FHWA Turner-Fairbank Highway Research Center, McLean, VA. 4 Professor, Georgia Institute of Technology, Atlanta, GA. 5 Professor, Georgia Institute of Technology, Atlanta, GA.
11

by 35.0m long. In addition to the sand and aggregate, a water truck, cement truck, mixing truck, and miscellaneous placing equipment were also on the bridge for a total load (not including rush hour traffic), of 2568 kN in the two southbound, left lanes between main truss panel points 8 and 13.
Field observations at the collapse site quickly identified the two U10 nodes as being
the locations where the collapse sequence initiated. The members framing into these connections did not fail, rather the two gusset plates holding the members together ripped apart. There were no indications of fatigue cracks, corrosion, or brittle fracture within these gusset plates indicating another failure mechanism initiated the collapse event. The gussets were 12.7 mm thick and had a specified yield strength of 345 MPa.
It became clear early into the investigation that the mechanism initiating failure of
the U10 nodes could not be identified at the wreckage site and finite element models would be necessary to investigate all the possible scenarios that could have triggered the collapse sequence. NTSB requested FHWA construct a global finite element model of the bridge for this purpose and to provide independent verification of NTSB’s subcontractor performing parallel simulations. This paper will describe the FHWA modeling effort and the Agency’s response to the NTSB’s recommendations.
Model Description
The model was constructed using the Abaqus (Dassault Systemes Simulia Corp;, June 2007) software with a combination of shell and beam elements. The model was first used to verify the original design loads and no errors could be found with the original analysis. Later the model was revised by embedding shell element representations of the two U10 and two L11 connections. The model considered both geometric and material nonlinearity. Nonlinear material behavior was derived from tensile coupon testing of the material removed from the bridge.
An in-depth dead load study was performed to ensure the actual dead loads were
represented in the model, and NTSB provided the actual live load magnitudes and locations at the time of the collapse (Morrison, Brazy, & Schultheisz, November 2007). Live load data from strain gauges collected in 2000 (O'Connell, Dexter, & Bergson, March 2001) during a fatigue evaluation of the deck truss was used to calibrate the boundary conditions. The strain data from O’Connell et al indicated that typical live load was insufficient to overcome the rolling resistance of the bearings and that the stiffness of the piers needed to be accounted for in the model. When modeling collapse, a four step analysis was performed where; 1) only the steel members were activated with appropriate loads applied representing wet concrete, and ideal boundary conditions at the base of the trusses, 2) the concrete deck elements were activated to represent the deck stiffness and edge loads were included representing the weight of barriers, 3) pressures were applied to the deck to represent the additional measured thickness of the deck at collapse (including extra weight from a 1977 overlay project, milled lanes from the 2007 construction, and
12
revised barrier loads as their size had increased in 1998, 4) the support conditions were removed, the piers were activated, and the known live loads were applied.
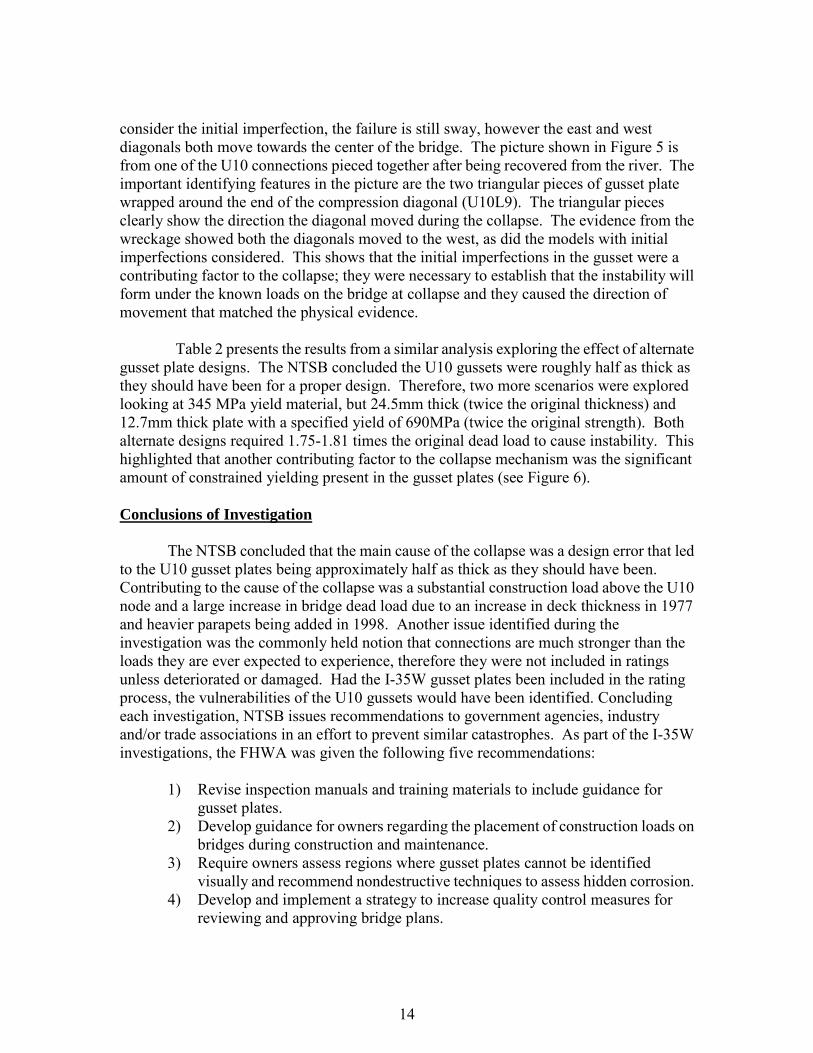
During the investigation, NTSB found photographs of the U10 connections taken
in 1999 and 2003 (NTSB, November 2008). The photographs showed the vertical free edge of the gusset between the compression diagonal and the top chord was bent out-of-plane. One of these pictures is shown as Figure 2. NTSB referred to the bent shapes as “bows” and estimated the magnitude of the bows to be between 12mm and 20mm out-of-plane. For the remainder of this paper, the “bows” will be referred to as initial imperfections. The initial imperfections were integrated into the model by manually manipulating the element node locations in this region of the plate and were present from the beginning of the analysis. A cubic spline displacement field was used to represent the initial imperfection as shown in Figure 3. The cause of the initial imperfections was never identified. However, the imperfections on the four U10 gusset plates were directed to the upstream direction and to the downstream side for the complimentary U10’ connections.
Select Results from FHWA Model
The FHWA investigated the effects of deck stiffness, corrosion, temperature, and initial imperfection in determining the cause of the collapse. This paper will only discuss the role of initial imperfections as they were the only relevant contributing factor to triggering the collapse. Discussions of the other parameters can be found in another report (Ocel & Wright, October 2008).
The effect of the initial imperfections was evaluated by increasing the loads until
the model became unstable. Instability was determined to be the point where a static analysis could no longer iterate a solution, or the peak load was attained using the RIKS solver algorithm; both methods produced identical results. Two load proportioning scenarios were investigated; 1) the construction loads only, and 2) the dead load of the structure. Shown in Table 1 are the results from the two load proportioning schemes for various initial imperfection sizes. The results show the sensitivity of the instability to the initial imperfection size, such that larger initial imperfections lower the loads required to cause instability. The other important note is for the case of the 17.8 mm initial imperfection, the additional dead load required to cause instability was within the accuracy of which the dead load was known. For instance, at the time of collapse, the sum of the eight vertical pier reactions was estimated at 108.9 MN, yet the instability formed in the model with only an additional 707 kN of load distributed over the entire bridge (0.65% of total estimated load). NTSB did not provide a tolerance for the construction loads so a like comparison cannot be made.
When the initial imperfections were included in the model, the instability formed as
the gusset plates buckled in a sidesway mode causing out-of-plane movement of the compression diagonal. Both the east and west compression diagonals swayed to the west (the upstream direction) as seen in Figure 4. Interestingly, when the gusset plate does not
13
consider the initial imperfection, the failure is still sway, however the east and west diagonals both move towards the center of the bridge. The picture shown in Figure 5 is from one of the U10 connections pieced together after being recovered from the river. The important identifying features in the picture are the two triangular pieces of gusset plate wrapped around the end of the compression diagonal (U10L9). The triangular pieces clearly show the direction the diagonal moved during the collapse. The evidence from the wreckage showed both the diagonals moved to the west, as did the models with initial imperfections considered. This shows that the initial imperfections in the gusset were a contributing factor to the collapse; they were necessary to establish that the instability will form under the known loads on the bridge at collapse and they caused the direction of movement that matched the physical evidence.
Table 2 presents the results from a similar analysis exploring the effect of alternate
gusset plate designs. The NTSB concluded the U10 gussets were roughly half as thick as they should have been for a proper design. Therefore, two more scenarios were explored looking at 345 MPa yield material, but 24.5mm thick (twice the original thickness) and 12.7mm thick plate with a specified yield of 690MPa (twice the original strength). Both alternate designs required 1.75-1.81 times the original dead load to cause instability. This highlighted that another contributing factor to the collapse mechanism was the significant amount of constrained yielding present in the gusset plates (see Figure 6).
Conclusions of Investigation
The NTSB concluded that the main cause of the collapse was a design error that led to the U10 gusset plates being approximately half as thick as they should have been. Contributing to the cause of the collapse was a substantial construction load above the U10 node and a large increase in bridge dead load due to an increase in deck thickness in 1977 and heavier parapets being added in 1998. Another issue identified during the investigation was the commonly held notion that connections are much stronger than the loads they are ever expected to experience, therefore they were not included in ratings unless deteriorated or damaged. Had the I-35W gusset plates been included in the rating process, the vulnerabilities of the U10 gussets would have been identified. Concluding each investigation, NTSB issues recommendations to government agencies, industry and/or trade associations in an effort to prevent similar catastrophes. As part of the I-35W investigations, the FHWA was given the following five recommendations:
1) Revise inspection manuals and training materials to include guidance for
gusset plates. 2) Develop guidance for owners regarding the placement of construction loads on
bridges during construction and maintenance. 3) Require owners assess regions where gusset plates cannot be identified
visually and recommend nondestructive techniques to assess hidden corrosion. 4) Develop and implement a strategy to increase quality control measures for
reviewing and approving bridge plans.
14

5) Require owners to include gusset plates as part of the load rating process.
FHWA Response to NTSB Recommendations
At the time of writing, FHWA had fully complied with Recommendations 1 and 2. A Technical Advisory was issued to address Recommendation 3 which advocated the use of ultrasonic inspection to assess remaining plate section. However, the inability of ultrasonic inspection to measure through multiple plates has spurred an active research project to evaluate corrosion in gussets with multiple layered plates. FHWA is working with AASHTO to draft quality control measures to address Recommendation 4. Therefore, these four recommendations will not be discussed further in this paper.
To address Recommendation 5, FHWA issued a Guidance document in February
2009 (Ibrahim, February 2009). This document required, at a minimum, for gusset plates to be evaluated for five limit states using either Load Factor Rating (LFR) or Load and Resistance Factor Rating (LRFD) philosophies. The five limit states to be checked are; shear resistance of fasteners, yield and fracture resistance in tension on an equivalent Whitmore area, block shear in tension, yield and fracture in shear, and compression resistance using an equivalent column analogy and the Whitmore area. The Guidance was based on the current provisions in AASHTO LRFD Bridge Design Specifications, and yields conservative results. As States began to evaluate their inventory with the Guidance, a need for more direction with some checks was identified. This was the case particularly for the shear reduction factor (Ω) associated with shear yield, and the K-factor selection to use in the column analogy buckling check. To address these concerns, FHWA initiated a research project collaboratively with the AASHTO-sponsored National Cooperative Highway Research Program (NCHRP) to evaluate the strength limit states of gusset plates under Project 12-84.
NCHRP Project 12-84
The experimental portion of the research is being conducted in the Structure’s Lab of FHWA’s Turner-Fairbank Highway Research Center. Through subcontract, Georgia Institute of Technology is providing experimental oversight and finite element modeling support. In total, 12 specimens are being tested, six in Phase 1 and six in Phase 2. The first six specimens focus on examining the stability limits of gusset plates by exploring the effect of fastener type, free edge length, and stand-off distance of the compression diagonal. The Phase 2 specimens are still in development, though two of them have dedicated to exploring the effect of large section loss from corrosion.
The load frame for the experimental testing is shown schematically shown in
Figure 7. Each pair of gusset plate test specimens connect five members; a compression diagonal, tension diagonal, two chord members, and a vertical. The four shear walls shown are for resisting the axial loads in the two diagonals and one vertical member. The two abutments shown are for either applying or reacting to axial loads in the chord members of
15

the connection. The five members are meant to be reusable throughout the experimental program and only two gusset plates would be replaced for each specimen. The members and load frame are designed to resist 5338 kN for the diagonals and chord members, and 1957 kN in the vertical. The jacks are servovalve controlled allowing independent control of four members. A computer control system continuously adjusts the loads so equilibrium is maintained throughout loading for the load combination being investigated.
The remainder of this paper discusses the early results from the first two specimens
tested. The geometries of these two connections are similar except one used A307 bolts, and the other used stronger A490 bolts. The higher strength bolts allowed for smaller fastener patterns, slightly reducing the dimensions of the plate. The two specimen geometries are shown in Figure 8.
The two connections were tested under different equilibrium load combinations.
The A307 connection loading scenario had unbalanced loads between the two diagonals, biasing the compression diagonal. The diagonal loads were balanced for the A490 connection. Despite the loading scenario, both connections failed by buckling of the gusset plate causing the compression diagonal to sway out-of-plane. Figure 9 shows a contour plot and picture of the failed shape of the A307 connection. The region of failure was concentrated around the compression diagonal for both connections.
A digital image correlation (DIC) system was used to monitor the three-dimension
displacement fields on one of the gusset plates during testing. The DIC contours shown in Figure 10 show the Tresca strain contours just prior to failure in the two connections. The Tresca strain would be equivalent to the radius of the Mohr’s strain circle, and the light blue color approximately represents yield strain. These two contour plots show the effect of the load imbalance between the diagonals, since the connection with the heavier loaded compression diagonal had yielding focused around the compression diagonal. In the case of the equally loaded diagonals, nearly the entire horizontal plane above the chords was yielded. Interestingly, the peak load in the compression diagonal at failure was very similar for each test of -3185 and -3238 kN.
Table 3 outlines the comparison of the experimental results for the shear and
Whitmore buckling check capacities determined using the FHWA Guidance. Again, a goal of this research is to provide support for or modification of the FHWA Guidance application of the Ω and K-factors used in the evaluation of shear yielding and Whitmore buckling respectively. The nominal resistance calculations in the table are unfactored, and for each Guidance check, a ratio of the nominal resistance calculation to the ultimate strength from the experiment is provided. Ratios greater than 1.0 are unconservative.
For the Whitmore buckling check, the FHWA Guidance leaves discretion to the
engineer to select an appropriate K-factor. For fixed-fixed sway buckling mode that happened in the experiment, K=1.2 would seem most appropriate from a basic analytical perspective. However, in both connections tested, the use of a K=1.2 yielded strength
16
ratios of only 0.74 and 0.66, much below 1.0 before applying resistance factors. The strength ratio did not improve much even with a K-factor of 0.65.
The compression yield resistance on the Whitmore plane was the best predictor of
strength with ratios of 0.94 and 1.02. This was probably due to the connection being relatively compact. The yielding check may not predict as well if the compression diagonal was connected at a greater offset distance from the other members, which can occur for some other joint geometries.
The shear yielding check recommended in the FHWA Guidance applies a reduction
factor to the average shear to account for any inability of the gusset to plastically redistribute shear stresses and to recognize the expectation of a non-constant distribution of stress on the critical plane. If a pure parabolic distribution is assumed as would be obtained from elastic beam theory, the reduction factor would be 0.66. However credit is given to the system behaving more like a deep beam rather than a slender beam and a factor of 0.74 is recommended. If stability of the plate in shear can be reasoned, the Guidance allows for Ω to be taken as 1.0. Assuming Ω=0.74, the shear strength ratios were 0.81 and 0.79 which are conservative, but Ω=1.0 yielded slightly unconservative strength ratios. To balance the predicted and actual shear values, Ω would have to be approximately 0.9. However, it is important to state that neither of the experimental specimens failed in shear, therefore the experiments only provide a possible lower bound for Ω.
Summary
Experimentation will continue into early 2011 and the limited results presented in this paper are highly preliminary. To complement the experimental study, a large parametric finite element study to explore a wide range of geometric effects is being conducted. The parametric study will assess the effects of truss type, framing angles, splice plates and other miscellaneous plates, equilibrium load combinations, fastener type, and member end chamfers.
The outcome of the research is expected to be two-folded. First, the current FHWA
Guidance would be amended if the research results justify it. Second, draft specification language for gusset plate design would be drafted for consideration into the AASHTO Bridge Design Specifications.
References
Dassault Systemes Simulia Corp;. (June 2007). Abaqus Version 6.7 Documentation. Providence, RI.
Ibrahim, F. I. (February 2009). Load Rating Guidance and Examples For Bolted and Riveted Gusset Plates In Truss Bridges, FHWA-IF-09-014. Washington D.C.: Federal Highway Administration.
Morrison, J., Brazy, D., & Schultheisz, C. R. (November 2007). Materials
17
Laboratory Study Report No. 07-115. Washington D.C.: National Transportation Safety Board.
NTSB. (November 2008). Collapse of I-35W Highway Bridge (NTSB/HAR-08/03). Washington D.C.: National Transportation Safety Board.
Ocel, J. M., & Wright, W. J. (October 2008). Finite Element Modeling of I-35W Bridge Collapse - Final Report. Mc Lean, VA: Turner-Fairbank Highway Research Center.
O'Connell, H. M., Dexter, R. J., & Bergson, P. M. (March 2001). Fatigue Evaluation of the Deck Truss of Bridge 9340. St. Paul, MN: Minnesota Department of Transportation.
U0 U1 U2 U3 U4 U5 U6 U7 U8 U9 U10 U11 U12 U13 U14 U13' U12' U11' U10' U9' U8' U7' U6' U5' U4' U3' U2' U1' U0'
L1'L2'L3'L4'L5'L6'L7'L8'
L9'L10'L11'L12'L13'L14L13L12L11L10L9L8
L7L6L5L4L3L2L1
Pie
r 5
Pie
r 6
Pie
r 7
Pie
r 8
Figure 1 - Elevation View Of I-35W Truss (North Directed To The Right).
Figure 2 - Picture Of U10E Connection Taken On 12 June 2003.
18

Figure 3 - TFHRC Modeling Of Gusset Plate Imperfections.
Table 1 - Percentage Increases In Load To Achieve The Limit Load
Percentage Increase in Load to Cause
Non-Convergence [corresponding load, (kN)]
Size of Imperfection
Construction/Traffic Loada Dead Loadb
Perfect Geometry 33.5 % [1423 kN]
7.0 % [5142 kN]
12.7 mm 22.2 % [943 kN]
4.2% [3118 kN]
17.8 mm 4.9% [209 kN]
1.0% [707 kN]
19.1 mm 1.8% [76 kN]
0.34% [249 kN]
a – The proportioned construction/traffic loads included only construction/traffic loads on the deck truss outlined in NTSB Report 07-115 (Morrison, Brazy, & Schultheisz, November 2007) b – The proportioned dead load only included the weight of all the steel and the original 165 mm thick deck
19

Figure 4 - Deformed View (Looking North) Of U10W (Left) And U10E (Right) At The Critical Buckling Load, With 17.8mm Initial Imperfection.
Figure 5 – Post-Collapse U10 Assembly In Lay Down Yard.
The direction of U10L9 movement obvious from remaining piece of gusset
20
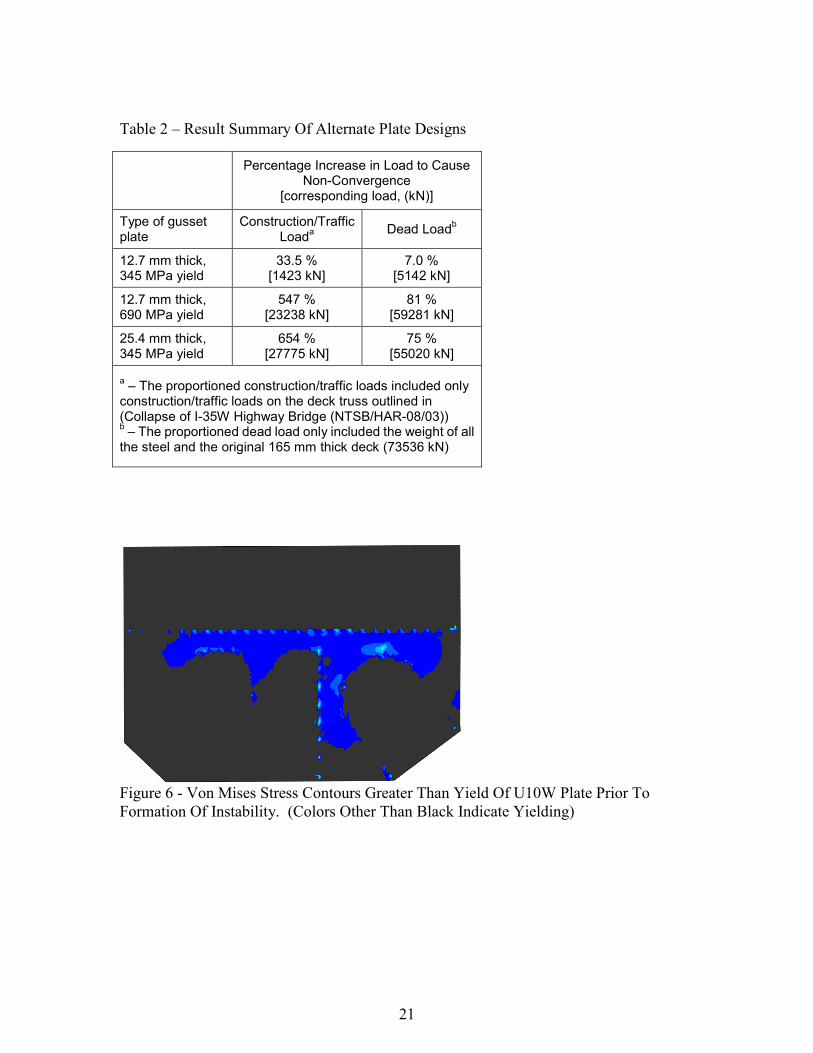
Table 2 – Result Summary Of Alternate Plate Designs
Percentage Increase in Load to Cause
Non-Convergence [corresponding load, (kN)]
Type of gusset plate
Construction/Traffic Loada Dead Loadb
12.7 mm thick, 345 MPa yield
33.5 % [1423 kN]
7.0 % [5142 kN]
12.7 mm thick, 690 MPa yield
547 % [23238 kN]
81 % [59281 kN]
25.4 mm thick, 345 MPa yield
654 % [27775 kN]
75 % [55020 kN]
a – The proportioned construction/traffic loads included only construction/traffic loads on the deck truss outlined in (Collapse of I-35W Highway Bridge (NTSB/HAR-08/03)) b – The proportioned dead load only included the weight of all the steel and the original 165 mm thick deck (73536 kN)
Figure 6 - Von Mises Stress Contours Greater Than Yield Of U10W Plate Prior To Formation Of Instability. (Colors Other Than Black Indicate Yielding)
21

Figure 7 – NCHRP 12-84 Load Frame.
150012
446
669
708
377
333
139312
406
633 674
331339
45°45° 45°45°
Figure 8 – Experimental Specimens; (Left) A307 Connection, (Right) A490 Connection (units = mm).
22

Figure 9 – Final Shape Of Plates Showing Out-Of-Plane Movement Of Compression Diagonal For A307 Connection. (Left) Out-Of-Plane Displacement Contour Plot. (Right) Side View Of Failed Gussets Showing Out-Of-Plane Sway.
Figure 10 – Tresca Strain Contour From DIC System Prior To Failure; (Left) A307 Connection, (Right) A490 Connection.
X-Coordinate (mm)
0 200 400 600 800 1000 1200 1400
Y-C
oord
inat
e (m
m)
0
200
400
600
800
0 2 4 6 8 10 12 14 16 18 20 22 24 26
23
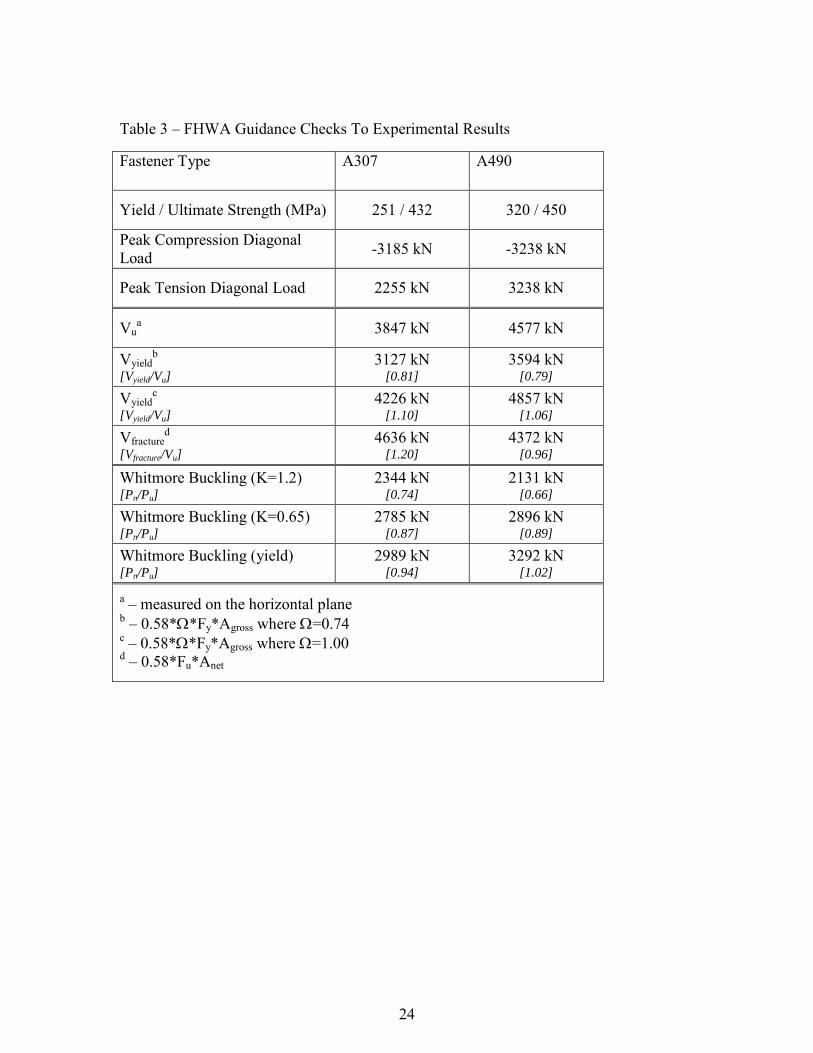
Table 3 – FHWA Guidance Checks To Experimental Results
Fastener Type A307 A490
Yield / Ultimate Strength (MPa) 251 / 432 320 / 450
Peak Compression Diagonal Load -3185 kN -3238 kN
Peak Tension Diagonal Load 2255 kN 3238 kN
Vua 3847 kN 4577 kN
Vyieldb
[Vyield/Vu]
3127 kN [0.81]
3594 kN [0.79]
Vyieldc
[Vyield/Vu] 4226 kN
[1.10] 4857 kN
[1.06]
Vfractured
[Vfracture/Vu] 4636 kN
[1.20] 4372 kN
[0.96]
Whitmore Buckling (K=1.2) [Pn/Pu]
2344 kN [0.74]
2131 kN [0.66]
Whitmore Buckling (K=0.65) [Pn/Pu]
2785 kN [0.87]
2896 kN [0.89]
Whitmore Buckling (yield) [Pn/Pu]
2989 kN [0.94]
3292 kN [1.02]
a – measured on the horizontal plane b – 0.58*Ω*Fy*Agross where Ω=0.74 c – 0.58*Ω*Fy*Agross where Ω=1.00 d – 0.58*Fu*Anet
24