user manual vmx00 - one-provide manual vmx00 sr-medizinelektronik mörikestrasse 9 d-70178 stuttgart...
TRANSCRIPT

User Manual
VMX00
SR-Medizinelektronik Mörikestrasse 9
D-70178 Stuttgart Germany
Fon: +49 811 9144650

VMX00 ECG SOFTWARE DESCRIPTION
2
E-Mail: [email protected] These instructions were put together with great care. If you should still find details here, which do not agree with how the system is handled, we would appreciate it if you let us know so that we can correct the discrepancies as quickly as possible. The specifications and figures in this user manual are subject to change due to optical or further technical developments. All trademarks named and shown are trademarks of the respective proprietor and are recognized as being protected. Reprinting, translation and duplication - even of excerpts – require the written permission of the manufacturer. This manual is subject to the change procedures of SR-Medizinelektronik. © 2013 SR-Medizinelektronik – Stuttgart - Germany
SR-Medizinelektronik Mörikestrasse 9 D-70178 Stuttgart Germany Phone: +49 711 9144650 Fax: +49 711 9144651 e-mail: [email protected] Homepage: www.sr-med.de.de
3
TABLE OF CONTENTS 1. VMX00 ECG SOFTWARE DESCRIPTION..................................... 5 1.1 Function description ................................................................................................5
2. SAFETY INFORMATION ................................................................ 6 2.1 General......................................................................................................................6 2.2 Using the software ...................................................................................................6 2.3 Data protection when sending ECG data................................................................6
3. COMMISSIONING ........................................................................... 7 3.1 Unpacking the device...............................................................................................7 3.2 System requirements ...............................................................................................7 3.3 Installation of the PC software ................................................................................8 3.4 Installation of the MAC software ...........................................................................11 3.5 Plugging in the Bluetooth dongle..........................................................................11 3.6 Setting up the database .........................................................................................12 3.7 Adding patient data ................................................................................................14 3.8 Licensing.................................................................................................................15 3.9 Coupling/decoupling the PC monitor with an ECG device..................................16
4. OPERATION.................................................................................. 19 4.1 Settings menu.........................................................................................................19 4.1.1 ECG measuring device.................................................................................................... 20 4.1.2 Screen ............................................................................................................................ 21 4.1.3 Print settings ................................................................................................................... 23 4.1.4 Database......................................................................................................................... 25 4.1.5 Practice information......................................................................................................... 27 4.1.6 Licenses.......................................................................................................................... 27 4.1.7 GDT settings ................................................................................................................... 27 4.2 ECG recording ........................................................................................................28 4.2.1 ECG data transmission.................................................................................................... 30 4.2.2 Modifying the ECG display............................................................................................... 30 4.2.3 Special functions of the ECG display ............................................................................... 32 4.3 Managing ECG recordings.....................................................................................32 4.3.1 Measuring function .......................................................................................................... 33 4.3.2 Marking function .............................................................................................................. 33 4.3.3 Documentation of the findings.......................................................................................... 34 4.3.4 Findings status ................................................................................................................ 35
4.3.5 Printing a data record ...................................................................................................... 35 4.3.6 Comparing recordings ..................................................................................................... 38 4.4 Patient list (archive)................................................................................................40 4.4.1 Working with the archive window ..................................................................................... 40 4.4.2 Searching for data records in the archive......................................................................... 41 4.4.3 Loading and displaying data record from archive ............................................................. 41 4.4.4 Deleting data record ........................................................................................................ 41 4.4.5 Exporting data record ...................................................................................................... 41 4.4.6 Importing data records..................................................................................................... 42 4.4.7 Creating new patient........................................................................................................ 43
5. ECG ASSESSMENT (ONLY WITH ANALYSIS LICENSE) ......... 44 5.1.1 Prerequisites ................................................................................................................... 44 5.1.2 Starting and stopping the ECG analysis........................................................................... 44 5.1.3 Analysis view description................................................................................................. 45 5.1.4 Representative cycle ....................................................................................................... 46 5.1.5 ECG assessment ............................................................................................................ 48
6. NETWORK LICENSE.................................................................... 52 6.1 Single-PC operation ...............................................................................................52 6.2 Multiple-PC operation.............................................................................................52 6.3 Ending the program................................................................................................52
7. OVERVIEW OF KEYBOARD SHORTCUTS ................................ 53
8. MALFUNCTIONS AND ERROR DESCRIPTION ......................... 54
9. VMX00-TRANSMITTER ................................................................ 55 9.1 Installation ..............................................................................................................55 9.2 Start Transmitter.....................................................................................................55 9.3 Uploading the data .................................................................................................57 9.4 Finishing the program............................................................................................57
10. WARRANTY .................................................................................. 58

VMX00
5
1. VMX00 ECG SOFTWARE DESCRIPTION VMX00 is a vital parameter monitor for displaying measured data of the ECG device CardioScout Multi-ECG. VMX00, in combination with these device, serves as monitor software for:
? Measuring an ECG ? Supporting the diagnosis from the physician ? Documenting ECGs
The monitor software is suitable for PCs and is delivered with the ECG device. With the VMX00, the recorded ECG can be displayed, be saved specific to the patient, commented, printed out and be revised by expert personnel.
1.1 Function description After correctly applying the electrodes and establishing a wireless connection to the VMX00 monitor program, the ECG is transmitted wirelessly to the receiver unit. ECG signal filtering can be configured in the ECG software. One can also choose between the measurement of a 3-, 6- or 12-channel ECG. The monitor software has the following functions for recording and managing ECG data:
? Establishing a wireless connection to the ECG measuring device ? Saving measured data ? Display of measured data ? Printing out the measured data ? Patient management ? Commenting and revising of saved measured data ? Automatic ECG analysis with interpretation suggestion (only with analysis
license) ? Manual measurement of ECG data
You still have the option of configuring the ECG device according to your requirements.

SAFETY INFORMATION
6
2. SAFETY INFORMATION Read this user manual carefully. It is a component of the VMX00 and must be available at all times. Only use the VMX00 for the described purpose. Please also observe the user manual for the CardioScout Multi-ECG device. Observe the following for your own safety as well as the safety of your patients, and to meet the requirements of the Medical Device Directive (MDD):
2.1 General
The VMX00 may only be used by persons who can guarantee that it will be used properly based on their training/education or knowledge, e.g. instruction.
Software programs can interfere with each other. As far as interference cannot be ruled out completely based on the included documentation, the user must make sure that inference cannot occur, e.g. by asking the involved manufacturers or by asking an expert.
2.2 Using the software
When monitoring critical patients, an alternative ECG system should be kept readily available in the event the device fails.
Check the signal limit settings before every monitoring phase.
When using the VMX00 during a stress ECG, it is required that the patient be under constant observation.
Wireless transmission errors could occur if heat therapy devices are operated in the immediate vicinity.
If the patient has a cardiac pacemaker, there could be errors calculating the heart rate.
Make sure that the Bluetooth monitor to which the measured data is transmitted is invisible to other Bluetooth end devices. Otherwise, there could be errors in the data transmission.
2.3 Data protection when sending ECG data Fundamentally, it is to be observed that personal health data enjoys a high degree of data protection. SR-Medizinelektronik therefore recommends that data should only be transmitted when encrypted. An alternative would be to make data or the link between the patient and the data anonymous.
VMX00
7
3. COMMISSIONING Before commissioning, check whether all used devices (computer, monitor, printer, etc.), which were not delivered by SR-Medizinelektronik, meet the legal safety requirements (DIN EN 60950 or IEC 950).
3.1 Unpacking the device Remove all components carefully from their packaging. Check the components to make sure they are complete and check for any damage. If components should be missing or damaged, do not use the device. Contact your dealer, or contact the manufacturer directly. ATTENTION:
? Packaging material can pose a danger of suffocation. Keep it away from children or dispose of it properly.
? Do not expose CDs to direct sunlight. The CDs may not be bent or mechanically stressed in any other way.
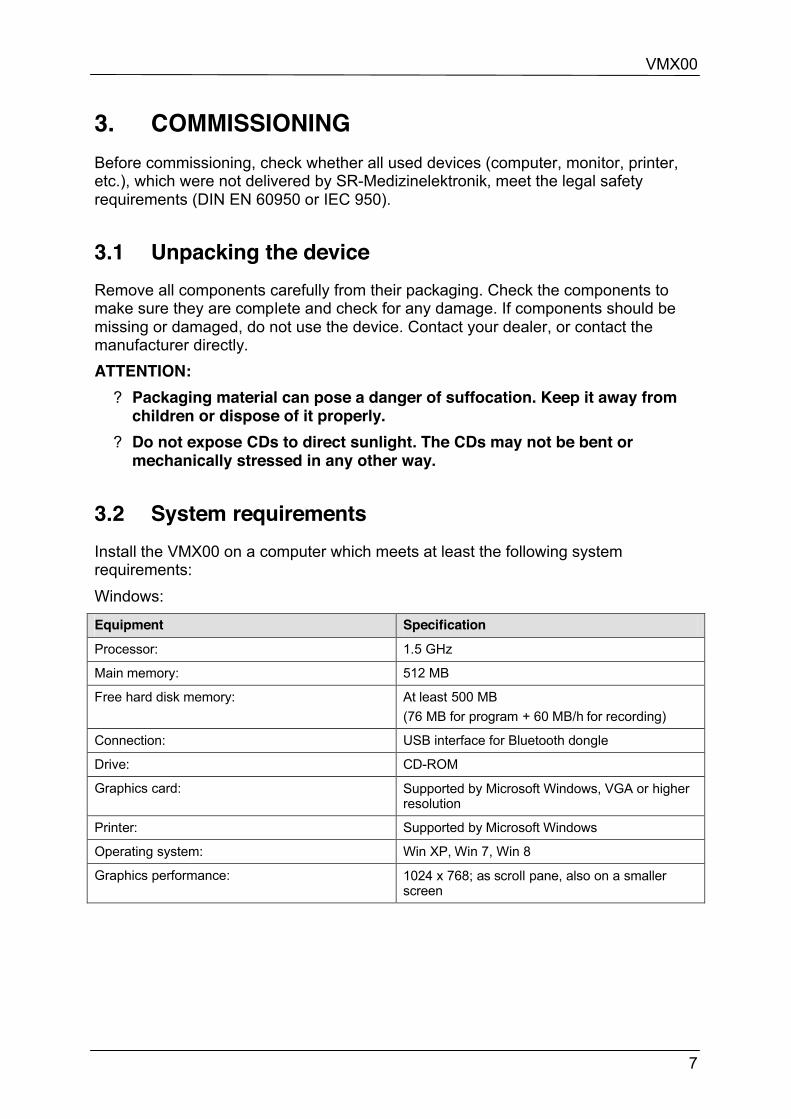
3.2 System requirements Install the VMX00 on a computer which meets at least the following system requirements: Windows:
Equipment Specification
Processor: 1.5 GHz
Main memory: 512 MB
Free hard disk memory: At least 500 MB (76 MB for program + 60 MB/h for recording)
Connection: USB interface for Bluetooth dongle
Drive: CD-ROM
Graphics card: Supported by Microsoft Windows, VGA or higher resolution
Printer: Supported by Microsoft Windows
Operating system: Win XP, Win 7, Win 8
Graphics performance: 1024 x 768; as scroll pane, also on a smaller screen

COMMISSIONING
8
MacOS:
Equipment Specification
Processor: 1 GHz
Main memory: At least 512 MB (RAM)
Free hard disk memory: At least 500 MB (50 MB for program + 60MB/h for recording)
Drive: CD-ROM
Printer: Supported by Mac OS X
Operating system: MacOS X.6 or higher
Graphics performance: 1024 x 768
3.3 Installation of the PC software The VMX00 software needs to have a Bluetooth device to be able to communicate with the ECG. Please activate or plug inn your Bluetooth adapter before installation. NOTE:
? Plug the Bluetooth dongle in an easily visible USB slot on your PC to get the best range.
Once you have successfully plugged the Bluetooth dongle into a free USB port, you can install the VMX00 software.
1. Have Windows display the contents of the CD-ROM / USB-Stick and open the “VMX00.exe” file.
2. A small window shows the progress of the installation wizard; this will copy the files required for the installation process onto your hard disk.
3. Once the copying process is finished, the main window for installation opens. Confirm with "Next" to continue with the installation.

VMX00
9
Figure 1: Main window for installing the VMX00 software
4. Afterwards, you will be prompted to enter the installation directory in which the PC monitor is to be installed.
Figure 2: Changing the installation path
5. Confirm the next queries with “Next” as well.

COMMISSIONING
10
6. When the following window appears on your screen, the program is being installed.
Figure 3: Installation progress
7. The installation procedure is successfully completed when this window is opened.
Figure 4: Installation completed
VMX00
11
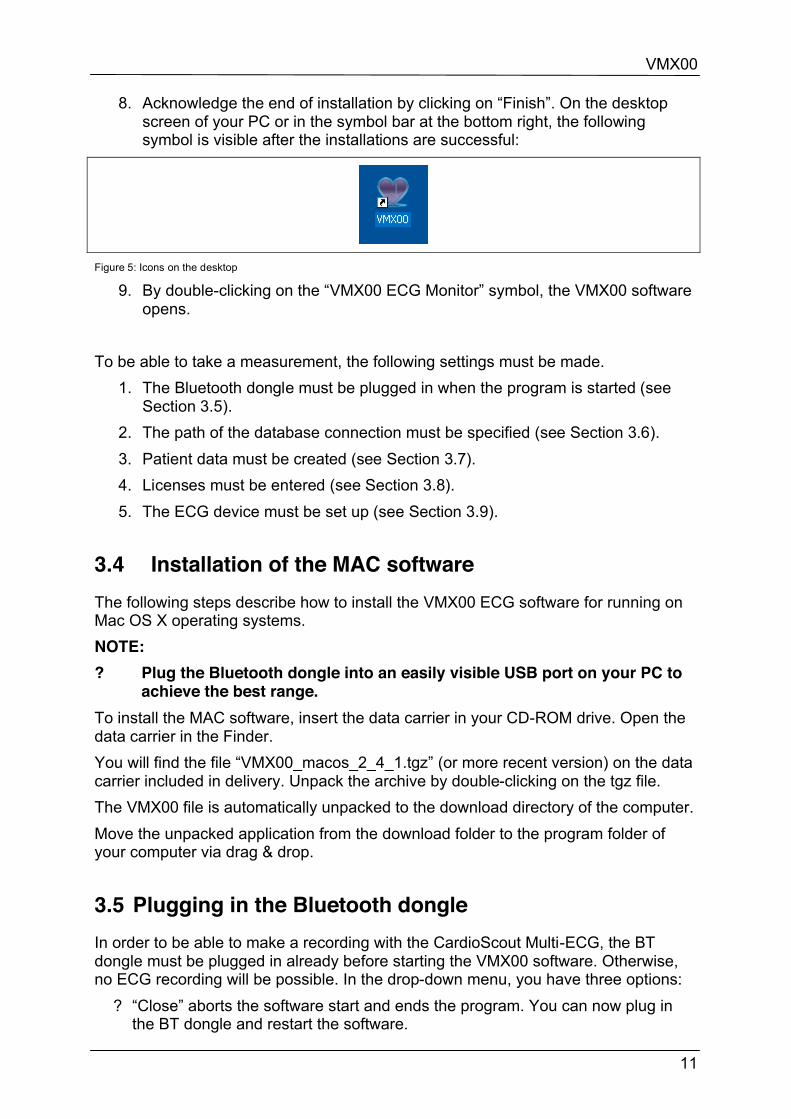
8. Acknowledge the end of installation by clicking on “Finish”. On the desktop screen of your PC or in the symbol bar at the bottom right, the following symbol is visible after the installations are successful:
Figure 5: Icons on the desktop
9. By double-clicking on the “VMX00 ECG Monitor” symbol, the VMX00 software opens.
To be able to take a measurement, the following settings must be made.
1. The Bluetooth dongle must be plugged in when the program is started (see Section 3.5).
2. The path of the database connection must be specified (see Section 3.6). 3. Patient data must be created (see Section 3.7). 4. Licenses must be entered (see Section 3.8). 5. The ECG device must be set up (see Section 3.9).
3.4 Installation of the MAC software The following steps describe how to install the VMX00 ECG software for running on Mac OS X operating systems. NOTE: ? Plug the Bluetooth dongle into an easily visible USB port on your PC to achieve the best range. To install the MAC software, insert the data carrier in your CD-ROM drive. Open the data carrier in the Finder. You will find the file “VMX00_macos_2_4_1.tgz” (or more recent version) on the data carrier included in delivery. Unpack the archive by double-clicking on the tgz file. The VMX00 file is automatically unpacked to the download directory of the computer. Move the unpacked application from the download folder to the program folder of your computer via drag & drop.
3.5 Plugging in the Bluetooth dongle In order to be able to make a recording with the CardioScout Multi-ECG, the BT dongle must be plugged in already before starting the VMX00 software. Otherwise, no ECG recording will be possible. In the drop-down menu, you have three options:
? “Close” aborts the software start and ends the program. You can now plug in the BT dongle and restart the software.
COMMISSIONING
12
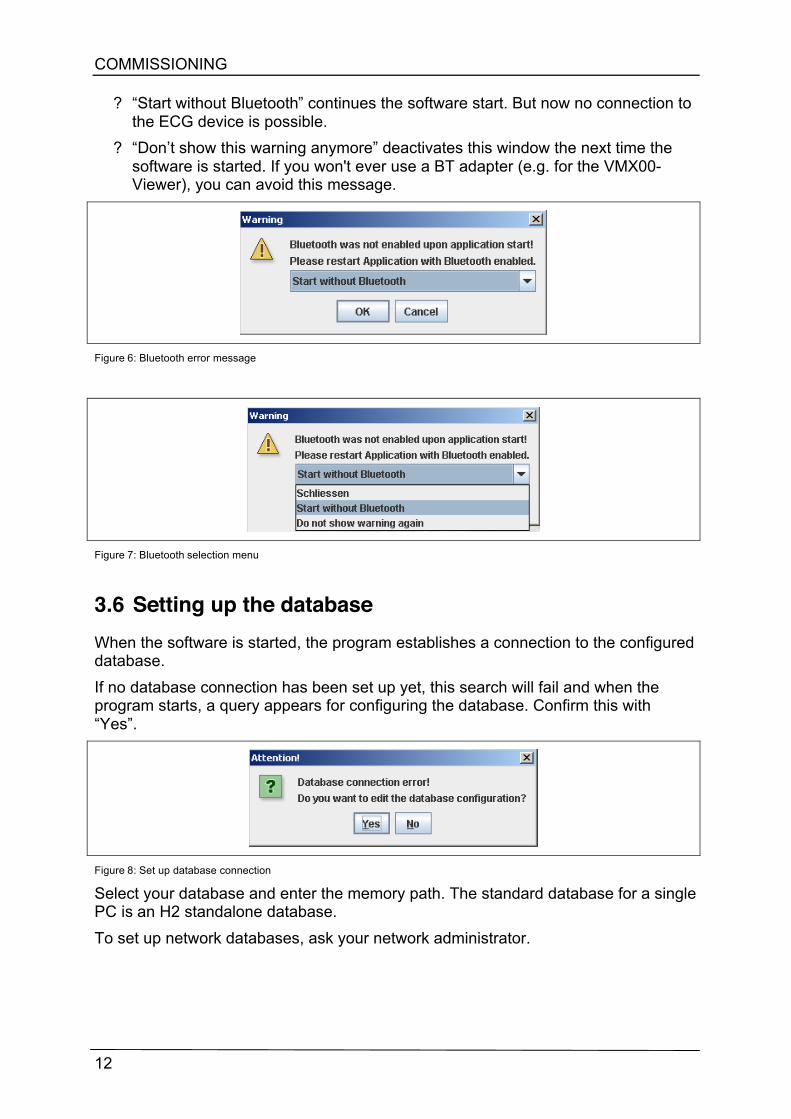
? “Start without Bluetooth” continues the software start. But now no connection to the ECG device is possible.
? “Don’t show this warning anymore” deactivates this window the next time the software is started. If you won't ever use a BT adapter (e.g. for the VMX00-Viewer), you can avoid this message.
Figure 6: Bluetooth error message
Figure 7: Bluetooth selection menu
3.6 Setting up the database When the software is started, the program establishes a connection to the configured database. If no database connection has been set up yet, this search will fail and when the program starts, a query appears for configuring the database. Confirm this with “Yes”.
Figure 8: Set up database connection
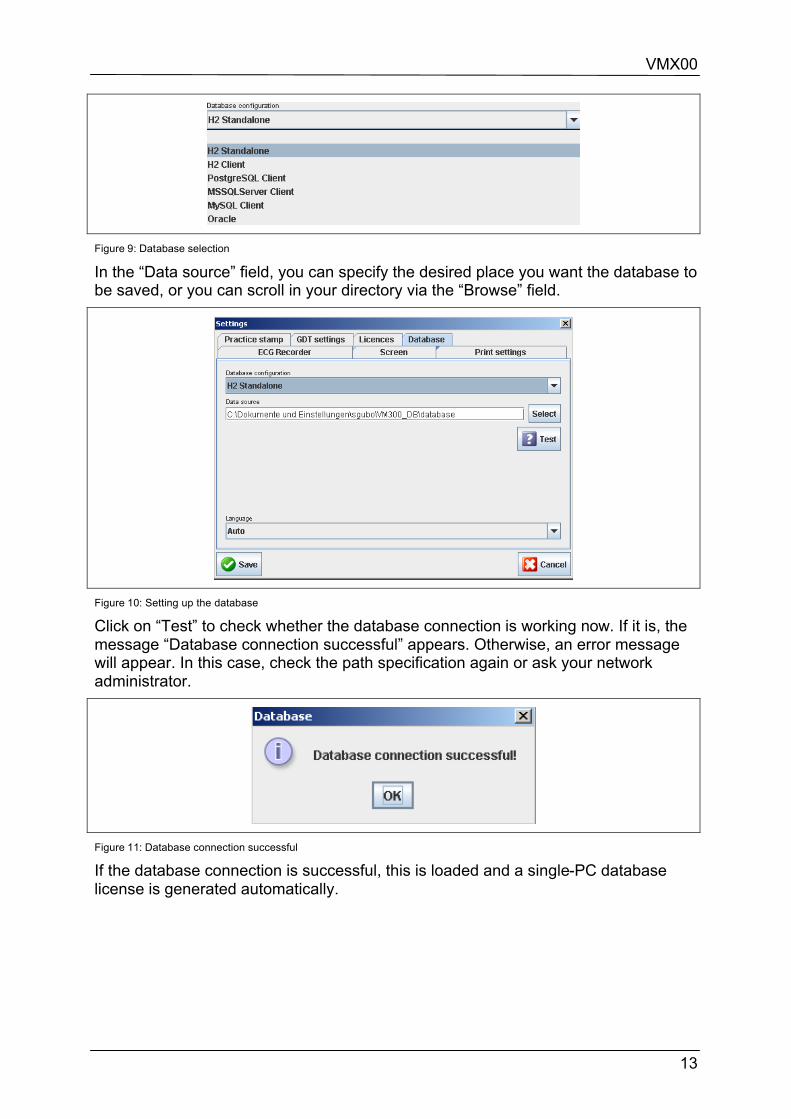
Select your database and enter the memory path. The standard database for a single PC is an H2 standalone database. To set up network databases, ask your network administrator.
VMX00
13
Figure 9: Database selection
In the “Data source” field, you can specify the desired place you want the database to be saved, or you can scroll in your directory via the “Browse” field.
Figure 10: Setting up the database
Click on “Test” to check whether the database connection is working now. If it is, the message “Database connection successful” appears. Otherwise, an error message will appear. In this case, check the path specification again or ask your network administrator.
Figure 11: Database connection successful
If the database connection is successful, this is loaded and a single-PC database license is generated automatically.

COMMISSIONING
14
3.7 Adding patient data After starting the software, the archive window with the patient list appears first. A patient must be selected here, to whom the subsequent recording is to be allocated. Only then is recording possible.
Figure 12: Selecting patient
If there is no patient data in the database yet, a new patient must be created. To do this, click on the “New patient” button and fill out the given fields. At least a last name must be entered here. If no patient ID is entered, this will be automatically generated as a consecutive number. NOTE:
? For the ECG analysis, the fields “Gender”, “Date of birth”, “Weight”, “Height” and “Pacemaker” must be filled out.
Confirm the entered data with the “Save” button.
VMX00
15
Figure 13: Creating a patient
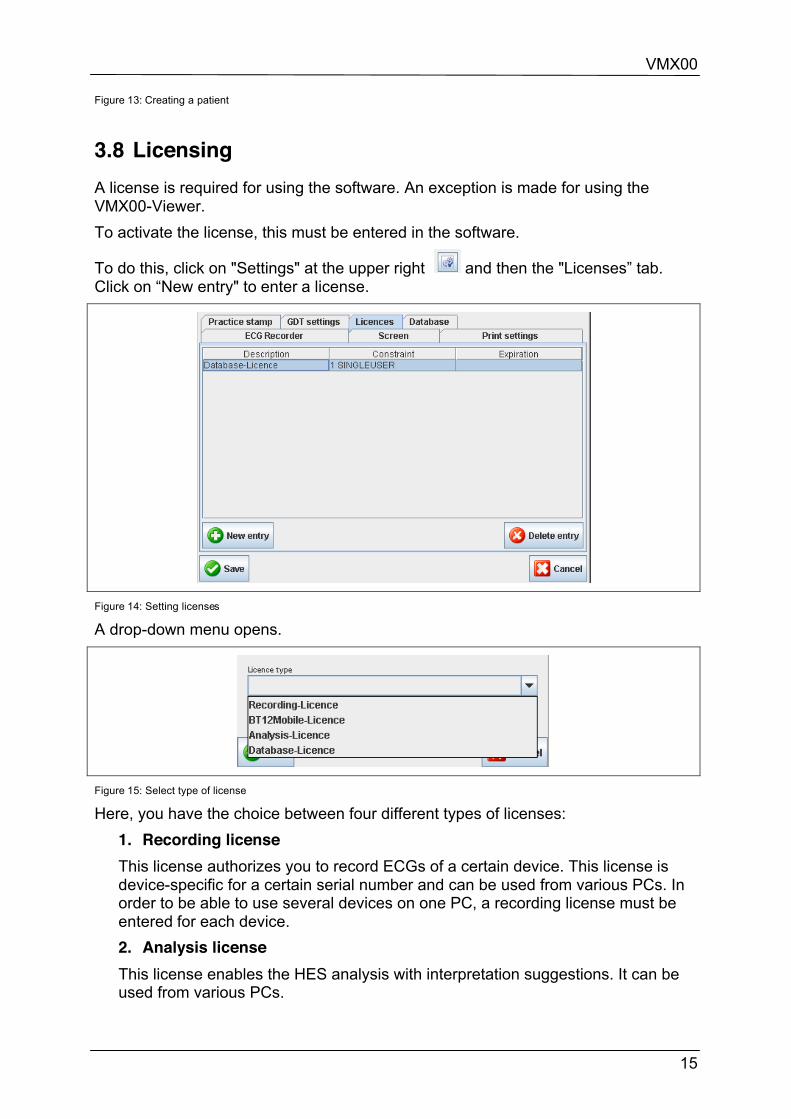
3.8 Licensing A license is required for using the software. An exception is made for using the VMX00-Viewer. To activate the license, this must be entered in the software.
To do this, click on "Settings" at the upper right and then the "Licenses” tab. Click on “New entry" to enter a license.
Figure 14: Setting licenses
A drop-down menu opens.
Figure 15: Select type of license
Here, you have the choice between four different types of licenses: 1. Recording license This license authorizes you to record ECGs of a certain device. This license is device-specific for a certain serial number and can be used from various PCs. In order to be able to use several devices on one PC, a recording license must be entered for each device. 2. Analysis license This license enables the HES analysis with interpretation suggestions. It can be used from various PCs.

COMMISSIONING
16
3. Database license This license allows several PCs to access a database. A single-PC license allows one PC to access a database and is automatically generated when the program is started. It is not necessary to enter the license key for single-PC use.
Figure 16: Entered license
The license is now activated and can be used.
3.9 Coupling/decoupling the PC monitor with an ECG device
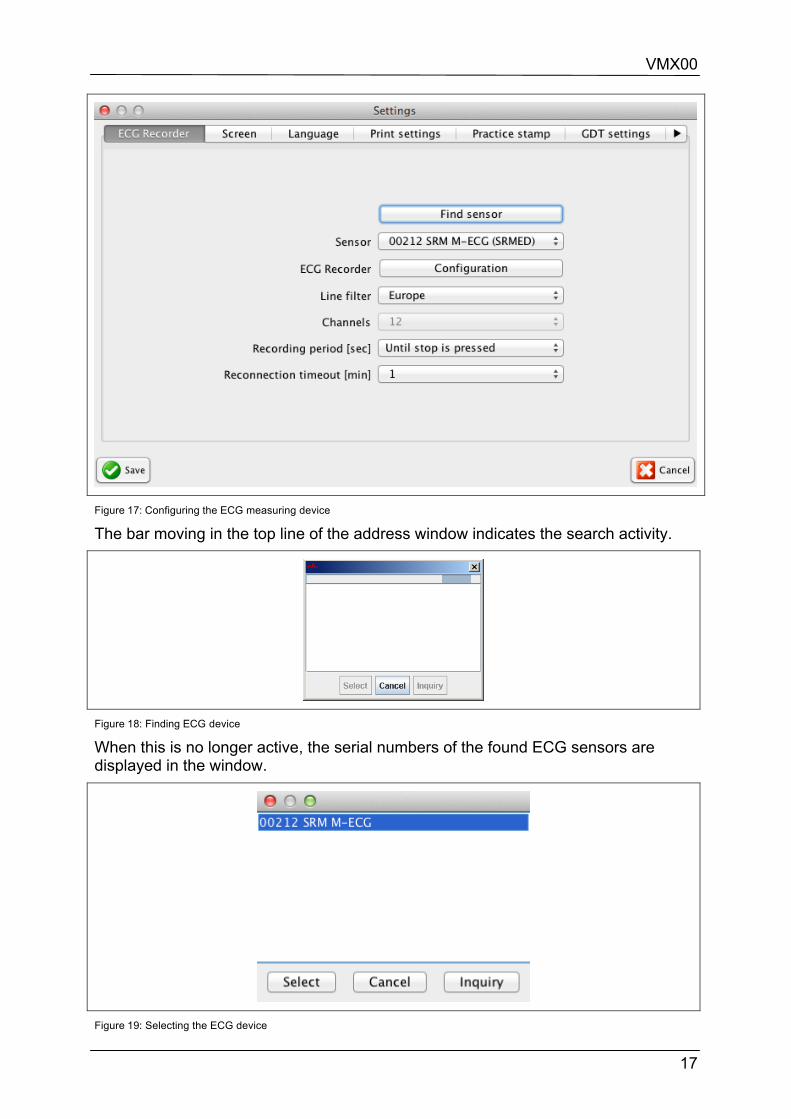
In order to allocate an ECG device to a monitor, it must be coupled with this device. After successful coupling, the used CardioScout Multi-ECG can no longer be found by another device having a Bluetooth interface. This rules out third-party access to the device. An ECG simulator is set up in the “Sensor” field by default. A programmed ECG is output here. The monitor is coupled to the ECG device the first time a connection is established between the two devices. For this, an ECG device must first be selected. Make sure that your CardioScout Multi-ECG is switched on. In the "Settings" menu, select the "ECG measuring device" tab and then click on "Find sensor" to activate the automatic device search.
VMX00
17
Figure 17: Configuring the ECG measuring device
The bar moving in the top line of the address window indicates the search activity.
Figure 18: Finding ECG device
When this is no longer active, the serial numbers of the found ECG sensors are displayed in the window.
Figure 19: Selecting the ECG device

COMMISSIONING
18
If the serial number of the device to be coupled (can be read off the type plate) is not there, repeat the search. If the device still is not displayed, it is probably already coupled with another PC having VMX00 software. Break this connection by pressing the On/Off button (with the device turned on) for 20 seconds until you hear a double-beep (see Section 3.9). After doing this, the ECG measuring device should be found by your monitor program. Once the serial number of the desired device appears in the address window, select this by clicking with the left mouse button. To confirm your selection, click the “Select” button. Usually, only one address will be displayed on the PC monitor. A connection is established by starting an ECG recording or configuring an ECG device. If the Bluetooth driver should ask for a PIN during this coupling, click on the Bluetooth symbol or the opened Bluetooth driver message. Enter the PIN “0000” in the provided text field and confirm with “OK”.
If the PIN is not entered within one minute, an error message appears. Confirm this with “OK” and reconnect with the device. In this case, the PIN is not asked for.

VMX00
19
4. OPERATION The PC monitor is for graphically displaying, saving and evaluating the ECG measured with a CardioScout Multi-ECG system. The PC monitor provides the option of saving a complete diagnosis together with the respective ECG, so that all patient data is available at all times. To measure the ECG signals, ECG electrodes must first be applied to the patient. The ECG device must be connected to the electrodes. More detailed information can be found in the instructions for your ECG device. After switching on the ECG device, there are two short signal beeps, which indicate that the device's self-test is finished. Check on the device display whether it is ready for operation. If a connection is now established between the PC monitor and the ECG device, this begins with displaying the signals.
Patient list (archive)
New patient
Auto search
Edit patient
3-channel view
Recordings
6-channel view or 12-channel view
Start/Stop
Comments
End of recording (live view)
Search
ECG view/analysis view
End program
Diagnosis status
Settings
Diagnosis
Figure 20: Symbols and functions
4.1 Settings menu In the “Settings” menu, basic settings for the monitor appearance as well as the ECG configuration can be made.
Figure 21: Selecting the settings menu
OPERATION
20
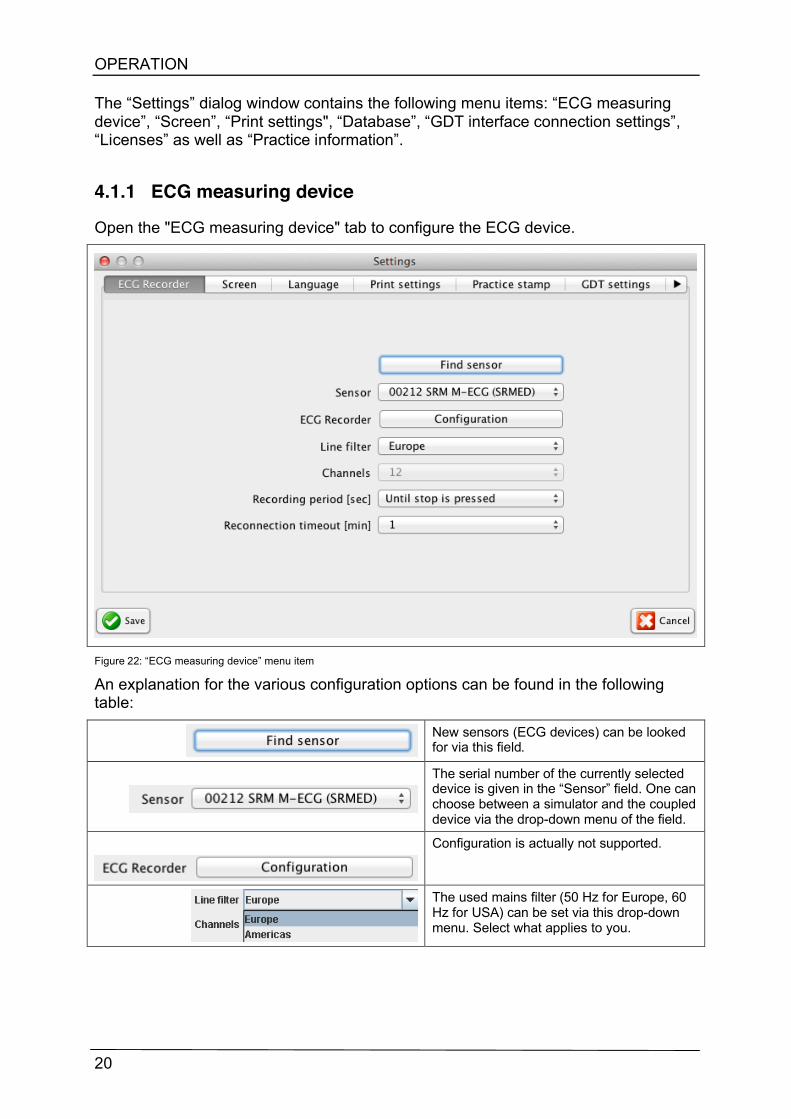
The “Settings” dialog window contains the following menu items: “ECG measuring device”, “Screen”, “Print settings", “Database”, “GDT interface connection settings”, “Licenses” as well as “Practice information”.
4.1.1 ECG measuring device
Open the "ECG measuring device" tab to configure the ECG device.
Figure 22: “ECG measuring device” menu item
An explanation for the various configuration options can be found in the following table:
New sensors (ECG devices) can be looked for via this field.
The serial number of the currently selected device is given in the “Sensor” field. One can choose between a simulator and the coupled device via the drop-down menu of the field.
Configuration is actually not supported.
The used mains filter (50 Hz for Europe, 60 Hz for USA) can be set via this drop-down menu. Select what applies to you.

VMX00
21
The recording duration in seconds can be selected via the field of this drop-down menu. After the set time in seconds, the ECG recording ends automatically. If you would like to set the recording duration manually, select “Until stop is pressed."
Depending on the device variant, the ECG device can transmit three, six or twelve channels. Default number of channels is 12 channels.
4.1.2 Screen Open the “Screen” tab to change the ECG screen display configuration.
Figure 23: “Screen” menu item
Various views of the PC monitor can be set via this drop-down menu, such as the color of the background, the grid and the legend text.
Configuration of the weight unit
OPERATION
22
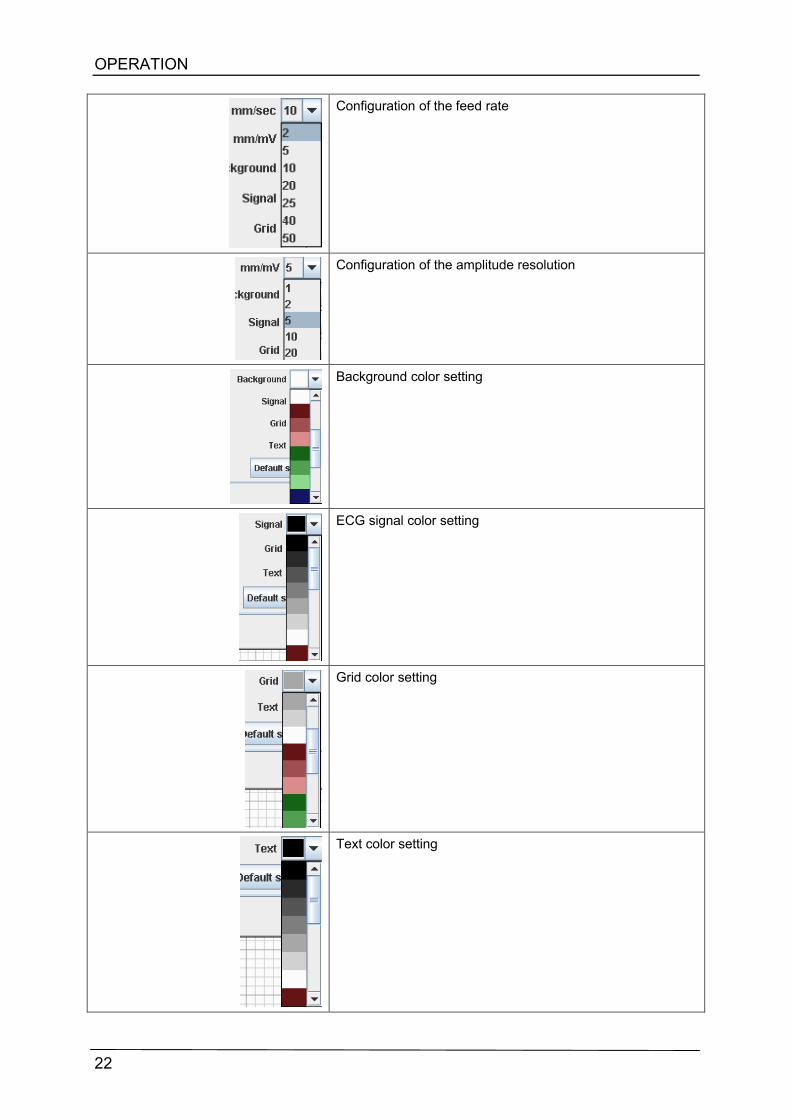
Configuration of the feed rate
Configuration of the amplitude resolution
Background color setting
ECG signal color setting
Grid color setting
Text color setting

VMX00
23
Grid size setting
With this button, you can reset the monitor view to the factory settings.
Configuration of the feed rate
4.1.3 Print settings
Open the “Print settings” tab to configure the ECG printout.
Figure 24:”Print settings” menu item
The printing range can be defined in the “Length” drop-down menu. You have the choice between the total view or a 10-second section. One printed page can show 250 mm and is always printed to the end of the page. Missing data is represented by black bars.
Figure 25: Length of the printed out ECG range

OPERATION
24
Total view The recorded ECG is printed completely in its full length.
10 seconds Printout of a 10-second section. This begins with the ECG recording currently displayed on the left edge of the monitor. Here, at least 10 s are printed. One page is always completely printed to the end of the page. Depending on the feed rate setting, this is equivalent to the following number of pages:
Feed rate ECG duration Print
2 mm/s 125 s 1 page
5 mm/s 50 s 1 page
10 mm/s 25 s 1 page
20 mm/s 12,5 s 1 page
25 mm/s 10 s 1 page
40 mm/s 6,25 s 2 pages
50 mm/s 5 s 2 pages
In the analysis view, the analyzed 10-second section is printed at the top.
In the “Output” drop-down menu, you can choose between outputting to a PDF file or by means of a printer.
Figure 26: Selection between printer and PDF file
One can set the channel view in the print configuration. This refers to the printout in the standard ECG view.
Figure 27: Channel view
12 x 1 Twelve channels are printed one on top of the other. The shown time duration per page depends on the set feed

VMX00
25
rate. For a feed rate of 25 mm/s, 10 s will be shown on each page for each channel (Figure 47).
6 x 2 Six channels are printed out in two columns. Each channel is displayed for 125 mm. For a feed rate of 25 mm/s, 5 s are shown on one page for each channel. The time progresses from left to right (Figure 48).
3 x 4 Three channels are printed out in four columns. Each column contains 62.5 mm. For a feed rate of 25 mm/s, 2.5 s are shown for each channel. The time progresses here from left to right (Figure 49).
You can print out the ECG recording with or without a grid. If the grid should be printed, please place a checkmark in front of “Grid”.
4.1.4 Database
To change the data directory, the storage location of the recorded measurements, go to the “Database” tab. The standard database configuration is an H2 standalone database. If you have any questions, consult your network administrator. Further information about the network database can be found in Chapter Fehler! Verweisquelle konnte nicht gefunden werden.. Select a new storage location via “Browse” and, in the window that opens, “Open”.
Figure 28: Defining where the measured data is to be stored

OPERATION
26
Figure 29: Selecting the data directory
In the “Database” menu item, it is also possible to change the monitor software language.
Figure 30: Select language
In the “Language” drop-down menu, you can choose between “Deutsch”, “English”, “Français” and “Auto”. If you choose “Auto”, that language is chosen which is set on your PC. Select the desired language and confirm with “Save”. If a change is made in the "Database" menu, the monitor software must be manually restarted. Only then will the changes be accepted.
Figure 31: Warning
VMX00
27
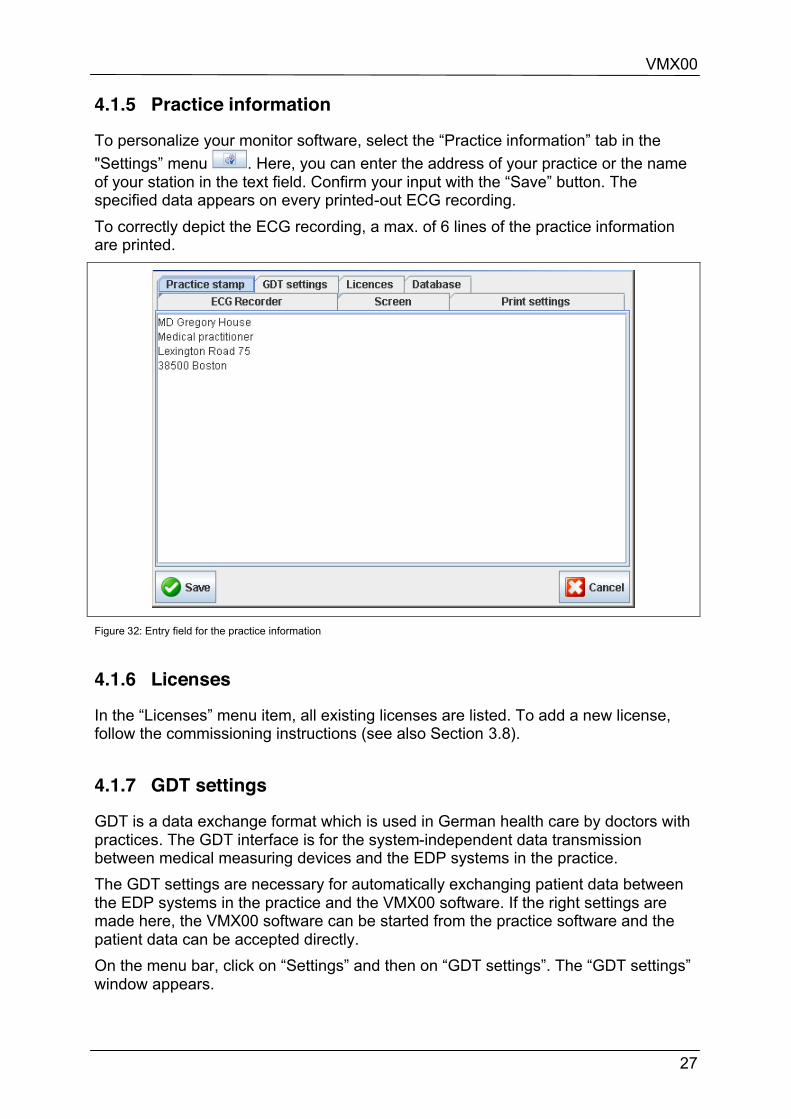
4.1.5 Practice information
To personalize your monitor software, select the “Practice information” tab in the "Settings” menu . Here, you can enter the address of your practice or the name of your station in the text field. Confirm your input with the “Save” button. The specified data appears on every printed-out ECG recording. To correctly depict the ECG recording, a max. of 6 lines of the practice information are printed.
Figure 32: Entry field for the practice information
4.1.6 Licenses
In the “Licenses” menu item, all existing licenses are listed. To add a new license, follow the commissioning instructions (see also Section 3.8).
4.1.7 GDT settings
GDT is a data exchange format which is used in German health care by doctors with practices. The GDT interface is for the system-independent data transmission between medical measuring devices and the EDP systems in the practice. The GDT settings are necessary for automatically exchanging patient data between the EDP systems in the practice and the VMX00 software. If the right settings are made here, the VMX00 software can be started from the practice software and the patient data can be accepted directly. On the menu bar, click on “Settings” and then on “GDT settings”. The “GDT settings” window appears.
OPERATION
28
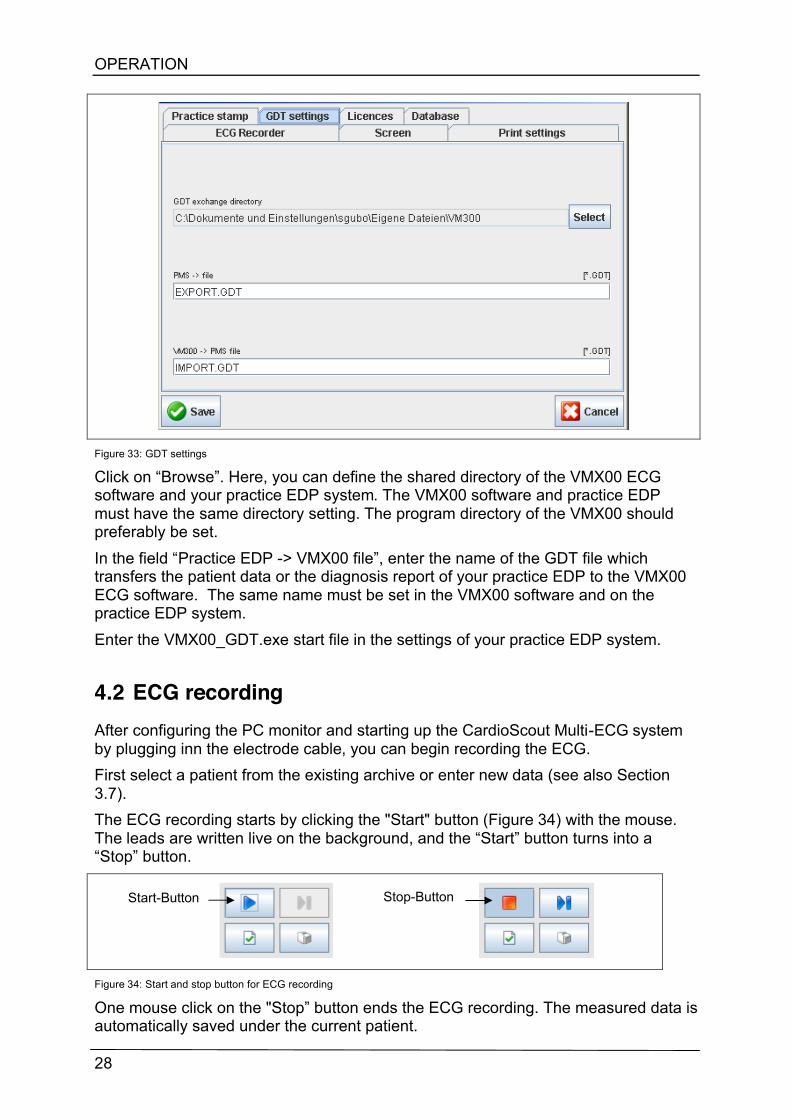
Figure 33: GDT settings
Click on “Browse”. Here, you can define the shared directory of the VMX00 ECG software and your practice EDP system. The VMX00 software and practice EDP must have the same directory setting. The program directory of the VMX00 should preferably be set. In the field “Practice EDP -> VMX00 file”, enter the name of the GDT file which transfers the patient data or the diagnosis report of your practice EDP to the VMX00 ECG software. The same name must be set in the VMX00 software and on the practice EDP system. Enter the VMX00_GDT.exe start file in the settings of your practice EDP system.
4.2 ECG recording After configuring the PC monitor and starting up the CardioScout Multi-ECG system by plugging inn the electrode cable, you can begin recording the ECG. First select a patient from the existing archive or enter new data (see also Section 3.7). The ECG recording starts by clicking the "Start" button (Figure 34) with the mouse. The leads are written live on the background, and the “Start” button turns into a “Stop” button.
Figure 34: Start and stop button for ECG recording
One mouse click on the "Stop” button ends the ECG recording. The measured data is automatically saved under the current patient.
Start-Button Stop-Button

VMX00
29
Alternatively, you can also start and end the recording with the key combination “Ctrl” + “Enter”. ATTENTION:
? Black bars on the display could indicate faulty electrode contact, transmission interference or too much distance between the patient and PC. Check the electrode contact, e.g. with the lead diagram (see Section 4.2.2), and, if necessary, apply contact spray again where the skin and electrodes come into contact. Reduce the distance between the patient and PC.
The calibration deflection can be seen in the lower left-hand corner of the ECG graph (Figure 35).
Figure 35: Monitoring the ECG data
OPERATION
30
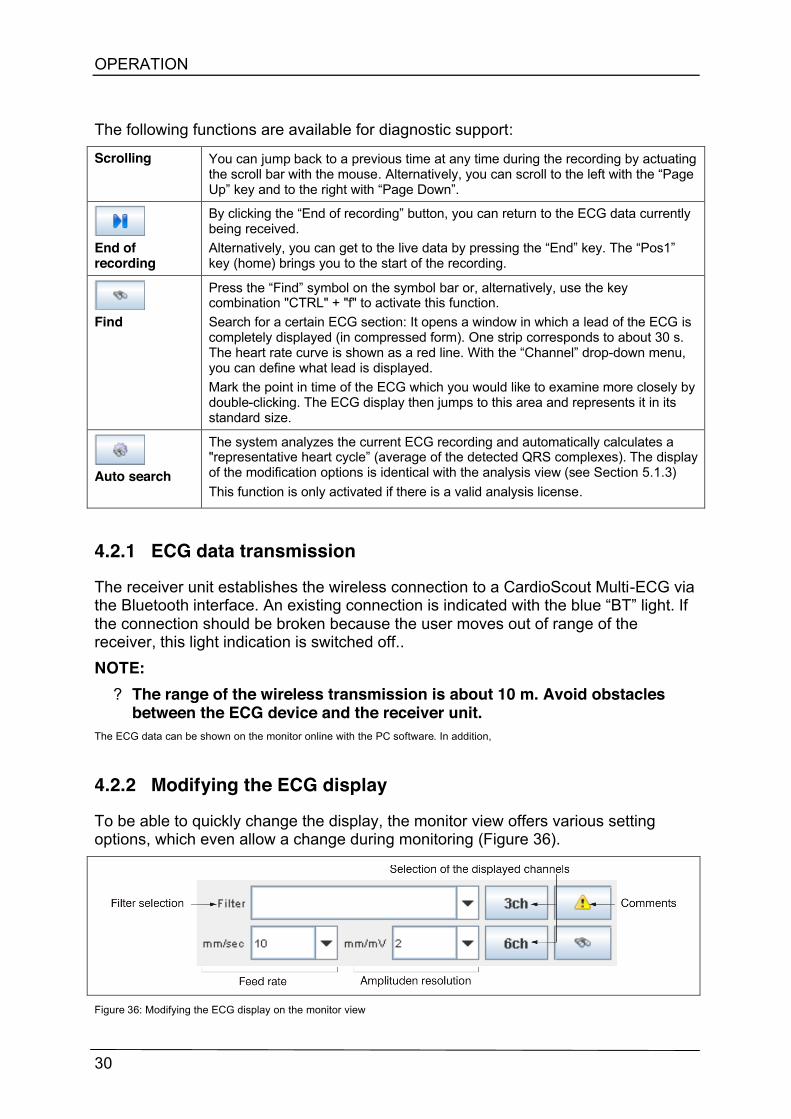
The following functions are available for diagnostic support:
Scrolling You can jump back to a previous time at any time during the recording by actuating the scroll bar with the mouse. Alternatively, you can scroll to the left with the “Page Up” key and to the right with “Page Down”.
End of recording
By clicking the “End of recording” button, you can return to the ECG data currently being received. Alternatively, you can get to the live data by pressing the “End” key. The “Pos1” key (home) brings you to the start of the recording.
Find
Press the “Find” symbol on the symbol bar or, alternatively, use the key combination "CTRL" + "f" to activate this function. Search for a certain ECG section: It opens a window in which a lead of the ECG is completely displayed (in compressed form). One strip corresponds to about 30 s. The heart rate curve is shown as a red line. With the “Channel” drop-down menu, you can define what lead is displayed. Mark the point in time of the ECG which you would like to examine more closely by double-clicking. The ECG display then jumps to this area and represents it in its standard size.
Auto search
The system analyzes the current ECG recording and automatically calculates a "representative heart cycle” (average of the detected QRS complexes). The display of the modification options is identical with the analysis view (see Section 5.1.3) This function is only activated if there is a valid analysis license.
4.2.1 ECG data transmission
The receiver unit establishes the wireless connection to a CardioScout Multi-ECG via the Bluetooth interface. An existing connection is indicated with the blue “BT” light. If the connection should be broken because the user moves out of range of the receiver, this light indication is switched off.. NOTE:
? The range of the wireless transmission is about 10 m. Avoid obstacles between the ECG device and the receiver unit.
The ECG data can be shown on the monitor online with the PC software. In addition,
4.2.2 Modifying the ECG display
To be able to quickly change the display, the monitor view offers various setting options, which even allow a change during monitoring (Figure 36).
Figure 36: Modifying the ECG display on the monitor view

VMX00
31
The shown channels can be selected, the feed rate, the amplitude resolution and the used filter. By clicking on the corresponding field, a desired value can be selected.
Filter selection There are three selection options: - No filter - Mains filter (50 / 60Hz) - Muscle+mains filter (band-pass 0.05 - 35 Hz and 50 Hz / 60 Hz filter)
Configuration of the feed rate Alternatively also with key combination “Ctrl“ + increase “Ctrl” + decrease
Configuration of the amplitude resolution Alternatively also with key combination “Ctrl” + increase “Ctrl” + decrease
By clicking on the “3ch” symbol or the key combination “Ctrl” + “3” on the keyboard, one can cyclically switch among the following three views:
• The three leads according to Einthoven (I, II, III)
• The three leads according to Goldberger (aVR, aVL, aVF)
• The three first leads according to Wilson (V1, V2, V3)
The 3 other leads according to Wilson (V4, V5, V6)
Click on the “6ch” button or the key combination “Ctrl” + “6” to switch among the following views:
• The three leads according to Einthoven (I, II, III) and Goldberger (aVR, aVL, aVF)
• The six Wilson leads (V1- V6)
• 12-channel total view
The comment view is displayed by clicking on the “Comments” button or pressing the key combination “Ctrl” +”k”.
OPERATION
32
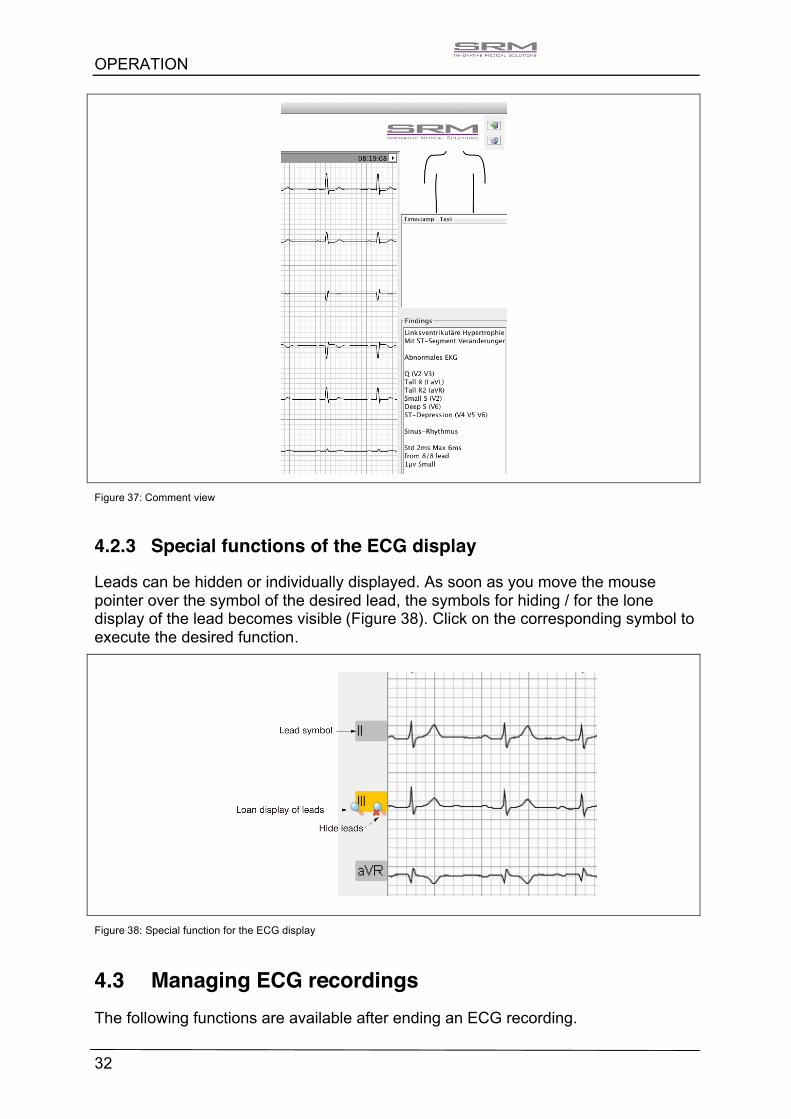
Figure 37: Comment view
4.2.3 Special functions of the ECG display
Leads can be hidden or individually displayed. As soon as you move the mouse pointer over the symbol of the desired lead, the symbols for hiding / for the lone display of the lead becomes visible (Figure 38). Click on the corresponding symbol to execute the desired function.
Figure 38: Special function for the ECG display
4.3 Managing ECG recordings The following functions are available after ending an ECG recording.

VMX00
33
4.3.1 Measuring function
For ECG measurement, the monitor offers the option of looking at ECG events in their exact relation to one another. To do this, click on the corresponding point on the curve and drag the open field to the point of comparison and click with the mouse again. The monitor automatically calculates the time and amplitude delta (change).
Figure 39: ECG measurement
4.3.2 Marking function
To mark special events in the ECG, all you have to do is double-click on the position to be marked on an ECG lead (Figure 40). In the window that opens, an initial diagnosis or suspicion can be noted. This function is both available in the ECG view as well as in the analysis view.
Figure 40: Marking
The points marked this way are shown highlighted in color in the ECG diagram (Figure 41).
Figure 41: Marking on the ECG diagram
Furthermore, the markings are listed below the torso diagram in text form, with the time (Figure 42).

OPERATION
34
Figure 42: List of marked events
By clicking on a saved time or a comment of your choice, you automatically go to the associated ECG section in the corresponding view. Double-clicking on the text field allows you to edit the comment. To delete an event from the list, click either on the associated “Time” or “Text” field. Press the “Del” key on your keyboard and confirm the confirmation prompt with “Yes”.
4.3.3 Documentation of the findings
To note findings for the current ECG recording, click on the findings symbol (Figure 43) at the top of the monitor view or press “Ctrl” + “b”.
Figure 43: Findings symbol
The “Edit” dialog window opens. After entering your findings, they must be saved by clicking on “Save”. If you want to delete your entry, click on “Cancel”. Once you have activated the comment view (se Section 4.2.2), the entered findings can be seen on the right side of the monitor view after confirming with “Save”. To add to, change or delete the findings, click on the findings symbol again edit your entry. You can also transfer findings suggestions from the analysis view to your findings (see Section 5.1.5).
VMX00
35
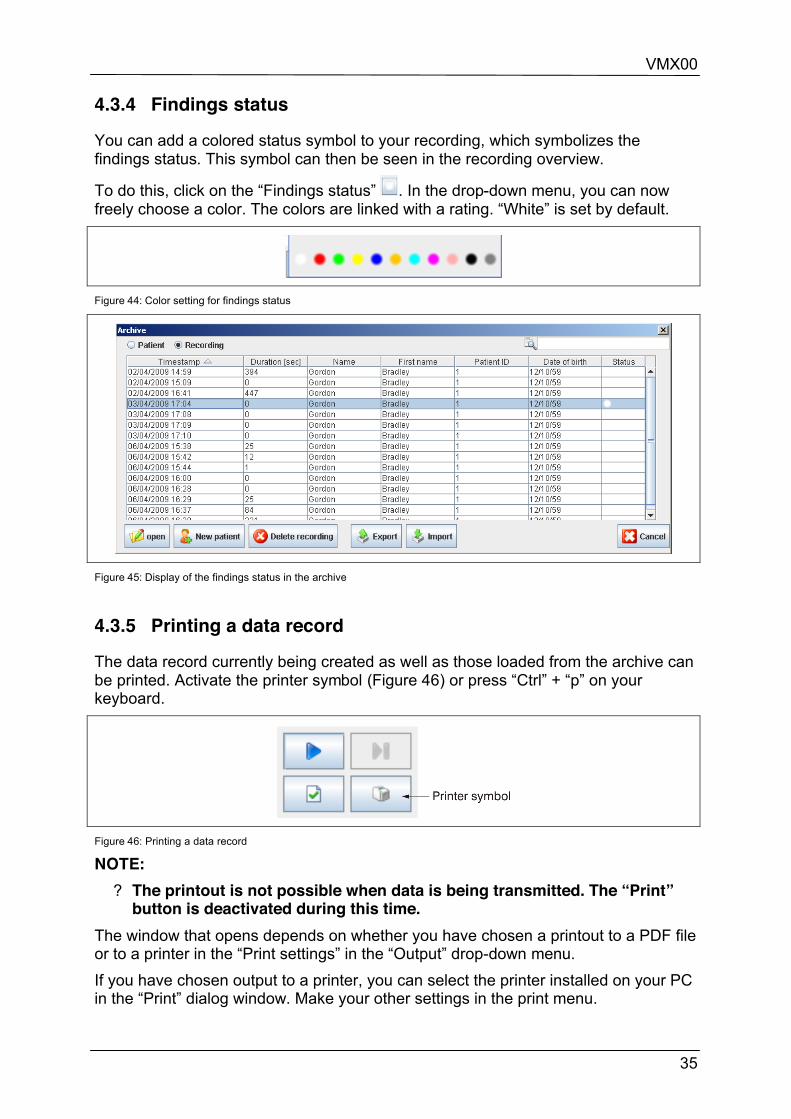
4.3.4 Findings status
You can add a colored status symbol to your recording, which symbolizes the findings status. This symbol can then be seen in the recording overview.
To do this, click on the “Findings status” . In the drop-down menu, you can now freely choose a color. The colors are linked with a rating. “White” is set by default.
Figure 44: Color setting for findings status
Figure 45: Display of the findings status in the archive
4.3.5 Printing a data record
The data record currently being created as well as those loaded from the archive can be printed. Activate the printer symbol (Figure 46) or press “Ctrl” + “p” on your keyboard.
Figure 46: Printing a data record
NOTE: ? The printout is not possible when data is being transmitted. The “Print”
button is deactivated during this time. The window that opens depends on whether you have chosen a printout to a PDF file or to a printer in the “Print settings” in the “Output” drop-down menu. If you have chosen output to a printer, you can select the printer installed on your PC in the “Print” dialog window. Make your other settings in the print menu.
OPERATION
36
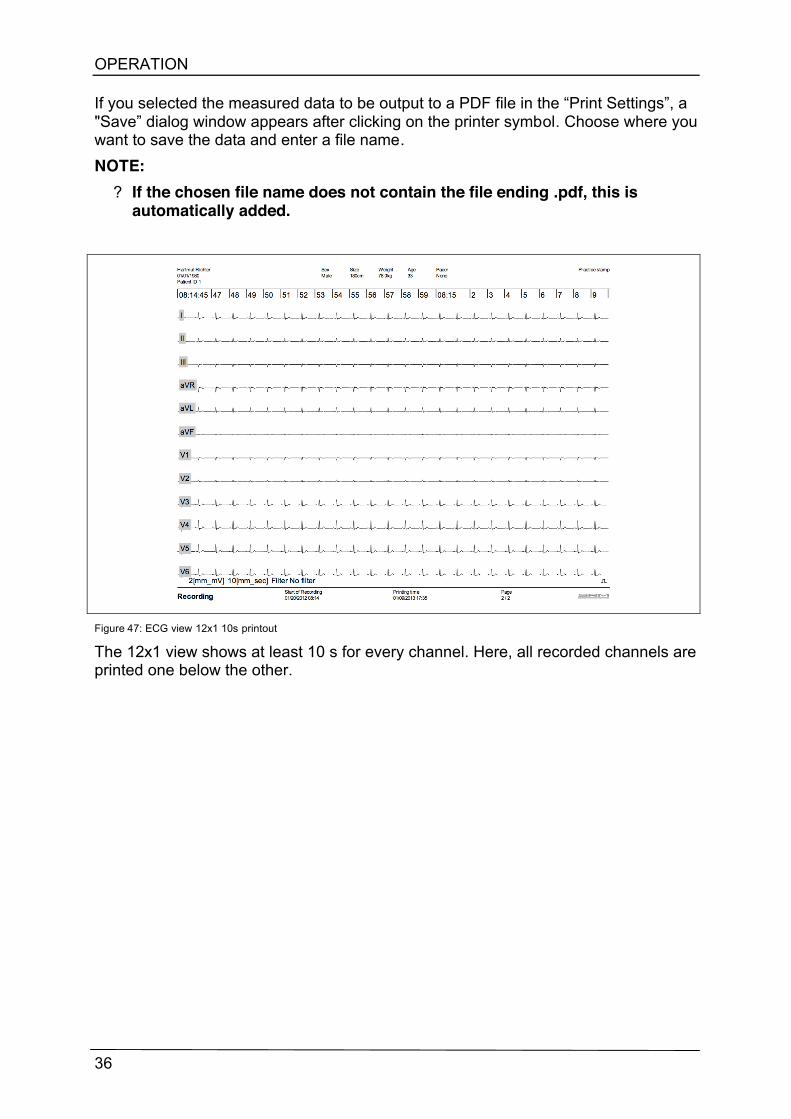
If you selected the measured data to be output to a PDF file in the “Print Settings”, a "Save” dialog window appears after clicking on the printer symbol. Choose where you want to save the data and enter a file name. NOTE:
? If the chosen file name does not contain the file ending .pdf, this is automatically added.
Figure 47: ECG view 12x1 10s printout
The 12x1 view shows at least 10 s for every channel. Here, all recorded channels are printed one below the other.
VMX00
37
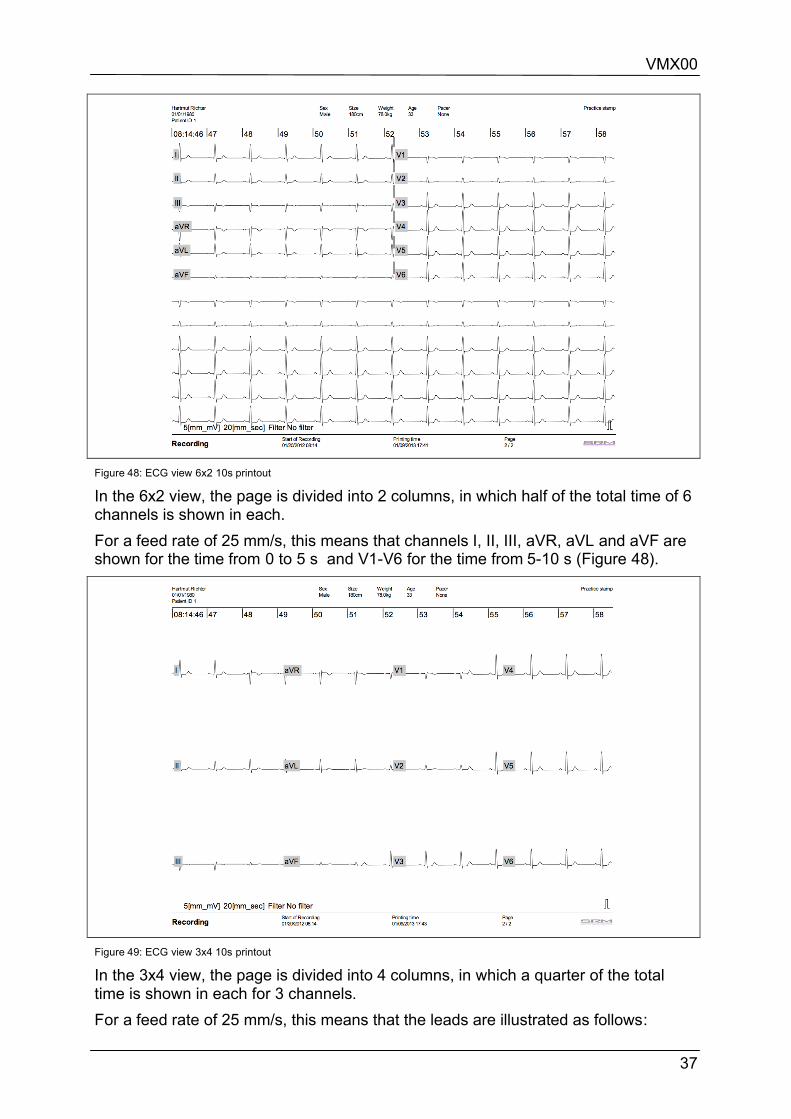
Figure 48: ECG view 6x2 10s printout
In the 6x2 view, the page is divided into 2 columns, in which half of the total time of 6 channels is shown in each. For a feed rate of 25 mm/s, this means that channels I, II, III, aVR, aVL and aVF are shown for the time from 0 to 5 s and V1-V6 for the time from 5-10 s (Figure 48).
Figure 49: ECG view 3x4 10s printout
In the 3x4 view, the page is divided into 4 columns, in which a quarter of the total time is shown in each for 3 channels. For a feed rate of 25 mm/s, this means that the leads are illustrated as follows:

OPERATION
38
? Leads I, II, III for the time from 0-2.5 s ? Leads aVR, aVL, aVF for the time from 2.5 to 5 s ? Leads V1-V3 for the time from 5-7.5 s ? Leads V3-V6 for the time from 7.5-10 s
Figure 50: Analysis view printout
4.3.6 Comparing recordings
Click with the mouse on the “Recordings” symbol . This shows the saved recordings for the current patient. You can now select any recording.

VMX00
39
Figure 51: Recordings menu
With the “Recordings comparison” button, you have the option of comparing the current recording directly with the selected one. The screen divides, then, so that one recording lead can be seen at the top and one at the bottom (Figure 52). To switch the lead view, click on the lead designation on the left side. If the Display” button is clicked in the “Recordings” menu, only the selected recording is completely shown. Note:
? Only the recordings of a selected patient can be compared.
Figure 52: Comparing recordings

OPERATION
40
4.4 Patient list (archive) The PC monitor allows a recorded ECG to be assessed at a later time, to manage it or to exchange it electronically with other doctors.
4.4.1 Working with the archive window
To open the archive window, select the “Patient list” symbol at the top left or press the “Ctrl” + “o” keys.
Figure 53: Opening the archive
To move the archive window, click with the mouse on the blue title bar and keep the mouse button pressed. If you move the mouse now, you can move the window to anywhere on the screen. In the archive window, you can choose between a list of patients or saved recordings. In the “Patients” menu, you can select any patient. On the right side, the saved recordings for the selected patient are displayed. Once a patient is selected, one has the following options:
? Open the patient file to being a recording ? Delete the patient (incl. his measurements)
One of these recordings can now be selected.
Figure 54: Loading data record from the archive
VMX00
41
In the “Recordings” menu, all saved measurements are listed. The recordings can be directly selected. The selected recording can now be opened, deleted or exported.
4.4.2 Searching for data records in the archive
Various options are available for searching for one or several specific data records. Scroll bars on the data record field or an automatic search can be used. A manual search can be carried out using the scroll bar. This search can be easily simplified by sorting a column. This sorting function can be carried out for each column of a data record by double-clicking on the desired column heading (date, duration, first name, last name, patient ID and date of birth). Click the heading again to sort in the opposite order. Furthermore, in the “Patient” menu, there is an automatic search function available. This searches through the patient data for a desired sequence of characters. This is entered in the text field under the data records. The automatic search is started with the “Find” button. Afterwards, only data records are displayed in the archive window which contain the character set in one of the patient data fields (first name, last name, patient ID and date of birth). All data records are displayed by deleting the text field and reinitiating a search.
4.4.3 Loading and displaying data record from archive
Open the archive window and select the desired data record by clicking on it one time. There are two ways of displaying the data record. You can double-click the desired data record or you can use the “Open” operating field. After loading a data record, the archive window closes automatically and the ECG is shown in the main window.
4.4.4 Deleting data record
To delete a data record, select it in the archive window by clicking on it one time. Click on the button “Delete recording” and confirm the following prompt by clicking on “Yes”.
4.4.5 Exporting data record
In addition, the software allows data records to be imported and exported. These functions can be executed in the archive window via the two buttons provided for this purpose. Afterwards, the source/target folder and file name must be selected, and confirmed with "Open" or "Save". To export a data record from the archive, go into the “Archive” menu. Select a data record and click on the "Export” button. In the drop-down menu that appears, select the desired format.

OPERATION
42
Figure 55: Selecting file format
In the window which opens after that, enter the target folder and file name. Click on “Save” to complete the export. The data is saved with the ending .be2 or .scp. Note:
? In the file format “.scp”, only a 10 s section can be saved. The .be2 file contains the entire ECG recording in edf format. For this, rename the exported .be2 file to a .zip file and then extract the files.
Figure 56: Exporting data record
4.4.6 Importing data records
To import a data record from the archive, select “Archive” under the “File” menu item. Click on “Import”. In the window that opens, enter the directory and file name which you would like to import. NOTE:
? The imported file must have the ending .be2, .scp or .ber. Click on “Open” to complete the data import. The patient data will now be imported. A query appears where you have the option of allocating this recording to an existing patient, or you can automatically have a new patient created with the patient data saved in the data record. After successfully importing this data record, this data record is to be entered in the "Recordings" menu of the archive window.

VMX00
43
Figure 57: Importing data record
4.4.7 Creating new patient
To add a new patient manually, you have three options:
Click the “New patient” symbol at the top left in the symbol bar.
In the “Archive” menu , Click the “New patient” button . Press the key combination “Ctrl” + “n” on your keyboard.

ECG ASSESSMENT (ONLY WITH ANALYSIS LICENSE)
44
5. ECG ASSESSMENT (ONLY WITH ANALYSIS LICENSE)
The Hanover ECG system HES® from Biosigna® is used to measure a resting ECG. HES® offers the following performance features:
? ECG measurement ? Form and rhythm analysis ? Output of the representative cycles with features ? ECG interpretation
5.1.1 Prerequisites
To be able to use the analysis function, the following prerequisites must be met. Otherwise, this button is deactivated.
? A valid analysis license must be entered in the “Licenses” menu item (see Section 3.8).
? At least 10 s of analyzable ECG data must be available. ? All 12 channels must be recorded with as few artifacts as possible. ? For an exact analysis, the patient data fields “Gender”, “Date of birth”, “Height”,
“Weight” and “Pacemaker” should be filled out. Otherwise, default values will be taken.
5.1.2 Starting and stopping the ECG analysis
After a recording period of at least 10 seconds, the ECG analysis can be started by clicking on the “ECG view" field or by pressing "Ctrl” + “a”. This is possible both for looking at already saved data, as well as online for the running data recording. A red heart appears.
Figure 58: Symbols for ECG and analysis views
If you would like to end the analysis, you will return to the ECG recording from analysis mode by clicking on the shown “Analysis view” field or pressing "Ctrl" + "a".

VMX00
45
5.1.3 Analysis view description
The analysis view represents one channel of the analyzed 10-second section, the representative cycles, the measurement and the interpretation result. To look at another channel of the analyzed section, click on the lead symbol on the left side in front of the ECG curve. The view switches among the various leads.
Figure 59: Analysis window
To analyze other 10-second sections, move the scroll bar to the respectively desired time interval.
Figure 60: Scroll bar
Alternatively, a direct visual search for an ECG section is possible. The magnifying glass function is available for this. An ECG section can be selected for analysis via the window that then appears.

ECG ASSESSMENT (ONLY WITH ANALYSIS LICENSE)
46
Figure 61: Direct search
5.1.4 Representative cycle
When one switches to the analysis view, the system analyzes the QRS complexes of the ECG section over 10 s, which is visible on the monitor. From this data, it calculates an average heart cycle, the so-called representative heart cycle. The associated representative leads, as well as the time and amplitude parameters are displayed.

VMX00
47
Figure 62: View of representative cycle
Display of a representative cycle:
? The length of the section displayed on the screen depends on the feed rate, screen size and grid size. For a standard grid size and 10 mm/s, about 12 s are displayed.
? The shown time period on the printout is equivalent to the analyzed 10 s section, independent of the settings on the screen.
? NOTE: When printing out the analysis section, to show the relevant 10-second section, the following parameters are fixed: grid size = 1 mm, feed rate = 25 mm/s, sensitivity = 5 mm/mV, no filter.
? The areas of the ECG section based on the time and amplitude parameters are marked with vertical dotted lines in the representative cycle.
? The automatic definition of these areas of the ECG section can be modified according to user definitions: As soon as you move the mouse over one of the lines, the color of this line changes to red. By moving the mouse with the mouse button pressed, the position of the marking line can be interactively changed to the desired position. Afterwards the associated parameters can be measured manually.
? The measurement tool is also available in the analysis view. For this, click on the desired point in the lead cycle and, with the mouse button pressed, drag the opening field to the place to be measured.
? By clicking on a representative lead, this is displayed by itself. A click anywhere in the lead area shows the rest of the leads again.
? Repeatedly clicking on the red calibration deflection cyclically changes the figure scale of the representative leads. A red bar as a calibration deflection means “automatic scaling”.
Figure 63: Moving measurement lines
ECG ASSESSMENT (ONLY WITH ANALYSIS LICENSE)
48
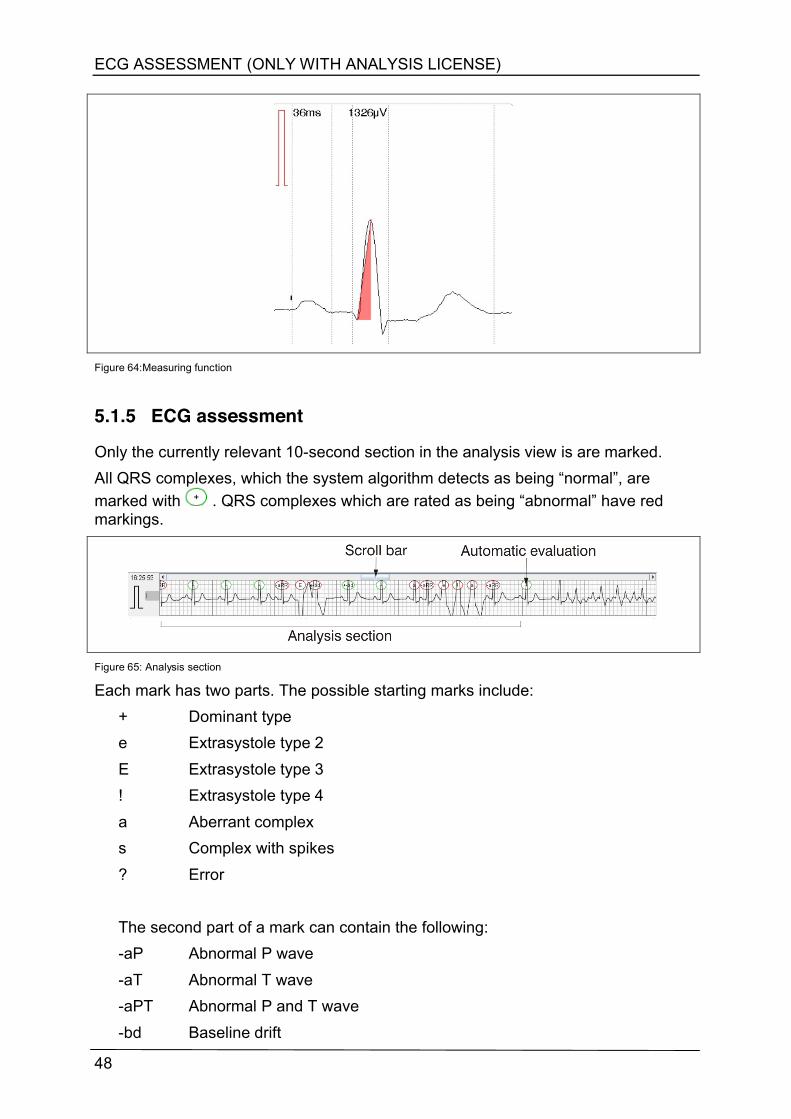
Figure 64:Measuring function
5.1.5 ECG assessment
Only the currently relevant 10-second section in the analysis view is are marked. All QRS complexes, which the system algorithm detects as being “normal”, are marked with . QRS complexes which are rated as being “abnormal” have red markings.
Figure 65: Analysis section
Each mark has two parts. The possible starting marks include: + Dominant type e Extrasystole type 2 E Extrasystole type 3 ! Extrasystole type 4 a Aberrant complex s Complex with spikes ? Error The second part of a mark can contain the following: -aP Abnormal P wave -aT Abnormal T wave -aPT Abnormal P and T wave -bd Baseline drift

VMX00
49
-aRR Abnormal R-R interval ? Error
The time and amplitude parameters of the selected representative lead are shown at the right.
Parameter Unit Meaning
HF [/min] Heart rate
RR [ms] R-R interval
P [ms] Duration of the P wave
PQ [ms] Duration of the PQ interval
QRS [ms] Duration of the QRS complex
QT [ms] Q-T interval
QTc [ms] Q-T interval, corrected by the heart rate
QTr [%] Q-T interval, relative
P [º] Angle of the electric heart axis on the P wave
QRS [º] Angle of the electric heart axis on the QRS complex
T [º] Angle of the electric heart axis on the T wave
P [mV] P wave maximum
Q [mV] Q wave maximum
R [mV] R wave maximum
S [mV] S wave minimum
T [mV] T wave maximum
J [mV] J amplitude maximum
ST [mV] ST segment
The results of the measurement of the recorded ECG are displayed in the analysis view. This includes the interpretation result with “Rhythm”, QT dispersion”, “QRS-T assessment”, “Findings notes”, “Disturbance” and “Overall assessment”.
Figure 66: Interpretation result

ECG ASSESSMENT (ONLY WITH ANALYSIS LICENSE)
50
The findings notes can be selected individually and included in the findings report. To do this, move the mouse pointer over the finding. The findings symbol appears. Click on this findings symbol to transfer that part of the findings suggestion to the report.
Figure 67: Accepting a findings suggestion
Figure 68: Printout of findings

VMX00
51
Figure 69: Printout of analysis

NETWORK LICENSE
52
6. NETWORK LICENSE The VMX00 software is designed for operation on local networks. In addition, the VMX00 software saves all data, both patient data as well as ECG recordings, in an SQL database. The following databases are currently supported
? H2, as a standalone database in single-user operation (standard configuration) ? H2 in a network for multi-user operation ? PostgreSQL starting from Version 8.X (recommended for network installation) ? MS-SQLServer starting from Version 2003 ? Oracle >= 9
6.1 Single-PC operation The standard installation uses an H2 standalone database for single-user operation. This database puts your files in a folder, VMX00_DB, in the home directory of the current user. It is imperative that this folder be backed up on a regular basis by the user. To save the data at another location, another path is to be specified in the “Settings” menu with the database as the source.
6.2 Multiple-PC operation Multiple-PC VMX00 operation requires a network license, which must be purchased separately. Please consult your dealer. The network license allows the simultaneous access to several VMX00 instances on a single database. For multiple-PC operation, the VMX00 must have an external database provided for it. In the installation directory, there is a service version of the H2 database, which installs itself in the H2 server directory using the install.bat script and is set up as a Windows service. The H2 server database also saves its data in the H2 database directory. This folder must then be integrated in the daily practice data backup. The H2 database is a pure Java database, which is sufficient for operation with a small number of users. If a higher number of users have to be served, the installation of a PostgreSQL (Open Source) or MS-SQLServer / Oracle (at extra charge) is recommended for a practice server. All VMX00 clients must then be configured on the correct database under “Settings”-> “Database”. When setting up the VMX00 software as a multiple-PC system, it is urgently recommended that an experienced database administrator be called in.
6.3 Ending the program
To exit the program, click on the “End program” symbol at the upper right. The database connection is now closed and the settings are saved.
VMX00
53
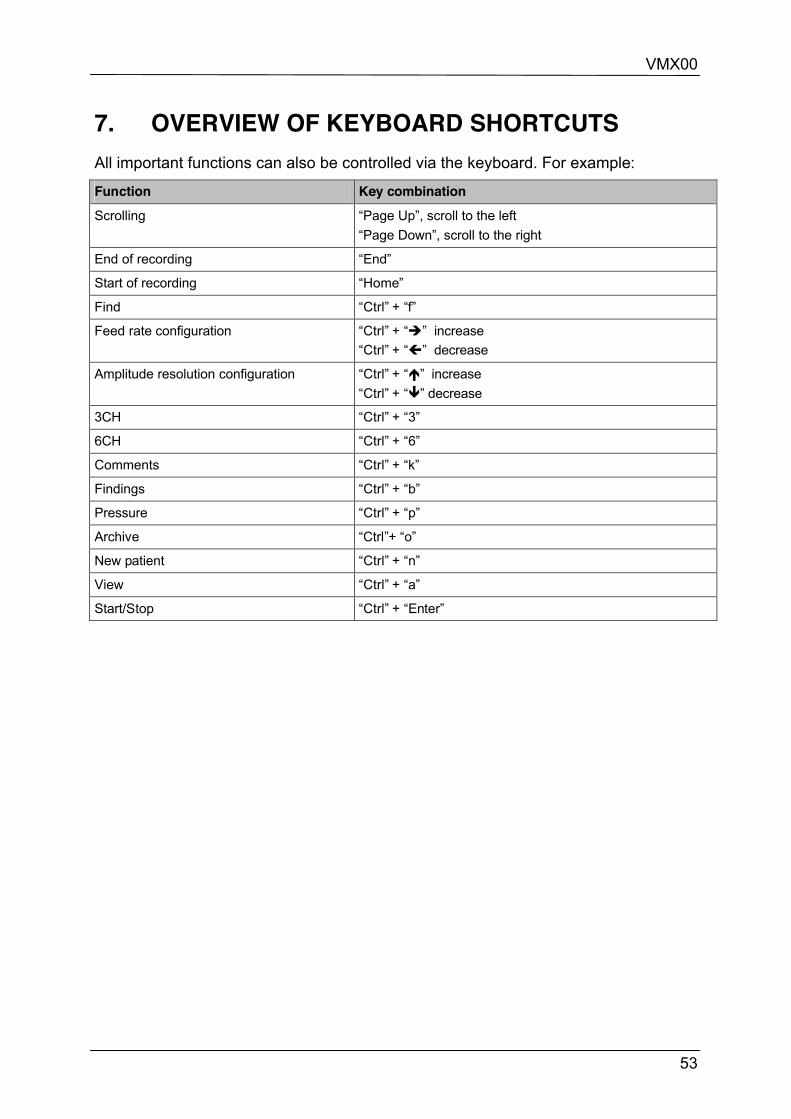
7. OVERVIEW OF KEYBOARD SHORTCUTS All important functions can also be controlled via the keyboard. For example:
Function Key combination
Scrolling “Page Up”, scroll to the left “Page Down”, scroll to the right
End of recording “End”
Start of recording “Home”
Find “Ctrl” + “f”
Feed rate configuration “Ctrl” + “Ë” increase “Ctrl” + “Á” decrease
Amplitude resolution configuration “Ctrl” + “È” increase “Ctrl” + “Í” decrease
3CH “Ctrl” + “3”
6CH “Ctrl” + “6”
Comments “Ctrl” + “k”
Findings “Ctrl” + “b”
Pressure “Ctrl” + “p”
Archive “Ctrl”+ “o”
New patient “Ctrl” + “n”
View “Ctrl” + “a”
Start/Stop “Ctrl” + “Enter”
MALFUNCTIONS AND ERROR DESCRIPTION
54
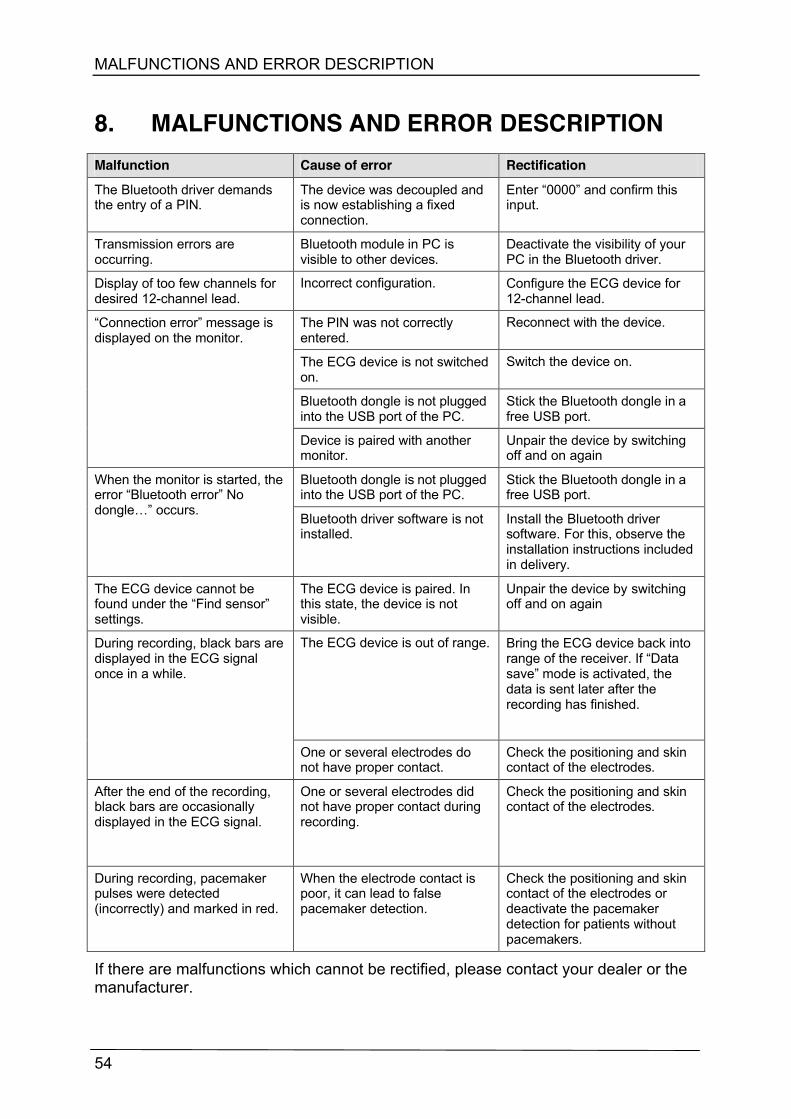
8. MALFUNCTIONS AND ERROR DESCRIPTION Malfunction Cause of error Rectification
The Bluetooth driver demands the entry of a PIN.
The device was decoupled and is now establishing a fixed connection.
Enter “0000” and confirm this input.
Transmission errors are occurring.
Bluetooth module in PC is visible to other devices.
Deactivate the visibility of your PC in the Bluetooth driver.
Display of too few channels for desired 12-channel lead.
Incorrect configuration. Configure the ECG device for 12-channel lead.
The PIN was not correctly entered.
Reconnect with the device.
The ECG device is not switched on.
Switch the device on.
Bluetooth dongle is not plugged into the USB port of the PC.
Stick the Bluetooth dongle in a free USB port.
“Connection error” message is displayed on the monitor.
Device is paired with another monitor.
Unpair the device by switching off and on again
Bluetooth dongle is not plugged into the USB port of the PC.
Stick the Bluetooth dongle in a free USB port.
When the monitor is started, the error “Bluetooth error” No dongle…” occurs.
Bluetooth driver software is not installed.
Install the Bluetooth driver software. For this, observe the installation instructions included in delivery.
The ECG device cannot be found under the “Find sensor” settings.
The ECG device is paired. In this state, the device is not visible.
Unpair the device by switching off and on again
The ECG device is out of range. Bring the ECG device back into range of the receiver. If “Data save” mode is activated, the data is sent later after the recording has finished.
During recording, black bars are displayed in the ECG signal once in a while.
One or several electrodes do not have proper contact.
Check the positioning and skin contact of the electrodes.
After the end of the recording, black bars are occasionally displayed in the ECG signal.
One or several electrodes did not have proper contact during recording.
Check the positioning and skin contact of the electrodes.
During recording, pacemaker pulses were detected (incorrectly) and marked in red.
When the electrode contact is poor, it can lead to false pacemaker detection.
Check the positioning and skin contact of the electrodes or deactivate the pacemaker detection for patients without pacemakers.
If there are malfunctions which cannot be rectified, please contact your dealer or the manufacturer.

VMX00
55
9. VMX00-TRANSMITTER VMX00-Transmitter is an add-on of the VMX00 and is used solely for transmitting stored data of the VMX00 to the Avetana online patient record system. Please go to www.avetana.de. For utilization of this patient record system, a certain fee has to be charged by Avetana. They are responsible for any kind of contract for using this patient record system. A user account is is created by Avetana and necessary for uploading data.
9.1 Installation For the Windows version, the Transmitter will be installed automatically by installing the VMX00. For the Mac version, the Transmitter has to be installed separately to the VMX00, which is also placed on the CD.
9.2 Start Transmitter For security reasons, a simultaneous operation of VMX00 and Transmitter is blocked. Before opening the transmitter, the VMX00 has to be closed (and vice versa). Otherwise the following note appears:
Figure 70: Security note
Please choose “No” to exit the program. If “Yes” is selected, the Database path can be modified as described in chapter 3.6. After entering the Transmitter in the correct way, you are located in the main menu.
VMX00-TRANSMITTER
56
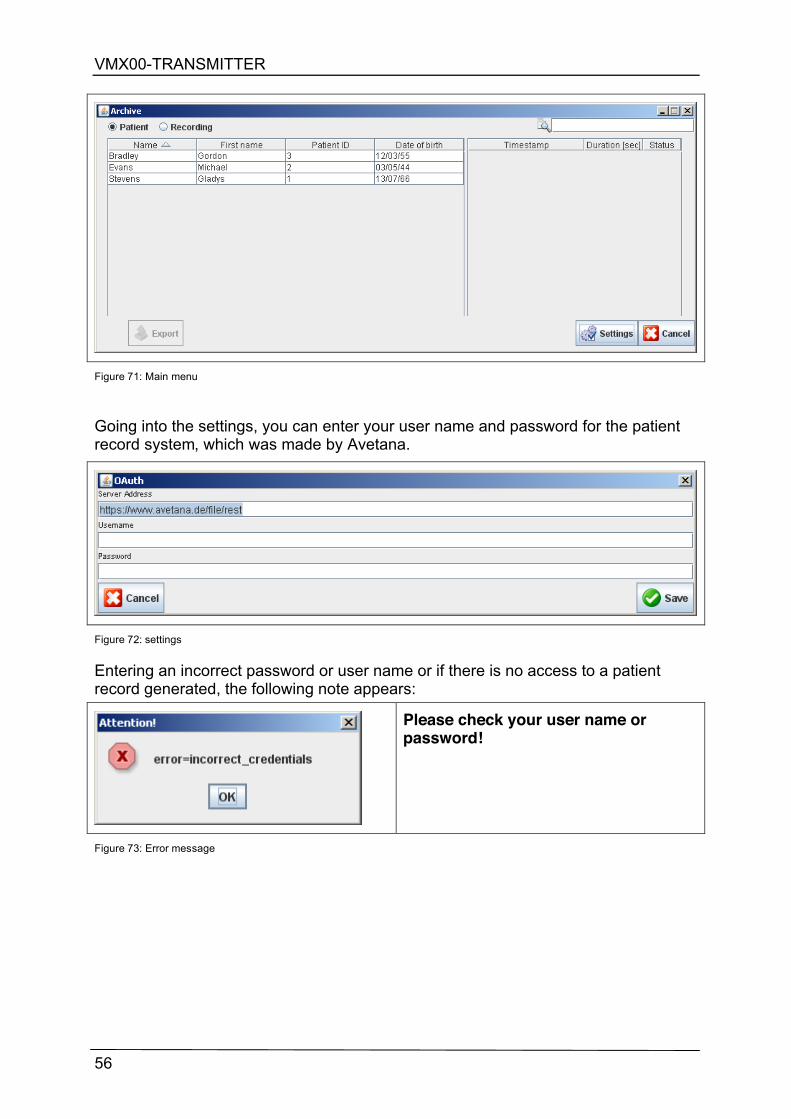
Figure 71: Main menu
Going into the settings, you can enter your user name and password for the patient record system, which was made by Avetana.
Figure 72: settings
Entering an incorrect password or user name or if there is no access to a patient record generated, the following note appears:
Please check your user name or password!
Figure 73: Error message

VMX00
57
9.3 Uploading the data After finishing the default settings and creating an account for the patient record system (see Chapter 11) you can choose the required data concerning the patient or the recordings for transmitting. By pressing the “Export” button, the system starts uploading the data to the Avetana Server.
Figure 74: Exportfunction
The transmission is in progress, if the following note appears. Now, the data can be seen in the record system.
Figure 75: Data transmission
If the internet connection is incorrect, following error note is shown.
Figure 83: Error data transmission
9.4 Finishing the program To finish the program, please press the cancel or the close button.
Figure 84: Finishing the program

WARRANTY
58
10. WARRANTY SR-Medizinelektronik guarantees that the product is free of defects if used as intended for a time period of one year starting from the date of purchase. In the case of products which have a shorter service life than one year, the warranty expires on the expiration date on the packaging or specified in the user instructions. The requirement for warranty claims is the presentation of a receipt indicating the vendor and date of purchase. SR-Medizinelektronik will extend no warranty in the following cases:
? User manual is not observed ? Operating errors ? Improper use or handling ? Original replacement parts are not used ? Third-party intervention in the device by non-authorized persons (e.g. for
cleaning or repair purposes) ? Forces of nature, such as lightning ? Transportation damage due to improper packaging of returns ? Wear due to operation and usual wear and tear. This includes, e.g. batteries
and disposable articles. SR-Medizinelektronik is neither liable for consequential losses caused by defects, as far as they were not intentional or involved gross negligence, nor for minor physical injury to life or limb resulting from negligence. SR-Medizinelektronik reserves the right to decide whether to eliminate defects, to deliver a defect-free item or to reduce the purchase price by a reasonable amount. If the warranty claim is rejected, we will assume no costs for the transport between the customer and manufacturer. The statutory warranty rights are unaffected by this.

VMX00
59
Space for notes:

© Copyright protected. Duplication of any kind only with the express permission of SR-Medizinelektronik
Contact: SR-Medizinelektronik Mörikestrasse 9 D-70178 Stuttgart Germany Phone: +49 711 9144650 Fax: +49 711 9144651 e-mail: [email protected] Homepage: www.sr-med.de