user manual full disclosure ecg holter system manual.pdf · user manual full disclosure ecg holter...
TRANSCRIPT

User Manual Full Disclosure ECG Holter System
SW Version: 4.03 (Issued: May. 5, 2006) Labtech Ltd. Page 1 of 84

User Manual Full Disclosure ECG Holter System
SW Version: 4.03 (Issued: May. 5, 2006) Labtech Ltd. Page 2 of 84
Dear Customer
Thank you for purchasing our ECG HOLTER System. We sincerelywish that our product would help your diagnostic and therapeuticwork. Please read the manuals carefully for the use of the HolterSystem and for the use of the computer programs! A basicknowledge of computers and Windows based applications isexpected. We are looking forward to your comments and remarks onthe use of the System. Our colleagues and representatives will helpyou with pleasure if needed even personally. Please, turn to us withconfidence.
What is a Holter?A Holter is a non-invasive, long-term ambulatory ECG device that iscapable of recording 24 (or even 48-72) hours of ECG signals.
How is Holter monitoring used?The patient wears the holter for 24 hours and assumes normalactivities, including sleep periods. At the end of the 24 hours, thedata from the holter are transferred to the computer, where aqualified expert reviews and, if necessary, edits the data.
What is an Ambulatory Blood Pressure Monitor (ABPM)?The Ambulatory Blood Pressure Monitor is a non-invasiveoscillometric blood pressure monitor, which is capable of recordingup to 250 measurements.
How is ABPM monitoring used?The monitor is worn by the patient, and records the ambulatoryblood pressure during normal daily activities. After it has beenrecorded for the desired period of time, the stored readings aredownloaded into the computer.
We wish you success in the use of our ECG Holter System.
L A B T E C H Ltd.4031 Debrecen Tel: +36 / 52-310-128
Vág street 4. Hungary Fax: +36 / 52-412-023
Email: [email protected] Web: www.labtech.hu

User Manual Full Disclosure ECG Holter System
SW Version: 4.03 (Issued: May. 5, 2006) Labtech Ltd. Page 3 of 84
Table of contents
Software Version: 4.03............................................................... 61. Preparations for Using the Holter System .............................. 6
1.1. List of Accessories .......................................................... 61.1.1. Holter Accessories ................................................... 61.1.2. Ambulatory Blood Pressure Monitor Accessories ..... 7
1.2. Minimum Computer Configuration ................................... 81.3. Principles of Operation .................................................... 8
1.3.1. Indications for Using Holter Monitoring ..................... 81.3.2. Indications for Using Ambulator Blood Pressure
Monitoring................................................................. 91.3.3. Warnings and Contraindications of Using ABP
Monitoring................................................................. 91.4. Installation of the Holter System.................................... 11
1.4.1. Software Installation ............................................... 111.4.2. Hardware Installation.............................................. 121.4.3. Installation Successful? .......................................... 13
2. The Recorders ..................................................................... 142.1. The Holter Recorder...................................................... 142.1.1. General Description, Light and Sound Signals ........... 142.1.2. Connecting the Holter Recorder to the Patient ........... 172.3. The ABP Monitor ........................................................... 192.3.1. LCD Display and Functions of the Start/Stop Button .. 192.3.2. Connecting the ABP Monitor to the Patient................. 202.4. Starting a Holter Recording ........................................... 21
2.4.1. Starting the Recording from the Computer (TypicalUsage with ECG Monitoring) .................................. 22
2.4.2. Starting by the Push Button on the Recorder (SpecialUsage without Computer and ECG Monitoring) ...... 23
2.5. Starting an ABP Recording............................................ 242.6. Scanning a Holter Recording......................................... 242.7. Scanning an ABP Recording ......................................... 25
3. Overview of the Analysis and the Display Program.............. 253.1. Database Menu - Database Operation .......................... 25
3.1.1. Patients .................................................................. 273.1.2. Save Current Record.............................................. 303.1.3. Select Database Location....................................... 303.1.4. Recorder Status ..................................................... 30
User Manual Full Disclosure ECG Holter System
SW Version: 4.03 (Issued: May. 5, 2006) Labtech Ltd. Page 4 of 84
3.1.5. Export Record…..................................................... 303.1.6. Import Record… ..................................................... 313.1.7. Archivation on CD or DVD...................................... 313.1.8. Select V3.xx Database Location............................. 323.1.9. Exit ......................................................................... 32
3.2. Scan - Scanning a Record from the Recorder ............... 333.3. View .............................................................................. 35
3.3.1. Graphs - HR, ST, QT Graphs ................................. 363.3.2. Templates–The Base of the Evaluation ................ 38
3.3.2.1. Merging Similar Templates 393.3.2.2. Fast Playback 40
3.3.3. Events View–Summarized Events ........................ 413.3.3.1. Setting of the Events View Parameters 43
3.3.4. Full View–Overview of the ECG Signals............... 433.3.4.1. Editing of Atrial Fibrillation 44
3.3.5. ECG Record–Overview and Measurement of theECG Curves ........................................................... 45
3.3.5.1. Using of the ECG Rulers–Measuring 463.3.6. BP Statistics–Displaying the Blood Pressure
Monitoring Statistics................................................ 473.3.7. Medians–View of the ECG medians ..................... 483.3.8. Service ................................................................... 493.3.9. HRV Time Histograms and Tables ......................... 493.3.10. HRV Time Domain Distributions ........................... 503.3.11. HRV, Frequency Domain...................................... 513.3.12. QT Summary........................................................ 523.3.13. Pacemaker Summary........................................... 523.3.14. Pacemaker Histograms ........................................ 533.3.15. Summary.............................................................. 553.3.16. Blood Pressure Table ........................................... 55
3.4. Events ........................................................................... 563.5. Report ........................................................................... 573.6. Print .............................................................................. 573.7. Settings ......................................................................... 59
3.7.1. Parameters............................................................. 593.7.2. Recorder Filter Settings.......................................... 633.7.3. Colours................................................................... 643.7.4. Graphs (HR, ST, QT) ............................................. 643.7.5. Events View ........................................................... 65

User Manual Full Disclosure ECG Holter System
SW Version: 4.03 (Issued: May. 5, 2006) Labtech Ltd. Page 5 of 84
3.7.6. Multilanguage Translator ........................................ 653.7.7. New Analysis.......................................................... 66
3.8. Help .............................................................................. 663.8.1. User Manual........................................................... 663.8.2. Language ............................................................... 663.8.3. Validity ................................................................... 67
3.9 Interface Status Control Box........................................... 674. VES and SVES Event Decision Criteria ............................... 695. Interpreting HRV Parameters............................................... 706. What To Do? (Help for the Assistance) ................................ 71
6.1. Handing Out the Recorder (starting the recording) ........ 716.2. Taking Back the Recorder From the Patient (scanning the
record) ........................................................................... 736.3. Possible Errors.............................................................. 73
6.3.1. The recording is too noisy ...................................... 746.3.2. No connection between the recorder unit and the
computer ................................................................ 746.3.3. The selected page cannot be printed...................... 746.3.4. The recorder does not record for 24 hours ............. 75
7. Recommended order of the evaluation ................................ 768. Technical Parameters of the Recording Unit ........................ 77
8.1. Two-Channel Recorder ................................................. 788.2. Three-Channel Recorder with Pacemaker Channel....... 788.3. Three-Channel Recorder with Pacemaker Channel and
Built-In ABPM ................................................................ 798.4. Ambulatory Blood Pressure Monitor .............................. 80
9. Maintenance, Calibration ..................................................... 81DIARY I.................................................................................... 83DIARY II................................................................................... 84

User Manual Full Disclosure ECG Holter System
SW Version: 4.03 (Issued: May. 5, 2006) Labtech Ltd. Page 6 of 84
Software Version: 4.031. Preparations for Using the Holter System
1.1. List of AccessoriesPlease check the listed units and accessories before installing theECG Holter System.
1.1.1. Holter AccessoriesIn case of purchasing a complete System, items 1-12 must beincluded, in case of purchasing a single recorder, only items 8-12are included. Item 13 is to be found only in the 3 Channel HolterSystem with the built-in Ambulatory Blood Pressure Monitor (in thefollowing: ABPM).
Item Quantity Code No. Specification1. 1 pc 3HV4-01 Case for holding the recorder
and accessories2. 1 pc 3HV4-02 USB INFRA interface unit3. 1 pc 3HV4-03 USB cable4. 1 pc 3HV4-04 CD with installation software5. 1 pc 3HV4-05 User Manual6. 1 package 3HV4-06 Single use ECG electrodes7. 1 pc 3HV4-07 Battery charger8. 4 pcs 3HV4-08 1.2V Rechargeable batteries9. 1 pc 3HV4-09 ECG recorder unit with patient
cables10. 1 pc 3HV4-10 Recorder case (attachable on
the patient)11. 1 pc 3HV4-11 Waist belt12. 1 pc 3HV4-12 Shoulder strap13. 1 pc 3HV4-13 Blood Pressure Measuring Cuff

User Manual Full Disclosure ECG Holter System
SW Version: 4.03 (Issued: May. 5, 2006) Labtech Ltd. Page 7 of 84
1.1.2. Ambulatory Blood Pressure Monitor Accessories
Item Quantity Code No. Specification1. 1 pc ABP-01 Case for holding the recorder
and accessories2. 1 pc ABP-02 USB-to-Serial cable3. 1 pc ABP-03 CD with installation software4. 1 pc ABP-04 User Manual5. 1 pc ABP-05 Battery charger6. 4 pcs ABP-06 1.2V Rechargeable batteries7. 1 pc ABP-07 ABP recorder unit8. 1 pc ABP-08 Recorder case (attachable on
the patient)9. 1 pc ABP-09 Waist belt10. 1 pc ABP-10 Blood Pressure Measuring Cuff
with Anchor Clip11. 10 pcs ABP-11 Cuff Anchor Pads12. 1 pc ABP-12 Cuff Plug

User Manual Full Disclosure ECG Holter System
SW Version: 4.03 (Issued: May. 5, 2006) Labtech Ltd. Page 8 of 84
1.2. Minimum Computer Configuration
Processor: 2 GHz
RAM: 256 MB min. (512 MB recommended)
HDD: 60 GB
Monitor: Colour SVGA
Video Adapter: 4 MB SVGA
Interface: 1 pc USB port
Printer: Laser or LaserJet
Operating System: Win2000, WinXP
Using a computer with lower performance will result in non-satisfactory analysis speed.
1.3. Principles of Operation
1.3.1. Indications for Using Holter Monitoring
Holter monitoring is a tool in the evaluation of patients withsymptoms of various forms of heart disease, or in situations wherethe physician suspects cardiac pathology in the absence ofsymptoms. Symptoms such as lightheadedness, palpitations, orfainting may be caused by disturbances in the electrical signals thatcontrol the heart muscle contractions. These disturbances can berandom, spontaneous, sleep-related, emotion- or stress-induced.
Holter monitoring is an ideal test because the patient assumesnormal daily activities, increasing the likelihood that he or she willexperience the precise situations that can trigger symptoms orcardiac events. This allows correlation of any rhythm problems orabnormalities with activities and/or symptoms. In the oppositesense, Holter monitoring can also be used to "rule out" cardiaccauses of patients' symptoms.

User Manual Full Disclosure ECG Holter System
SW Version: 4.03 (Issued: May. 5, 2006) Labtech Ltd. Page 9 of 84
1.3.2. Indications for Using Ambulator Blood PressureMonitoring
This device is intended for use as an aid or adjunct to diagnosis andtreatment when it is necessary to measure an adult patient’s systolic and diastolic blood pressures over an extended period of time.
The Ambulatory Blood Pressure Monitor unit is worn by the patienteither in a waist belt or shoulder strap and is connected to atraditional cuff around the non-dominant upper arm. The cuff isinflated automatically at intervals that can be programmed, using thesoftware. Blood pressure is measured by the oscillometric method,which senses the cessation of pressure waves in the artery whenoccluded by pressure in the cuff. Measurement of the frequency ofthe pressure waves also enables heart rate to be measured.
1.3.3. Warnings and Contraindications of Using ABP Monitoring
DO NOT use in the presence of flammable anesthetics; this couldcause an explosion.
DO NOT immerse the monitor in any fluid, place fluids on top, orattempt to clean the unit with any liquid detergents or cleaningagents. This may cause an electrical hazard. If accidental wettingoccurs, please return to the manufacturer.
DO NOT remove unit covers. The monitor does not contain any userserviceable components.
DO NOT use the monitor if it has failed its diagnostic self-test, or if itdisplays greater than zero pressure with no cuff attached. Thevalues displayed by such a unit may be inaccurate.
DO NOT use on neonates.
DO NOT use on patients known to be readily susceptible to bruising.
DO NOT attach the cuff to a limb being used for IV infusions. Thecuff inflation can block the infusion, causing harm to the patient.

User Manual Full Disclosure ECG Holter System
SW Version: 4.03 (Issued: May. 5, 2006) Labtech Ltd. Page 10 of 84
CAUTION: Substitution of a component different from thatsupplied may result in measurement error. No repair should beundertaken or attempted by anyone not service trained by approvedservice agents.
CAUTION: If cuff fails to deflate within 3 minutes, instruct patienton manual removal of cuff.
CAUTION: Check that operation of the unit does not result inprolonged impairment of the circulation of the patient.
CAUTION: Avoid compression or restriction of pressure tubes.
If any abnormality occurs in the unit, suspend the operationimmediately and disconnect the unit from the patient. If cuff fails todeflate, the patient should be instructed on proper and safe removalof the cuff. Use only the cuffs supplied with this unit.
Possible Adverse Reactions:
Allergic Exanthema (symptomatic eruption) in the area of thecuff Urticaria (allergic reaction including raised edematouspatches of skin or mucous membranes and intense itching)caused by the fabric material of the cuff.
Petechia (a minute reddish or purplish spot containing bloodthat appears in the skin).
Rumple-Leede phenomenon (multiple petechia) on theforearm.
Idiopathic thrombocytopenia (spontaneous persistentdecrease in the number of platelets associated withhemorrhagic conditions).
Phlebitis (inflammation of a vein)

User Manual Full Disclosure ECG Holter System
SW Version: 4.03 (Issued: May. 5, 2006) Labtech Ltd. Page 11 of 84
1.4. Installation of the Holter SystemThe installation of the Holter System consists of two main steps:
Software Installation Hardware Installation
1.4.1. Software Installation
The installation CD consists of: the necessary files for the installation of the Holter program, the installation files of the USB INFRA interface unit that can
be found in the USB-INFRA directory. the drivers for the USB-to-Serial connector cable
In order to be able to install the software on a Windows NT,2000, or an XP-based system you need to have administrativerights. If you do not have such rights please consult yoursystem administrator.
After placing the installation CD into the CD-drive, the installation willstart in a couple of seconds automatically. The program will offer adirectory where the necessary files will be copied. If you wish toaccept the directory offered, click on the OK button. If you wish toinstall the program to a different place, the first step is to create anew directory and then this should be selected as the destination.
If there has already been installed a Holter program, the abovementioned steps are to be followed, too. After inserting the CD theinstallation will start automatically. If the installation destination is thesame directory in which the previous version had been installed,then the previously created database will remain unchanged andonly the new programs will be installed. So the new installation(update) will keep the former settings and database, only the filesthat need to be updated will be overwritten.
During installation the drivers of the USB INFRA unit and the USB-to-Serial connector cable are automatically copied and installed.
The software will typically be installed on a client computer but thedatabase may reside on a server as well so it can be shared amongseveral computers via the network.

User Manual Full Disclosure ECG Holter System
SW Version: 4.03 (Issued: May. 5, 2006) Labtech Ltd. Page 12 of 84
1.4.2. Hardware Installation
The HOLTER device should only be connected tocomputers fulfilling the applicable safety and shock-hazardstandards!The HOLTER device corresponds to the applicable safety andshock-hazard standards thus the use of the device is safe.Using it under normal circumstances the recorder unit attachedto the patient cannot be connected to a PC.
Installing the USB INFRA interfaceConnect the USB INFRA interface unit with the appropriate cable toa free USB port. The operating system will automatically recognizethe device and install the necessary drivers, there is no need for theinstallation CD.
Windows XP might display a warning message that thedrivers are not digitally signed. This is normal, please chooseContinue Anyway.
After this, attach the USB INFRA interface with the supplied selfadhesive tape on a safe flat surface (e.g. on the side of thecomputer) in a way to achieve a face-to-face arrangement with therecorder unit laying on its side, assuring good sight, while readingdata or starting a recording. During communication the window ofthe USB INFRA module and the red heart symbol of the recorder (incase of an ABPM product its infra window) should face each other.
Attention: good quality data transmission can be achievedonly if the recorder and the USB INFRA interface unit are facingeach other, when starting the recording they are within adistance of 1 m, when reading the records they are within adistance of 0.5 m.
Installing the USB-to-Serial connector cableConnect the cable to a free USB port and it will be automaticallyrecognized and installed.

User Manual Full Disclosure ECG Holter System
SW Version: 4.03 (Issued: May. 5, 2006) Labtech Ltd. Page 13 of 84
1.4.3. Installation Successful?
After the program has successfully been installed an icon will becreated in the Start menu. If you launch the program and load arecord the main screen will look like this:
1. Menu bar 12. Delete Event2. Patient’s name 13. Select Event for Printing3. Colour Coded Graphs 14. Zoom4. Enlarge Graph 15. Playback5. ECG Scrollbar 16. Move left6. QRS Type 17. Move right7. ECG Strip 18. Toolbar8. Interface Status Control Box 19. Amplitude9. Selected menu 20. Speed10. Scrollbar 21. Channels11. Delete Event Group 22. Heart Rate Type
Please check whether the Interface Status Control Box (in the upperright corner of the screen) is green . If you hover the mouse overthe box you should see the next message:
1
2
3
4
5
6
7
89
10
11 12
13
14
15
16
17
18
19
20
21
22

User Manual Full Disclosure ECG Holter System
SW Version: 4.03 (Issued: May. 5, 2006) Labtech Ltd. Page 14 of 84
If not, see Section 3.9 for a list of possible errors.Note: You may see a different picture depending on yourconfiguration.
After the installation, please, check the functioning of the recorderwith the computer. This should be done according to sections 2.4and 2.5, by starting the recording and by reading in the data. In caseof an error the program indicates the probable causes with an errormessage.
2. The Recorders
2.1. The Holter Recorder
2.1.1. General Description, Light and Sound SignalsThe recorder - depending on its type - stores the ECG signals inone, two or three independent channels.

User Manual Full Disclosure ECG Holter System
SW Version: 4.03 (Issued: May. 5, 2006) Labtech Ltd. Page 15 of 84
Use only intact rechargeable batteries! The unusablebatteries are to be used as dangerous waste. Always checkcarefully the polarity of the batteries otherwise the recorder willnot be functioning. The rechargeable batteries will not damagethe recorder when inserted in the wrong way because therecorder has reverse polarity protection.
When inserting the batteries please make sure that you place theblack strip under the batteries thus they will be easier to remove.The recorder carries out a self-test after the rechargeable batterieshave been inserted, and according to the result of this test it makeslight and sound signals.If everything is functioning properly you can hear three short beepsafter inserting the batteries and the light of the recorder will begreen.
Light Soundsignal
The descriptionof the status What to do?
1 Green Three shortbeeps afterplacing intherechargeablebatteries
Normal state, thebatteries are wellcharged.
-----
2 Green Two shortbeeps
You are startingthe recordingwith fallen offelectrodes.
Please, connect theappropriateelectrodes on thepatient.
3 Green One long Indicates starting -----

User Manual Full Disclosure ECG Holter System
SW Version: 4.03 (Issued: May. 5, 2006) Labtech Ltd. Page 16 of 84
beep of a recording.After this the lightsignal will stop ina few seconds.
4 ----- Shortinterruptedbeeps
Falling off of anelectrode duringrecording.
Please, put backthe fallen offelectrode.
5 Red Continuousbeep
The batteries inthe recorderhave not beenrechargedproperly or anerror was foundduring the self-test.
Please, exchangethe flat batteries tocharged ones. If therecordercontinuously beepswith well-chargedbatteries as well,then there is an errorin the recorder. Inthis case, please,contact the service.
The IR transmitter is localised on the front panel behind the redheart symbol, which makes possible the wireless monitoring of thepatent’s ECG signal. The reading of the recording is achieved via the same transmitter. In case of devices with built-in ABPM theinfrared transmitter is situated behind the infra window.
The recording unit stores the record for an unlimited period of time.The push button both starts the recording and marks a patient-event.
Never use the recorder:
in wet conditions (the recorder is not waterproof) in strong heat in explosive surroundings in strong electrostatic field

User Manual Full Disclosure ECG Holter System
SW Version: 4.03 (Issued: May. 5, 2006) Labtech Ltd. Page 17 of 84
2.1.2. Connecting the Holter Recorder to the Patient
1. As a first step place the case of the recorder unit on the rightside of the patient and secure it with the belts on theshoulder and the waist. The case can be cleaned, washedbut to avoid possible infections secure it on the outside of theclothing.
2. Then place the single use electrodes on the previouslycarefully cleaned skin of the patient, using the givenarrangement, in a way to avoid disturbing them by the beltsduring movements.
To achieve good and safe connection, to take care ofthe patient’s skin and to avoid infection use only good quality single-use electrodes that are marked with the CEsign.Do not use electrodes with expired warranty or dry orused ones from old, previously opened packagesbecause it will result in bad recording quality.Used electrodes should be treated as potentiallydangerous waste, because of the risk of infections!
White
Red
Green
Black
Yellow
Brown
Blue in the center of the back

User Manual Full Disclosure ECG Holter System
SW Version: 4.03 (Issued: May. 5, 2006) Labtech Ltd. Page 18 of 84
3. Connect the patient cables to the attached electrodes.4. Secure the cables beside the electrodes one by one as
suggested by HOLTER techniques: make a loop on each ofthe cables separately and secure them to the skin byadhesive plaster.
It is a common practice that applying the electrodes carefully andexpertly is a must to make good recordings. Please check that thepatient’s natural abduction or the movements of the belts do not disturb the single use electrodes.
We suggest keeping the following steps: Clean the surface of the skin (with a sponge, alcoholic
gauze) Attach the electrodes using the directions shown on the
package to the places indicated on the front panel of thedevice.
Take care of the colours of the cables. Secure the cables carefully against movements and
lugging.
In case of a recorder with built-in ABPM, fasten the cuff on thepatient’s arm carefully, in a way that the cuff tube stands up. The tube has to be led behind the patient’s neck and has to be arranged in front of the patient’s arms. Pay attention to that the cuff should not be too tight because it can cause numbness. The too loose cuff canslip down or the pump will have to work more to blow the cuff up andthe rechargeable batteries may go flat faster. Place the cuff abovethe elbow, directly on the patient’s arm, not on the clothes. The cuff is washable if necessary, look after its cleanness.

User Manual Full Disclosure ECG Holter System
SW Version: 4.03 (Issued: May. 5, 2006) Labtech Ltd. Page 19 of 84
2.3. The ABP Monitor
2.3.1. LCD Display and Functions of the Start/Stop Button
ABP MonitorState
Button Pressed Hold ButtonDown
Off
1. 3 Beeps2. Number of stored
readings displayed3. Time flashes
---
Time Flashing(normal mode and
unit is ready foran action)
1. Unit goes into “Study Mode”
2. And takes a reading
At 5 beepsunit turns off
Study Mode 1. Unit takes a reading At 5 beepsunit turns off
While unit is takinga reading
1. Unit aborts reading(displays abort codeE86)
2. Cuff deflates3. Unit goes back to
Study Mode
---
Systolic/Diastolic Display
START/STOP Button

User Manual Full Disclosure ECG Holter System
SW Version: 4.03 (Issued: May. 5, 2006) Labtech Ltd. Page 20 of 84
To abort a reading in progress press the START/STOP button andcuff will automatically deflate.
LCD Display:
SYSDIA
12:34168
mmHg
SYS135
mmHg
DIA88
mmHg72
♥ / minE86
2.3.2. Connecting the ABP Monitor to the Patient
Step 1:
Please remember that using the wrong size cuff may givefalse readings.
Step 2:
It is important to select the cuff size that isappropriate to the diameter of the patient’s upper arm.The cuff may be worn over a thin shirt, withoutcompromising accuracy or performance.However, it is recommended that the cuff besecured using the cuff anchor.Ensure the air hose from the monitor to the cuffis not compressed, crimped or damaged.
With the patient cable draped over the patient’s shoulder, attach an adhesive cuff anchor to thesnap on the hose of the cuff bladder as inFigure 1 and 2. Do not remove the adhesivebacking of the cuff anchor at this time.Before you proceed to Step 3, you shouldupload the patient’s data to the ABP monitor. Once all the data is uploaded you may return tothis page and complete Step 3.
Figure 2.
Figure 1.

User Manual Full Disclosure ECG Holter System
SW Version: 4.03 (Issued: May. 5, 2006) Labtech Ltd. Page 21 of 84
Step 3:
2.4. Starting a Holter Recording
The recording can be started in two ways, from the computer or fromthe button on the recorder. When starting the recording from thecomputer, it is possible to check the ECG signal and the bloodpressure before the start. The other way –using the button on therecorder - can be useful when the patient cannot go to a computer,e.g. in case of a bed-ridden patient.In both cases the patient’s data and the parameters related to the recording are saved in the recorder, so before starting the recording,please, check the settings of the recorder according to the following:
Save the patient’s data in the database if they have not been registered yet
In case of blood pressure monitoring check, or if necessary,modify the settings referring to the frequency of taking theblood pressure (the Day-Time interval in theSettings/Parameters/Miscellaneous Settings menu.)
The Holter program automatically identifies the type of the recorder(one, two or three channel or three channel with built-in ABPM)when starting the recording and when reading in the recording, so itdoes not have to be set separately.
Insert the ABP monitor into its pouch with theLCD showing through the window.Attach the pouch to either the shoulder strapor the belt, (as shown in Fig. 3) depending onthe patient’s preference. Finally, with thepatient’s arm resting at their side attach the cuff anchor to the top of the patient’s arm by removing the adhesive backing. This will keepthe cuff in place during the study (Refer toFig. 1).Figure 3.

User Manual Full Disclosure ECG Holter System
SW Version: 4.03 (Issued: May. 5, 2006) Labtech Ltd. Page 22 of 84
2.4.1. Starting the Recording from the Computer (Typical Usagewith ECG Monitoring)
Choose the patient from the database you are intending tomake the record of by selecting Patients from the Databasemenu.
After that click on New Record button, and the monitoring ofthe ECG signal will start.
Place the infra window of the recorder facing the window ofthe USB INFRA interface unit. There must be a chargedbattery in the recorder.
Place the appropriate electrodes on the patient, or in case ofa recorder with built-in ABPM also put the cuff on thepatient’s arm.
Check the quality of the ECG signal, and in case of acombined (3CH ECG + built-in ABPM) recorder check theblood pressure, too. If you find both acceptable, start themonitoring by clicking on the YES, START Recording buttonindicated on the screen.
The program measures the amplitude of the ECG signals ofeach channel. In case this measured value is below 0,5 mV, theprogram indicates it with a flashing red question mark. If the signal islow, place the appropriate electrodes a little further from each other.
At the beginning of monitoring the patient’s data and the parameters of the recording will be saved in the recorder. The start of themonitoring is marked by a long beep and the computer alsoindicates with a message that the recording is started. Afterwardsthe monitoring will automatically end on the computer screen.

User Manual Full Disclosure ECG Holter System
SW Version: 4.03 (Issued: May. 5, 2006) Labtech Ltd. Page 23 of 84
Here you have the option to turn on or off ECG or blood pressuremeasurements. This is useful if you want to use a 3CH ABPM holterdevice as a standalone BP monitor or as a standard holter device.You may even turn off the third ECG channel if you want to make atwo-channel record with a 3CH recorder.
2.4.2. Starting by the Push Button on the Recorder (SpecialUsage without Computer and ECG Monitoring)
Use this starting method only in situations when the patient is unableto go to the computer.
Choose the patient from the database of whom you areintending to make the record by selecting Patients from theDatabase menu.
Place the infra window of the recorder facing the window ofthe USB INFRA interface unit. There must be a chargedbattery in the recorder.
Click on the New Record button, and ECG monitoring willstart. At the beginning of the process the patient’s data and the recording parameters will be saved in the recorder. The

User Manual Full Disclosure ECG Holter System
SW Version: 4.03 (Issued: May. 5, 2006) Labtech Ltd. Page 24 of 84
monitor program will show a Lead Off Error, because therecording unit is not connected to the patient, but this errorsignal will cause no problem.
Connect the recording unit as it was written in the previoussection.
Push the pushbutton until a long beep signal is heard(approximately 2 sec.) and the recording will start.
The recording unit receives the patient’s data together with the date and time shown by the computer. When started by the push button,the recorder unit stores the actual starting time if the batteries werenot removed from the device in the meantime. If they were removed,the recorder saves the time sent by the computer at the start ofmonitoring as the beginning of the recording. So in this case thetime the recording started will not be accurate.
2.5. Starting an ABP RecordingConnect the ABP monitor to the computer using the USB-to-Serialcable. Choose the patient and start a new recording as described inthe previous chapter. When you click YES, START Recording thepatient’s data wil be uploaded to the ABP monitor. After you have started a new recording disconnect the device from the computerand connect it to the cuff previously attached to the patient.
2.6. Scanning a Holter Recording
The recording stops after 24 hours or when the batteries go flat orare removed from the device. It is advisable to remove the batteriesfirst and then the cables from the electrodes. Otherwise the end ofthe recording can not be analysed because of the cables lead off.
Before reading a new recording remove the used batteriesand replace them with charged ones.
Place the recorder facing the USB INFRA unit connected tothe computer in a distance not more than 10-50 cm.
Choose the Scan menu to start reading.
If the communication between the recorder and the USB INFRAinterface is working properly, you should see the following windowduring scanning:

User Manual Full Disclosure ECG Holter System
SW Version: 4.03 (Issued: May. 5, 2006) Labtech Ltd. Page 25 of 84
The recording will be stored in the database automatically.A recording can be scanned more than once. The result data remainin the recorder until a new recording is started. After scanning thedata the analysis may begin.
2.7. Scanning an ABP RecordingThe recording stops after 250 measurings or when the batteries goflat. Note that you can safely change the batteries at any time, therecording will continue until you start a new recording.
Before reading a new record remove the used batteries andreplace them with charged ones.
Connect the ABP monitor to the computer. Choose the Scan menu to start reading.
3. Overview of the Analysis and the Display Program
The HOLTER program runs on Windows operating systems, theapplication does not require special computer skills. The programsin the sequence of new versions (reason: new features added, orfixed bugs) will provide compatibility with the previous databasesand will have ascending version numbers.
3.1. Database Menu - Database Operation
The database manager of the analysis program makes it possible toregister patients and find patient records.

User Manual Full Disclosure ECG Holter System
SW Version: 4.03 (Issued: May. 5, 2006) Labtech Ltd. Page 26 of 84
Warning: Records evaluated with this version of thesoftware are NOT compatible with earlier software versions.This means that an earlier software (ex. v4.00) will NOT be ableto load records that have been evaluated with this version.Therefore it is necessary to update the software on all clientcomputers if you use a shared database.
When installing the Holterprogram a DATA directory iscreated in the directory of theprogram in which a database iscreated containing a fewsample patients and records.The database itself consists ofa database file that containsthe patients’ data and of the files containing the records ofthe individual patients.

User Manual Full Disclosure ECG Holter System
SW Version: 4.03 (Issued: May. 5, 2006) Labtech Ltd. Page 27 of 84
3.1.1. PatientsIn this menu it is possible to register a new patient and make newrecords or load previous records of already registered patients.
New Patient registration:Click the New Patient button on the Patients window.

User Manual Full Disclosure ECG Holter System
SW Version: 4.03 (Issued: May. 5, 2006) Labtech Ltd. Page 28 of 84
The patient’s first name and surname, the date of birth and the Patient ID fields must be filled in. The program allows to enter onlyunique Patient IDs within a database, so it is recommended to usethe social security number of the patient (or any other ID that thepatient can be uniquely identified by) for the Patient ID field.
Please note that the Patient ID can not be modified, so pleasepay special attention when filling in this field.Information on pacemaker (whether the patient has one and if so,what type) can be given in the Pacemaker Identification Mode field.The importance of this parameter is that you can choose pacemakeranalysis if you wish. Filling in this parameter does not influence therecording, so it can be modified after recording, as well, but it has noimpact on existing records. Information about height, weight and sexis not necessary to specify when registering a new patient.
Searching for Patients:If you fill in the First name and/or Surname fields, the Patients listwill contain only those patients whose names start with the lettersyou typed.
Patient Data Modification:To modify the data click on the Modify button. All data can bemodified, except for the Patient ID.
Deleting a Patient from the Database:To delete a patient click on the Delete Patient button. When deletingthe selected Patient, all related records will be erased, as well.Restore is not possible.
Making a New Record:First register the patient in the database. If the patient is alreadyregistered, click on the appropriate name. After that, click on NewRecord button to start the recording. See section 2.3 for adescription how to start the recording.
Loading Records from the Database:In the Patients field click on the patient’s name, and the patient’s records will appear in the lower field of the screen. Click on theappropriate record and then click on Load Record to load the record.

User Manual Full Disclosure ECG Holter System
SW Version: 4.03 (Issued: May. 5, 2006) Labtech Ltd. Page 29 of 84
Deleting a Record:Select the record to be deleted with the mouse and click on theDelete Record button; the selected record will be deleted.Afterwards it is not possibile to restore this record.
Sorting Patients:In the patient list there is an option to sort the patients by first name,by surname or by Patient ID. Please choose one of the three radiobuttons or click on the appropriate column’s header.
Filtering Records:You have the possibility to filter records. You can choose from thefollowing options: Temporary, Pre-Evaluated, Evaluated, and NoRecord Yet.In addition you can set a filter on one, two, or three channel recordsand records with PM or ABPM. You can filter records based oncreation date, too: you can set whether you want to see only recordscreated today, this week, or this month.
The Patients list contains only the names of those patients who havea record satisfying one of the filter conditions. The Patient’s Records list shows only the appropriate records of the patients currentlyvisible.
By clicking the Default button you can restore the default settings ofthe filter conditions (to see all patients and all kinds of records).
Interpretation of record status types: Temporary (T): It is a kind of record that has not been
analysed automatically after scanning. If later you load sucha record, the program will automatically analyse and save it,i.e. it becomes Pre-Evaluated. (See Chapter 3.7.1 on how toturn on/off automatic analysis after scanning)
Pre-Evaluated (P): It is a type of record that has beenautomatically analysed by the program and on which nochanges have been made afterwards. (See Chapter 3.7.1 onhow to turn on/off automatic analysis after scanning)

User Manual Full Disclosure ECG Holter System
SW Version: 4.03 (Issued: May. 5, 2006) Labtech Ltd. Page 30 of 84
Evaluated (E): It is a type of record that has beenautomatically analysed by the program, interpreted (i.e.changes have been made by an expert) and saved.
3.1.2. Save Current RecordThe current status can be saved in this menu. During theinterpretation of the recording the current status can be saved anytime, for example in case of a current failure the work invested in theinterpretation will not be lost if you click on this menu item from timeto time.
3.1.3. Select Database LocationThe database of the Holter program can be saved in any directory. Itis possible to control more than one database and choose betweenthem. These databases are independent, so a patient registered inone database cannot be seen in the other one. The program alwaysoperates on the last chosen database.The database may be stored on a network drive as well, so you canload and analyse the stored records on several computers. You canscan a recording from a recorder only on the client computer that theUSB INFRA interface is connected to.In case the user intends to copy a record from one database toanother, first the record must be loaded and then the database canbe changed by selecting the Select Database Location menu item.The record will be saved in the new database if you select SaveCurrent Record from the Database menu.
3.1.4. Recorder StatusIn this menu you can have a look at which recorder has beenhanded out to which patient and when. So you can easily keep trackof which patient has got which recorder.
3.1.5. Export Record…You can save the currently loaded record to a directory of yourchoice. This directory can be on a network drive or on a removablestorage medium as well (for example on a pendrive). And of courseyou can write your exported records on a CD or DVD and laterimport them for example on another computer.

User Manual Full Disclosure ECG Holter System
SW Version: 4.03 (Issued: May. 5, 2006) Labtech Ltd. Page 31 of 84
The exported record’s filename will contain the first name, surname of the patient, and the patient’s ID separated by underscores, for example:
Firstname_Surname_ID123456789_DATE20050128.hdf
3.1.6. Import Record…You can load a previously saved(exported) record from a directoryof your choice (for example from a network directory, a CD/DVD, apendrive, etc.). The newly imported record is automatically saved inthe currently selected database.
3.1.7. Archivation on CD or DVDHere you can create an archive of the database you are using (i.e.the database you have selected in the Select Database Locationmenu, see Chapter 3.1.3). It is advisable to use this function forexample if you have run out of space on your hard drive.
Choose the size of the archive. The archive will store asmany records as there is available space for on the chosenmedium. The available sizes are: 650MB, 700MB (CD),4.7GB (DVD) and custom size. Custom size may be adjustedfrom 650MB up till 9000MB (DVD-DL Double Layer).
Press the Archivate button. The archive will be createdwithin the database directory and it will be filled starting withthe oldest record.
When the archivation is finished you will be prompted with amessage box to write the archive on a CD/DVD. Now youhave to use an external program to write the archive on a

User Manual Full Disclosure ECG Holter System
SW Version: 4.03 (Issued: May. 5, 2006) Labtech Ltd. Page 32 of 84
CD/DVD. You may temporarily exit the Holter program at thistime. Please label the CD/DVD with the same number as theHolter program displayed.
When you are finished with writing the archive on a CD/DVDplease choose Database/Archivation on CD or DVD and thedrive in which you have inserted the archive medium fromthe Archive drive combobox. (For example if you havewritten the archive to a CD, and your CD drive letter is D:\then choose drive D:\ from the list.)
Press the Validate button. This button is enabled only afterthe archivation process has finished. The validation processwill compare the archived database with the archive youhave written on CD/DVD. If the data of the two archivesmatch the space occupied by the archive on the hard drivewill be freed.
Attention: Archivation is an irreversible process. Once youarchivate a database, the data will be physically moved to thearchive, so they will be accessible only from the archivemedium. The location of records that were moved to the archivewill be indicated as CD/DVD #xxx (where xxx is a number) in thePatient window. If you try to load such a record, the programwill ask for the appropriate CD/DVD.
Of course an archive CD/DVD may be used as a standalonedatabase, as well.
3.1.8. Select V3.xx Database LocationBy selecting this menu item you can use a database directory thatcontains records recorded with an earlier (before 4.00) version of theHolter program.
3.1.9. ExitHere you can exit the Holter program. If you have made changes onthe loaded record, the program asks you before exiting whether youwant to save the changes.

User Manual Full Disclosure ECG Holter System
SW Version: 4.03 (Issued: May. 5, 2006) Labtech Ltd. Page 33 of 84
3.2. Scan - Scanning a Record from the RecorderIf there has been recording done previously with the recorder,please remove the rechargeable batteries before scanning therecording; exchange them to charged ones and place the recorder infront of the USB INFRA interface unit, so that they overlook eachother. After this click on Scan menu, and the program will read thepatient’s data from the recorder.
If the patient has not been registered in the database yet (therecorder has been issued somewhere else), the program displaysthe patient’s data found in the recorder and asks whether the new patient is to be registered in the database. If so, click on OK, and thereading process will start. If the patient is already registered in thedatabase and the recording has not been read yet, then the programwill read it in without any command automatically. If you wish to readin the same record more than once, the program asks every timewhether you wish to overwrite the already existing recording. Duringreading, the program indicates the percentage of the record beingread with a blue progress bar. If something hinders the connectionbetween the USB INFRA interface unit and the recorder, theprogram indicates it with an error message: COMMUNICATIONERROR.

User Manual Full Disclosure ECG Holter System
SW Version: 4.03 (Issued: May. 5, 2006) Labtech Ltd. Page 34 of 84
If such an error occurs, (the recorder has been turned away), butlater is resolved, the program can continue reading the record, thereis no need to stop the reading process and restart. The readingprocess of one 24-hour record takes 100-120 seconds.

User Manual Full Disclosure ECG Holter System
SW Version: 4.03 (Issued: May. 5, 2006) Labtech Ltd. Page 35 of 84
3.3. View
In the View menu there are more possibilities to view the recordedECG signals and their parameters. These possibilities are listed inthe order of their appearance on the screen, as follows:
You can change the current screensurface basically in the View menu. Thismenu is divided into four parts.You can select different surfaces for theupper part of the screen in the firstgroup, in the second group for the lowerpart of the screen, in the third group forthe whole screen. In the fourth groupyou can display the BP table.

User Manual Full Disclosure ECG Holter System
SW Version: 4.03 (Issued: May. 5, 2006) Labtech Ltd. Page 36 of 84
3.3.1. Graphs - HR, ST, QT Graphs
The program displays the following time-graphs: HR, QT, ST level,ST slope and in case of devices combined with ABPM the BPburden, as well. The temporal distribution of the qualified eventswhich were selected in the Events menu, can be displayed on theheart-rate-graph, and in case of a recorder with ABPM, the ABPMresults, too. The vertical lines placed at the bottom of the panel markthe time of occurrence of the single events.The graphs are colour-coded; they mark with enhanced colour(using an appropriate colour setting) the sections presumed ill. Sofor example you can adjust the ST level elevation and depressionlimits (Ischaemic Burden elevation/depression) in Settings menu /Parameters / ST Settings, and you can see the elevated anddepressed regions in a different colour.
By clicking on the downwards-looking triangles on the left sideof the individual graphs, you can obtain useful information aboutthe graphs.By using the symbols on the left side of the screen it is possibleto enlarge the graphs and display related information .
The program calculates the heart rate according to two differentmethods. It calculates the average value of the heart rate in the 10seconds neighbourhood of the ruler, which is displayed on the HRgraph.
In the lower right corner of the screen you can choose to displayeither the actual HR value on the HR graph, or the average HRvalue of the heartbeats shown in the ECG on the screen.

User Manual Full Disclosure ECG Holter System
SW Version: 4.03 (Issued: May. 5, 2006) Labtech Ltd. Page 37 of 84
The ST and QT analysis and evaluation are based in each case onnormal and Right Bundle Branch Block heartbeats. The displayedvalues are the average of the heartbeats found in the 10 secondsneighbourhood of the ruler.In case there are no normal or Right Bundle Branch Blockheartbeats detected e.g. because of VE Tachycardia, left-bundlebranch block or a pacemaker, then there is no ST evaluation anddisplay.The ST levels are calculated in the J+ point (see Settings /Parameters / ST Settings menu).Zooming on the time-panel of the HR, ST, QT graphs can be donewith the button having double arrows on the toolbar or with theright mouse button. The type of the chosen event, its number andthe time at the ruler’s position can be seen on the left side of the toolbar. If an event other than Full Disclosure is selected in theEvents menu, then you can place the time-ruler only to a sectionwhere an event can be seen. You can overview the events bypacing (the left and right arrow on the toolbar) or bycontinuous playback (double arrow ). The individual events canbe selected for printing by clicking on the print-icon .

User Manual Full Disclosure ECG Holter System
SW Version: 4.03 (Issued: May. 5, 2006) Labtech Ltd. Page 38 of 84
3.3.2. Templates–The Base of the Evaluation
The first and most important step of the evaluation of anECG Holter record is the interpretation, renaming andcorrection of the templates. Please, always start the evaluationwith this step.
The evaluation program automatically collects and classifies theheartbeats occurring in the record. The number of classified similarheartbeats can be seen in the upper part of the screen. Thecorrectness of the evaluation within a template can be checked withthe help of the scroll-bar. The QRS chosen from the upper windowappears in the lower window with its environment.The modification of a classified group can be done if you highlight itwith the left button of the mouse. All the forms offered by theevaluation program must be checked. This is mostly important whenthere are too many QRS beats in a template.Selecting single forms by clicking with the left button of the mouse,the program lists the possible classification of heart-beat-types in apopup menu. This menu will always appear to the right of the mouseand the highlighted template will always be centered. If you do notmake any modifications, it is still advisable to confirm the template

User Manual Full Disclosure ECG Holter System
SW Version: 4.03 (Issued: May. 5, 2006) Labtech Ltd. Page 39 of 84
type, so that a checkmark appears symbolising that this templatehas already been checked.For an easier overview the program provides the possibility todisplay only the forms belonging to the templates chosen in the SortTemplates by drop-down window.Each group can be classified into the displayed beat-types. Theprogram classifies beats as supraventricular if they satisfy certainrhythm-requirements. However, it is possible to rename thesupraventricular beats to normal ones (or to any other type).
If you choose the Delete template option, the beats contained bythe template will be deleted and removed from further analysis.Please note that if you use this function on a template containingsome normal beats, some unwanted pauses may occur.
You have the choice to display either the number of beats in atemplate or the percentage of beats contained by a templatecompared to the number of all classified beats, if you click theNumber(Percent) button.
Important: Check each class carefully and either accept theoriginal classification or rename it to the appropriate class if itis wrong. To choose and rename the templates quickly, click ona template with the left button of the mouse. The red tick in thelittle square indicates the fulfilment of the evaluation. Repeated,frequent renaming is always possible. After changing to adifferent menu the analysis runs according to your lastclassification. The evaluation might result in merging of certainclasses.
3.3.2.1. Merging Similar TemplatesIt is possible to merge identical forms manually by the well-knowndrag-and-drop technique of Windows. In this case it means that afterselecting a template by clicking on it with the left mouse button, youcan drag it while keeping the mouse button pressed onto thetemplate you intend to merge it with then you can release the button.The program permits merging only really identical forms. E.g. N withN, V with V etc. It is advisable to display only one template type byselecting from the Sort Templates by drop-down window beforemerging templates.

User Manual Full Disclosure ECG Holter System
SW Version: 4.03 (Issued: May. 5, 2006) Labtech Ltd. Page 40 of 84
3.3.2.2. Fast PlaybackFast playback is a quick way to check all the forms within atemplate.Fast playback of the forms is possible by clicking the double arrowbutton (Play). You can adjust the playback speed (QRS/sec)and the vanishing factor (msec) with two sliders.

User Manual Full Disclosure ECG Holter System
SW Version: 4.03 (Issued: May. 5, 2006) Labtech Ltd. Page 41 of 84
3.3.3. Events View–Summarized EventsHaving chosen the Events View menu item you can study thesummarized event evaluation of the whole record on the screen.The event types are in the column on the left, their occurrences areshown in the column in the middle and the total number of events isdisplayed in the column on the right. With the help of the left buttonof the mouse it is possible to select any event type. In this case thebackground colour of the chosen row will change and the size of thisrow will enlarge.
Using the left and right arrows on the toolbar or on thekeyboard or clicking on the play button the user can overviewthe events belonging to the chosen row. By clicking on the redbutton (Delete Event), it is possible to delete any individual event.You can delete a whole group of events by clicking the purplebutton (Delete Event Group).
You can delete (or even insert) certain events here using the mouse,too. For example:
Select the AF event row by clicking on it with the left button

User Manual Full Disclosure ECG Holter System
SW Version: 4.03 (Issued: May. 5, 2006) Labtech Ltd. Page 42 of 84
If you want to delete a segment, click on a non-AF block anddrag the mouse while pressing the left button until thedesired block is deleted.
If you want to insert a segment, click on an AF block anddrag the mouse while pressing the left button until thedesired block is inserted, i.e. marked as AF.
See Chapter 3.3.4.1 on how to edit AF periods in Full View.
In the case of events other than AF you can only delete a segmentusing the above mentioned method.This display mode provides a good opportunity to overview thewhole examination. The correct classification has to be made in theTemplates menu first, in this menu only justifications are to be made(e.g. deletion of events falsely classified into a specific class).Abbreviations:
Abbreviation MeaningVE Ventricular Ectopic Beat - VVCPL Ventricular CoupletVBIG Ventricular BigeminyVTCH Ventricular TachycardiaVRUN Ventricular RunSVE Supraventricular Premature Beat - SSVCPL Supraventricular CoupletSVTCH Paroxysmal Supraventricular TachycardiaSVRUN Supraventricular RunAF Atrial FibrillationTCH TachycardiaBRD BradycardiaFTS Failure To SenseFTC Failure To CaptureaPMI Atrial Pacemaker InducevPMI Ventricular Pacemaker InducedPMI Dual Pacemaker InduceHR min/max Heart Rate minimum/maximum

User Manual Full Disclosure ECG Holter System
SW Version: 4.03 (Issued: May. 5, 2006) Labtech Ltd. Page 43 of 84
3.3.3.1. Setting of the Events View Parameters
3.3.4. Full View –Overview of the ECG Signals
In this menu it is possible to view longer ECG periods. The windowalways shows as many channels as have been preset in the ECGRecord window. In one line –depending on the degree of thecompression – a half or one minute long ECG strip can bedisplayed. The ECG strip you select in the upper window with theleft mouse button can be seen in the lower window. The displayedinformation can be printed instantly by clicking on the print icon .Printing of 24-hour ECG is also available here.If you click in the upper area with the right mouse button, the ECGstrips will be enlarged. If you click on a beat in the lower area withthe right mouse button, you can classify the beat into another type.
By clicking on the Settings buttonon the left side of the toolbar you candisplay the checkboxes beside theindividual event types. If you unchecka checkbox the appropriate event’s row will not be visible after you close
the settings with . If you want tochange the order of event types, youcan move a certain event row up ordown by clicking the up and downarrows next to the checkboxes.

User Manual Full Disclosure ECG Holter System
SW Version: 4.03 (Issued: May. 5, 2006) Labtech Ltd. Page 44 of 84
3.3.4.1. Editing of Atrial FibrillationIt is advisable to turn on only one channel (one of good quality)before editing atrial fibrillation periods in order to be able to see alonger strip of ECG on the screen. (See Chapter 3.3.5 on how toturn on/off a channel)
You need to select Full View from the View menu and either FullDisclosure or Rhythm/Atrial Fibrillation from the Events menu. Theprogram indicates the AF periods with a different colour.
It is possible to edit atrial fibrillation periods (AF) in two ways:
Editing a whole page of AF using the keyboard:Use the PageDown and PageUp keys on the keyboard tomove forward or backward in the ECG record. You can usethe Delete key to delete the whole AF block that is currentlyvisible on the screen. You can mark the currently visible ECGstrip as AF by pressing the Insert key.
Editing smaller periods of AF with the mouse:It is possible to mark new AF periods or you can deleteexisting ones by moving the mouse and continuously

User Manual Full Disclosure ECG Holter System
SW Version: 4.03 (Issued: May. 5, 2006) Labtech Ltd. Page 45 of 84
pushing the left mouse button (according to the method usedin Windows to select a text).
The changes you make on AF periods are immediately visible as apercentage of the whole evaluated strip on the left side of the toolbar(ex. AF: 99.57%).
3.3.5. ECG Record–Overview and Measurement of the ECGCurves
In this menu the ECG channels can be displayed in the lower part ofthe screen.The number of the displayed ECG channels can be set, just liketheir speed and amplitude resolution.

User Manual Full Disclosure ECG Holter System
SW Version: 4.03 (Issued: May. 5, 2006) Labtech Ltd. Page 46 of 84
3.3.5.1. Using of the ECG Rulers–Measuring
The time and amplitude measurement is available on this screen. Ifyou push the left mouse button while moving the mouse, the timedifference between the point of clicking and the current position ofthe ruler is shown and the heart rate calculated from this period, aswell.
In case of amplitude measurement, the program produces andcalculates the difference of the ECG signals that have been
You can set the amplitude of the ECG channels to 5,10 and 20 mm/mV and the speed to 12.5, 25 and 50mm/s.You can turn on/off a channel by clicking theappropriate checkbox.
Click the button above the numerical value of HR tochange the method of heart rate calculation. The usercan have either the actual or the average valuedisplayed. The actual value shows the average HRvalue of the ECG strip currently seen on the screen.The average HR corresponds to the related value inthe HR graph.In case you intend to check the HR minimum ormaximum the displayed number shows the relatedvalue in the HR graph and it can not be changed bypushing the button.

User Manual Full Disclosure ECG Holter System
SW Version: 4.03 (Issued: May. 5, 2006) Labtech Ltd. Page 47 of 84
intersected by the two rulers. If you wish to modify the type of aheartbeat, mark it with the right button of the mouse and choose thenew type from the suggested list.
3.3.6. BP Statistics–Displaying the Blood Pressure MonitoringStatistics
The BP statistics can be displayed in the lower part of the screen.
The program prepares nine graphs interpreted on the basis of “day” (awake), “night” (sleep) and the total monitoring time. In the right part of the screen the minimum, maximum and average values ofthe systolic, diastolic and medium arterial pressure and the StandardDeviation of these values are displayed in a table form divided intothe times of the day mentioned above.
The abbreviations used here are listed below with their meanings:
MAP = Medium Arterial PressurePP = Pulse PressureStD = Standard Deviation

User Manual Full Disclosure ECG Holter System
SW Version: 4.03 (Issued: May. 5, 2006) Labtech Ltd. Page 48 of 84
Hyperbaric Impact = The area of the BP burden graph above thenormal value. It shows how long and how much the patient’s blood pressure is higher than normal on an average of 24 hours.
Diurnal index = the difference between the measured day-time andnight-time average values compared to the day-time average givenin percentage.In case of weighted values the certain BP values are consideredwith the time intervals represented by them. The weightinginfluences the following calculated values: distribution graphs,average values in the tables, MAP, StD, BP above the normal area,hyperbaric index and diurnal index parameters.
3.3.7. Medians–View of the ECG medians
The medians, calculated from normal QRSs, are displayed in thelower third of the screen–with the significant ECG points marked onthem.

User Manual Full Disclosure ECG Holter System
SW Version: 4.03 (Issued: May. 5, 2006) Labtech Ltd. Page 49 of 84
3.3.8. ServiceThis menu represents the technical details of the monitoring.
It displays the normal and defective state (lead-off) of the electrodesduring recording and the battery status, as well.Here you can see which version of the program has the loadedrecord last been analysed with and with what recorder version it hasbeen recorded.
3.3.9. HRV Time Histograms and TablesYou can get detailed information on some temporal parameters ofthe RR variability.

User Manual Full Disclosure ECG Holter System
SW Version: 4.03 (Issued: May. 5, 2006) Labtech Ltd. Page 50 of 84
Besides the SDNN, calculated for a five-minute period of time, theheart rate is also displayed here.
Beneath there are the SDNN, rmsSD and the PNN50% valuescalculated for 1-hour periods. The interpretation of the parameters isdone as written in Chapter 5. More detailed description about theHRV can be found in the Guidelines directory of the installation CD.
3.3.10. HRV Time Domain DistributionsYou can take a look at the three graphs interpreted on the basis ofthe total monitoring time and some important parameters in thismenu. For further description see Chapter 5. There is a so-callednormal value assigned to the SDNN, SDANN and rMSSDparameters. The numerical value of the parameter which is differentfrom the above, is represented with a red background. Besides thegraphical display, the results are available also in table-form.
The normal values of the parameters can be found in Chapter 5.

User Manual Full Disclosure ECG Holter System
SW Version: 4.03 (Issued: May. 5, 2006) Labtech Ltd. Page 51 of 84
3.3.11. HRV, Frequency DomainThree graphs can be seen when displaying the frequency domain:the awake and the sleep periods, and the total monitoring time inhourly disintegration of the performance-density spectrums.
The domain of the awake part can be set in the Settings /Parameters / Miscellaneous Settings menu.

User Manual Full Disclosure ECG Holter System
SW Version: 4.03 (Issued: May. 5, 2006) Labtech Ltd. Page 52 of 84
3.3.12. QT SummaryYou will receive two types of results of the QT analysis: table anddistribution-type evaluations.You can choose by clicking a switch-button whether you wish theQT or the QTc to be displayed. Both are included in the table.
3.3.13. Pacemaker SummaryHere you can view a table summary on the pacemaker analysis. Thenumber of the beats induced by the PM is presented in the table ingroups based on the type of the induction and in hourly resolution.The table shows the failure of electric capture and failure to senseevents detected by the program, as well.The failure to capture (abbreviation FTC) means that the pacemakerspike appears in the right time, but it is not followed by QRS. Thefailure to sense (abbreviation FTS) refers to too early pacemakerstimulation, in this case the pacemaker discharges, independent ofthe stimulus production of the patient.

User Manual Full Disclosure ECG Holter System
SW Version: 4.03 (Issued: May. 5, 2006) Labtech Ltd. Page 53 of 84
3.3.14. Pacemaker HistogramsThis menu displays eight graphs according to the followings:

User Manual Full Disclosure ECG Holter System
SW Version: 4.03 (Issued: May. 5, 2006) Labtech Ltd. Page 54 of 84
a-PMI The time distribution between the stimulation of theatrium and the heart beat (induced by the heart on thisstimulation).
v-PMI The time distribution between the stimulation of theventricle and the heart beat (induced by the heart onthis stimulation).
d-PMI The time distribution between the stimulation of theatrium and the ventricle and the heart beat (induced bythe heart on this stimulation).
N-PMI The distribution graph of the normal and PM inducedbeats.
V-PMI The distribution graph of the ventricular and PMinduced beats.
PMI-N The distribution graph of the PM induced and normalbeats.
PMI-V The distribution graph of the PM induced andventricular beats.
PMI-PMI The distribution graph of consecutive PM inducedbeats.

User Manual Full Disclosure ECG Holter System
SW Version: 4.03 (Issued: May. 5, 2006) Labtech Ltd. Page 55 of 84
3.3.15. SummaryThis menu displays the most important statements, the automaticsummary about the monitoring.
It contains the patient data, the text of the evaluation, summarizedtable evaluation.3.3.16. Blood Pressure Table

User Manual Full Disclosure ECG Holter System
SW Version: 4.03 (Issued: May. 5, 2006) Labtech Ltd. Page 56 of 84
This menu is to be used in case of products with the built in ABPM.It displays the results of the blood pressure monitoring in time order.The single results can be validated in the Valid column (tick) orinvalidated (empty square).
3.4. EventsThe program sorts the already classified events into groups. In casethe HR, ST, QT graphs are selected in the upper part of the screen,the program indicates with small lines the time of occurrence of thegroup which is currently selected.The ECG strip belonging to the marked event can be displayed inthe lower window of the screen so that its beginning is placed in themiddle of the screen. The overview of the events is available byusing the Move left / Move right or the Play button.The event currently displayed can be deleted by clicking on the red
button (Delete Event). A whole group of events can be deletedby clicking on the purple button (Delete Event Group).
The RonT item is under construction.

User Manual Full Disclosure ECG Holter System
SW Version: 4.03 (Issued: May. 5, 2006) Labtech Ltd. Page 57 of 84
3.5. ReportWhen choosing this menu, a movable text-field appears, where theremarks can be edited. The patient data and the automatic reportprepared by the program will be copied into this window by clickingon the Import Automatic Report button.
You can display a window arbitrarily chosen from the View menu,while the Report text-window is still seen. It is useful, because youcan see your remarks and the necessary information at the sametime. The text written into this window will be printed on a separatepage.
3.6. PrintIn this menu it is possible to overview and selectively print thesheets prepared by the program. Printing is possible in black-and-white or in colour mode, too.

User Manual Full Disclosure ECG Holter System
SW Version: 4.03 (Issued: May. 5, 2006) Labtech Ltd. Page 58 of 84
You can select local and network printers by clicking on the Setup…button. The program will remember your last selection.If you fill in the name of the Hospital/Institute, Physician, Assistantfields then these data will be printed as well and they will be usedeach time you print a page.You can print multiple copies of the same page and you can previewany page before printing by selecting the appropriate radio button.You can zoom in on the page being previewed by selecting a valuefrom the Zoom list.It is possible to print to files, too. Select the desired format (JPG,BMP) then click Print to file… Select a directory to store the outputfiles. The files will be numbered beginning from 001.

User Manual Full Disclosure ECG Holter System
SW Version: 4.03 (Issued: May. 5, 2006) Labtech Ltd. Page 59 of 84
3.7. Settings
3.7.1. ParametersIn the Settings/Parameters menu it is possible to set theparameters influencing the recording and the evaluation.
Rhythm Analysis:Here you can modify the parameters of the rhythm analysis.
In this menu it is possible to set thevarious parameters of the programsuch as the parameters influencingthe analysis, the colours of thescreen, and the graphs to bedisplayed.
User Manual Full Disclosure ECG Holter System
SW Version: 4.03 (Issued: May. 5, 2006) Labtech Ltd. Page 60 of 84
Parameter Valid range(whole numbers only)
Tachycardia from: 80 - 200 bpm.Paroxysmal Tachycardia increase: 0 - 100%Bradycardia below: 20 - 60 bpm.Pause from: 1200 - 6000 msec.SVBP limit: 5 - 100%RonT below: 100 - 300 msec.PMI below: 50 - 200 msec.Ventricular spike below: 0–(PMI limit-20) msec.
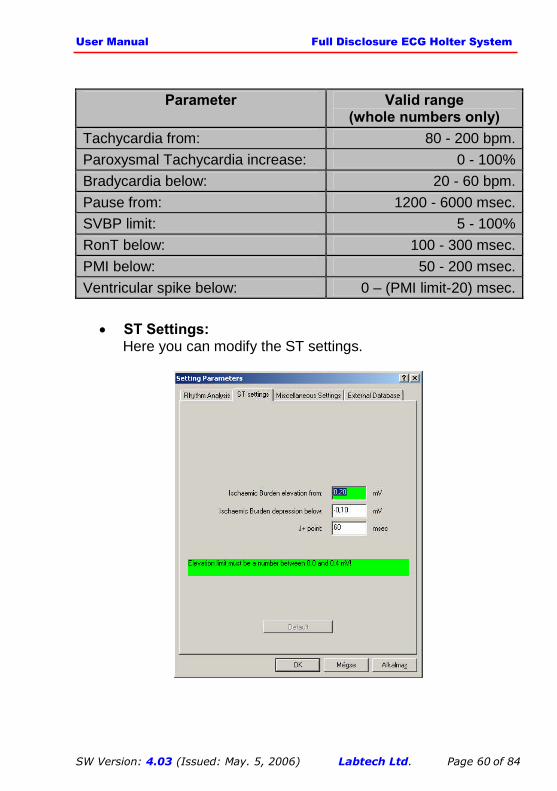
ST Settings:Here you can modify the ST settings.

User Manual Full Disclosure ECG Holter System
SW Version: 4.03 (Issued: May. 5, 2006) Labtech Ltd. Page 61 of 84
Parameter Valid rangeIschaemic burden elevation from: 0.0–0.4 mVIschaemic burden depression below: -0.4–0.0 mVJ+ point: 40–80 msec
Miscellaneous Settings:Here you can adjust the daytime interval, the systolic anddiastolic limits during the day and night. And you have thepossibility to adjust the blood pressure measurementintervals during the day and night.
Parameter Valid range(whole numbers only)
Day Time Begin/End: 0–24 hoursSystole limit: 100–150 mmHgDiastole limit: 60–100 mmHgBP Measurement Interval: 10–240 minutesShort Term BP: 60–180 sec

User Manual Full Disclosure ECG Holter System
SW Version: 4.03 (Issued: May. 5, 2006) Labtech Ltd. Page 62 of 84
Short Term BP measurement:By enabling this option you can adjust BP measurements to a morefrequent interval during the first 15 minutes of the recording.
Automatic analysis after scanning:If this option is turned on, the program will run an automatic analysison every record you scan from the recorder.If this option is turned off, the program will not automatically analysethe record after scanning, the record will be saved with Temporary(T) status. When you first load such a record from the database theanalysis will automatically run and the record will be automaticallysaved as Pre-Evaluated (P).It is useful to turn this option off if you want to quickly scan morerecords at the same time and don’t want to wait for the analysis to run.
Heart Rate Beep:If this option is turned on you can hear a sound whenever thepatient’s heart beats.
Enable short leadoff beep signal:By turning on this option the holter recorders will signal electrodelead-off by only a short beep. This is useful if continuous beepingdisturbes the patient.
External Database:It is possible to connect to an external database system(EDP system) that supports GDT interface.

User Manual Full Disclosure ECG Holter System
SW Version: 4.03 (Issued: May. 5, 2006) Labtech Ltd. Page 63 of 84
GDT Directory:Here you can select the common directory that will be used by boththis software and the external database system.
Holter Abbreviation: The ID of the holter software, max. 4characters.
EDP Abbreviation: The ID of the EDP system, max. 4 characters.
3.7.2. Recorder Filter SettingsIt is possible to on/off the mains filters (50 Hz, 60 Hz) and smoothing(cutoff frequency is 35 Hz) before making a new record.

User Manual Full Disclosure ECG Holter System
SW Version: 4.03 (Issued: May. 5, 2006) Labtech Ltd. Page 64 of 84
3.7.3. ColoursThe colours of the screen can be set in the Settings/Colours menu.
The program includes 5 predefined default colour schemes thatcannot be modified or deleted but you can define a various numberof custom colour schemes which you can save under differentnames if you click the Save As… button. If you click the Deletebutton, the selected colour scheme will be deleted.
3.7.4. Graphs (HR, ST, QT)
The number of the Graphs to be displayed can be chosen (HR, ST,QT) in the Settings/Graphs (HR, ST, QT) menu. You can add andremove graphs and you can change the order of their appearanceon the screen by using the up/down arrows. If you click the Defaultbutton, the default settings will be restored.

User Manual Full Disclosure ECG Holter System
SW Version: 4.03 (Issued: May. 5, 2006) Labtech Ltd. Page 65 of 84
3.7.5. Events ViewThe Settings/Events View menu offers the possibility to change thelist of events displayed when selecting the View / Events Viewmenu. You can add and remove events and you can change theorder of their appearance on the screen by using the up/downarrows. If you click the Default button, the default settings will berestored.
3.7.6. Multilanguage TranslatorThe Settings/Multilanguage Translator menu offers a great helpwhen translating the text of the program to any language. This menucan be used only with the code provided by the manufacturer.To obtain more information about the translator please press Help.

User Manual Full Disclosure ECG Holter System
SW Version: 4.03 (Issued: May. 5, 2006) Labtech Ltd. Page 66 of 84
3.7.7. New AnalysisBy selecting this menu you can run a new analysis on the loadedrecord. For example if you obtained a newer version of the programand you have a record on which you think the old analysis did notyield satisfactory results, you can rerun the analysis and see theimprovement.
3.8. Help
3.8.1. User ManualThe enclosed User Manual is available in different languages. So ifyou change the language of the software, the user manual (help) willbe shown in the appropriate language if you select this menu.Adobe® Reader® needs to be installed on your computer to be ableto display the user manual. This program can be found on theinstallation CD.
3.8.2. LanguageHere you can select the language of the program. You can choosefrom the following languages:English, French, German, Russian, Japanese, Spanish, Portuguese,Chinese, Arabic, Czech, Hungarian, Italian, Polish, Romanian,Slovak, Turkish, Greek and one optional language.

User Manual Full Disclosure ECG Holter System
SW Version: 4.03 (Issued: May. 5, 2006) Labtech Ltd. Page 67 of 84
3.8.3. ValidityThe Validity menu contains the types of recorder units which arevalidated for the Holter System.
If there is no USB INFRA interface connected to the PC, theprogram indicates the USB INTERFACE ERROR message in thismenu. In this case neither starting a new recording, nor the readingof an existing recording is possible.
3.9 Interface Status Control BoxThe program indicates with the colour of a small box in the upperright corner of the screen whether the interfaces are functioningproperly.
If the box has green colour , everything is in order, theconnection and the devices are working properly.
If the upper part of the box is shown in red colour , pleasecheck if the USB INFRA unit has been properly connected to

User Manual Full Disclosure ECG Holter System
SW Version: 4.03 (Issued: May. 5, 2006) Labtech Ltd. Page 68 of 84
the USB port of the computer and whether the softwaredriver of the device has been installed in an appropriate way.
If the lower part of the box is red , please check if the USB-to-Serial cable is properly connected, and if the device hasbeen installed in an appropriate way.
The upper half of the indicator shows the state of USB INFRAinterface, the lower part shows the state of the USB-to-Serialconnector cable.By hovering the mouse over the box you can get detailedinformation about the status of the system.
In rare cases Windows might not recognize the USB INFRAinterface because of its non-standard functioning.Please check the power-supply of the computer. Always use apower-supply that is of good quality and that can supply enoughpower for all the devices in the computer. You might try using anexternal USB hub with external power-supply, too.

User Manual Full Disclosure ECG Holter System
SW Version: 4.03 (Issued: May. 5, 2006) Labtech Ltd. Page 69 of 84
If you should still experience such a problem, please unplug andthen plug in the device to make Windows recognize it again. Or youmay turn your computer off and then back on but this is notrecommended since it takes a considerably longer time.
4. VES and SVES Event Decision CriteriaVE–VentricularEctopic Beat-V
One ventricular beat.
VCPL–VentricularCouplet
Two successive ventricular beats.
VRUN–VentricularRun
Three or more successive ventricular beats.The heart rate is smaller, than theventricular tachycardia limit, set in theSettings / Parameters menu.
VBIG–VentricularBigeminy
A series of alternating subsequentventricular and atrial beats.
VTCH–VentricularTachycardia
Three or more successive ventricular beats.The heart rate is higher or the same as theventricular tachycardia limit, set in theSettings / Parameters menu.
RonT If the ventricular beats get closer to thedominant beat than the "RonT below” set in the Setting / Parameters menu.
SVE–Supraventricularpremature beat–S
It is a kind of early heartbeat that arrivesearlier compared to the average RR intervalcalculated from preceding normal beats.(the difference can be adjusted in theSettings / Parameters menu SVPB limitparameter). The half of the sum of thefollowing compensation and the precedingconnecting time vary less than 20% from theaverage RR interval.
SVCPL–SupraventricularCouplet
The heart rate calculated from the interval oftwo consecutive heartbeats is bigger than orequal to the tachycardia limit set in Settings/ Parameters menu.
SVRUN–SupraventricularRun
The heart rate calculated from the interval ofthree consecutive RR intervals is biggerthan or equal to the tachycardia limit set in

User Manual Full Disclosure ECG Holter System
SW Version: 4.03 (Issued: May. 5, 2006) Labtech Ltd. Page 70 of 84
Settings / Parameters menu.SVTCH–ParoxysmalSupraventricularTachycardia
Appearing and disappearing attackingtachycardia that consists of at least fourbeats. The beginning of the tachycardia ismarked by a frequency jump that is biggerthan or equal to the "ParoxysmalTachycardia increase" set in Settings /Parameters. During tachycardia the averageheart rate is higher than or equal to thetachycardia limit set in Settings /Parameters.
PAUSE If two heartbeats reach or exceed the"Pause from" time set in Settings /Parameters.
5. Interpreting HRV Parameters(Biography: Circulation 1996, 93:1043-1065 1996 American HeartAssociation Inc.)NNinterval
The interval, that is between two consecutive normalbeats. The dominant QRS complexes are designatedNormal-N beats.
min_NN The minimum NN interval measured during therecording.
max_NN The maximum NN interval measured during themonitoring.
ave_NN The sum of NN intervals divided by the number ofnormal N beats.
N-Normalbeats
The number of normal beats counted during themonitoring.
SDNN The standard deviation of the NN intervals calculated forthe total measurement time. During the measurementtime the individual NN intervals are to be counted. Theplotting these values results in the NN distributionfunction, and calculating the standard deviation of it,from these values are obtained the SDNN valuesmeasured in msec. As the SDNN value greatly dependson measurement time, it is feasible to calculate it always

User Manual Full Disclosure ECG Holter System
SW Version: 4.03 (Issued: May. 5, 2006) Labtech Ltd. Page 71 of 84
for 24 hours. On the other hand it makes sensecomparing it with normal values represented in thereference because these values refer to 24-hourrecordings. (Normal range is referenced for 24 hours:102–180 msec)
SDANN The NN intervals are averaged for every five minutes,and plotting the frequency of the averages results in thedistribution function. Calculating the standard deviationfrom this, it results the SDANN parameter. (Normalrange is referenced for 24 hours: 92 - 162 msec)
RMSSD The number of NN intervals divides the sum of squaresof the difference of the consecutive NN intervals, andthe square root is calculated as root-mean-square value.This value is the RMSSD calculated for the totalmeasurement time. (Normal range is referenced for 24hours: 15 - 39 msec).
SDNNi The standard deviation of NN intervals is calculated forevery five minutes; the values are summed andaveraged for the total measurement time.
SDSD The distribution of difference of the consecutive NNintervals is plotted, and calculating the standarddeviation result the SDSD parameter. It is interpreted forthe total measurement time.
pNN50 Counting the successive NN interval pairs having adifference greater than 50 msec, then dividing it with thetotal count of NN intervals, and multiplying by 100,results the percentage value of pNN50 parameter.
6. What To Do? (Help for the Assistance)
The steps to follow in every case when starting a new recording orreading the data from a returned recorder to the PC are detailedbelow.
6.1. Handing Out the Recorder (starting the recording) Start the HOLTER program on the computer. Place charged batteries in the recorder unit.

User Manual Full Disclosure ECG Holter System
SW Version: 4.03 (Issued: May. 5, 2006) Labtech Ltd. Page 72 of 84
Clean the patient’s skin, position the adhesive electrodes as indicated by the diagram on the recorder unit, attach thecase and place the unit on the patient, connect the electrodecables, carefully secure the cables (follow the rules inchapter 2.2)
Select the name of the patient you wish to monitor or registerthe patient if it has not been done in the Database.
Click on New Record and the recorder program will start.When starting the recording the USB INFRA interface andthe recorder should face each other.
Check the ECG signals. The program measures theamplitude of the ECG signals of each channel. In case thismeasured value is below 0,5 mV, the program indicates itwith a flashing red question mark. If the signal is low, placethe appropriate electrodes a little further from each other. Ifthe quality of the ECG signal is acceptable, then push theYES, START Recording button and the recording will bestarted, which is indicated by a long beep from the recordingunit.
When starting without the computer, push the button for alonger time (approximately 2 sec.) and it will start therecording.
If there is any problem with the recording unit, the programindicates the cause of the error in red background on thelower part of the screen.
BATTERY ERROR: The batteries are not properly charged in therecording unit and must be replaced to start the recording. Therecording unit indicates this error with continuous beep and red light.See: Chapter 2.1. Light and sound signals.
LEAD OFF ERROR: One of the electrodes is not properly placed onthe patient or the contact is impaired.
SELECT SCAN MENU FIRST:The recorder is not empty.The program indicates this message if a recording is attempted witha recorder unit that has not yet transmitted the data it stores.

User Manual Full Disclosure ECG Holter System
SW Version: 4.03 (Issued: May. 5, 2006) Labtech Ltd. Page 73 of 84
Reading in the data from the recording unit (Scan menu) eliminatesthe error; and the new recording can be started.
COMMUNICATION ERROR: There is no connection between therecorder unit and the computer. This may occur when the infraredlight is covered or when the USB INFRA interface is not connectedto the PC. This second case can be checked in the Help/Validitymenu and by taking a look at or hovering the mouse over the USBdevice status control box in the upper right corner of the screen.
Miscellaneous Errors:The recorder unit after each start carries out an automatic self-test.After placing in the batteries first a long beep is sounded, then ifeverything is in order, three short beeps are sounded.
Attention! If the batteries are not charged properly, the recorderbeeps continuously after finishing the self-test (after three shortbeeps), indicating red light at the same time. In case the batteriesgot flat the device is not functioning at all.This error can be easily avoided, if you use well-charged batteries.After solving the problem, the recording can be started.
6.2. Taking Back the Recorder From the Patient (scanning therecord)
Take out the batteries from the recorder unit (this surely endsthe recording).
Take off the recorder-case from the patient and remove theelectrodes from the patient.
Start the HOLTER program on the computer. Place charged batteries into the recorder unit. Place the recorder unit facing the USB INFRA interface (the
receiver-transmitter should have clear view at each other.) Select the Scan menu to read the recording. Saving the
record to the database is automatic.
6.3. Possible ErrorsSome errors are listed below commonly arising in practice.

User Manual Full Disclosure ECG Holter System
SW Version: 4.03 (Issued: May. 5, 2006) Labtech Ltd. Page 74 of 84
6.3.1. The recording is too noisyIt is a common practice that applying the electrodes carefully andexpertly is a must to make good quality recording. We propose tokeep the following steps:
Clean the surface of the skin (sponge, alcoholic gauze). Attach the electrodes to the places suggested by the graph
on the front panel of the recorder unit. Use only good qualitysingle use electrodes, in formerly opened packages theelectrodes may dry out and will not provide good contact.
Follow the instructions step by step on the package ofelectrodes when placing the electrodes on the patient.
Secure the cables carefully against movements and lugging. Start the recording only after testing the ECG signal carefully.
6.3.2. No connection between the recorder unit and thecomputer
Possible causes:
If the USB INTERFACE ERROR message is seen, thencheck the connection and the setup.
If at the start of a recording or attempting to read the data,the COMMUNICATION ERROR sign appears, then probablythere is cover in between the two infrared units, thetransmitter and the receiver, or the rechargeable batteriesare flat.
In any other case, please turn to our representative orservice.
6.3.3. The selected page cannot be printedCheck if the printer you selected is turned on.If you have selected a local printer, check if it is connected to thecomputer. In case a certain HP LASER JET printer is selected,please, check if it is set for grided printing in the printer dialoguewindow. In case vectoring printing is set, it may happen that nopages or only some pages are printed out.You can select any available printer by clicking the Setup… buttonafter selecting the Print menu.

User Manual Full Disclosure ECG Holter System
SW Version: 4.03 (Issued: May. 5, 2006) Labtech Ltd. Page 75 of 84
6.3.4. The recorder does not record for 24 hours
Message of theHolter program inthe View/Servicemenu
Possible reason ofthe error What to do
Batteries wereremoved from thedevice earlier than24 hours
Please inform thepatient not toremove the batteriesfrom the device.
Battery was removed
The batteries haveweak contact.
Please clean bothends of the batteriesand the contacts aswell with benzine orcontact spray.
The batteries arenot properlycharged.
Please make surethat you use well-charged batteries.Only use batterieswith the specified orlarger capacity.Recharge thebatteries only withthe supplied batterycharger according tothe enclosedinstructions.
Battery is flat
The batteries areout of order.Faulty batteries getwarmer than normalones whencharging.
Please replace thefaulty batteries forgood ones.Please only usebatteries of thesame type andcapacity.

User Manual Full Disclosure ECG Holter System
SW Version: 4.03 (Issued: May. 5, 2006) Labtech Ltd. Page 76 of 84
7. Recommended order of the evaluation
Acceptance or modification of the offered QRS forms:The first step of the evaluation should always be the correctclassification of the beats. This is the base of any furtherevaluation. E.g. the ST parameters and HRV statistics arecalculated only from normal and right bundle branch block (Nand R label) beats.For this reason the first step of every evaluation is to lookover the categories in Templates menu, and to correct theclassification, if necessary. It is advisable to check thecategories by taking samples, and depending on the result,leaving the group category intact or renaming it to thedesired category type! When leaving the Templates menu,the analyzing program recalculates the analysis according tothe changes.
Full view: checkingAfter this, it is reasonable to check the correct classificationby choosing samples in the View / Full View menu. In a fewintervals it should be checked, whether in the displayed ECGthere are QRS waves not correctly classified to the propercategory.
Events view: checking, deleting events, selection forprinting:It is advisable to have a look at the individual events in theEvents View menu. If you want some modification you canstop playback by clicking the left mouse button and you candelete single events.
Checking and modifying of the HR minimum andmaximum:If the classification of the events is correct, then the heartrate minimum and maximum must be checked. This step is tobe the last one in the evaluation because any other changesinfluencing the QRS modification will affect these values, aswell.

User Manual Full Disclosure ECG Holter System
SW Version: 4.03 (Issued: May. 5, 2006) Labtech Ltd. Page 77 of 84
It is advisable to supervise these by measurements byplacing the rulers on two consecutive QRSs. Now besidesthe RR distance the appropriate heart rate also appears. Ifthe measured rate on the ECG does not correspond to theheart rate displayed under the event buttons, after selectingthe Events View menu, click on the red button (DeleteEvent) to search for a new heart rate maximum andminimum. This operation can be repeated indefinitely.
The program marks the noisy, unusable beats and curve-parts with ~ and these places are left out of the analysis.Typically this is the case, when one of the electrodes falls offthe patient during the recording.
Preparing the report:Following the end of the analysis, you can write comments inthe Report window and then it can be printed.If there are events you want to save in print, then theappropriate event may be selected for printing by using thePrint button.
Printing:The events selected for printing may be previewed forsupervision in Selected Samples menu and afterwards thenecessary pages can be printed from the Print menu byselecting Selected Samples.
8. Technical Parameters of the Recording UnitBy the MDD 93/42/EEC standard the device is classified into the II.acategory and fulfills the requirements of 62D(CO)6 standard for ECGdevice. The manufacturer uses ISO 9001/EN46001/ISO13485quality control and the product is entitled to use CE mark.

User Manual Full Disclosure ECG Holter System
SW Version: 4.03 (Issued: May. 5, 2006) Labtech Ltd. Page 78 of 84
8.1. Two-Channel Recorder
Number of ECGchannels:
2 independent ECG channels
Sampling rate: 500 HzA/D resolution: 12 bitDynamic interval: + / - 9 mVDC offset range: + / - 350 mVInput impedance: min. 20 MΩFrequencyresponse:
0.05 Hz - 100 Hz
PC connection: 4 Mbit / sec USB INFRA interface unitMin. Power supply: 2 x 1.2 V AA rechargeable batteries of
minimum 1500 mAh capacitySize: 105 x 60 x 22 mmWeight: 130 g
8.2. Three-Channel Recorder with Pacemaker Channel
Number of ECGchannels:
2 or 3 independent ECG & pacemakerchannels
Sampling rate: 500 HzA/D resolution: 12 bitDynamic interval: + / - 9 mVDC offset range: + / - 350 mVInput impedance: min. 20 MΩFrequencyresponse:
0.05 Hz - 100 Hz
PC connection: 4 Mbit / sec USB INFRA interface unitMin. Power supply: 2 x 1.2 V AA rechargeable batteries of
minimum 1500 mAh capacitySize: 105 x 60 x 22 mmWeight: 130 g

User Manual Full Disclosure ECG Holter System
SW Version: 4.03 (Issued: May. 5, 2006) Labtech Ltd. Page 79 of 84
8.3. Three-Channel Recorder with Pacemaker Channel andBuilt-In ABPM
Number of ECGchannels:
2 or 3 independent ECG & pacemakerchannels
Sampling rate: 500 HzA/D resolution: 12 bitDynamic interval: + / - 9 mVDC offset range: + / - 350 mVInput impedance: min. 20 MΩFrequency response: 0.05 Hz - 100 HzBP measurementrange:
0 - 300 mmHg
BP measurementaccuracy:
+ / - 3 mmHg
BP measurementmethod:
Oscillometric
Inflation time: 12 -15 secPC connection: 4 Mbit / sec USB INFRA interface unitMin. Power supply: 2 x 1.2 V AA rechargeable batteries of
minimum 2500 mAh capacitySize: 125 x 68 x 32 mmWeight: 210 g

User Manual Full Disclosure ECG Holter System
SW Version: 4.03 (Issued: May. 5, 2006) Labtech Ltd. Page 80 of 84
8.4. Ambulatory Blood Pressure Monitor
BP measurementmethod:
Oscillometry with step deflation.
BP measurementrange:
25–260 mmHg (max inflate 280 mmHg)
BP measurementaccuracy:
± 3 mmHg
Heart Rate Range: 40–200 bpmCalibration: Minimally, once per yearSafety Systems: Max. inflation pressure is limited to 300
mmHg;Auto safety release valve for power failure.Max. BP measurement time is limited to lessthan 180 seconds.
Data Connector: 3 connection headphone type connectorMin. Powersupply:
2 x 1.2 V AA rechargeable batteries ofminimum 2500 mAh capacity
Size: Approx. 120 x 80 x 32 mmWeight: Approx. 350 g (incl. Batteries)

User Manual Full Disclosure ECG Holter System
SW Version: 4.03 (Issued: May. 5, 2006) Labtech Ltd. Page 81 of 84
9. Maintenance, Calibration
The ECG device under the prescribed normal use keeps the pre-setparameters and after installation there is no need for calibration ormaintenance.
Calibration of the ABPM (blood pressure) has to be carried out fromtime to time according to the way prescribed by the relevantstandards.Suggestions to preparing a measuring set and carrying outcalibration:
Place well-charged batteries into the device. Place the cuff on an artificial arm (for example on a plastic
pipe with a diameter of 6-12 cms). Connect a manometer as a reference device to the recorder
according to the figure below. It is essential that themanometer should be calibrated and able to takemeasurements within the range of 0-300 mmHg (used atblood pressure measuring)
Select a patient in the Holter program (Database / Patients),then press New Record button
Place the INFRA window of the recorder in front of the USBINFRA interface unit then press BP START button
Wait until the device inflates the cuff During deflation, please read and write down the pressure
values shown by the Holter program and the referencedevice. Since the ABPM deflates gradually you can read thevalues of the same step from both displays.
By comparing the pressure values you can determinewhether the accuracy of the ABPM is satisfactory or not.
If non-accurate the calibration has to be done by themanufacturer.

User Manual Full Disclosure ECG Holter System
SW Version: 4.03 (Issued: May. 5, 2006) Labtech Ltd. Page 82 of 84
The device inflates the cuff normally to 160 mmHg. If you would liketo calibrate at a higher pressure, you have to knock the cuffcontinuously by hand during the inflation process so as to cheat onthe device as if the systolic value were high. This way the device willinflate the cuff with higher pressure.
The case of the recorder unit may be cleaned or washed ifnecessary.

User Manual Full Disclosure ECG Holter System
SW Version: 4.03 (Issued: May. 5, 2006) Labtech Ltd. Page 83 of 84
DIARY I.
Institution (name, address):
Consultant:
Patient’s Name:
Date of Birth: Day: Month: Year:
Dear Patient!
The device attached to you is helping us investigate abnormal heartfunctions. Please help us by keeping the following rules:
Do not take off the device during the recording! Avoid any work causing intensive perspiration! Do not take out the batteries from the recorder unit since it
ends the recording! Keep away the electrodes and the recording unit from water
and intensive heat! Do not take the device in explosive surrounding! Do not use the device in strong electric field! If any of the electrodes falls off, the recorder unit alerts with
interrupted beeps. We apologise if it awakened you fromsleep. Please snap back the fallen electrode!
In case of diseasedness or any other complaint push theevent button and make a note in the diary No. II.!
Please diarize the events as detailed as possible! Pleasewrite into the appropriate row the number of activity at thattime and if you had complaints, then write that number, too. Ifthe activity or complaint is not listed under the table, thenplease write it into the table in legible form.
The time of taking drugs, the name and quantity should bewritten in the following table!

User Manual Full Disclosure ECG Holter System
SW Version: 4.03 (Issued: May. 5, 2006) Labtech Ltd. Page 84 of 84
DIARY II.
Time Daily Activity Complaints800-900
900-1000
1000-1100
1100-1200
1200-1300
1300-1400
1400-1500
1500-1600
1600-1700
1700-1800
1800-1900
1900-2000
2000-2100
2100-2200
2200-2300
2300-000
000-100
100-200
200-300
300-400
400-500
500-600
600-700
700-800
Activity Complaint1. Work at workplace 1. Breathlessness2. Housework 2. Quick heartbeats (Tachycardia)3. Walking 3. Irregular heartbeats4. Sleeping 4. Dizziness5. Travelling 5. Nausea6. Rest 6. Chest pain7. Other (please, name it) 7. Other (please, name it)