user guide for afleet tool 2013
TRANSCRIPT

User Guide for AFLEET Tool 2013 by A. Burnham Systems Assessment Group Energy Systems Division, Argonne National Laboratory October 2013


iii
CONTENTS
ACKNOWLEDGEMENTS ............................................................................................................ v
NOTATION ................................................................................................................................... vi
1. BACKGROUND ............................................................................................................ 1
2. DESCRIPTION OF AFLEET TOOL ............................................................................ 2
2.1 Instructions Sheet ........................................................................................................... 2 2.2 Inputs Sheet .................................................................................................................... 2 2.3 Payback Sheet ................................................................................................................. 6
2.4 Payback Outputs Sheet ................................................................................................... 9 2.5 TCO Sheet .................................................................................................................... 12 2.6 TCO Outputs Sheet ...................................................................................................... 16
2.7 Footprint Sheet ............................................................................................................. 22
2.8 Footprint Outputs Sheet ................................................................................................ 24 2.9 Background Data Sheet ................................................................................................ 25
3. REFERENCES ............................................................................................................. 27
FIGURES
Figure 1. Instructions Sheet – Cell Color Scheme ......................................................................... 2
Figure 2. Inputs Sheet - Key Inputs ............................................................................................... 3
Figure 3. Inputs Sheet - Total Cost of Ownership Inputs .............................................................. 5
Figure 4. Inputs Sheet – Fuel Production Assumptions ................................................................. 5
Figure 5. Payback Sheet – LDVs, HDVs, and Fuel Inputs ............................................................ 6
Figure 6. Payback Sheet – Calculations ......................................................................................... 8
Figure 7. Payback Outputs Sheet – Annual Costs Summary Table ............................................... 9
Figure 8. Payback Outputs Sheet – Annual Energy Use and Emissions Summary Table........... 10
Figure 9. Payback Outputs Sheet – Annual LDV Energy Use and GHGs Summary Graph ....... 10
Figure 10. Payback Outputs Sheet – Annual HDV Energy Use and GHGs Summary Graph .... 11
Figure 11. Payback Outputs Sheet – Annual LDV Air Pollutant Emissions Summary Graph ... 11
Figure 12. Payback Outputs Sheet – Annual HDV Air Pollutant Emissions Summary Graph ... 12
Figure 13. TCO Sheet – LDV Characteristics and Cost Calculations ......................................... 13
Figure 14. TCO Sheet – LDV Energy Use and Emissions Calculations ..................................... 14
Figure 15. TCO Sheet – HDV Characteristics and Cost Calculations ......................................... 15
iv
Figure 16. TCO Sheet – HDV Energy Use and Emissions Calculations ..................................... 16
Figure 17. TCO Outputs Sheet – Lifetime Costs Summary Table .............................................. 16
Figure 18. TCO Outputs Sheet – Lifetime Energy Use and Emissions Summary Table ............ 17
Figure 19. TCO Outputs Sheet – LDV Cumulative Cash Flow Compared to Gasoline Summary
Graph............................................................................................................................................. 17
Figure 20. TCO Outputs Sheet – HDV Cumulative Cash Flow Compared to Diesel Summary
Graph............................................................................................................................................. 18
Figure 21. TCO Outputs Sheet – LDV Cumulative Cash Flow Summary Graph ....................... 18
Figure 22. TCO Outputs Sheet – HDV Cumulative Cash Flow Summary Graph ...................... 19
Figure 23. TCO Outputs Sheet – LDV Total Cost of Ownership Summary Graph .................... 19
Figure 24. TCO Outputs Sheet – HDV Total Cost of Ownership Summary Graph .................... 20
Figure 25. TCO Outputs Sheet – Lifetime LDV Energy Use and GHGs Summary Graph ........ 20
Figure 26. TCO Outputs Sheet – Lifetime HDV Energy Use and GHGs Summary Graph ........ 21
Figure 27. TCO Outputs Sheet – Lifetime LDV Air Pollutant Emissions Summary Graph ....... 21
Figure 28. TCO Outputs Sheet – Lifetime HDV Air Pollutant Emissions Summary Graph ...... 22
Figure 29. Footprint Sheet - Inputs .............................................................................................. 23
Figure 30. Footprint Sheet - Energy Use and Emissions Calculations ........................................ 23
Figure 31. Footprint Outputs Sheet - Energy Use and Emissions Summary Table ..................... 24
Figure 32. Footprint Outputs Sheet – Fleet Energy Use and GHGs Summary Graph ................ 24
Figure 33. Footprint Outputs Sheet - Fleet Air Pollutant Emissions Summary Graph................ 25
Figure 34. Background Data Sheet - AFLEET Look Up Tables - Vehicle Vocation Selection.. 25
Figure 35. Background Data Sheet - AFLEET Look Up Tables - New Vehicle Purchase Price 26
Figure 36. Background Data Sheet – GREET Fleet Specifications – Electricity Mix ................ 26

v
ACKNOWLEDGEMENTS
This work was supported by the Vehicle Technologies Office, U.S. Department of
Energy. The author gratefully thanks Linda Bluestein and Dennis Smith of Clean Cities for their
sponsorship and technical guidance. Thanks are extended to Marcy Rood Werpy, Linda Gaines,
Dan Santini, Marianne Mintz, Anant Vyas, Tom Stephens, Yan Zhou, and Michael Wang of
Argonne National Laboratory for their comments. In addition, the author thanks all the external
reviewers of the tool. Finally, special thanks to Ashwini Bharatkumar and Dana Johnson for their
help developing the tool. The author is responsible for this work and not the U.S. Department of
Energy, Argonne National Laboratory, nor the reviewers.

vi
NOTATION
Acronyms and Abbreviations
AFLEET Alternative Fuel Life-Cycle Environmental and Economic Transportation
AFV alternative fuel vehicle
Argonne Argonne National Laboratory
B100 blend of 100% biodiesel by volume
B20 blend of 20% biodiesel and 80% diesel by volume
CD charge depleting
CNG compressed natural gas
CO carbon monoxide
DEF diesel exhaust fluid
DOE U.S. Department of Energy
E85 blend of 85% ethanol and 15% gasoline by volume
EPA Environmental Protection Agency
EREV extended range electric vehicle
EV all-electric vehicle
GHG greenhouse gas
GREET Greenhouse gases, Regulated Emissions, and Energy Use in Transportation
HDV heavy-duty vehicle
HEV hybrid electric vehicle
HHV hydraulic hybrid vehicle
LDV light-duty vehicle
LNG liquefied natural gas
LPG liquefied petroleum gas
MOVES Motor Vehicle Emission Simulator
NOx nitrogen oxides
PHEV plug-in hybrid electric vehicle
PM10 particulate matter with a diameter of 10 micrometers or less
PM2.5 particulate matter with a diameter of 2.5 micrometers or less
PTW pump-to-wheels
TBW tire and brake wear
TCO total cost of ownership

vii
VOC volatile organic compound
WTP well-to-pump
WTW well-to-wheels
Units of Measure
mpdge mile(s) per diesel gallon equivalent
mpgge mile(s) per gasoline gallon equivalent

viii
1
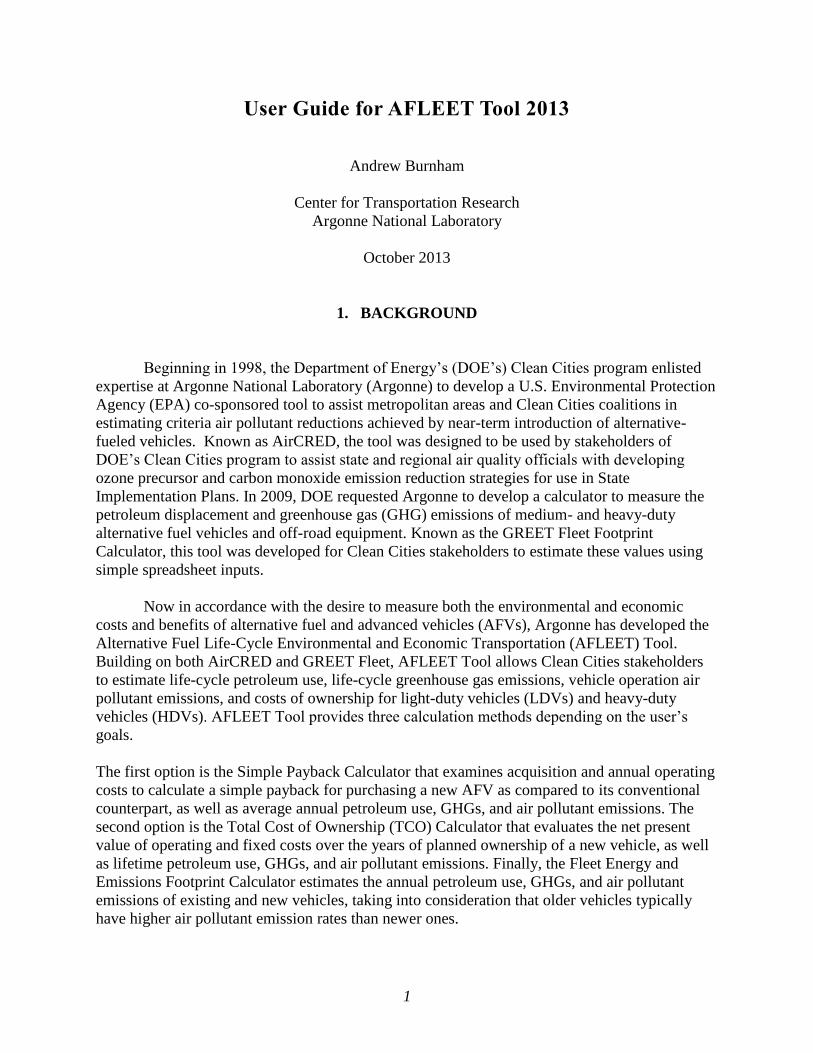
User Guide for AFLEET Tool 2013
Andrew Burnham
Center for Transportation Research
Argonne National Laboratory
October 2013
1. BACKGROUND
Beginning in 1998, the Department of Energy’s (DOE’s) Clean Cities program enlisted
expertise at Argonne National Laboratory (Argonne) to develop a U.S. Environmental Protection
Agency (EPA) co-sponsored tool to assist metropolitan areas and Clean Cities coalitions in
estimating criteria air pollutant reductions achieved by near-term introduction of alternative-
fueled vehicles. Known as AirCRED, the tool was designed to be used by stakeholders of
DOE’s Clean Cities program to assist state and regional air quality officials with developing
ozone precursor and carbon monoxide emission reduction strategies for use in State
Implementation Plans. In 2009, DOE requested Argonne to develop a calculator to measure the
petroleum displacement and greenhouse gas (GHG) emissions of medium- and heavy-duty
alternative fuel vehicles and off-road equipment. Known as the GREET Fleet Footprint
Calculator, this tool was developed for Clean Cities stakeholders to estimate these values using
simple spreadsheet inputs.
Now in accordance with the desire to measure both the environmental and economic
costs and benefits of alternative fuel and advanced vehicles (AFVs), Argonne has developed the
Alternative Fuel Life-Cycle Environmental and Economic Transportation (AFLEET) Tool.
Building on both AirCRED and GREET Fleet, AFLEET Tool allows Clean Cities stakeholders
to estimate life-cycle petroleum use, life-cycle greenhouse gas emissions, vehicle operation air
pollutant emissions, and costs of ownership for light-duty vehicles (LDVs) and heavy-duty
vehicles (HDVs). AFLEET Tool provides three calculation methods depending on the user’s
goals.
The first option is the Simple Payback Calculator that examines acquisition and annual operating
costs to calculate a simple payback for purchasing a new AFV as compared to its conventional
counterpart, as well as average annual petroleum use, GHGs, and air pollutant emissions. The
second option is the Total Cost of Ownership (TCO) Calculator that evaluates the net present
value of operating and fixed costs over the years of planned ownership of a new vehicle, as well
as lifetime petroleum use, GHGs, and air pollutant emissions. Finally, the Fleet Energy and
Emissions Footprint Calculator estimates the annual petroleum use, GHGs, and air pollutant
emissions of existing and new vehicles, taking into consideration that older vehicles typically
have higher air pollutant emission rates than newer ones.

2
2. DESCRIPTION OF AFLEET TOOL
There are nine Microsoft® Excel sheets in the calculator, which are explained below.
2.1 Instructions Sheet
This sheet contains the software copyright notice and it presents a brief summary of cell
types (Figure 1) and other worksheets in AFLEET Tool.
Figure 1. Instructions Sheet – Cell Color Scheme
2.2 Inputs Sheet
The essential user inputs (Figure 2) for both the Simple Payback and Total Cost of
Ownership calculators (the Fleet Energy and Emissions Footprint Calculator also uses the
specified vehicle location for its air pollutant calculations) are:
primary vehicle location (state)
vehicle type
vehicle fuel type
number of vehicles
annual vehicle mileage
fuel economy
vehicle purchase price
fuel and diesel emission fluid (DEF) price.
Argonne has provided default data for many inputs in AFLEET Tool; however, it is
highly recommended that users enter their own data whenever possible. However, the user must
enter the number of vehicles to be compared as the default is set to zero. When estimating a
simple payback, the user must enter data for both the AFVs and their conventional counterpart
(e.g. gasoline vehicle for LDVs and diesel vehicle for HDVs). When entering their own data,
users need to enter the fuel economy values on a mile per gasoline gallon equivalent (mpgge)
basis for both LDVs and HDVs. As a mile per diesel gallon equivalent (mpdge) fuel economy is
often used for HDVs, we provide an estimated mpdge value to the right of the key inputs table to
help with any conversion needed.
Yellow cells are key assumptions that users can change with their data
Orange cells are key options that users will select from a drop-down
menu
Clear cells are for calculations and secondary assumptions

3
Figure 2. Inputs Sheet - Key Inputs
The vehicle types in AFLEET Tool are based on EPA’s Motor Vehicle Emission
Simulator (MOVES) as this allows the tool to estimate vehicle operation (e.g. tailpipe, brake and
tire wear) emissions for various vehicle vocations (EPA 2013a). Each vehicle type has default
vocational data that populate the cells. This information is available in lookup tables on the
Background Data sheet. As discussed in Section 2.9 of this document, a user can click the blue
hyperlink for “Vehicle Type” and modify the default vocation type using the dropdown boxes.
The current light-duty vehicle types available in AFLEET Tool are:
passenger car (four wheel, two axle vehicle whose primary function is passenger
transport)
Primary Vehicle LocationState ILLINOIS
Light-Duty Vehicle InformationVehicle Type Passenger Car
Light-Duty Fuel Type Number of Light-Duty Vehicles
Annual Vehicle
Mileage
Fuel Economy
(MPGGE)
Purchase Price
($/Vehicle)
Gasoline 0 12,400 26.7 $20,000
Diesel 0 12,400 32.0 $22,500
Gasoline HEV 0 12,400 37.4 $28,000
Gasoline PHEV 0 12,400 41.5 $33,000
Gasoline EREV 0 12,400 31.5 $35,000
EV 0 12,400 90.8 $37,500
Biodiesel (B20) 0 12,400 32.0 $22,500
Biodiesel (B100) 0 12,400 32.0 $22,500
Ethanol (E85) 0 12,400 26.7 $20,000
Propane (LPG) 0 12,400 26.7 $26,000
Compressed Natural Gas (CNG) 0 12,400 25.4 $27,000
Heavy-Duty Vehicle InformationVehicle Type Combination Long-Haul Truck
Heavy-Duty Fuel Type Number of Heavy-Duty Vehicles
Annual Vehicle
Mileage
Fuel Economy
(MPGGE)
Purchase Price
($/Vehicle)
Gasoline 0 0 4.3 $0Diesel 0 170,000 5.2 $100,000
EV 0 0 14.7 $0
Diesel HEV 0 170,000 5.5 $140,000
Diesel Hydraulic Hybrid 0 0 5.2 $0
Biodiesel (B20) 0 170,000 5.2 $100,000
Biodiesel (B100) 0 170,000 5.2 $100,000
Ethanol (E85) 0 0 4.3 $0
Propane (LPG) 0 0 4.7 $0
Compressed Natural Gas (CNG) 0 170,000 4.7 $165,000
Liquefied Natural Gas (LNG) 0 170,000 4.7 $150,000LNG / Diesel Pilot Ignition 0 170,000 5.2 $190,000
Fuel and DEF Price Fuel Unit $/Fuel Unit
Gasoline gasoline gallon $3.56
Diesel diesel gallon $4.11
Electricity kWh $0.11
B20 B20 gallon $4.16
B100 B100 gallon $4.55
E85 E85 gallon $3.40
Propane LPG gallon $2.91
CNG CNG GGE $2.21
LNG LNG gallon $1.53
DEF DEF gallon $2.80

4
passenger truck (four wheel, two axle vehicle whose primary functional design is for
cargo, but are used primarily for passenger transport)
light commercial truck (four wheel, two axle vehicle used primarily for cargo transport).
While the heavy-duty vehicle types are:
school bus (passenger vehicle with a capacity of 15 or more persons used primarily for
transport of students for school)
transit bus (passenger vehicle with a capacity of 15 or more persons primarily used for
transport within cities)
refuse truck (truck primarily used to haul refuse to a central location)
single unit short-haul truck (single unit truck with more than four tires with a range of
operation of up to 200 miles)
single unit long-haul truck (single unit truck with more than four tires with a range of
operation of over 200 miles)
combination short-haul truck (combination tractor/trailer truck with more than four
tires with a range of operation of up to 200 miles)
combination long-haul truck (combination tractor/trailer truck with more than four tires
with a range of operation of over 200 miles).
The current light-duty vehicle fuel types available in AFLEET Tool are:
gasoline
diesel
gasoline hybrid electric vehicle (HEV)
gasoline plug-in hybrid electric vehicle (PHEV)
gasoline extended range electric vehicle (EREV)
all-electric vehicle (EV)
biodiesel 20% blend (B20)
biodiesel 100% blend (B100)
ethanol flex-fuel 85% blend (E85)
propane / liquefied petroleum gas (LPG)
compressed natural gas (CNG).
While the heavy-duty vehicle fuel types are:
gasoline
diesel
EV
diesel HEV
diesel hydraulic hybrid vehicle (HHV)
B20
B100
E85
LPG
CNG
liquefied natural gas (LNG)

5
liquefied natural gas / diesel pilot ignition.
If one wants to perform TCO calculations (Figure 3), the user can modify the:
planned years of ownership
whether vehicle purchase is financed by a loan
loan term
loan interest rate
discount factor.
Figure 3. Inputs Sheet - Total Cost of Ownership Inputs
The user can also modify the fuel production assumptions (Figure 4), which will impact
the petroleum use and GHG calculations. For instance, a user can compare the footprint of
ethanol vehicles using either a corn or cellulosic feedstock. A user who wants to enter a custom
electricity generation mix will need to go to Background Data sheet. If one clicks the blue
hyperlink for the “12 – User Defined” mix in the fuel production assumptions table, the user will
be taken to the correct cells to enter the new values.
Figure 4. Inputs Sheet – Fuel Production Assumptions
Light-Duty Vehicle InformationYears of Planned Ownership years 16
Heavy-Duty Vehicle InformationYears of Planned Ownership years 28
Financial AssumptionsLoan yes/no No
Loan Term years 5
Interest Rate % 4.14%
Percent Down Payment % 0.00%
Discount Factor % 0.79%
Biodiesel Feedstock Source 1 - Soy 1
2 - Algae
Ethanol Feedstock Source 1 - Corn 1
2 - Switchgrass
CNG Feedstock Source 1 - North American NG 1
2 - Non-North American NG
3 - Landfill Gas
LNG Feedstock Source 1 - North American NG 1
2 - Non-North American NG
3 - Landfill Gas
North American NG Feedstock Source Conventional Shale
66% 34%
LPG Feedstock Source NG Petroleum
69% 31%
Source of Electricity for Plug-in Hybrid Electric Vehicles (PHEVs) and All-Electric Vehicles (EVs)
1 - Average U.S. Mix 1
2 to 11 - EIA Region Mix (see map)
12 - User Defined (go to 'Background Data' sheet)

6
2.3 Payback Sheet
This sheet contains the Simple Payback Calculator, which examines acquisition and
annual operating costs as well as average annual petroleum use, GHGs, and air pollutant
emissions. The vehicle operation air pollutant emissions calculated are:
carbon monoxide (CO) from tailpipe
nitrogen oxides (NOx) from tailpipe
particulate matter with a diameter of 10 micrometers or less (PM10) from tailpipe and
tire and brake wear (TBW)
particulate matter with a diameter of 2.5 micrometers or less (PM2.5) from tailpipe
and TBW
VOCs (volatile organic compounds) from tailpipe and evaporation.
Key assumptions for light-duty vehicles, heavy-duty vehicles, and fuel price from the
Inputs sheet are fed into the first three tables in the Payback sheet (Figure 5). Additional user
inputs can be modified on this sheet for the fuel consumption of charge depleting (CD) operation
of PHEVs and EREVs, vehicle purchase incentive, maintenance and repair cost per mile, share
of LNG fuel use in a LNG diesel pilot ignition vehicle, and DEF consumption.
Figure 5. Payback Sheet – LDVs, HDVs, and Fuel Inputs
On the Inputs sheet, the user can enter the charge sustaining (i.e. hybrid mode) fuel
economy of PHEVs and EREVs. While on the Payback sheet, users will need to examine further
inputs to make sure they are properly analyzing these vehicles. These include the CD electricity
and fuel consumption, CD operating range, charges per day, and days driven per week, which are
all used to estimate the amount of electricity and gasoline used by these vehicles.
The electricity and fuel use inputs for CD operation of PHEVs and EREVs are on a fuel
consumption basis (i.e. electricity and gasoline per 100 miles driven, instead of miles per gallon).
These values will be found on FuelEconomy.gov on this basis. CD operation (i.e. EV mode)
Gasoline Diesel
Gasoline
HEV
Gasoline
PHEV
Gasoline
EREV EV Diesel HEV
Diesel
Hydraulic
Hybrid
Biodiesel
(B20)
Biodiesel
(B100)
Ethanol
(E85)
Propane
(LPG)
Compressed
Natural Gas
(CNG)
Liquefied
Natural Gas
(LNG)
LNG /
Diesel Pilot
Ignition
Light-Duty Vehicle Inputs Gasoline Diesel Gasoline Gasoline Gasoline Gasoline Diesel Diesel Gasoline Gasoline Gasoline Gasoline Gasoline
Vehicle Type Passenger Car
Number of LDVs 10 0 10 10 10 10 0 0 10 0 10
Annual Mileage 12,400 12,400 12,400 12,400 12,400 12,400 12,400 12,400 12,400 12,400 12,400
Fuel Economy (MPGGE) 26.7 32.0 37.4 41.4 31.5 90.8 32.0 32.0 26.7 26.7 25.4
Fuel Consumption (GGE/100mi) 3.7 3.1 2.7 2.4 3.2 1.1 0.0 0.0 3.1 3.1 3.7 3.7 3.9
CD Electricity Use (kWh/100mi) 22.6 33.6 36.2
CD Electricity Use (GGE/100mi) 0.7 1.0
CD Gasoline Use (GGE/100mi) 1.4 0.0
PHEV CD Range (miles) 10.9 33.1
Charges/day 1.0 1.0
Days driven/week 5 5
Share of CD miles 23% 70%
Purchase Price ($/vehicle) $20,000 $22,500 $28,000 $33,000 $35,000 $37,500 $22,500 $22,500 $20,000 $26,000 $27,000
Incentive ($/vehicle) $0 $0 $0 $0 $0 $0 $0 $0 $0 $0 $0
Maintenance & Repair ($/mile) $0.14 $0.19 $0.14 $0.13 $0.13 $0.13 $0.19 $0.19 $0.14 $0.14 $0.14
Heavy-Duty Vehicle Inputs Gasoline Diesel Diesel Diesel Diesel Diesel Diesel Gasoline Gasoline Diesel Diesel Diesel
Vehicle Type Combination Long-Haul Truck
Number of HDVs 0 10 0 0 0 10 0 0 0 10 10 10
Annual Mileage 0 170,000 0 170,000 0 170,000 170,000 0 0 170,000 170,000 170,000
Fuel Economy (MPGGE) 4.3 5.2 14.7 5.5 5.2 5.2 5.2 4.3 4.7 4.7 4.7 5.2
Fuel Consumption (GGE/100mi) 23.1 19.2 6.8 18.1 19.2 19.2 19.2 23.1 21.4 21.4 21.4 19.2
Fuel Consumption (DGE/100mi) 20.3 17.0 6.0 15.9 17.0 17.0 17.0 20.3 18.8 18.8 18.8 17.0
CD Electricity Use (kWh/100mi) 223.4
Share of LNG Fuel Use (energy %) 95%
DEF Use (% of fuel consumption) 0% 2% 2% 2% 2% 2% 2% 0% 0% 0% 0% 2%
Purchase Price ($/vehicle) $0 $100,000 $0 $140,000 $0 $100,000 $100,000 $0 $0 $165,000 $150,000 $190,000
Incentive ($/vehicle) $0 $0 $0 $0 $0 $0 $0 $0 $0 $0 $0 $0
Maintenance & Repair ($/mile) $0.00 $0.19 $0.17 $0.18 $0.18 $0.19 $0.19 $0.00 $0.00 $0.19 $0.19 $0.20

7
occurs when the vehicle is dependent on the using the battery for operation and the battery’s state
of charge depletes. In AFLEET Tool, we allow the user to separately simulate PHEVs and
EREVs. While an EREV is a type of PHEV, the key difference that we used to differentiate them
for AFLEET Tool is that an EREV operates all electrically until the battery is depleted and will
typically have a large battery pack than a PHEV. With current battery technology, PHEVs other
than EREVs typically operate in blended CD mode, which is when the battery's energy is
primarily used to drive the vehicle but the engine may turn on to assist driving the vehicle (e.g.
during hard accelerations). Therefore, PHEVs may have CD gasoline use, while EREVs will not.
Default maintenance (scheduled) and repair (unscheduled) costs on a per mile basis are
included for each vehicle type. Though again, it is highly recommended that users enter their
own data whenever possible as this cost data will depend on the individual fleet/operator. The
incremental maintenance and repair cost difference between various vehicle types is typically
small as we usually assume similar costs. In some cases, we do calculate differences as hybrids
and electric drive vehicles (i.e. PHEVs, EREVs, and EVs) may have reduced brake (and other)
costs as compared to conventional vehicles. In addition, incremental maintenance costs for
natural gas vehicles, such as CNG tank inspection and increased oil change intervals for heavy-
duty natural gas vehicles are included. In this version, we do not include battery replacement
costs for hybrids and electric drive vehicles as reliable data for replacement intervals and
expected costs are not available at this time. Biodiesel has different cold weather operability as
compared to diesel and may require additives or treatments to improve performance. In the
current version of AFLEET Tool, no costs for these treatments are included as data was not
available.
The share of LNG fuel use in a LNG / diesel pilot ignition vehicle is set to match the
performance of the Westport™ high-pressure direct injection system, though other systems will
have different performance. Some vehicles use selective catalytic reduction systems to reduce
NOx emissions. These systems require DEF, a urea-based solution, to operate correctly. DEF use
is typically estimated as a percent of fuel consumption; users can adjust this value on this sheet.
A vehicle purchase incentive can be entered on this sheet or can be included in the purchase
price on the Inputs sheet.
The other tables (Figure 6) in this sheet include the calculation for simple payback,
petroleum use, GHG emissions, and air pollutant emissions. The calculation for simple payback
is based on the acquisition and annual operating costs for a new AFV as compared to its
conventional counterpart. Specifically, calculating the years (and miles) needed for the operating
savings to payback the higher incremental acquisition cost. In cases where the operating costs for
the AFV are higher than the costs of the conventional vehicle, there will be no payback
calculated. In AFLEET Tool 2013, only incremental vehicle purchase costs are included for
acquisition costs. In the future, we plan to include other acquisition costs like refueling
infrastructure and maintenance depot modification.

8
Figure 6. Payback Sheet – Calculations
The petroleum use and GHG calculations are both well-to-wheels (WTW) (i.e. life-cycle)
estimates and similar to those in the GREET Fleet tool. The basis of these calculations is
Argonne’s Greenhouse gases, Regulated Emissions, and Energy use in Transportation (GREET)
fuel-cycle model, which is used to generate necessary petroleum use and GHG emission co-
efficients (Argonne 2013). A WTW analysis can be divided into two stages: well-to-pump (WTP)
and pump-to-wheels (PTW). The WTP stage starts with the fuel feedstock recovery, followed by
fuel production, and ends with the fuel available at the pump, while the PTW stage represents the
vehicle’s operation activities. It is important to examine petroleum use and GHG emissions of
transportation fuels and technologies on a WTW basis in order to properly compare alternatives,
as activities upstream of vehicle operation can use significant amounts of energy and
subsequently produce a large amount of emissions. The location of where the petroleum is used
or GHGs are emitted does not significantly alter their impacts.
However, for air pollutants the location where they are emitted does play a major role as
they impact local air quality. Thus, air quality management organizations and other Clean Cities
stakeholders are primarily interested in vehicle operation emissions, as WTP emissions often
occur a significant distance from where the vehicle is used. For those interested in WTP air
pollutant emissions, see the GREET fuel-cycle model. The calculation methodology for these
emissions is based on Argonne’s AirCRED tool. EPA’s MOVES is used to generate emission
factors by state for gasoline and diesel vehicle types. In some cases, there are no emissions data
for vehicles as they are not available in the marketplace (e.g. no gasoline refuse or combination
trucks) and therefore in AFLEET Tool the calculation will show the not applicable error sign
“#N/A”.
Gasoline Diesel
Gasoline
HEV
Gasoline
PHEV
Gasoline
EREV EV Diesel HEV
Diesel
Hydraulic
Hybrid
Biodiesel
(B20)
Biodiesel
(B100)
Ethanol
(E85)
Propane
(LPG)
Compressed
Natural Gas
(CNG)
Liquefied
Natural Gas
(LNG)
LNG /
Diesel Pilot
Ignition
Acquisition CostLight-Duty (LD) Fleet Cost $200,000 $0 $280,000 $330,000 $350,000 $375,000 $0 $0 $0 $0 $200,000 $0 $270,000 $0 $0
Heavy-Duty (HD) Fleet Cost $0 $1,000,000 $0 $0 $0 $0 $0 $0 $1,000,000 $0 $0 $0 $1,650,000 $1,500,000 $1,900,000
Annual Operating CostLD Fuel Cost $16,533 $0 $11,810 $10,357 $7,555 $5,109 $0 $0 $0 $0 $21,549 $0 $10,804 $0 $0
LD Maintenance Cost $17,620 $0 $17,046 $16,727 $16,727 $15,526 $0 $0 $0 $0 $17,620 $0 $17,620 $0 $0
HD Fuel Cost $0 $1,163,846 $0 $0 $0 $0 $0 $0 $1,196,538 $0 $0 $0 $802,778 $831,838 $769,413
HD Diesel Exhaust Fluid Cost $0 $18,308 $0 $0 $0 $0 $0 $0 $18,308 $0 $0 $0 $0 $0 $18,308
HD Maintenance Cost $0 $323,000 $0 $0 $0 $0 $0 $0 $323,000 $0 $0 $0 $328,289 $328,289 $333,200
Annual Operating SavingsCompared to Gasoline LD Fleet $5,298 $7,069 $9,872 $13,518 -$5,016 $5,729
Compared to Diesel HD Fleet -$32,692 $374,087 $345,027 $384,233
Simple PaybackLD Fleet (miles) 187,254.9 228,033.4 188,417.3 160,521.3 No payback 151,497.4
LD Fleet (years) 15.1 18.4 15.2 12.9 No payback 12.2
HD Fleet (miles) No payback 295,385.7 246,357.3 398,196.2
HD Fleet (years) No payback 1.7 1.4 2.3
Life-Cycle Petroleum Use (barrels)LD Petroleum Use 96.9 0.0 69.2 56.6 25.7 1.2 0.0 0.0 0.0 0.0 21.2 0.0 0.5 0.0 0.0
HD Petroleum Use 0.0 7,268.1 0.0 0.0 0.0 0.0 0.0 0.0 5,905.2 0.0 0.0 0.0 38.5 88.3 416.4
Life-Cycle Greenhouse Gas (GHG) Emissions (short tons)LD GHG Emissions 56.0 0.0 40.0 36.8 33.2 29.1 0.0 0.0 0.0 0.0 41.5 0.0 48.1 0.0 0.0
HD GHG Emissions 0.0 4,107.9 0.0 0.0 0.0 0.0 0.0 0.0 3,484.6 0.0 0.0 0.0 3,576.3 3,555.9 3,237.2
Vehicle Operation Air Pollutant Emissions (lb)Light-Duty Vehicle Type Passenger Car
CO 752.0 0.0 563.3 508.4 171.3 0.0 0.0 468.9 0.0 544.3
NOx 27.1 0.0 17.4 15.7 5.3 0.0 0.0 17.7 0.0 22.6
PM10 1.8 0.0 1.8 1.6 0.5 0.0 0.0 1.8 0.0 1.8
PM10 (TBW) 5.5 0.0 5.5 5.5 5.5 5.5 0.0 0.0 5.5 0.0 5.5
PM2.5 1.7 0.0 1.7 1.6 0.5 0.0 0.0 1.7 0.0 1.7
PM2.5 (TBW) 1.4 0.0 1.4 1.4 1.4 1.4 0.0 0.0 1.4 0.0 1.4
VOC 23.9 0.0 16.2 14.6 4.9 0.0 0.0 22.5 0.0 14.0
VOC (Evap) 8.2 0.0 8.2 7.4 2.5 0.0 0.0 7.0 0.0 4.1
Heavy-Duty Vehicle Type Combination Long-Haul Truck
CO #N/A 8,073.1 0.0 0.0 8,073.1 0.0 #N/A #N/A 124,325.5 124,325.5 1,614.6
NOx #N/A 24,169.4 0.0 0.0 24,169.4 0.0 #N/A #N/A 14,501.6 14,501.6 14,501.6
PM10 #N/A 165.2 0.0 0.0 165.2 0.0 #N/A #N/A 165.2 165.2 165.2
PM10 (TBW) #N/A 311.1 0.0 0.0 0.0 311.1 0.0 #N/A #N/A 311.1 311.1 311.1
PM2.5 #N/A 160.5 0.0 0.0 160.5 0.0 #N/A #N/A 160.5 160.5 160.5
PM2.5 (TBW) #N/A 78.7 0.0 0.0 0.0 78.7 0.0 #N/A #N/A 78.7 78.7 78.7
VOC #N/A 1,999.9 0.0 0.0 1,999.9 0.0 #N/A #N/A 6,499.5 6,499.5 799.9
VOC (Evap) #N/A 0.0 0.0 0.0 0.0 0.0 #N/A #N/A 61.8 61.8 61.8
9
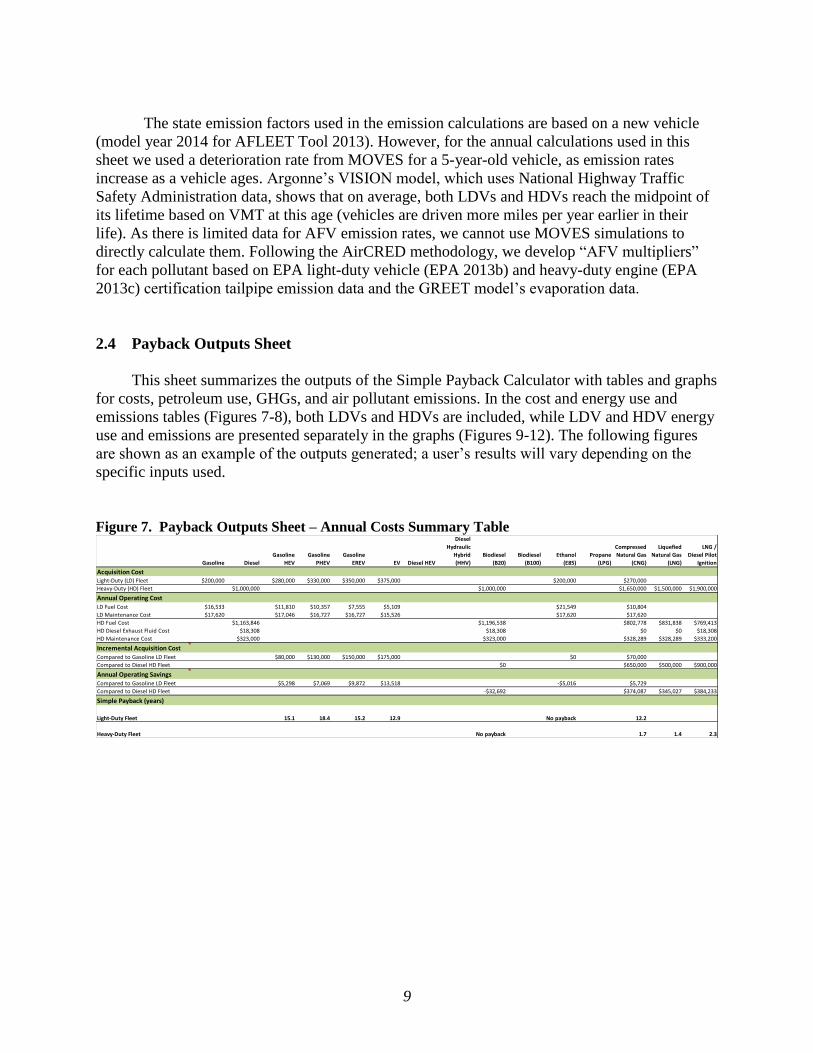
The state emission factors used in the emission calculations are based on a new vehicle
(model year 2014 for AFLEET Tool 2013). However, for the annual calculations used in this
sheet we used a deterioration rate from MOVES for a 5-year-old vehicle, as emission rates
increase as a vehicle ages. Argonne’s VISION model, which uses National Highway Traffic
Safety Administration data, shows that on average, both LDVs and HDVs reach the midpoint of
its lifetime based on VMT at this age (vehicles are driven more miles per year earlier in their
life). As there is limited data for AFV emission rates, we cannot use MOVES simulations to
directly calculate them. Following the AirCRED methodology, we develop “AFV multipliers”
for each pollutant based on EPA light-duty vehicle (EPA 2013b) and heavy-duty engine (EPA
2013c) certification tailpipe emission data and the GREET model’s evaporation data.
2.4 Payback Outputs Sheet
This sheet summarizes the outputs of the Simple Payback Calculator with tables and graphs
for costs, petroleum use, GHGs, and air pollutant emissions. In the cost and energy use and
emissions tables (Figures 7-8), both LDVs and HDVs are included, while LDV and HDV energy
use and emissions are presented separately in the graphs (Figures 9-12). The following figures
are shown as an example of the outputs generated; a user’s results will vary depending on the
specific inputs used.
Figure 7. Payback Outputs Sheet – Annual Costs Summary Table
Gasoline Diesel
Gasoline
HEV
Gasoline
PHEV
Gasoline
EREV EV Diesel HEV
Diesel
Hydraulic
Hybrid
(HHV)
Biodiesel
(B20)
Biodiesel
(B100)
Ethanol
(E85)
Propane
(LPG)
Compressed
Natural Gas
(CNG)
Liquefied
Natural Gas
(LNG)
LNG /
Diesel Pilot
Ignition
Acquisition CostLight-Duty (LD) Fleet $200,000 $280,000 $330,000 $350,000 $375,000 $200,000 $270,000
Heavy-Duty (HD) Fleet $1,000,000 $1,000,000 $1,650,000 $1,500,000 $1,900,000
Annual Operating CostLD Fuel Cost $16,533 $11,810 $10,357 $7,555 $5,109 $21,549 $10,804
LD Maintenance Cost $17,620 $17,046 $16,727 $16,727 $15,526 $17,620 $17,620
HD Fuel Cost $1,163,846 $1,196,538 $802,778 $831,838 $769,413
HD Diesel Exhaust Fluid Cost $18,308 $18,308 $0 $0 $18,308
HD Maintenance Cost $323,000 $323,000 $328,289 $328,289 $333,200
Incremental Acquisition CostCompared to Gasoline LD Fleet $80,000 $130,000 $150,000 $175,000 $0 $70,000
Compared to Diesel HD Fleet $0 $650,000 $500,000 $900,000
Annual Operating SavingsCompared to Gasoline LD Fleet $5,298 $7,069 $9,872 $13,518 -$5,016 $5,729
Compared to Diesel HD Fleet -$32,692 $374,087 $345,027 $384,233
Simple Payback (years)
Light-Duty Fleet 15.1 18.4 15.2 12.9 No payback 12.2
Heavy-Duty Fleet No payback 1.7 1.4 2.3

10
Figure 8. Payback Outputs Sheet – Annual Energy Use and Emissions Summary Table
Figure 9. Payback Outputs Sheet – Annual LDV Energy Use and GHGs Summary Graph
Gasoline Diesel
Gasoline
HEV
Gasoline
PHEV
Gasoline
EREV EV Diesel HEV Diesel HHV B20 B100 E85 LPG CNG LNG
LNG /
Diesel Pilot
Ignition
Annual Life-Cycle Petroleum Use (barrels)LD Petroleum Use 96.9 #N/A 69.2 56.6 25.7 1.2 #N/A #N/A 21.2 #N/A 0.5
HD Petroleum Use #N/A 7,268.1 #N/A #N/A #N/A 5,905.2 #N/A #N/A #N/A 38.5 88.3 416.4
Annual Life-Cycle Greenhouse Gas Emissions (short tons)LD GHG Emissions 56.0 #N/A 40.0 36.8 33.2 29.1 #N/A #N/A 41.5 #N/A 48.1
HD GHG Emissions #N/A 4,107.9 #N/A #N/A #N/A 3,484.6 #N/A #N/A #N/A 3,576.3 3,555.9 3,237.2
Vehicle Operation Air Pollutant Emissions (lb)Light-Duty Fleet
CO 752.0 #N/A 563.3 508.4 171.3 0.0 #N/A #N/A 468.9 #N/A 544.3
NOx 27.1 #N/A 17.4 15.7 5.3 0.0 #N/A #N/A 17.7 #N/A 22.6
PM10 7.3 #N/A 7.3 7.1 6.1 5.5 #N/A #N/A 7.3 #N/A 7.3
PM2.5 3.1 #N/A 3.1 2.9 1.9 1.4 #N/A #N/A 3.1 #N/A 3.1
VOC 32.1 #N/A 24.4 22.0 7.4 0.0 #N/A #N/A 29.4 #N/A 18.1
Heavy-Duty Fleet
CO #N/A 8,073.1 #N/A #N/A #N/A 8,073.1 #N/A #N/A #N/A 124,325.5 124,325.5 1,614.6
NOx #N/A 24,169.4 #N/A #N/A #N/A 24,169.4 #N/A #N/A #N/A 14,501.6 14,501.6 14,501.6
PM10 #N/A 476.3 #N/A #N/A #N/A 476.3 #N/A #N/A #N/A 476.3 476.3 476.3
PM2.5 #N/A 239.2 #N/A #N/A #N/A 239.2 #N/A #N/A #N/A 239.2 239.2 239.2
VOC #N/A 1,999.9 #N/A #N/A #N/A 1,999.9 #N/A #N/A #N/A 6,561.4 6,561.4 861.8
Gasoline Diesel Gasoline HEVGasoline
PHEVEV B20 B100 E85 LPG CNG
Petroleum Use 96.9 69.2 56.6 1.2 21.2 0.5
GHG Emissions 56.0 40.0 36.8 29.1 41.5 48.1
0.0
20.0
40.0
60.0
80.0
100.0
120.0
Pe
tro
leu
m U
se (
bar
rels
) o
r G
HG
s (s
ho
rt t
on
s)

11
Figure 10. Payback Outputs Sheet – Annual HDV Energy Use and GHGs Summary Graph
Figure 11. Payback Outputs Sheet – Annual LDV Air Pollutant Emissions Summary Graph
Gasoline Diesel EV Diesel HEV Diesel HHV B20 B100 E85 LPG CNG LNGLNG /
Diesel PilotIgnition
Petroleum Use 7,268.1 5,905.2 38.5 88.3 416.4
GHG Emissions 4,107.9 3,484.6 3,576.3 3,555.9 3,237.2
0.0
1,000.0
2,000.0
3,000.0
4,000.0
5,000.0
6,000.0
7,000.0
8,000.0
Pe
tro
leu
m U
se (
bar
rels
) o
r G
HG
s (s
ho
rt t
on
s)
Gasoline Diesel Gasoline HEV Gasoline PHEV EV B20 B100 E85 LPG CNG
CO 752.0 563.3 508.4 0.0 468.9 544.3
NOx 27.1 17.4 15.7 0.0 17.7 22.6
PM10 7.3 7.3 7.1 5.5 7.3 7.3
PM2.5 3.1 3.1 2.9 1.4 3.1 3.1
VOC 32.1 24.4 22.0 0.0 29.4 18.1
0.0
100.0
200.0
300.0
400.0
500.0
600.0
700.0
800.0
Air
Po
lluta
nt
Emis
sio
ns
(lb
)

12
Figure 12. Payback Outputs Sheet – Annual HDV Air Pollutant Emissions Summary Graph
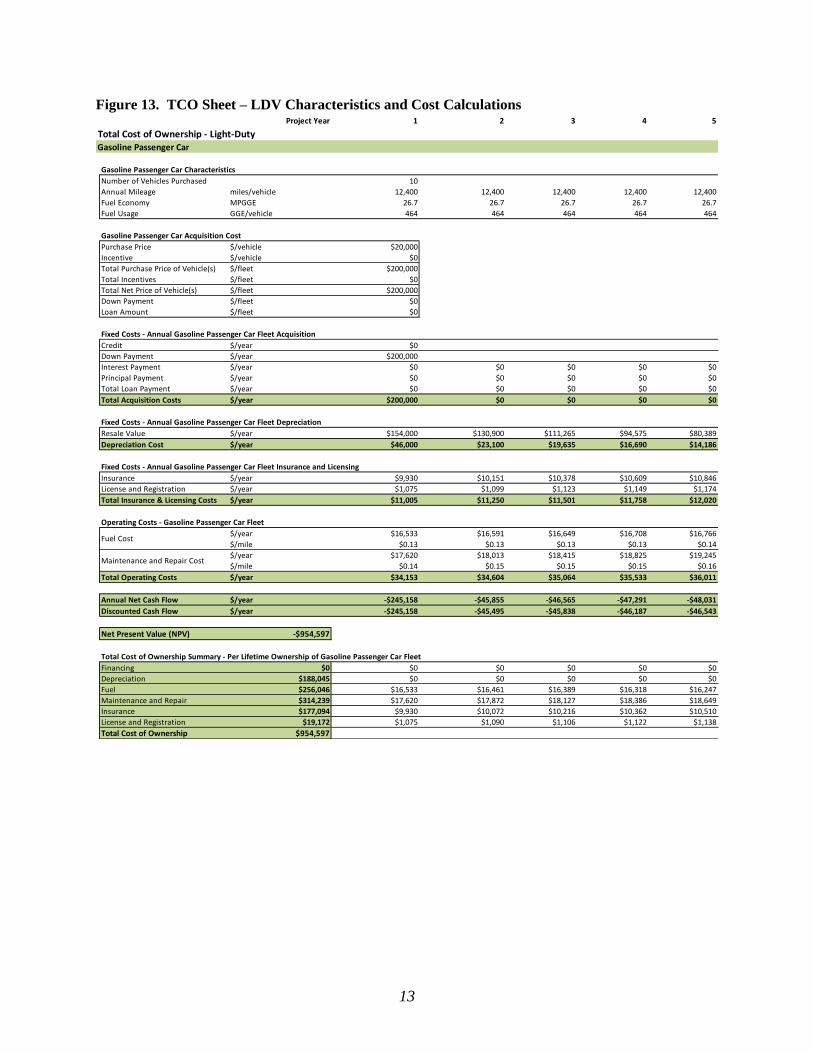
2.5 TCO Sheet
This sheet contains the Total Cost of Ownership Calculator, which evaluates the net
present value of operating and fixed costs over the years of planned ownership of a new vehicle,
as well as lifetime petroleum use, GHGs, and air pollutant emissions. There are no key user
inputs on the TCO sheet as all the data is based on user inputs from the Inputs and Payback
sheets. An advanced user may want to modify the mileage per year assumptions as typically
vehicles are driven more miles per year earlier in their life. The sheet includes both LDVs and
HDVs; the user can use the hyperlinks at the top of the page as this sheet is very long. The structure of the TCO calculations is to look at the operating and fixed costs on an
annual basis for every year of planned ownership of a new vehicle purchase (Figures 13 and 15,
several project year columns are not shown for clarity sake). This sheet has more detailed cost
calculations as compared to the Simple Payback Calculator. It includes the costs of financing a
loan, depreciation, insurance, license, and registration, in addition to the operating and
acquisition costs. Using assumptions of inflation for various costs and a discount rate, a user can
calculate the net present value of a vehicle purchase. In addition, lifetime petroleum use, GHGs,
and air pollutant emissions are also calculated (Figures 14 and 16). The difference in these
calculations as compared to those on the Payback sheet is that these look at the actual air
pollutant deterioration rate of a vehicle as it ages instead of using a deterioration rate for an
average vehicle’s midpoint lifetime.
Gasoline Diesel EV Diesel HEV Diesel HHV B20 B100 E85 LPG CNG LNGLNG / Diesel
PilotIgnition
CO 8,073.1 8,073.1 124,325.5 124,325.5 1,614.6
NOx 24,169.4 24,169.4 14,501.6 14,501.6 14,501.6
PM10 476.3 476.3 476.3 476.3 476.3
PM2.5 239.2 239.2 239.2 239.2 239.2
VOC 1,999.9 1,999.9 6,561.4 6,561.4 861.8
0.0
20,000.0
40,000.0
60,000.0
80,000.0
100,000.0
120,000.0
140,000.0
Air
Po
lluta
nt
Emis
sio
ns
(lb
)
13
Figure 13. TCO Sheet – LDV Characteristics and Cost Calculations
Project Year 1 2 3 4 5
Total Cost of Ownership - Light-DutyGasoline Passenger Car Gasoline Gasoline Gasoline
Gasoline Passenger Car Characteristics
Number of Vehicles Purchased 10
Annual Mileage miles/vehicle 12,400 12,400 12,400 12,400 12,400
Fuel Economy MPGGE 26.7 26.7 26.7 26.7 26.7
Fuel Usage GGE/vehicle 464 464 464 464 464
Gasoline Passenger Car Acquisition Cost
Purchase Price $/vehicle $20,000
Incentive $/vehicle $0
Total Purchase Price of Vehicle(s) $/fleet $200,000
Total Incentives $/fleet $0
Total Net Price of Vehicle(s) $/fleet $200,000
Down Payment $/fleet $0
Loan Amount $/fleet $0
Fixed Costs - Annual Gasoline Passenger Car Fleet Acquisition
Credit $/year $0
Down Payment $/year $200,000
Interest Payment $/year $0 $0 $0 $0 $0
Principal Payment $/year $0 $0 $0 $0 $0
Total Loan Payment $/year $0 $0 $0 $0 $0
Total Acquisition Costs $/year $200,000 $0 $0 $0 $0
Fixed Costs - Annual Gasoline Passenger Car Fleet Depreciation
Resale Value $/year $154,000 $130,900 $111,265 $94,575 $80,389
Depreciation Cost $/year $46,000 $23,100 $19,635 $16,690 $14,186
Fixed Costs - Annual Gasoline Passenger Car Fleet Insurance and Licensing
Insurance $/year $9,930 $10,151 $10,378 $10,609 $10,846
License and Registration $/year $1,075 $1,099 $1,123 $1,149 $1,174
Total Insurance & Licensing Costs $/year $11,005 $11,250 $11,501 $11,758 $12,020
Operating Costs - Gasoline Passenger Car Fleet
$/year $16,533 $16,591 $16,649 $16,708 $16,766
$/mile $0.13 $0.13 $0.13 $0.13 $0.14
$/year $17,620 $18,013 $18,415 $18,825 $19,245
$/mile $0.14 $0.15 $0.15 $0.15 $0.16
Total Operating Costs $/year $34,153 $34,604 $35,064 $35,533 $36,011
Annual Net Cash Flow $/year -$245,158 -$45,855 -$46,565 -$47,291 -$48,031
Discounted Cash Flow $/year -$245,158 -$45,495 -$45,838 -$46,187 -$46,543
Net Present Value (NPV) -$954,597
Total Cost of Ownership Summary - Per Lifetime Ownership of Gasoline Passenger Car Fleet
Financing $0 $0 $0 $0 $0 $0
Depreciation $188,045 $0 $0 $0 $0 $0
Fuel $256,046 $16,533 $16,461 $16,389 $16,318 $16,247
Maintenance and Repair $314,239 $17,620 $17,872 $18,127 $18,386 $18,649
Insurance $177,094 $9,930 $10,072 $10,216 $10,362 $10,510
License and Registration $19,172 $1,075 $1,090 $1,106 $1,122 $1,138
Total Cost of Ownership $954,597
Maintenance and Repair Cost
Fuel Cost

14
Figure 14. TCO Sheet – LDV Energy Use and Emissions Calculations
Project Year 1 2 3 4 5
Total Cost of Ownership - Light-DutyGasoline Passenger Car Gasoline Gasoline Gasoline
Annual Gasoline Passenger Car Fleet Life-Cycle Petroleum Use, Life-Cycle Greenhouse Gas Emissions, and Vehicle Operation Air Pollutant Emissions
Petroleum Use barrels/year 96.9 96.9 96.9 96.9 96.9
GHG short ton/year 56.0 56.0 56.0 56.0 56.0
CO lb/year 423.9 413.4 415.3 746.8 752.0
NOx lb/year 17.8 16.8 16.9 26.8 27.1
PM10 lb/year 1.4 1.4 1.4 1.8 1.8
PM10 (TBW) lb/year 5.5 5.5 5.5 5.5 5.5
PM2.5 lb/year 1.3 1.4 1.4 1.7 1.7
PM2.5 (TBW) lb/year 1.4 1.4 1.4 1.4 1.4
VOC lb/year 14.5 14.6 14.9 23.4 23.9
VOC (Evap) lb/year 8.2 8.2 8.2 8.2 8.2
Total Petroleum Use, GHG Emissions, and Vehicle Operation Emissions - Per Lifetime Ownership of Gasoline Passenger Car Fleet
Petroleum Use barrels 1,550
GHG short tons 895
CO pounds 15,705
NOx pounds 635
PM10 pounds 132
PM2.5 pounds 65
VOC pounds 774

15
Figure 15. TCO Sheet – HDV Characteristics and Cost Calculations
Project Year 1 2 3 4 5
Total Cost of Ownership - Heavy DutyDiesel Combination Long-Haul Truck Diesel Diesel Diesel
Diesel Combination Long-Haul Truck Characteristics
Number of Vehicles Purchased 10
Annual Mileage miles/vehicle 170,000 170,000 170,000 170,000 170,000
Fuel Economy MPGGE 5.2 5.2 5.2 5.2 5.2
Fuel Usage GGE/vehicle 32,692 32,692 32,692 32,692 32,692
Diesel Combination Long-Haul Truck Acquisition Cost
Purchase Price $/vehicle $100,000
Incentive $/vehicle $0
Total Purchase Price of Vehicle(s) $/fleet $1,000,000
Total Incentives $/fleet $0
Total Net Price of Vehicle(s) $/fleet $1,000,000
Down Payment $/fleet $0
Loan Amount $/fleet $0
Fixed Costs - Annual Diesel Combination Long-Haul Truck Fleet Acquisition
Credit $/year $0
Down Payment $/year $1,000,000
Interest Payment $/year $0 $0 $0 $0 $0
Principal Payment $/year $0 $0 $0 $0 $0
Total Loan Payment $/year $0 $0 $0 $0 $0
Total Acquisition Costs $/year $1,000,000 $0 $0 $0 $0
Fixed Costs - Annual Diesel Combination Long-Haul Truck Fleet Depreciation
Resale Value $/year $770,000 $654,500 $556,325 $472,876 $401,945
Depreciation Cost $/year $230,000 $115,500 $98,175 $83,449 $70,931
Fixed Costs - Annual Diesel Combination Long-Haul Truck Fleet Insurance and Licensing
Insurance $/year $51,270 $52,413 $53,582 $54,777 $55,999
License and Registration $/year $5,400 $5,520 $5,644 $5,769 $5,898
Total Insurance & Licensing Costs $/year $56,670 $57,934 $59,226 $60,546 $61,897
Operating Costs - Diesel Combination Long-Haul Truck Fleet
$/year $1,163,846 $1,174,204 $1,184,655 $1,195,198 $1,205,835
$/mile $0.68 $0.69 $0.70 $0.70 $0.71
$/year $18,308 $18,465 $18,624 $18,784 $18,946
$/mile $0.01 $0.01 $0.01 $0.01 $0.01
$/year $323,000 $330,203 $337,566 $345,094 $352,790
$/mile $0.19 $0.19 $0.20 $0.20 $0.21
Total Operating Costs $/year $1,505,154 $1,522,872 $1,540,845 $1,559,076 $1,577,571
Annual Net Cash Flow $/year -$2,561,824 -$1,580,806 -$1,600,071 -$1,619,623 -$1,639,467
Discounted Cash Flow $/year -$2,561,824 -$1,568,416 -$1,575,086 -$1,581,836 -$1,588,668
Net Present Value (NPV) -$16,758,395
Total Cost of Ownership Summary - Per Lifetime Ownership of Diesel Combination Long-Haul Truck Fleet
Financing $0 $0 $0 $0 $0 $0
Depreciation $833,849 $0 $0 $0 $0 $0
Fuel $11,690,562 $1,163,846 $1,165,001 $1,166,157 $1,167,314 $1,168,472
Diesel Exhaust Fluid $183,650 $18,308 $18,320 $18,333 $18,346 $18,359
Maintenance and Repair $3,445,776 $323,000 $327,615 $332,295 $337,043 $341,858
Insurance $546,950 $51,270 $52,003 $52,745 $53,499 $54,263
License and Registration $57,607 $5,400 $5,477 $5,555 $5,635 $5,715
Total Cost of Ownership $16,758,395
Fuel Cost
Maintenance and Repair Cost
Diesel Exhaust Fluid Cost

16
Figure 16. TCO Sheet – HDV Energy Use and Emissions Calculations
2.6 TCO Outputs Sheet
This sheet summarizes the outputs of the Total Cost of Ownership Calculator with tables
and graphs for costs, petroleum use, GHGs, and air pollutant emissions. In the cost and energy
use and emissions tables (Figures 17-18), both LDVs and HDVs are included, while LDVs and
HDVs are presented separately in the graphs (Figures 19-28). This sheet has additional cost
graphs as compared to the Payback Outputs sheet. Specically, the cumulative cost of ownership
compared to a conventional counterpart (Figures 19-20) show similar results to a simple
payback. The payback period is equal to the year when the line for each AFV crosses the x-axis.
Figures 21-22 show the cumulative cash flow for both AFVs and conventional vehicles. Finally,
Figures 23-24 show the total cost of ownership broken down into the major cost categories:
financing, depreciation, fuel, maintenance and repair, insurance, and license and registration. The
following figures are shown as an example of the outputs generated; a user’s results will vary
depending on the specific inputs used.
Figure 17. TCO Outputs Sheet – Lifetime Costs Summary Table
Project Year 1 2 3 4 5
Total Cost of Ownership - Heavy DutyDiesel Combination Long-Haul Truck Diesel Diesel Diesel
Annual Diesel Combination Long-Haul Truck Fleet Life-Cycle Petroleum Use, Life-Cycle Greenhouse Gas Emissions, and Vehicle Operation Air Pollutant Emissions
Petroleum Use barrels/year 7,268.1 7,268.1 7,268.1 7,268.1 7,268.1
GHG short ton/year 4,107.9 4,107.9 4,107.9 4,107.9 4,107.9
CO lb/year 7,712.9 7,723.4 7,740.4 8,044.8 8,073.1
NOx lb/year 21,195.5 21,196.8 21,198.9 24,166.0 24,169.4
PM10 lb/year 115.8 115.8 115.8 165.2 165.2
PM10 (TBW) lb/year 311.1 311.1 311.1 311.1 311.1
PM2.5 lb/year 112.5 112.5 112.5 160.5 160.5
PM2.5 (TBW) lb/year 78.7 78.7 78.7 78.7 78.7
VOC lb/year 1,970.0 1,970.2 1,970.6 1,999.2 1,999.9
VOC (Evap) lb/year 0.0 0.0 0.0 0.0 0.0
Total Petroleum Use, GHG Emissions, and Vehicle Operation Emissions - Per Lifetime Ownership of Diesel Combination Long-Haul Truck Fleet
Petroleum Use barrels 72,681
GHG short tons 41,079
CO pounds 80,233
NOx pounds 233,004
PM10 pounds 4,616
PM2.5 pounds 2,250
VOC pounds 19,924
Gasoline Diesel
Gasoline
HEV
Gasoline
PHEV
Gasoline
EREV EV Diesel HEV
Diesel
Hydraulic
Hybrid
(HHV)
Biodiesel
(B20)
Biodiesel
(B100)
Ethanol
(E85)
Propane
(LPG)
Compressed
Natural Gas
(CNG)
Liquefied
Natural Gas
(LNG)
LNG /
Diesel Pilot
Ignition
Light-Duty Passenger Car Fleet
Financing $0 #N/A $0 $0 $0 $0 #N/A #N/A $0 #N/A $0
Depreciation $188,045 #N/A $263,263 $310,275 $329,079 $352,585 #N/A #N/A $188,045 #N/A $253,861
Fuel $256,046 #N/A $182,890 $159,959 $115,014 $76,048 #N/A #N/A $332,985 #N/A $173,765
Maintenance and Repair $314,239 #N/A $304,006 $298,311 $298,311 $276,889 #N/A #N/A $314,239 #N/A $314,239
Insurance $177,094 #N/A $177,094 $177,094 $177,094 $177,094 #N/A #N/A $177,094 #N/A $177,094
License and Registration $19,172 #N/A $19,172 $19,172 $19,172 $19,172 #N/A #N/A $19,172 #N/A $19,172
Total Cost of Ownership $954,597 #N/A $946,426 $964,811 $938,671 $901,787 #N/A #N/A $1,031,536 #N/A $938,132
Heavy-Duty Combination Long-Haul Truck Fleet
Financing #N/A $0 #N/A #N/A #N/A $0 #N/A #N/A #N/A $0 $0 $0
Depreciation #N/A $833,849 #N/A #N/A #N/A $833,849 #N/A #N/A #N/A $1,375,850 $1,250,773 $1,584,312
Fuel #N/A $11,690,562 #N/A #N/A #N/A $12,018,948 #N/A #N/A #N/A $8,052,914 $8,052,914 $7,719,009
Diesel Exhaust Fluid #N/A $183,650 #N/A #N/A #N/A $183,650 #N/A #N/A #N/A $0 $0 $174,468
Maintenance and Repair #N/A $3,445,776 #N/A #N/A #N/A $3,445,776 #N/A #N/A #N/A $3,502,199 $3,502,199 $3,554,590
Insurance #N/A $546,950 #N/A #N/A #N/A $546,950 #N/A #N/A #N/A $546,950 $546,950 $546,950
License and Registration #N/A $57,607 #N/A #N/A #N/A $57,607 #N/A #N/A #N/A $57,607 $57,607 $57,607
Total Cost of Ownership #N/A $16,758,395 #N/A #N/A #N/A $17,086,781 #N/A #N/A #N/A $13,535,520 $13,410,443 $13,636,937

17
Figure 18. TCO Outputs Sheet – Lifetime Energy Use and Emissions Summary Table
Figure 19. TCO Outputs Sheet – LDV Cumulative Cash Flow Compared to Gasoline Summary
Graph
Gasoline Diesel
Gasoline
HEV
Gasoline
PHEV
Gasoline
EREV EV Diesel HEV Diesel HHV B20 B100 E85 LPG CNG LNG
LNG /
Diesel Pilot
Ignition
Lifetime Life-Cycle Petroleum Use (barrels)
LD Petroleum Use 1,550 #N/A 1,107 905 411 18 #N/A #N/A 339 #N/A 8
HD Petroleum Use #N/A 72,681 #N/A #N/A #N/A 59,052 #N/A #N/A #N/A 385 883 4,164
Lifetime Life-Cycle Greenhouse Gas Emissions (short tons)
LD GHG Emissions 895 #N/A 640 588 531 466 #N/A #N/A 664 #N/A 770
HD GHG Emissions #N/A 41,079 #N/A #N/A #N/A 34,846 #N/A #N/A #N/A 35,763 35,559 32,372
Lifetime Vehicle Operation Air Pollutant Emissions (lb)
Light-Duty Passenger Car Fleet
CO 15,705 #N/A 11,765 10,617 3,578 0 #N/A #N/A 9,793 #N/A 11,366
NOx 635 #N/A 409 369 124 0 #N/A #N/A 415 #N/A 531
PM10 132 #N/A 132 128 102 88 #N/A #N/A 132 #N/A 132
PM2.5 65 #N/A 65 61 35 22 #N/A #N/A 65 #N/A 65
VOC 774 #N/A 566 511 172 0 #N/A #N/A 715 #N/A 442
Heavy-Duty Combination Long-Haul Truck Fleet
CO #N/A 80,233 #N/A #N/A #N/A 80,233 #N/A #N/A #N/A 1,235,595 1,235,595 16,047
NOx #N/A 233,004 #N/A #N/A #N/A 233,004 #N/A #N/A #N/A 139,802 139,802 139,802
PM10 #N/A 4,616 #N/A #N/A #N/A 4,616 #N/A #N/A #N/A 4,616 4,616 4,616
PM2.5 #N/A 2,250 #N/A #N/A #N/A 2,250 #N/A #N/A #N/A 2,250 2,250 2,250
VOC #N/A 19,924 #N/A #N/A #N/A 19,924 #N/A #N/A #N/A 65,370 65,370 8,588
-$200,000
-$150,000
-$100,000
-$50,000
$0
$50,000
$100,000
1 2 3 4 5 6 7 8 9 10 11 12 13 14 15 16 17 18 19 20Cu
mu
lati
ve C
ash
Flo
w
Project Year
Diesel
Gasoline HEV
Gasoline PHEV
Gasoline EREV
EV
B20
B100
E85
LPG
CNG

18
Figure 20. TCO Outputs Sheet – HDV Cumulative Cash Flow Compared to Diesel Summary
Graph
Figure 21. TCO Outputs Sheet – LDV Cumulative Cash Flow Summary Graph
-$1,000,000
-$500,000
$0
$500,000
$1,000,000
$1,500,000
$2,000,000
$2,500,000
$3,000,000
$3,500,000
$4,000,000
1 2 3 4 5 6 7 8 9 10 11 12 13 14 15 16 17 18 19 20
Cu
mu
lati
ve C
ash
Flo
w
Project Year
Gasoline
EV
Diesel HEV
Diesel HHV
B20
B100
E85
LPG
CNG
LNG
LNG/Diesel Pilot Ignition
$0
$200,000
$400,000
$600,000
$800,000
$1,000,000
$1,200,000
1 2 3 4 5 6 7 8 9 10 11 12 13 14 15 16 17 18 19 20
Cu
mu
lati
ve C
ash
Flo
w
Project Year
Gasoline
Diesel
Gasoline HEV
Gasoline PHEV
Gasoline EREV
EV
B20
B100
E85
LPG
CNG

19
Figure 22. TCO Outputs Sheet – HDV Cumulative Cash Flow Summary Graph
Figure 23. TCO Outputs Sheet – LDV Total Cost of Ownership Summary Graph
$0
$2,000,000
$4,000,000
$6,000,000
$8,000,000
$10,000,000
$12,000,000
$14,000,000
$16,000,000
$18,000,000
1 2 3 4 5 6 7 8 9 10 11 12 13 14 15 16 17 18 19 20
Cu
mu
lati
ve C
ash
Flo
w
Project Year
Gasoline
Diesel
EV
Diesel HEV
Diesel HHV
B20
B100
E85
LPG
CNG
LNG
LNG/Diesel Pilot Ignition
Gasoline DieselGasoline
HEVGasoline
PHEVGasoline
EREVEV B20 B100 E85 LPG CNG
License and Registration $19,172 $19,172 $19,172 $19,172 $19,172 $19,172 $19,172
Insurance $177,094 $177,094 $177,094 $177,094 $177,094 $177,094 $177,094
Maintenance and Repair $314,239 $304,006 $298,311 $298,311 $276,889 $314,239 $314,239
Fuel $256,046 $182,890 $159,959 $115,014 $76,048 $332,985 $173,765
Depreciation $188,045 $263,263 $310,275 $329,079 $352,585 $188,045 $253,861
Financing $0 $0 $0 $0 $0 $0 $0
$0
$200,000
$400,000
$600,000
$800,000
$1,000,000
$1,200,000
Tota
l Co
st o
f O
wn
ersh
ip

20
Figure 24. TCO Outputs Sheet – HDV Total Cost of Ownership Summary Graph
Figure 25. TCO Outputs Sheet – Lifetime LDV Energy Use and GHGs Summary Graph
Gasoline Diesel EV Diesel HEV Diesel HHV B20 B100 E85 LPG CNG LNGLNG /
Diesel PilotIgnition
License and Registration $57,607 $57,607 $57,607 $57,607 $57,607
Insurance $546,950 $546,950 $546,950 $546,950 $546,950
Maintenance and Repair $3,445,776 $3,445,776 $3,502,199 $3,502,199 $3,554,590
Diesel Exhaust Fluid $183,650 $183,650 $0 $0 $174,468
Fuel $11,690,562 $12,018,948 $8,052,914 $8,052,914 $7,719,009
Depreciation $833,849 $833,849 $1,375,850 $1,250,773 $1,584,312
Financing $0 $0 $0 $0 $0
$0
$2,000,000
$4,000,000
$6,000,000
$8,000,000
$10,000,000
$12,000,000
$14,000,000
$16,000,000
$18,000,000
Tota
l Co
st o
f O
wn
ersh
ip
Gasoline Diesel Gasoline HEVGasoline
PHEVGasoline
EREVEV B20 B100 E85 LPG CNG
Petroleum Use 1,550 1,107 905 411 18 339 8
GHG Emissions 895 640 588 531 466 664 770
0
200
400
600
800
1,000
1,200
1,400
1,600
1,800
GH
Gs
(sh
ort
to
ns)
or
Pe
tro
leu
m U
se (
bar
rels
)

21
Figure 26. TCO Outputs Sheet – Lifetime HDV Energy Use and GHGs Summary Graph
Figure 27. TCO Outputs Sheet – Lifetime LDV Air Pollutant Emissions Summary Graph
Gasoline Diesel EV Diesel HEV Diesel HHV B20 B100 E85 LPG CNG LNGLNG /
Diesel PilotIgnition
Petroleum Use 72,681 59,052 385 883 4,164
GHG Emissions 41,079 34,846 35,763 35,559 32,372
0
10,000
20,000
30,000
40,000
50,000
60,000
70,000
80,000
GH
Gs
(sh
ort
to
ns)
or
Pe
tro
leu
m U
se (
bar
rels
)
Gasoline Diesel Gasoline HEVGasoline
PHEVGasoline
EREVEV B20 B100 E85 LPG CNG
CO 15,705.0 11,765.1 10,616.7 3,577.8 0.0 9,793.4 11,366.5
NOx 634.7 408.8 368.9 124.3 0.0 415.3 530.6
PM10 132.1 132.1 127.8 101.6 88.3 132.1 132.1
PM2.5 64.8 64.8 60.7 35.0 22.0 64.8 64.8
VOC 773.6 566.3 511.0 172.2 0.0 715.5 442.4
0.0
2,000.0
4,000.0
6,000.0
8,000.0
10,000.0
12,000.0
14,000.0
16,000.0
18,000.0
Air
Po
lluta
nt
Emis
sio
ns
(lb
)

22
Figure 28. TCO Outputs Sheet – Lifetime HDV Air Pollutant Emissions Summary Graph
2.7 Footprint Sheet
This sheet contains the Fleet Energy and Emissions Footprint Calculator, which estimates
the annual petroleum use, GHGs, and air pollutant emissions of existing and new vehicles, taking
into consideration that older vehicles typically have higher air pollutant emission rates than
newer ones. The key inputs (Figure 29) for this sheet are:
vehicle type
model year
annual vehicle mileage
fuel use.
The user can change the vehicle types via dropdown box. The user then must enter a
model year between 1980 and 2015, vehicle mileage, and fuel use to estimate its energy use and
emissions (Figure 30) of existing fleet vehicles and vehicles planned to be purchased. If one
would like to examine more vehicles, the user can copy and paste the entire row(s) with
calculations (rows 6-35 in AFLEET Tool 2013) below the existing rows.
Gasoline Diesel EV Diesel HEV Diesel HHV B20 B100 E85 LPG CNG LNGLNG / Diesel
PilotIgnition
CO 80,233.5 80,233.5 1,235,595. 1,235,595. 16,046.7
NOx 233,004.1 233,004.1 139,802.4 139,802.4 139,802.4
PM10 4,616.2 4,616.2 4,616.2 4,616.2 4,616.2
PM2.5 2,249.7 2,249.7 2,249.7 2,249.7 2,249.7
VOC 19,923.6 19,923.6 65,370.2 65,370.2 8,587.9
0.0
200,000.0
400,000.0
600,000.0
800,000.0
1,000,000.0
1,200,000.0
1,400,000.0
Air
Po
lluta
nt
Emis
sio
ns
(lb
)

23
Figure 29. Footprint Sheet - Inputs
Figure 30. Footprint Sheet - Energy Use and Emissions Calculations
Gasoline
(gal)
Diesel
(gal)
Gasoline HEV
(gal)
Gasoline
PHEV (gal)
Gasoline
PHEV (kWh)
Gasoline
EREV (gal)
Gasoline
EREV (kWh)
Electricit
y (kWh)
Diesel
HEV (gal)
Diesel
HHV (gal) B20 (gal)
B100
(gal) E85 (gal) LPG (gal)
CNG
(GGE) LNG (gal)
LNG /
Diesel
(LNG gal)
LNG /
Diesel
(diesel
gal)
Passenger Car 1998 40,000 1,600
Passenger Car 2013 40,000 1,100
Passenger Car
Passenger Truck 1995 60,000 4,000
Passenger Truck 2013 60,000 3,000
Passenger Truck
Light Commercial Truck
Light Commercial Truck
Light Commercial Truck
School Bus 1997 100,000 12,000
School Bus 2013 100,000 20,000
School Bus
Transit Bus
Transit Bus
Transit Bus
Refuse Truck
Refuse Truck
Refuse Truck
Single Unit Short-Haul Truck
Single Unit Short-Haul Truck
Single Unit Short-Haul Truck
Single Unit Long-Haul Truck
Single Unit Long-Haul Truck
Single Unit Long-Haul Truck
Combination Short-Haul Truck
Combination Short-Haul Truck
Combination Short-Haul Truck
Combination Long-Haul Truck
Combination Long-Haul Truck
Combination Long-Haul Truck
Vehicle Type
Model
Year
Annual
Vehicle
Mileage
Fuel Use
CO NOx PM10
PM10
(TBW) PM2.5
PM2.5
(TBW) VOC
VOC
(Evap)
Passenger Car 33.4 19.3 725.2 123.2 1.7 1.8 1.5 0.4 63.5 10.1
Passenger Car 22.9 13.3 102.6 3.7 0.4 1.8 0.4 0.4 3.1 2.6
Passenger Car 0.0 0.0 0.0 0.0 0.0 0.0 0.0 0.0 0.0 0.0
Passenger Truck 83.4 48.2 4,404.8 672.6 6.9 3.7 6.3 0.9 470.6 209.7
Passenger Truck 62.6 36.2 340.7 26.7 1.0 3.7 0.9 0.9 9.0 4.5
Passenger Truck 0.0 0.0 0.0 0.0 0.0 0.0 0.0 0.0 0.0 0.0
Light Commercial Truck 0.0 0.0 0.0 0.0 0.0 0.0 0.0 0.0 0.0 0.0
Light Commercial Truck 0.0 0.0 0.0 0.0 0.0 0.0 0.0 0.0 0.0 0.0
Light Commercial Truck 0.0 0.0 0.0 0.0 0.0 0.0 0.0 0.0 0.0 0.0
School Bus 307.9 174.0 1,488.8 3,150.6 174.8 18.5 169.5 4.9 245.8 0.0
School Bus 106.7 161.8 16,703.7 499.0 3.1 11.5 2.8 2.9 314.9 12.9
School Bus 0.0 0.0 0.0 0.0 0.0 0.0 0.0 0.0 0.0 0.0
Transit Bus 0.0 0.0 0.0 0.0 0.0 0.0 0.0 0.0 0.0 0.0
Transit Bus 0.0 0.0 0.0 0.0 0.0 0.0 0.0 0.0 0.0 0.0
Transit Bus 0.0 0.0 0.0 0.0 0.0 0.0 0.0 0.0 0.0 0.0
Refuse Truck 0.0 0.0 0.0 0.0 0.0 0.0 0.0 0.0 0.0 0.0
Refuse Truck 0.0 0.0 0.0 0.0 0.0 0.0 0.0 0.0 0.0 0.0
Refuse Truck 0.0 0.0 0.0 0.0 0.0 0.0 0.0 0.0 0.0 0.0
Single Unit Short-Haul Truck 0.0 0.0 0.0 0.0 0.0 0.0 0.0 0.0 0.0 0.0
Single Unit Short-Haul Truck 0.0 0.0 0.0 0.0 0.0 0.0 0.0 0.0 0.0 0.0
Single Unit Short-Haul Truck 0.0 0.0 0.0 0.0 0.0 0.0 0.0 0.0 0.0 0.0
Single Unit Long-Haul Truck 0.0 0.0 0.0 0.0 0.0 0.0 0.0 0.0 0.0 0.0
Single Unit Long-Haul Truck 0.0 0.0 0.0 0.0 0.0 0.0 0.0 0.0 0.0 0.0
Single Unit Long-Haul Truck 0.0 0.0 0.0 0.0 0.0 0.0 0.0 0.0 0.0 0.0
Combination Short-Haul Truck 0.0 0.0 0.0 0.0 0.0 0.0 0.0 0.0 0.0 0.0
Combination Short-Haul Truck 0.0 0.0 0.0 0.0 0.0 0.0 0.0 0.0 0.0 0.0
Combination Short-Haul Truck 0.0 0.0 0.0 0.0 0.0 0.0 0.0 0.0 0.0 0.0
Combination Long-Haul Truck 0.0 0.0 0.0 0.0 0.0 0.0 0.0 0.0 0.0 0.0
Combination Long-Haul Truck 0.0 0.0 0.0 0.0 0.0 0.0 0.0 0.0 0.0 0.0
Combination Long-Haul Truck 0.0 0.0 0.0 0.0 0.0 0.0 0.0 0.0 0.0 0.0
GHG
(short
tons)
Vehicle Operation Air Pollutant Emissions (lb)
Vehicle Type
Petroleum
Use (barrels)
24
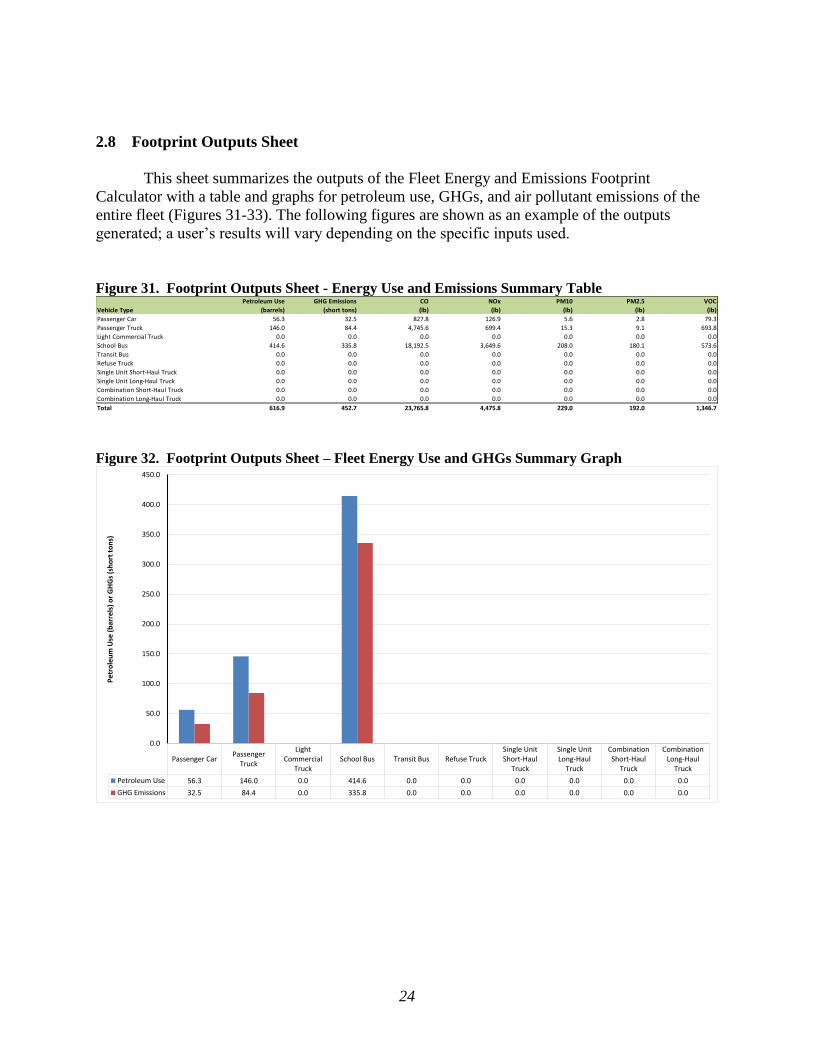
2.8 Footprint Outputs Sheet
This sheet summarizes the outputs of the Fleet Energy and Emissions Footprint
Calculator with a table and graphs for petroleum use, GHGs, and air pollutant emissions of the
entire fleet (Figures 31-33). The following figures are shown as an example of the outputs
generated; a user’s results will vary depending on the specific inputs used.
Figure 31. Footprint Outputs Sheet - Energy Use and Emissions Summary Table
Figure 32. Footprint Outputs Sheet – Fleet Energy Use and GHGs Summary Graph
Petroleum Use GHG Emissions CO NOx PM10 PM2.5 VOC
Vehicle Type (barrels) (short tons) (lb) (lb) (lb) (lb) (lb)
Passenger Car 56.3 32.5 827.8 126.9 5.6 2.8 79.3
Passenger Truck 146.0 84.4 4,745.6 699.4 15.3 9.1 693.8
Light Commercial Truck 0.0 0.0 0.0 0.0 0.0 0.0 0.0
School Bus 414.6 335.8 18,192.5 3,649.6 208.0 180.1 573.6
Transit Bus 0.0 0.0 0.0 0.0 0.0 0.0 0.0
Refuse Truck 0.0 0.0 0.0 0.0 0.0 0.0 0.0
Single Unit Short-Haul Truck 0.0 0.0 0.0 0.0 0.0 0.0 0.0
Single Unit Long-Haul Truck 0.0 0.0 0.0 0.0 0.0 0.0 0.0
Combination Short-Haul Truck 0.0 0.0 0.0 0.0 0.0 0.0 0.0
Combination Long-Haul Truck 0.0 0.0 0.0 0.0 0.0 0.0 0.0
Total 616.9 452.7 23,765.8 4,475.8 229.0 192.0 1,346.7
Passenger CarPassenger
Truck
LightCommercial
TruckSchool Bus Transit Bus Refuse Truck
Single UnitShort-Haul
Truck
Single UnitLong-Haul
Truck
CombinationShort-Haul
Truck
CombinationLong-Haul
Truck
Petroleum Use 56.3 146.0 0.0 414.6 0.0 0.0 0.0 0.0 0.0 0.0
GHG Emissions 32.5 84.4 0.0 335.8 0.0 0.0 0.0 0.0 0.0 0.0
0.0
50.0
100.0
150.0
200.0
250.0
300.0
350.0
400.0
450.0
Pe
tro
leu
m U
se (
bar
rels
) o
r G
HG
s (s
ho
rt t
on
s)

25
Figure 33. Footprint Outputs Sheet - Fleet Air Pollutant Emissions Summary Graph
2.9 Background Data Sheet
This sheet contains the background data for the Simple Payback, Total Cost of
Ownership, and Fleet Energy and Emissions Footprint calculators. The user can navigate this
sheet and jump to various sections by using the hyperlinks at the top of the page. As previously
mentioned, a user can change the default vocation type using the dropdown boxes in this sheet
(Figure 34). This will alter the lookup tables, which AFLEET Tool references for the default data
of key inputs in the various sheets. Figure 35 shows an example of one look up table. Also
mentioned previously, the user can input custom electricity mixes on this sheet (Figure 36). The
Background Data sheet includes the source of assumptions and data for each input. Sometimes
the sources are included in a comment for a specific cell. To view these comments, place the
mouse cursor over a cell with a red triangle in its top left corner.
Figure 34. Background Data Sheet - AFLEET Look Up Tables - Vehicle Vocation Selection
Passenger CarPassenger
Truck
LightCommercial
TruckSchool Bus Transit Bus Refuse Truck
Single UnitShort-Haul
Truck
Single UnitLong-Haul
Truck
CombinationShort-Haul
Truck
CombinationLong-Haul
Truck
CO 827.8 4,745.6 0.0 18,192.5 0.0 0.0 0.0 0.0 0.0 0.0
NOx 126.9 699.4 0.0 3,649.6 0.0 0.0 0.0 0.0 0.0 0.0
PM10 5.6 15.3 0.0 208.0 0.0 0.0 0.0 0.0 0.0 0.0
PM2.5 2.8 9.1 0.0 180.1 0.0 0.0 0.0 0.0 0.0 0.0
VOC 79.3 693.8 0.0 573.6 0.0 0.0 0.0 0.0 0.0 0.0
0.0
2,000.0
4,000.0
6,000.0
8,000.0
10,000.0
12,000.0
14,000.0
16,000.0
18,000.0
20,000.0
Air
Po
lluta
nt
Emis
sio
ns
(lb
)
Passenger Car Car
Passenger Truck Light-Duty Pickup Truck
Light Commercial Truck Medium-Duty Pickup Truck
School Bus School Bus
Transit Bus Transit Bus
Refuse Truck Refuse Truck
Single Unit Short-Haul Truck Delivery Step Van
Single Unit Long-Haul Truck Delivery Straight Truck
Combination Short-Haul Truck Regional Haul Freight Truck
Combination Long-Haul Truck Long Haul Freight Truck

26
Figure 35. Background Data Sheet - AFLEET Look Up Tables - New Vehicle Purchase Price
Figure 36. Background Data Sheet – GREET Fleet Specifications – Electricity Mix
Vocation Type MOVES Category Gasoline Diesel
Gasoline
HEV
Gasoline
PHEV
Gasoline
EREV EV Diesel HEV
Diesel
Hydraulic
Hybrid
Biodiesel
(B20)
Biodiesel
(B100)
Ethanol
(E85)
Propane
(LPG)
Compressed
Natural Gas
(CNG)
Liquefied
Natural
Gas (LNG)
LNG /
Diesel
Pilot
Ignition
Long Haul Freight Truck Combination Long-Haul Truck $100,000 $140,000 $100,000 $100,000 $165,000 $150,000 $190,000
Regional Haul Freight Truck Combination Short-Haul Truck $90,000 $137,500 $90,000 $90,000 $130,000 $120,000 $155,000
Delivery Straight Truck Single Unit Long-Haul Truck $75,000 $115,000 $75,000 $75,000 $140,000 $125,000
Delivery Step Van Single Unit Short-Haul Truck $65,000 $150,000 $105,000 $65,000 $65,000 $105,000 $95,000
Dump Truck #N/A $80,000 $80,000 $80,000 $140,000 $130,000
Bucket/Aerial Truck #N/A $155,000 $355,000 $155,000 $155,000 $215,000 $205,000
Snow Plow/Sander #N/A $100,000 $100,000 $100,000 $170,000 $160,000
Sewer Cleaner #N/A $385,000 $385,000 $385,000 $410,000 $410,000
Street Sweeper #N/A $190,000 $190,000 $190,000 $265,000
Refuse Truck Refuse Truck $210,000 $670,000 $260,000 $250,000 $210,000 $210,000 $260,000 $250,000
Transit Bus Transit Bus $300,000 $510,000 $300,000 $300,000 $360,000 $350,000
School Bus School Bus $90,000 $150,000 $90,000 $90,000 $105,000 $140,000 $130,000
Shuttle/Paratransit Bus #N/A $65,000 $120,000 $65,000 $65,000 $75,000 $90,000
Medium-Duty Pickup Truck Light Commercial Truck $30,500 $38,000 $38,000 $38,000 $30,500 $38,500 $43,000
Utility Cargo Van #N/A $31,000 $43,000 $66,000 $43,000 $43,000 $31,000 $39,000 $47,000
Shuttle/Paratransit Van #N/A $30,000 $42,000 $42,000 $42,000 $30,000 $36,500 $40,000
Light-Duty Pickup Truck Passenger Truck $24,500 $32,000 $42,000 $32,000 $32,000 $24,500 $31,000 $36,000
SUV #N/A $24,000 $26,500 $31,500 $55,500 $26,500 $26,500 $24,000 $30,000 $36,500
SUV - Taxi #N/A $24,000 $26,500 $31,500 $55,500 $26,500 $26,500 $24,000 $30,000 $36,500
Car Passenger Car $20,000 $22,500 $28,000 $33,000 $35,000 $37,500 $22,500 $22,500 $20,000 $26,000 $27,000
Car - Taxi #N/A $20,000 $22,500 $28,000 $33,000 $35,000 $37,500 $22,500 $22,500 $20,000 $26,000 $27,000
Car - Police #N/A $20,000 $22,500 $28,000 $33,000 $35,000 $37,500 $22,500 $22,500 $20,000 $26,000 $27,000
Maintenance Utility Vehicle #N/A $14,000 $19,000 $0 $0 $14,000
Other #N/A
U.S. Average
Mix
Alaska
Systems
Coordinating
Council (ASCC)
Florida
Reliability
Coordinating
Council (FRCC)
Hawaiian
Islands
Coordinating
Council (HICC)
Midwest
Reliability
Organization
(MRO)
Northeast
Power
Coordinating
Council
(NPCC)
Reliability
First
Corporation
(RFC)
SERC
Reliability
Corporation
(SERC)
Southwest
Power Pool
(SPP)
Texas
Regional
Entity (TRE)
Western
Electricity
Coordinating
Council
(WECC) User Mix
Residual oil 0.5% 14.3% 1.0% 96.3% 0.3% 0.7% 0.3% 0.4% 0.4% 0.1% 0.2% 0.5%
Natural gas 25.4% 59.4% 60.4% 3.4% 2.0% 41.7% 13.0% 25.2% 26.2% 43.2% 25.8% 25.4%
Coal 41.4% 3.1% 20.7% 0.0% 63.5% 5.9% 54.8% 43.7% 56.5% 34.3% 30.5% 41.4%
Nuclear power 20.6% 0.0% 16.1% 0.0% 14.8% 31.9% 28.2% 26.4% 4.4% 12.9% 9.4% 20.6%
Biomass 0.4% 0.9% 0.3% 0.0% 0.3% 1.6% 0.2% 0.4% 0.0% 0.3% 0.3% 0.4%
Others (Wind, Solar, Hydro, etc) 11.8% 22.4% 1.6% 0.3% 19.1% 18.3% 3.5% 3.9% 12.6% 9.2% 33.8% 11.8%

27
3. REFERENCES
Argonne National Laboratory, 2013, GREET Model – GREET1_2013 version,
http://greet.es.anl.gov, last accessed October.
EPA, 2013a, Motor Vehicle Emission Simulator (MOVES) – MOVES2010b version.
http://www.epa.gov/otaq/models/moves, last accessed October.
EPA, 2013b, Annual Certification Test Results & Data – Model Year 2013 Light Duty Vehicle
Data. http://www.epa.gov/otaq/crttst.htm, last accessed October.
EPA, 2013c, Engine Certification Data – Model Year 2013 On-Highway Heavy Duty.
http://epa.gov/otaq/certdata.htm, last accessed October.