spreadsheet tool user manual for planning msw · pdf filespreadsheet tool user manual for...
TRANSCRIPT

TOOLKIT FOR ISWM PLANNING
2007
Spreadsheet Tool User Manual
for Planning MSW Management
P R E P A R E D F O R UNE P ‐DT I E ‐ I E T C

Spreadsheet Tool User Manual for Planning MSW Management
2
About Spreadsheet Tool User Manual MSW generated from household sectors is complex both in terms of quality and quantity and is therefore dealt with separately. Most cities around the world are expanding with a growth in the population. As there is more economic growth, there is rapid change in the MSW quantity and quality. The changing waste quantity and quality exerts pressure on the existing waste management systems.
The objective of this spreadsheet is to assist in interactive discussions for developing decision support systems for MSW Management.
This Spreadsheet Tool also assists in the Strategic Planning Process by helping in data collection and analysis, assessment of gaps in MSW management, assisting in setting new goals, objectives and targets to improvise MSW Management. It also gives the user the option of understanding the impacts of the various schemes on MSW management. By this it enables the user to understand the current situation better and make more relevant and better decisions.
The Spreadsheet Tool is based upon a simple model which consists of MSW management from generation to disposal. The aim is to provide a simple, interactive system to analyze the environmental, economic (and eventually social) impacts of various management options. The Spreadsheet MSW Tool can help by visualizing a “first cut” rapid assessment of options with available data and determine critical areas for future work.
The Spreadsheet Tool for Planning MSW Management begins with a Main Menu which is followed by the following worksheets:
I. Inputs Worksheets: For entering Inputs
• Profile of MSW Generation, Segregation, Recycling and Decentralized Treatment
• MSW Collection Infrastructure
• Centralized MSW Treatment and Disposal
II. Ward wise Calculation Worksheet: For entering and analyzing data
• Data for current decade and for next 5 decades can be analyzed
III. Outputs Worksheets: For viewing and using results of the waste data
• Results Worksheet
• Waste Flow Worksheet
• Charts Worksheet
IV. Schemes Worksheet: For understanding and using of Schemes Worksheet
The inputs entered in the inputs worksheet are used in the calculations in the ward wise calculation worksheet. The results of the calculations in the ward wise calculation worksheet are displayed in the Results, Waste Flow and Charts Worksheets. The Effectiveness of the schemes from the Schemes Worksheet would impact the inputs in the Inputs Worksheet.

Spreadsheet Tool User Manual for Planning MSW Management
3
INPUTS WARDWISE CALCULATION SCHEMES
RESULTS CHARTSWASTE FLOW
Spreadsheet Tool for Planning MSW Management is the outcome of efforts by:
Mr. Rahul Datar
Environmental Management Centre (EMC), Mumbai, India
http://www.emcentre.com
Team at EMC comprised
Mr. Shantanu Roy
Mr. Sunil Gangurde
Ms. Nassera Ahmed
Mr. Kedar Kulkarni

Spreadsheet Tool User Manual for Planning MSW Management
4
Table of Contents
Section No. Title Page No.
1 Introduction to the Spreadsheet Tool User Manual 5
1.1 Objectives of this Tool 5
1.2 Structure of the Tool 16
2 How to use the Spreadsheet Tool 18
2.1 Getting Started 18
2.2 Entering Inputs on Inputs Worksheet 20
2.3 Entering and Analyzing Data on Ward wise Calculation Worksheet
22
2.4 Using Results, Waste Flow, Charts Worksheets 23
2.5 Understanding and Using Schemes Worksheet 24
3 Assumptions and Calculations in the Spreadsheet Tool 27
3.1 Assumptions 27
3.2 Calculations 28
4 User Flexibility in the Spreadsheet Tool 31
5 Example – Pune City Waste Data Analysis using Spreadsheet Tool
32
5.1 Inputs 32
5.2 Results – Current Year 33

Spreadsheet Tool User Manual for Planning MSW Management
5
1 Introduction to the Spreadsheet Tool User Manual
1.1 Objectives of this Tool
UNEP implemented three ISWM Plan projects in varied locations and under different circumstances which led to an increase in the knowledge pool of UNEP. In order to share the experience during these projects and thereby aid other city municipals and authorities for implementing ISWM Plans, a Guidance Manual was attempted. This Guidance Manual targeted at the urban management authorities, provides a set of distilled guidelines that can be practiced to enhance the ISWM implementation process.
Along with the Guidance Manual, a Toolkit for ISWM Planning has been attempted which can be used by urban management authorities to understand the situation of waste management in the city as well as to aid in the consultative approach and thinking towards integrated management of solid waste. This Toolkit for ISWM Planning includes a Spreadsheet Tool for Planning Municipal Solid Waste (MSW) Management.
MSW generated from household sectors is complex both in terms of quality and quantity and is therefore dealt with separately. Most cities around the world are expanding with a growth in the population. As there is more economic growth, there is rapid change in the MSW quantity and quality. The changing waste quantity and quality exerts pressure on the existing waste management systems.
The objective of this spreadsheet is to assist in interactive discussions for developing decision support systems for MSW Management.

Spreadsheet Tool User Manual for Planning MSW Management
6
The Integrated Solid Waste Management concept as per definition involves the entire life‐cycle processfrom generation to disposal of waste. This issue not just involves different sources of waste generationbut also diversities in terms of waste characteristics, involved stakeholders and required technologicalknow‐how. In order to deal with this complex issue, for arriving at an optimal solution a number ofdifficult choices will have to be made. Prediction of waste generation and characterization is crucial fordeveloping a robust waste management plan. However, these parameters being a function of severalfactors, the prediction will have to be done following the scenario building approach.
The scenario based approach; participatory frame‐work and analysis of alternatives to come up with arobust alternative are some of the key principles enshrined in the Strategic Planning Process. Hence thisprocess has been adopted as the basis for developing the Integrated Solid Waste Management Plan. TheStrategic Planning process focuses more on adaptability to change, flexibility and importance of strategicthinking and organizational learning.
The Strategic Planning (SP) process begins with a situation analysis, i.e. an assessment of the internal aswell as external environment. The present situation is carefully evaluated to find out if the organizationis on track towards meeting its goal and vision. If no goals/objectives have previously been set then thenew goals / objectives are set and the SP process is geared towards achieving targets under eachobjective. This is followed by development of action plan on how to meet targets by the implementationof various schemes. The action plan is then monitored to check if targets have been attained or not. Incase targets are not achieved, the process is repeated till the desired targets aremet.
The growth of a city is characterized by increase in economic and developmental activities. These activities are typically driven by the production and consumption patterns. Over the years, the economic activities have been mapped with the manufacturing and construction activities. The improved standard of living and extent of commercialization in the cities have significantly changed the consumption patterns and thereby the waste composition. The inability to fully grasp the problems of waste generation and characterization have resulted in transforming Solid Waste Management as one of the most compelling problem of urban environmental degradation.
The solid waste quantities generated as well as its ever changing characteristics is at an alarming proposition. The household waste contains biodegradable waste such as vegetables, leftover foods; non biodegradable materials such as plastics, and hazardous material like used batteries; thereby rendering it to be a complicated situation to handle.
Construction and Demolition (C&D) wastes are also many a time considered as part of MSW and such mixed waste is disposed at the landfill reducing the life of the landfills. In addition to this the wastes generated from commercial establishments and from industries add a different dimension to the waste generation scenario. The industrial hazardous wastes if mixed into Municipal Solid Waste (MSW) create unsafe conditions.
Furthermore, the problems of bio‐medical waste and the electronic waste (E‐waste) generation lead to complicated waste generation and management scenario.

Spreadsheet Tool User Manual for Planning MSW Management
7
The heightened awareness and the governing regulatory regime have resulted in the involvement of various agencies like government, private and non‐government organizations; to undertake pilots and projects in partnership. However, an integrated and strategic approach is still missing. In most cases the projects and initiatives have remained either isolated or not up‐scaled or replicated. Individual or fragmented approach is bound to become unsustainable in view of increasing complexity of the waste streams. Unless the approach is strategic and cross‐sectional, ad‐hoc waste management will always remain a challenge.
There is also a dire need to integrate the informal sector into mainstream waste management process. This informal sector which may comprise of rag pickers, illegal or unauthorized recyclers handle a substantial amount of waste generated without the requisite environmental safeguards.
A plausible solution to waste management would be an integrated approach which would include collective management of all types of wastes and implementation of the 3R (Reduce, Reuse and Recycle) policies and strategies.
Figure below highlights the need for ISWM.
Need for ISWM1
1 As referred to http://www.institutoventuri.com.br/img_forum/palestras/Palestras%2018%20de%20maio%20%20Tarde/Surya%20Chandak.pdf
NEED FOR ISWM
Cities are facing an increasing growth in population, and shares in GDP growth,
resulting in – among other things – increasing quantities of waste being generated Due to changing lifestyles and
consumption patterns, the quantity of waste generated has increased with quality and
composition of waste becoming more varied and
changing.
Industrialization and economic growth has produced more amounts of waste, including hazardous and toxic wastes.
Local Governments are now looking at waste as a business opportunity, (a) to extract valuable resources contained within it that can still be used and (b) to safely process and dispose wastes with a minimum impact on the environment
Complexity, costs and coordination of waste
management has necessitated multi‐stakeholder involvement in every stage of the waste stream.
This calls for an integrated approach to waste management.
There is a growing realization of the negative impacts that
wastes have had on the local environment (air, water, land,
human health etc.)
Spreadsheet Tool User Manual for Planning MSW Management
8
Several Solid Waste Management Plans have been developed around the world. Many of them have been used as illustrations in this chapter as well as the following chapters. However many of these plans are mostly highlighting the problem of Municipal Solid Waste and therefore they are not able to handle the whole waste management problem in an integrated manner. This may also be as there is no standard methodology for ISWM planning.
In order to cope with the problem of Solid Waste Management, The United Nations Environmental Programme (UNEP) through International Environmental Technology Centre (IETC), Division of Technology, Industry, and Economics (DTIE) have been instrumental in developing and implementing Integrated Solid Waste Management Plans for three cities, namely:
1. Pune city, India 2. Wuxi, Peoples Republic of China 3. Lesotho, South Africa
The objective of the projects were to develop Integrated Solid Waste Management (ISWM) plan covering MSW, Biomedical waste, Industrial hazardous waste, Construction & Demolition (C&D) waste and Electronic‐waste. The plans would cover all the aspects of ISWM chain including collection, segregation, transportation, recycling, treatment and disposal.
The implementation of these three projects, set‐up in varied locations and under different circumstances has led to an increase in the knowledge‐pool of UNEP. In order to share the experiences during these projects and thereby aid other city municipals and authorities for implementing ISWM plans, a Guidance Manual has been attempted. This Guidance Manual, targeted at the urban management authorities, provides a set of distilled guidelines that can be practiced to enhance the ISWM implementation process.
The UNEP‐DTIE‐IETC is utilizing the services of Mr. Rahul Datar with support from Environmental Management Centre to assist them to carry out the project and carry out the tasks identified to achieve the project objective.

Spreadsheet Tool User Manual for Planning MSW Management
9
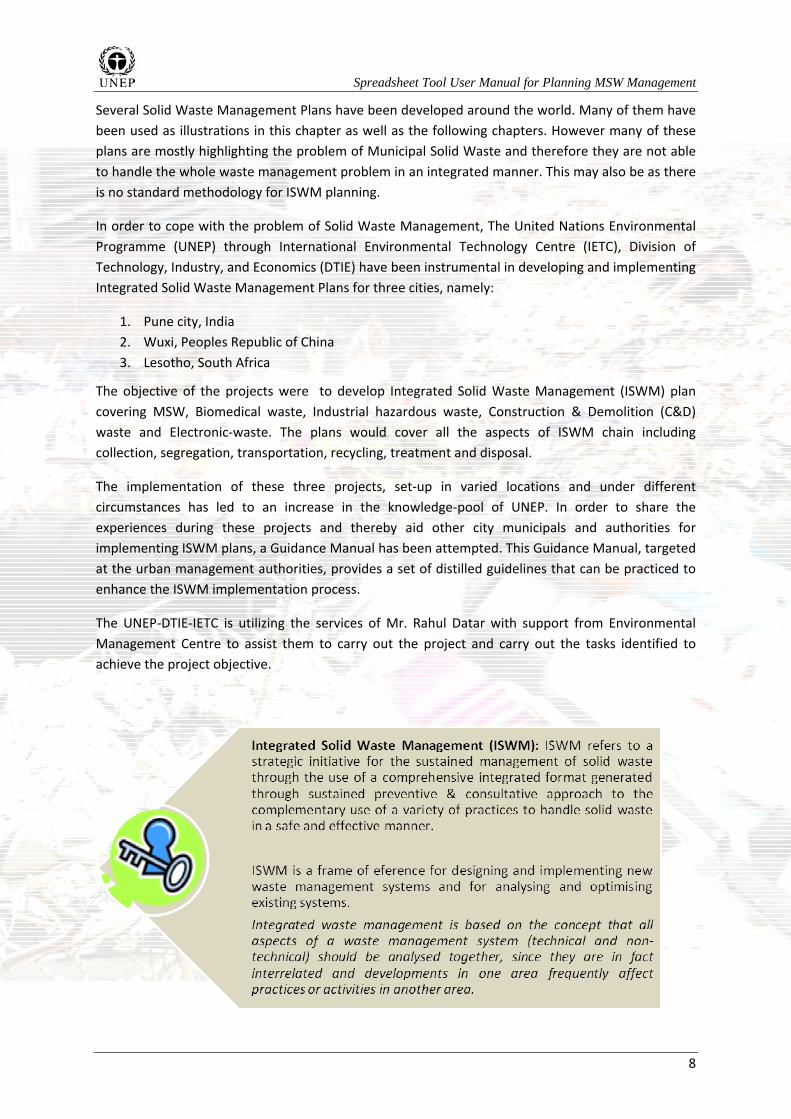
ISWM proposes to take a comprehensive approach across all types of solid waste streams and involves the use of a range of different options. ISWM is a system developed from generation to disposal and builds around the other management steps encompassing all types of solid wastes. The selection of the most appropriate waste management systems and sustainable technologies are also the identified requirements needed to deliver an optimum and sustainable ISWM system. In combination with economic and social considerations, this approach would help waste managers to design more sustainable solid waste management systems.
Thus for the management of solid waste the following is the preferred hierarchy of approaches
• Reduction at source meaning incorporation of tenets of waste management at every stage of consumption from design, manufacture, purchase, or use of materials to reduce the amount or toxicity of waste generated.
• Environmentally suitable reuse and recycling to conserve natural resources and energy through systematic segregation, collection and reprocessing.
The various interpretations of the Integrated Solid Waste Management can be seen in Figure below:
MSW
Bio-Medical Waste
HazardousWaste
C&D Waste
E-Waste
Generation
Segregation
Collection
Transportation
DecentralizedTreatment
Recycle&
Reuse
Reuse, Disposal &Treatment
Concept of Integrated Solid Waste Management

Spreadsheet Tool User Manual for Planning MSW Management
10
The ISWM concept has to be adapted with the view that effective management schemes need the flexibility of design, adaptation, and systems in ways which best meet current social, economic, and environmental conditions. These are likely to change over time and vary by location. The need for consistency in quality and quantity of recycled and recovered materials (compost, energy), the need to support a range of disposal options, and the benefit of economies of scale, suggest that the ISWM systems should be organized on a large‐scale.
Some of the major features of ISWM can be listed as follows:
Holistic approach to all waste streams thus maximizing synergetic benefits in collection, recycling, treatment & disposal
Maximize the opportunities for resource recovery at all stages ‐ from generation to final disposal
Accommodate aspirations of all stakeholders – from waste generators to waste management and service providers
Facilitate life cycle view of products and materials; thus, promoting greater resource use efficiency
Integrate different response functions such as technical, managerial, financial, policy, etc.
Greater local ownership & responsibilities / participation through a consultative approach
The Integrated Solid Waste Management concept as per definition involves the entire life‐cycle process from generation to disposal of varied waste streams. This issue not just involves different sources of waste generation but also diversities in terms of waste characteristics, involved stake‐holders and required technological know‐how. In order to deal with this complex issue, for arriving at an optimal solution a number of difficult choices will have to be made. Prediction of waste generation and characterization is crucial for developing a robust waste management plan. However, these parameters being a function of several factors, the prediction has to be done following the scenario building approach. A plan for managing diverse streams needs a flexible approach involving varied organizations and stake‐holders and generating alternatives based on participatory approach.
The scenario based approach; participatory framework and analysis of alternatives to come up with a robust alternative are some of the key principles enshrined in the Strategic Planning (SP) Process. Hence this process can be adopted as the basis for developing the ISWM Plan. The SP process focuses more on adaptability to change, flexibility and importance of strategic thinking and organizational learning. Further, SP is a continuous process and not a one‐time or quantum activity. The process should begin with a situation analysis, i.e. an assessment of the internal as well as external environment. During this process, the existing situation has to be carefully evaluated to find out if the organization is on track towards meeting its goal and vision. If no goals/objectives have previously been set then the new goals / objectives should be set and the SP process has to be geared towards achieving targets under each objective.

Spreadsheet Tool User Manual for Planning MSW Management
11
This should be followed by development of action plan on how to meet targets. The action plan has to be then monitored to check if targets have been attained or not. In case targets are not achieved, the process should be repeated till the desired targets are met.
Strategic Planning (SP): Basic Concepts
Strategic Planning (SP) is a management tool which helps an organization to achieve its goals. The term strategic is used for the process because it prepares the organization to respond circumstances related to organization’s dynamic environment. Strategic planning is about:
• The choice that is made out of a number of alternatives that can be done or need to be done;
• Prioritisation of these choices;
• Timing of the action associated with these choices
Strategy is essentially a bridge between the past and future. The past and present are viewed when an "as is" study is done while the future is visualized through the "to be” study of the overall management structure. Here, strategic planning helps in providing ways of maximizing opportunities, developing a far‐sighted approach for managing the solid wastes in the region.
Strategy is thus a process of:
• Targeting the key things that can be done to move in that direction (priority issues, key influences on these issues and the most effective ways of dealing with them); and
• Engaging everyone concerned to carry them out
The main components of a strategy are:
• Assessment including diagnosis (at the start of a strategy);
• Monitoring and evaluation (during a strategy);
• Designing the actions (planning);
• Taking the actions (implementation).
These components must continue together and reinforce one another. The best strategies have been based on participation, building on good existing plans and processes, with clear attention to integrated approach. However, strategies are not panaceas. But indeed they break new ground in the ways societies and governments tackle complex issues related to solid waste management.

Spreadsheet Tool User Manual for Planning MSW Management
12
Strategic planning should be a participatory process because:
• Solid waste management is not possible by one or two institutions. It is a shared responsibility;
• Participation means shared responsibility for the strategy and its joint undertaking;
• Participation by stakeholder groups is critical for decision making. The result will be a realistic strategy with a broad base of knowledge, understanding and commitment from the groups involved;
• Participants bring information to the strategy, ensuring that it is based on a common understanding of purpose, problems and solutions;
• Participation is the most effective way of communicating information on which the strategy is based, its goals, and tasks to be undertaken;
• Participation should be expanded as the strategy develops.
In the present context, strategic planning could assist in:
• Developing institutions and organisational arrangements that are better equipped to cope with uncertainty, rapid change and the need for more integrated decisions;
• Developing institutional and technological skills in solid waste management;
• Developing multi‐agency networks: Incorporating the public, private and the informal sector;
• Setting in motion analysis of the main constraints to more integrated management.
With a goal as broad as ISWM, it is tempting to try to do everything. Planning must ensure that a strategy concentrates on a few priority issues while retaining a broad purview. Such a strategy is more likely to be implemented successfully.
Strategic planning seeks to answer questions such as:
• "What is our vision?"
• "How should we be organized?"
• "How should we allocate resources to our programs and services?”

Spreadsheet Tool User Manual for Planning MSW Management
13
SP process is about planning because it involves setting of targets or goals and developing a framework to achieve these goals. In other words, it can be explained as a vehicle for journey, from present situation to better future. Strategic Planning (SP) is about the choice that is made from a number of alternatives, the prioritization of those choices, and the timing of the action associated with them. Thus, it is a proactive and target‐oriented process‐cum‐methodology.
The objective of SP is to allocate organizational resources and to establish priorities of actions. SP can thus be beneficial to the economic efficiency of the organization as well, by guiding a more efficient use of personnel and a more productive application of available financial resources2.
Lastly, SP is essential towards achievement of long‐term objective of developmental activities as it encourages a simultaneous consideration of social, environmental and economic factors. Figure below explains the basic steps in SP.
Preparation
What is Current
Situation?
Values?
Where do we want to
be?
How to get there?
Goals, Objectives and Action
Plan
Follow‐up Monitoring
Strategic Planning Process
Strategic Planning Process
By answering these questions (and many others), SP assists in creating a desired future. The process as explained in Figure 2.2 begins with a situation analysis, i.e. an assessment of the existing status of the organization, known as “strategic analysis”. Here, key areas of concern are identified based on “values” and strategic directions are set. The action plan is then monitored to check its effectiveness.
The benefits of the strategic planning process have been summarized in Box.
2 How to Prepare an Economic Development Action Plan for Your Community by The Center for Economic Development Research, College of Business
Administration, University of South Florida. Available at: cedr.coba.usf.edu/projects/Module1EDActionPlan/Case%20Study%201.pdf

Spreadsheet Tool User Manual for Planning MSW Management
14
Benefits of Strategic Planning3
Box: Benefits of Strategic Planning
Provides a clear definition of organization’s purpose (vision/mission) and helps to establish and achieve realistic goals and objectives in a defined time‐frame within the organization’s capacity.
Helps in communicating the vision/mission, goals and objectives to the constituents of the organization.
Focuses the organization’s resources on key priorities hence ensuring an efficient use. Provides a monitoring base from which progress can be measured and establishes a mechanism for informed change when needed.
Brings together everyone’s best and most reasoned efforts: this has important value in building a consensus about where the organization is going.
Helps in developing a sense of ownership of the plan when implemented in a participatory manner
The following figure elucidates in detail various steps involved in the SP process and how this Spreadsheet Toolkit will be able to help in Strategic Planning.
3 Strategic Planning: Available at: http://www.mapnp.org/library/plan_dec/str_plan/str_plan.htm

Spreadsheet Tool User Manual for Planning MSW Management
15
Strategic Planning Approach for ISWM Plan
Development
Visioning Exercise
Mission Statement
Goal Development
Objectives Development
Guiding Principles
Success Factor Analysis
Barriers/Gap Analysis
Strategy Development
Prioritisation
Action Planning
Monitoring Status
Updating the ISWM Plan
Situation Analysis includ
ing Data
capture and Gaps ide
ntification
Consultative Participatory Process
Steps in Strategic Planning for ISWM
This Spreadsheet Tool also assists in the Strategic Planning Process by helping in data collection and analysis, assessment of gaps in MSW management, assisting in setting new goals, objectives and targets to improvise MSW Management. It also gives the user the option of understanding the impacts of the various schemes on MSW management. By this it enables the user to understand the current situation better and make more relevant and better decisions.
The Spreadsheet Tool is based upon a simple model which consists of MSW management from generation to disposal. The aim is to provide a simple, interactive system to analyze the environmental, economic (and eventually social) impacts of various management options. The Spreadsheet MSW Tool can help by visualizing a “first cut” rapid assessment of options with available data and determine critical areas for future work.

Spreadsheet Tool User Manual for Planning MSW Management
16
1.2 Structure of the Tool
The Spreadsheet Tool for Planning MSW Management begins with a Main Menu which is followed by the following worksheets:
I. Inputs Worksheets: For entering Inputs
• Profile of MSW Generation, Segregation, Recycling and Decentralized Treatment
• MSW Collection Infrastructure
• Centralized MSW Treatment and Disposal
II. Ward wise Calculation Worksheet: For entering and analyzing data
• Data for current decade and for next 5 decades can be analyzed
III. Outputs Worksheets: For viewing and using results of the waste data
• Results Worksheet
• Waste Flow Worksheet
• Charts Worksheet
IV. Schemes Worksheet: For understanding and using of Schemes Worksheet
The Structure of the Spreadsheet is shown below. The inputs entered in the inputs worksheet are used in the calculations in the ward wise calculation worksheet. The results of the calculations in the ward wise calculation worksheet are displayed in the Results, Waste Flow and Charts Worksheets. The Effectiveness of the schemes from the Schemes Worksheet would impact the inputs in the Inputs Worksheet.
INPUTS Worksheet
WARDWISE CALCULATIONSWorksheet
RESULTSWorksheet
WASTE FLOWWorksheet
SCHEMESWorksheet
Structure of the Spreadsheet Tool
The following chapters explain in detail the different sections of the spreadsheet. Various calculations involved and the linkages between different parts of the model are explained in these

Spreadsheet Tool User Manual for Planning MSW Management
17
chapters. There are several assumptions made in the Spreadsheet MSW Tool which are also highlighted in the chapters below.
The Waste Flow model which has been assumed for this MSW Tool is as shown in the figure below. The Waste Flow model has been considered after reviewing several waste flow models around the world for various different cities.
As per this Waste Flow Model the Total MSW Generated undergoes segregation and is then divided into segregated and non‐segregated waste. The non‐segregated waste is directly deposited in the bins. While the segregated waste is divided into dry and wet categories which undergo recycling and decentralised treatment respectively. The leftover dry and wet MSW from the recycling and decentralised treatment is transferred to the bins. Therefore the total MSW received in the bins consists of the non‐segregated MSW along with the leftover MSW from recycling and treatment processes. This MSW from the bins is collected by the vehicles to be transferred to the Transfer Stations. There are two types of waste collection vehicles assumed – waste collection vehicle (compactor) and dumper placers. MSW from the Transfer Station is then sent to the landfill. MSW at the landfill is segregated again into segregated and non‐segregated MSW. The segregated MSW at the landfill is divided into the dry and wet components. The wet component undergoes centralised treatment and the leftover wet MSW is again sent back to the landfill. Therefore the total MSW actually deposited in the landfill includes non‐segregated MSW at the landfill site, dry component of the segregated MSW at the landfill and the leftover wet component of the treated wet segregated MSW at the landfill.
This waste flow has been designed as such keeping in mind several limitations as well which are explained in detailed in the following chapters.

Spreadsheet Tool User Manual for Planning MSW Management
18
2 How to use the Spreadsheet Tool
2.1 Getting Started4
Spreadsheet MSW Tool uses a Microsoft® Excel spreadsheet with Visual Basic macros to assist in interactive discussions for developing decision support systems for MSW Management. The spreadsheet allows understanding of waste inventory using population projections and calculating waste inventory from generation to disposal. An optimization model i.e. the Schemes worksheet is also built‐into the spreadsheet to determine the best combination of options that can meet desired objectives subject to constraints.
System requirements for Spreadsheet MSW Tool
The following hardware and software is required to run Spreadsheet MSW Tool:
• An Intel Pentium 133 or equivalent processor running Windows 95, 98, NT version 4.0 or later, 2000 XP; 16 MB RAM (Windows 95 or 98; 24 MB recommended ) or 24 MB of RAM (Windows NT; 32 MB recommended) plus 20 MB of available disk space; a colour monitor
• Microsoft® Excel (versions above 2000)
Installing Spreadsheet MSW Tool
Spreadsheet MSW Tool is a simple spreadsheet program which can be opened using Microsoft Excel. Copy Spreadsheet MSW Tool from the Toolkit for ISWM Planning CD‐ROM to your computer and launch it.
4 Note: This spreadsheet is only a prototype to start developing such decision support system tools and should not be used to make decisions in the form presented. Depending on the user requirements, these should be adapted for the local decision making objectives, parameters, data and context.

Spreadsheet Tool User Manual for Planning MSW Management
19
Step 1: Copy Spreadsheet MSW Tool from the Toolkit for ISWM Planning CD‐ROM
Ensure that you enable ‘macros’ while opening the file. Simply click on ‘Enable macros’ when the Excel program asks for it.
Step 2: Select Options to enable Macros

Spreadsheet Tool User Manual for Planning MSW Management
20
Step 3: Enable Macros
2.2 Entering Inputs on Inputs Worksheet
INPUTS
On this Worksheet, the User would have to enter the inputs for the various parameters listed below. These parameters have been divided into three different sections based on the waste flow from generation to disposal. These inputs would feed into the specified column in the Ward wise Calculation Worksheet and feed into the various calculations.

Spreadsheet Tool User Manual for Planning MSW Management
21
The three sections are:
i. Profile of MSW Generation, Segregation, Recycling and Decentralized Treatment: The inputs have to be entered by the user. Certain default values have also been given for clearer understating. Data entry validation has also been done in order to avoid inconsistent further calculations. The parameters under this section are shown below:
InputsParameters Assumptions Unit
Profile of MSW Generation, Segregation, Recycling and Decentralized Treatment
Per Capita MSW Generation 0.3 kg/dayPercentage of MSW Segregation 50 % Percentage of Dry Segregated MSW 40 %Percentage of Recycling of Dry Segregated MSW 50 %Percentage of Decentralised Treatment of Wet Segregated MSW
50 %
Area Required for Decentralized Treatment of 1 Ton of Wet Segregated MSW
300 sq.m
ii. MSW Collection Infrastructure: The inputs have to be entered by the user. Certain default values have also been given for clearer understating. Data entry validation has also been done in order to avoid inconsistent further calculations. The parameters under this section are shown below:
InputsParameters Assumptions Unit
MSW Collection Infrastructure
Capacity of Bins 0.1 Ton
Bin Collection Frequency Daily drop box
Capacity of Waste Collection Vehicle 5 Ton% of MSW taken by Waste Collection Vehicle 60 % Total Working Time in a day 540 minutesNon‐Productive Time 120 minutesHandling Time for a bin 15 minutesRound Trip Time for a vehicle 75 minutes
iii. Centralized MSW Treatment and Disposal: The inputs have to be entered by the user. Certain default values have also been given for clearer understating. Data entry validation has also been done in order to avoid inconsistent further calculations. The parameters under this section are shown below:
InputsParameters Assumptions Unit
Centralised MSW Treatment and
Disposal
Percentage of MSW Segregation at the Landfill 50 %Percentage of Centralised Treatment of Wet Segregated MSW at Landfill
40 %
Total Existing Landfill Capacity 1000000 TonUsed Existing Landfill Capacity 700000 TonUnused Existing Landfill Capacity 25000 Ton

Spreadsheet Tool User Manual for Planning MSW Management
22
2.3 Entering and Analyzing Data on Ward wise Calculation Worksheet
WARDWISE CALCULATION
This Worksheet is where the waste inventory for all the wards/zones in a city takes place. The total values are the waste inventory for the city. This waste inventory is calculated by the inputs given by the user and is calculated as per the waste flow diagram. This worksheet will show information for the current year and the next five decades.
The user would first have to click on the Add Wards/Zones button and add the number of wards/ zones in the city. This would increase the number of rows below each decade. Two population growth models – Arithmetic and Geometric growth models have been given. The user has the choice to select the growth model. The User would then have to enter the inputs for the various parameters which are listed in columns that have been colored in green. The ward/zone names would have to be entered along with a brief description of the ward/zone in the comments column. The brief description can include information about the housing patterns, economic profile of the population etc. The area of the wards needs to be entered. In order to calculate the population growth, the previous two decades along with the current decade population needs to be entered by the user. After all the inputs have been entered, the calculations set for the waste inventory will be done automatically.
The results from the calculations on this worksheet will be displayed in the output worksheets including the results, waste flow, and charts worksheets.

Spreadsheet Tool User Manual for Planning MSW Management
23
2.4 Using Results, Waste Flow, Charts Worksheets
RESULTS WASTE FLOW CHARTS
The Outputs Worksheets includes the following:
Results Worksheet: The user has to select the decade for viewing the city waste inventory results for that selected decade. The results show the area and population of the city, the MSW generation scenario, the MSW Collection Adequacy and the MSW disposal methods along with Landfill Adequacy. Following are the results of the city that are displayed on the Results Worksheet:
Results for the City Amount Unit Area of the city sq.m Population Total MSW Generated Ton / dayDry Segregated MSW Ton Wet Segregated MSW Ton Non‐Segregated MSW Ton Recycled Dry MSW Ton Leftover Dry MSW after Recycling Ton Decentralized Treated Wet MSW Ton Leftover Wet MSW after Decentralized Treatment Ton Total MSW to Bins Ton Current No. of Bins Bin Overload Analysis No. of Additional Bins Required Total No. of Bins Current No. of Vehicles ‐Waste Collection VehiclesCurrent No of Vehicles ‐ Dumper PlacersTotal MSW to Transfer Station Ton No. of Additional Vehicles Required Total No. of Vehicles (DP & WCV respectively)Dry Segregated MSW from Transfer Station Ton Wet Segregated MSW from Transfer Station Ton Non‐Segregated MSW from Transfer Station Ton Centralized Treated Wet MSW Ton Leftover Wet MSW after Centralized Treatment Ton MSW to Landfil Ton Landfill Life Years Landfill Adequacy Adequate / Not Adequate

Spreadsheet Tool User Manual for Planning MSW Management
24
Waste Flow Worksheet: The user has to select the decade for viewing the city waste inventory results for that selected decade. This worksheet displays all the results as per the Waste Flow model which has been assumed for this MSW Tool.
Charts Worksheet: This worksheet shows the user several charts of the results. These charts can help the user to make comparisons etc. The user can also visualise the various changes in the waste inventory of the city as and when certain inputs are changed or edited.
2.5 Understanding and Using Schemes Worksheet
SCHEMES
The building blocks to the Action Plan are Schemes that address project/programmatic issues to
come up with a rounded intervention that considers institutional, financial as well as
implementation aspects. Schemes present a blue‐print for the City/Civic Authorities of the city to put
the ISWM Plan into action.
The schemes should be devised emphasizing the 3R principle of Reduce, Reuse and Recovery across the Life Cycle of the waste streams and aim to go up the waste hierarchy. In order to categorize the Schemes at operational level, various themes should be identified based on the functional nature so as to address Integrated Solid Waste Management starting with the least favoured option in the waste hierarchy to the most favoured option. Themes should demonstrate a rounded and balanced approach to plan development. They should encompass the entire lifecycle from generation to

Spreadsheet Tool User Manual for Planning MSW Management
25
disposal. Various themes maybe assessment of data, recycle and reuse options, infrastructure development, awareness and training, capacity building, partnerships etc. The Schemes should also address the Strategic and Operational Selection of technologies.
A set of 12 Schemes have been provided in the Schemes worksheet. These Schemes were found to be suitable for improving MSW Management across any city. These Schemes address issues such as awareness raising, increase in segregation, recycling and treatment. The list of these 12 schemes is given below:
Sr. No.
Scheme
1 Television short film/radio advertisement imparting awareness towards solid waste management targeting reduction in generation and higher segregation including messages given out by celebrities
2 Establishing an Environmental Awareness Centre with increased involvement of schools using posters, dramas and campaigns to spread awareness in local areas
3 Introducing cleanlinesss/segregation as a theme during major events like festivals, sports events, large gatherings etc.
4 Establishing Community Sorting Centres and formalising sorting workers like ragpickers or waste pickers
5 Strengthening of ragpickers or waste pickers by imparting formal training and providing incentives to increase segregation
6 Introducing Awards schemes in wards/zones with higher segregation 7 Tax benefits for citizens in wards/zones with higher segregation 8 Imposing fines on wards/zones not establishing a proper segregation system 9 Demonstration projects for establishng new recycling technology
10 Demonstration projects for improvising the technology used for decentralised treatment and for standardising methods of operation to increase efficiency of treatment
11 Making a Market in city farming areas for Compost from decentralised treatment plants
12 Creating a market for recycled material to be used as packaging material in the city malls and markets
These Schemes impact four main variables as shown below. These variables act as the MSW Impact Indicators.
MSW Impact IndicatorsPercentage of Per Capita
MSW Generation Percentage of Segregation
Percentage of Recycling
Percentage of Treatment
% (Decreases) % (Increases) % (Increases) % (Increases)
The Default Impact of the schemes on the four variables has been provided for the user. The User can select the scheme that is relevant for the city under consideration. The User also has the option of adding some more schemes if it is required. The user can also make changes in the amount of impact in percentage for various variables. However this is subject to the input initially made by the user in the Inputs Worksheet. The calculation and selection of amount of impact in percentage for various variables has been explained in the next section in more detail.

Spreadsheet Tool User Manual for Planning MSW Management
26
The total amount of impacts on the various variables would increase or decrease the percentage of inputs on the Inputs Worksheet. This would in turn have an effect of the total waste inventory along with a change in the total amount of MSW going to the landfill. The Inputs impacted would be as follows:
Percentage of Per Capita MSW Generation
Percentage of Segregation
Percentage of Recycling
Percentage of Treatment
Per Capita MSW Generation
Percentage of MSW Segregation
Percentage of Recycling of Dry Segregated MSW
Percentage of Decentralised Treatment of Wet Segregated MSW
DECREASES
INCREASES
INCREASES
INCREASES
MSW TO LANDFILL
DECREASES
VARIABLES IMPACTS ON

Spreadsheet Tool User Manual for Planning MSW Management
27
3 Assumptions and Calculations in the Spreadsheet Tool
3.1 Assumptions
There are several assumptions made in the Spreadsheet Tool. These assumptions were required to be made in order to make the Model functional and more flexible. The main assumption is the Waste Flow Model which has been assumed for this MSW Tool. The Waste Flow model has been considered after reviewing several waste flow models around the world for various different cities.
The inputs required in the Inputs Worksheets were set based on Outputs in this Waste Flow Model. The inputs in the Inputs Worksheet have to be entered by the user. However, default values have been provided after comparing values from various cities around developing and developed countries.
→ The per capita generation of MSW is assumed to be only from the households. The other areas are not considered.
→ The assumptions made in the Waste Flow Model include that the Total MSW Generated undergoes segregation where the MSW is separated as Segregated or Non‐segregated MSW.
→ Non‐segregated MSW refers to mixed waste which is sent to the Waste bins directly.
→ Segregated MSW refers to 100% segregation of MSW into dry and wet components. The Dry component of the segregated MSW undergoes Recycling where the MSW is recycled and the leftover Dry MSW is sent to the Waste bins. The Wet component of the segregated MSW undergoes Decentralised Treatment where the MSW is treated and the leftover Wet MSW is sent to the Waste bins.
→ The MSW from the bins is then collected by vehicles (dumper placer whose capacity is assumed to be that of one bin and waste collection vehicle whose capacity has to be entered by the user). The vehicles transfer the MSW to the Transfer Stations.
→ From the Transfer Stations the MSW is sent to the Landfill.
→ The MSW received at the landfill then undergoes segregation where the MSW is separated as Segregated or Non‐segregated MSW.
→ The Non‐Segregated MSW is deposited into the landfill.
→ Segregated MSW refers to 100% segregation of MSW into dry and wet components. The Dry component of the segregated MSW is deposited into the landfill. The Wet component of the segregated MSW undergoes Centralized Treatment where the MSW is treated and the leftover Wet MSW is deposited into the landfill.
→ Therefore the total MSW deposited in the landfill is assumed to be the non‐segregated MSW at the landfill site, dry component of the segregated MSW at the landfill and the leftover wet component of the treated wet segregated MSW at the landfill.

Spreadsheet Tool User Manual for Planning MSW Management
28
3.2 Calculations
There are several calculations in the Spreadsheet Tool and they are listed below as per the Worksheets:
WARDWISE CALCULATION WORKSHEET
→ Population Projection:
Arithmetic Model = Population in Current Year + Increase for 2 decades
Geometric Model = Pollution in Current Year * (1 + Geometric Mean)2
→ Total MSW generated:
Total MSW Generated = Population * Per Capita Waste Generation
→ MSW Segregation:
Segregated MSW = Percentage of MSW Segregation * Total MSW Generated
Non‐Segregated MSW = Total MSW Generated – Segregated MSW
→ Dry and Wet Component of Segregated MSW:
Dry Segregated MSW = Percentage of Dry Segregated MSW * Segregated MSW
Wet Segregated MSW = Segregated MSW – Dry Segregated MSW
→ Recycling of Dry Segregated MSW:
Recycled MSW = Percentage of Recycling of Dry Segregated MSW * Dry Segregated MSW
Leftover Dry MSW = Dry Segregated MSW – Recycled MSW
→ Decentralised Treatment of Wet Segregated MSW:
Decentralised Treated MSW = Percentage of Decentralised Treatment of Wet Segregated MSW * Wet Segregated MSW
Leftover Wet MSW = Wet Segregated MSW – Decentralised Treated MSW
→ Area required for Decentralised Treatment of Wet Segregated MSW

Spreadsheet Tool User Manual for Planning MSW Management
29
Wet Segregated MSW * Area required for Decentralised Treatment of 1 Ton of Wet Segregated MSW
→ MSW to Waste Bins
Non‐Segregated MSW + Leftover Dry MSW + Leftover Wet MSW
→ Bin Adequacy Analysis:
MSW to Waste Bins =/< No. of Bins * Capacity of a Bin ‐‐‐‐‐‐‐‐‐‐‐‐‐‐ Sufficient
MSW to Waste Bins > No. of Bins * Capacity of a Bin ‐‐‐‐‐‐‐‐‐‐‐‐‐‐ Overload
→ Vehicle Adequacy Analysis:
MSW collected by Vehicles =/< No. of Vehicles * Capacity of Vehicle ‐‐‐‐‐‐‐‐‐‐‐‐‐‐ Sufficient
MSW collected by Vehicles > No. of Vehicles * Capacity of Vehicle ‐‐‐‐‐‐‐‐‐‐‐‐‐‐ Insufficient
→ MSW Segregation at Landfill:
Segregated MSW at Landfill = Percentage of MSW Segregation * Total MSW to Landfill
Non‐Segregated MSW at Landfill = Total MSW to Landfill – Segregated MSW
→ Dry and Wet Component of Segregated MSW at Landfill:
Dry Segregated MSW at Landfill = Percentage of Dry Segregated MSW * Segregated MSW at Landfill
Wet Segregated MSW = Segregated MSW – Dry Segregated MSW
→ Centralized Treatment of Wet Segregated MSW at Landfill:
Centralized Treated MSW = Percentage of Centralized Treatment of Wet Segregated MSW * Wet Segregated MSW
Leftover Wet MSW at Landfill = Wet Segregated MSW – Centralized Treated MSW
→ MSW in Landfill:
Non‐Segregated MSW at Landfill + Dry Segregated MSW at Landfill + Leftover Wet MSW at Landfill
→ MSW to Landfill Per Capita:

Spreadsheet Tool User Manual for Planning MSW Management
30
MSW in Landfill / Population
RESULTS WORKSHEET
→ Landfill Life and Adequacy:
Landfill Life = {Unused Existing Landfill Capacity – (10 (Current Year MSW to Landfill) + 4.5 ([Current+10 MSW to Landfill] – Current Year MSW to landfill))} / [Current+10 MSW to Landfill]
SCHEMES WORKSHEET
→ Maximum Permissible Total Amount of Impact for the various variables:
For Percentage of Per Capita MSW Generation, the maximum permissible Total Amount of Impact has been fixed at 20% Decrease
Based on current inputs for Percentage of Segregation, Percentage of Recycling and Percentage of Treatment,
Then
Below 25% 300% Increase 25‐35% 180% Increase 35‐45% 120% Increase 45‐55% 80% Increase 55‐65% 50% Increase 65‐75% 30% Increase 75‐85% 10% Increase 85‐95% 5% Increase
→ Modified Inputs based on total impact of the schemes:
Eg. [Percentage Increase in Percentage of Segregation * Percentage of Segregation] + Percentage of Segregation = Modified Percentage of Segregation

Spreadsheet Tool User Manual for Planning MSW Management
31
4 User Flexibility in the Spreadsheet Tool
The User has the option of deciding several inputs in the Spreadsheet Tool. These options have been provided to make this Spreadsheet Tool usable for any city’s MSW Management. The options available for the user in the worksheets of the Spreadsheet Tool are listed below:
Inputs Worksheet: All the inputs that are to be entered in this Worksheet are to be entered by the User based on the scenario of the particular city in discussion.
Wardwise Calculations Worksheet: In this worksheet, the User has the option of selecting the number of Wards in the city. There are two population growth models for the user to decide. The user then can make edits in the various inputs required in this worksheet marked in green color. Different values for different wards can be given for number of bins and vehicles.
Results and Waste Flow Worksheet: The user has the choice of choosing the decade for which the results are to be viewed.
Schemes Worksheet: The user can select or not select the given Schemes in this worksheet. The user has the option of adding more schemes on to this worksheet. User can also change the impact percentage values however this would be subject to the maximum values which are assigned based on the initial inputs entered by the user in the Inputs Worksheet.
The user has the option of selecting and not selecting the schemes in various combinations in order to visualize the change brought out by the schemes impact on the waste inventory as well as to enhance the discussion process.
The user also has the option of shifting from one worksheet to another for making input changes and viewing different decade results. This is very useful for the user to understand the MSW Management situation of the city, discuss and to decide the options that need to be taken for improving it.

Spreadsheet Tool User Manual for Planning MSW Management
32
5 Example – Pune City Waste Data Analysis using
Spreadsheet Tool
5.1 Inputs

Spreadsheet Tool User Manual for Planning MSW Management
33
5.2 Results – Current Year

Spreadsheet Tool User Manual for Planning MSW Management
34