user guide - eld initiative · the economics of land management eld initiative: user guide ......
TRANSCRIPT

THE ECONOMICS OF LAND DEGRADATION
A 6+1 step approach to assess the economics of land management
ELD Initiative:User Guide
www.eld-initiative.org

2
Suggested citation:
ELD Initiative (2015). ELD Initiative User Guide: A 6+1 step approach to assess the economics of land management. GIZ: Bonn, Germany.
Available from www.eld-initiative.org
Coordinated by: Naomi Stewart (UNU-INWEH)
Main Contributors: Nicola Favretto (UNU-INWEH), Emmanuelle Quillérou (ELD Initiative scientific coordination consultant), Naomi Stewart (UNU-INWEH) and Hannes Etter (GIZ)
Reviewers: Christina Seeberg-Elverfeldt (BMZ) and Richard Thomas (ICARDA)
This ELD User Guide was published with the support of the partner organisations of the ELD Initiative and Deutsche Gesellschaft für Internationale Zusammenarbeit (GIZ) GmbH on behalf of the German Federal Ministry for Economic Cooperation and Development (BMZ).
Photography: Evan Schneider/UN Photo (front and back cover), Clemens Olbrich (pg. 10); Emmanuelle Quillérou (pg. 11); David Mark/Pixabay (pg. 14); taxcredits.net (pg. 17); Pixabay (pg. 21); UN Photo (pg. 28); Nicola Favretto (pg. 29) Visual concept: MediaCompany, Bonn Office Layout: kippconcept GmbH, Bonn
ISBN: 978-92-808-6060-3
For further information and feedback please contact:ELD [email protected] Schauerc/o Deutsche Gesellschaft für Internationale Zusammenarbeit (GIZ) GmbHFriedrich-Ebert-Allee 3653113 Bonn, Germany
A 6+1 step approach to assess the economics of land management
July 2015
Economics of Land Degradation Initiative:User Guide
www.eld-initiative.org
4
Acronyms and abbreviations
CBA Cost-benefit analysis
ELD Economics of Land Degradation (Initiative)
FAO Food and Agriculture Organization of the United Nations
GIS Geographical Information System
HICU Homogenous Image Classification Unit
LEDESS Landscape Ecological Decision and Evaluation Support System
MCDA Multi-Criteria Decision Analysis
USD United States Dollar
USPED Unit Stream Power Erosion Deposition
WOCAT World Overview of Conservation Approaches and Techniques
A G L O B A L I N I T I A T I V E F O R S U S T A I N A B L E L A N D M A N A G E M E N T
5
Table of contents
Acronyms and abbreviations . . . . . . . . . . . . . . . . . . . . . . . . . . . . . . . . . . . . . . . . . . . . . . . 4
The ELD Initiative . . . . . . . . . . . . . . . . . . . . . . . . . . . . . . . . . . . . . . . . . . . . . . . . . . . . . . . . . 6
The 6+1 step approach . . . . . . . . . . . . . . . . . . . . . . . . . . . . . . . . . . . . . . . . . . . . . . . . . . . . . 7
Step 1 Inception . . . . . . . . . . . . . . . . . . . . . . . . . . . . . . . . . . . . . . . . . . . . . . . . . . . . . . . . . . . . . . . . 10
Step 2 Geographical characteristics . . . . . . . . . . . . . . . . . . . . . . . . . . . . . . . . . . . . . . . . . . . . . . 12
Step 3 Types of ecosystem services . . . . . . . . . . . . . . . . . . . . . . . . . . . . . . . . . . . . . . . . . . . . . . . . 14
Step 4 Role of ecosystem services and economic valuation . . . . . . . . . . . . . . . . . . . . . . . . . . 17
Step 5 Patterns and pressures . . . . . . . . . . . . . . . . . . . . . . . . . . . . . . . . . . . . . . . . . . . . . . . . . . . . 21
Step 6 Cost-benefit analysis and decision-making . . . . . . . . . . . . . . . . . . . . . . . . . . . . . . . . . . 24
+ 1 Take action: change, adapt and facilitate . . . . . . . . . . . . . . . . . . . . . . . . . . . . . . . . . . . . 28
References . . . . . . . . . . . . . . . . . . . . . . . . . . . . . . . . . . . . . . . . . . . . . . . . . . . . . . . . . . . . . . . 30
Appendix – Economic valuation methods . . . . . . . . . . . . . . . . . . . . . . . . . . . . . . . . . . . 33
List of figures . . . . . . . . . . . . . . . . . . . . . . . . . . . . . . . . . . . . . . . . . . . . . . . . . . . . . . . . . . . . . 39
List of tables . . . . . . . . . . . . . . . . . . . . . . . . . . . . . . . . . . . . . . . . . . . . . . . . . . . . . . . . . . . . . . 39
List of boxes . . . . . . . . . . . . . . . . . . . . . . . . . . . . . . . . . . . . . . . . . . . . . . . . . . . . . . . . . . . . . . 39

6
The ELD Initiative
Land degradation and desertification reduce the provision of ecosystem services by lands and soils. This constrains development, reduces water, food, and energy security, and triggers resource con-flicts. Although biophysical processes and eco-nomic impacts are increasingly understood, efforts to combat degradation have been failing thus far to prevent further losses of land produc-tivity, a cost estimated at 42 billion USD/year (Dregne & Chou, 1992; Requier-Desjardins, 2007). The on-going global reduction of land will also be felt at regional and local scales, hindering further economic development, and further aggravating the poverty and vulnerability of the rural poor, who number 35 per cent of the world’s population and additionally rely most heavily on land for their survival, sustenance, and livelihoods (Millennium Ecosystems Assessment, 2005; Barbier & Hochard, 2014). Driven by this issue and the need to address it, the Economics of Land Degradation (ELD) Initiative highlights the economic dimension of soil and land degradation in order to provide methods for valuing land accurately and thus enable its effi-cient and sustainable use. It promotes transdisci-plinary approaches drawing from a range of scien-tific insights for informed decision-making and planning, and strives to highlight the economic potential of natural resource use to foster action and support investments in their sustainable use. Based on the capital asset framework, ecosystem service framework and ‘Total Economic Value’ framework, the methodological approach pro-moted by the Initiative can be applied at different scales and scopes, with the aim to achieve a more holistic assessment of the value of different land use options (Noel and Soussan, 2010; ELD Initia-tive, 2013) for all stakeholders. Evidence of the eco-nomic benefits of sustainable land management options have been compiled and summarised, and assessment results are being provided to three critical target groups: the private sector, scientific community, and policy-/decision-makers.
To enable the use of economic assessments of land management through cost-benefit analyses, prin-ciples of economic valuation were provided by the Initiative to support quick on-site assessments (see the ELD Initiative’s Scientific Interim Report, 2013). Additionally, the ELD Initiative’s Practitioner’s Guide (2014) provides case studies from ELD MOOC 2014 participants, which can be referenced as practical examples by the three target groups of the Initiative. As part of these outputs, this docu-ment serves as an instructional and guiding text for stakeholders interested in performing cost-benefit analyses for sustainable land management options using the ELD Initiative supported approach, and includes examples from the Initia-tive and its partners to demonstrate how each part of the process functions practically.

A G L O B A L I N I T I A T I V E F O R S U S T A I N A B L E L A N D M A N A G E M E N T
7
The 6+1 step approach
The 6+1 step approach is the analysis method that has been adopted by the ELD Initiative to guide users through the process of establishing scientifi-cally sound cost-benefit analyses to inform deci-sion-making processes. Table 1 shows a summary
of each step and which aspect of the process it tar-gets. Each step will then be discussed in detail, with practical examples from the work of the ELD Initiative to date, and guidelines on how to exe-cute it.
T A B L E 1
The 6+1 step approach of the ELD Initiative (adapted and expanded from the methodolgy by Noel & Soussan (2010), the ELD Initiative Scientific Interim Report (2013), and Chapter 2 of the ELD Initiative Report ‘The Value of Land' (in print, 2015))
1. Inception Identification of the scope, location, spatial scale, and strategic focus of the study, based on stakeholder consultation.
Preparation of background materials on the socio-economic and environmental context of the assessment.
Methods for: stakeholder participation (consultation, engagement); systematic review and synthesis of academic and grey literature; selection of relevant existing case studies; extrapolation of existing case studies for global comparison; collection of background socio-economic and environmental data; policy analysis.
2. �Geographical�characteristics
Establishment of the geographic and ecological boundaries of the study area identified in Step 1, following an assessment of quantity, spatial distribution, and ecological characteristics of land cover types that are categorised into agro- ecological zones and analysed through a Geographical Information System (GIS).
Methods for: stakeholder participation (consultation, engagement); definition and mapping of land covers and agro-ecological zones from the sciences (physical geography, ecology, soil sciences, landscape sciences, etc.).
3. �Types�of� ecosystem�services
For each land cover category identified in Step 2, identification and analysis of stocks and flows of ecosystem services for classification along the four categories of the ecosystem service framework (provisioning, regulating, cultural, and supporting services).
Methods for: stakeholder participation (consultation, engagement); identifying different ecosystem stocks and flows (from ecology); categorising ecosystem services into the four categories of the ecosystem service framework.

8
4. �Roles�of� ecosystem�services�and economic valuation
Establishment of the link between the role of ecosystem services in the livelihoods of communities living in each land cover area and in overall economic development in the study zone. Estimation of the total economic value for each ecosystem service.
Methods for: stakeholder participation (consultation, engagement); identification of available economic data from relevant case studies; data collection and surveys; multi-criteria analyses to identify important ecosystem services; valuation methods for estimation of “missing” economic values (no market price); extrapolation of case studies for global comparison.
5. �Patterns�and�pressures
Identification of land degradation patterns and drivers, pressures on sustainable management of land resources and drivers of adoption of sustainable land management (including determining the role of property rights and legal systems), and their spatial distribution to inform the establishment of global scenarios. Revision of previous steps if needed, to ensure the assessment is as comprehensive as possible.
Methods for: stakeholder participation (consultation, engagement); identification of types of land degradation, patterns, and pressures (from soil sciences, ecology, agricultural sciences, physical geography, etc.); mapping methods (GIS); establishment of global scenarios.
6. �Cost-benefit�analysis�and�decision making
Cost-benefit analysis (CBA) comparing costs and benefits of an ‘action’ scenario to that of a ‘business-as-usual’ scenario to assess whether the proposed land manage-ment changes lead to net benefits. (‘Action’ scenarios include land management changes that can reduce or remove degradation pressures). Mapping of net benefits for identification of the locations for which land management changes are suitable from an economic perspective. This will lead to the identification of “on-the-ground” actions that are economically desirable.
Methods for: stakeholder participation (consultation, engagement); cost benefit analysis with participatory establishment of action scenario and business as usual scenario, choice of discount rate, computation of indicators of economic viability; mapping methods (GIS); estimation of shadow interest rates. Tools�to�facilitate�the�building�of�cost-benefit�analyses�(micro-economic�level):�Toolkit for Ecosystem Service at Site-based Assessment (TESSA); Assessment and Research Infrastructure for Ecosystem Services (ARIES); Corporate Ecosystem Services Review (ESR); Integrated Valuation of Ecosystem Services and Tradeoffs (InVEST); Multi-scale Integrated Models of Ecosystem Services (MIMES); Natura 2000, etc.
A G L O B A L I N I T I A T I V E F O R S U S T A I N A B L E L A N D M A N A G E M E N T
9
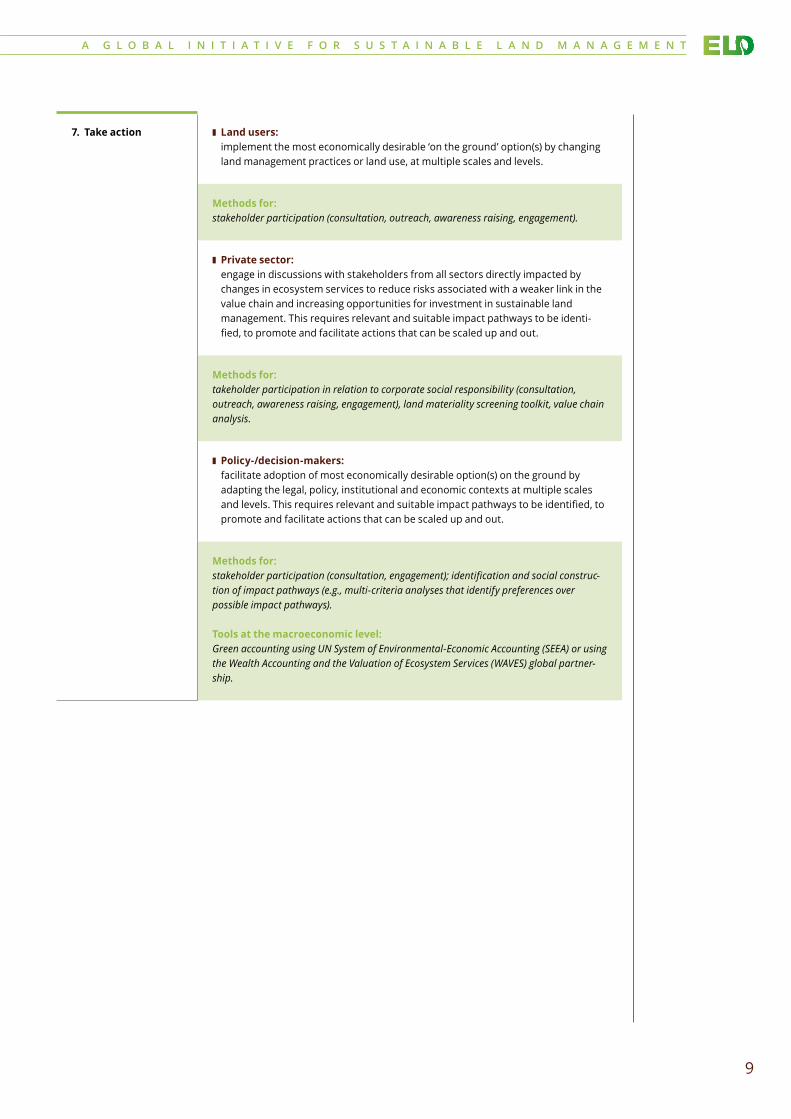
7. Take�action ❚ �Land�users:� implement the most economically desirable ‘on the ground’ option(s) by changing land management practices or land use, at multiple scales and levels.
Methods for: stakeholder participation (consultation, outreach, awareness raising, engagement).
❚ �Private�sector:� engage in discussions with stakeholders from all sectors directly impacted by changes in ecosystem services to reduce risks associated with a weaker link in the value chain and increasing opportunities for investment in sustainable land management. This requires relevant and suitable impact pathways to be identi-fied, to promote and facilitate actions that can be scaled up and out.
Methods for: takeholder participation in relation to corporate social responsibility (consultation, outreach, awareness raising, engagement), land materiality screening toolkit, value chain analysis.
❚ �Policy-/decision-makers:� facilitate adoption of most economically desirable option(s) on the ground by adapting the legal, policy, institutional and economic contexts at multiple scales and levels. This requires relevant and suitable impact pathways to be identified, to promote and facilitate actions that can be scaled up and out.
Methods for: stakeholder participation (consultation, engagement); identification and social construc-tion of impact pathways (e.g., multi-criteria analyses that identify preferences over possible impact pathways). Tools at the macroeconomic level: Green accounting using UN System of Environmental-Economic Accounting (SEEA) or using the Wealth Accounting and the Valuation of Ecosystem Services (WAVES) global partner-ship.
S T E P
01
10
Inception
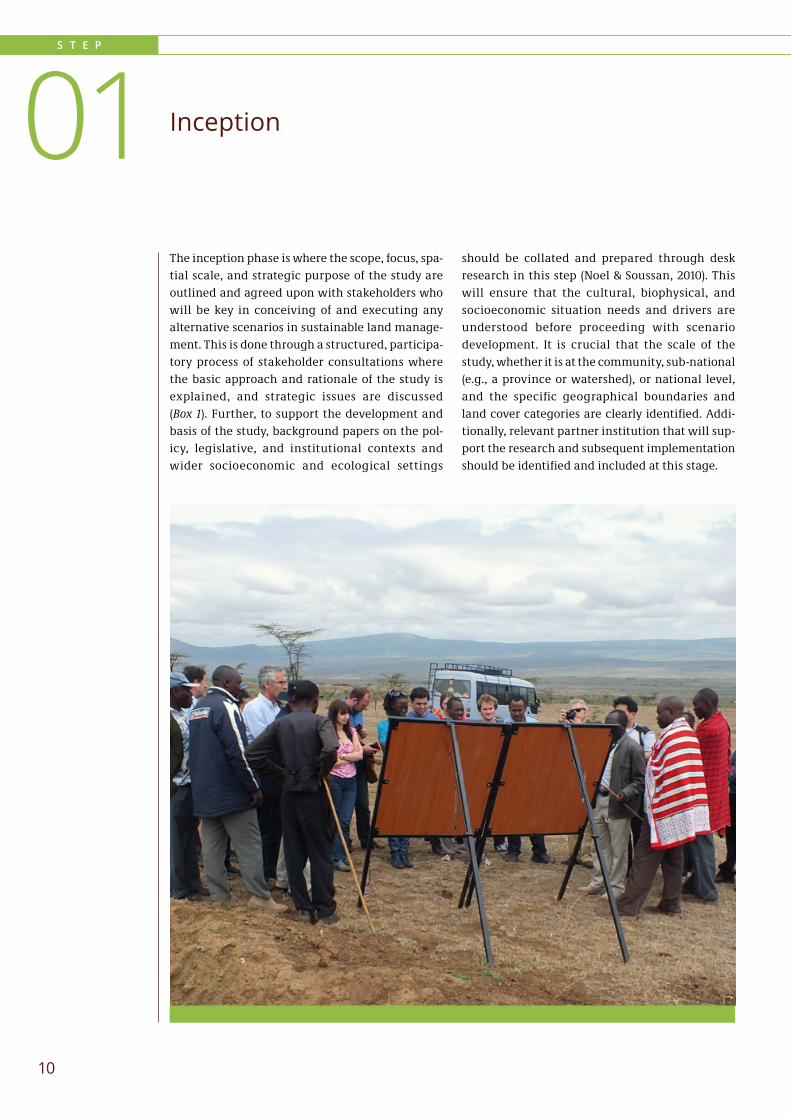
The inception phase is where the scope, focus, spa-tial scale, and strategic purpose of the study are outlined and agreed upon with stakeholders who will be key in conceiving of and executing any alternative scenarios in sustainable land manage-ment. This is done through a structured, participa-tory process of stakeholder consultations where the basic approach and rationale of the study is explained, and strategic issues are discussed (Box 1). Further, to support the development and basis of the study, background papers on the pol-icy, legislative, and institutional contexts and wider socioeconomic and ecological settings
should be collated and prepared through desk research in this step (Noel & Soussan, 2010). This will ensure that the cultural, biophysical, and socioeconomic situation needs and drivers are understood before proceeding with scenario development. It is crucial that the scale of the study, whether it is at the community, sub-national (e.g., a province or watershed), or national level, and the specific geographical boundaries and land cover categories are clearly identified. Addi-tionally, relevant partner institution that will sup-port the research and subsequent implementation should be identified and included at this stage.
A G L O B A L I N I T I A T I V E F O R S U S T A I N A B L E L A N D M A N A G E M E N T
11
ELD stakeholder consultations (compiled from Juepner & Noel (2014); Kisingo et al. (2014); Egemi & Ganawa (2014))
B O X 1
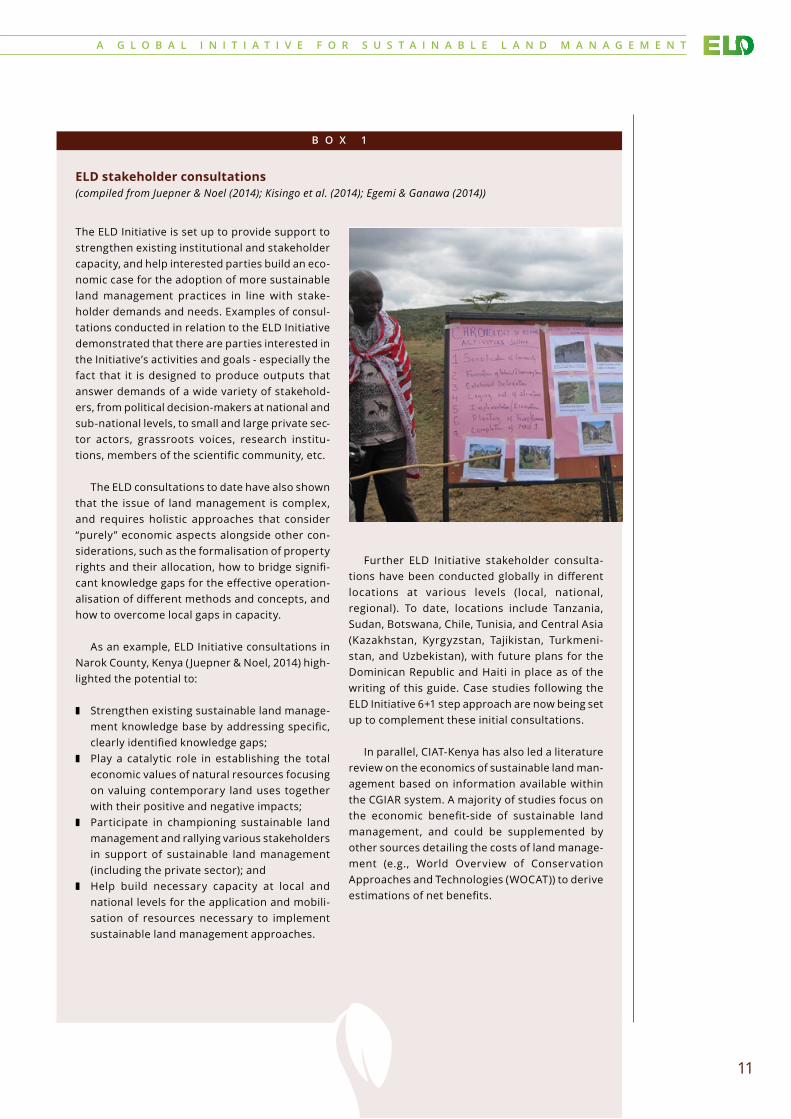
The ELD Initiative is set up to provide support to strengthen existing institutional and stakeholder capacity, and help interested parties build an eco-nomic case for the adoption of more sustainable land management practices in line with stake-holder demands and needs. Examples of consul-tations conducted in relation to the ELD Initiative demonstrated that there are parties interested in the Initiative’s activities and goals - especially the fact that it is designed to produce outputs that answer demands of a wide variety of stakehold-ers, from political decision-makers at national and sub-national levels, to small and large private sec-tor actors, grassroots voices, research institu-tions, members of the scientific community, etc.
The ELD consultations to date have also shown that the issue of land management is complex, and requires holistic approaches that consider “purely” economic aspects alongside other con-siderations, such as the formalisation of property rights and their allocation, how to bridge signifi-cant knowledge gaps for the effective operation-alisation of different methods and concepts, and how to overcome local gaps in capacity.
As an example, ELD Initiative consultations in Narok County, Kenya ( Juepner & Noel, 2014) high-lighted the potential to:
❚ Strengthen existing sustainable land manage-ment knowledge base by addressing specific, clearly identified knowledge gaps;
❚ Play a catalytic role in establishing the total economic values of natural resources focusing on valuing contemporary land uses together with their positive and negative impacts;
❚ Participate in championing sustainable land management and rallying various stakeholders in support of sustainable land management (including the private sector); and
❚ Help build necessary capacity at local and national levels for the application and mobili-sation of resources necessary to implement sustainable land management approaches.
Further ELD Initiative stakeholder consulta-tions have been conducted globally in different locations at various levels (local, national, regional). To date, locations include Tanzania, Sudan, Botswana, Chile, Tunisia, and Central Asia (Kazakhstan, Kyrgyzstan, Tajikistan, Turkmeni-stan, and Uzbekistan), with future plans for the Dominican Republic and Haiti in place as of the writing of this guide. Case studies following the ELD Initiative 6+1 step approach are now being set up to complement these initial consultations.
In parallel, CIAT-Kenya has also led a literature review on the economics of sustainable land man-agement based on information available within the CGIAR system. A majority of studies focus on the economic benefit-side of sustainable land management, and could be supplemented by other sources detailing the costs of land manage-ment (e.g., World Overview of Conservation Approaches and Technologies (WOCAT)) to derive estimations of net benefits.
S T E P
12
02 Geographical characteristics
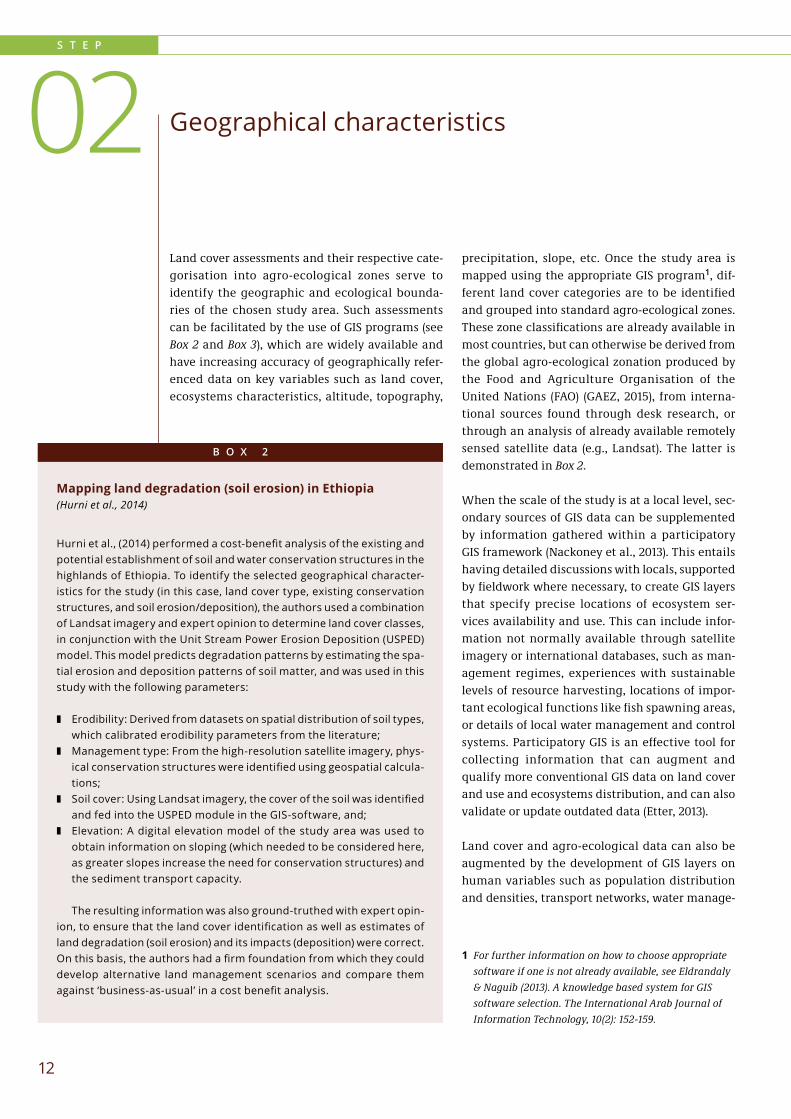
Land cover assessments and their respective cate-gorisation into agro-ecological zones serve to identify the geographic and ecological bounda-ries of the chosen study area. Such assessments can be facilitated by the use of GIS programs (see Box 2 and Box 3), which are widely available and have increasing accuracy of geographically refer-enced data on key variables such as land cover, ecosystems characteristics, altitude, topography,
precipitation, slope, etc. Once the study area is mapped using the appropriate GIS program1, dif-ferent land cover categories are to be identified and grouped into standard agro-ecological zones. These zone classifications are already available in most countries, but can otherwise be derived from the global agro-ecological zonation produced by the Food and Agriculture Organisation of the United Nations (FAO) (GAEZ, 2015), from interna-tional sources found through desk research, or through an analysis of already available remotely sensed satellite data (e.g., Landsat). The latter is demonstrated in Box 2.
When the scale of the study is at a local level, sec-ondary sources of GIS data can be supplemented by information gathered within a participatory GIS framework (Nackoney et al., 2013). This entails having detailed discussions with locals, supported by fieldwork where necessary, to create GIS layers that specify precise locations of ecosystem ser-vices availability and use. This can include infor-mation not normally available through satellite imagery or international databases, such as man-agement regimes, experiences with sustainable levels of resource harvesting, locations of impor-tant ecological functions like fish spawning areas, or details of local water management and control systems. Participatory GIS is an effective tool for collecting information that can augment and qualify more conventional GIS data on land cover and use and ecosystems distribution, and can also validate or update outdated data (Etter, 2013).
Land cover and agro-ecological data can also be augmented by the development of GIS layers on human variables such as population distribution and densities, transport networks, water manage-
Mapping�land�degradation�(soil�erosion)�in�Ethiopia(Hurni et al., 2014)
B O X 2
Hurni et al., (2014) performed a cost-benefit analysis of the existing and potential establishment of soil and water conservation structures in the highlands of Ethiopia. To identify the selected geographical character-istics for the study (in this case, land cover type, existing conservation structures, and soil erosion/deposition), the authors used a combination of Landsat imagery and expert opinion to determine land cover classes, in conjunction with the Unit Stream Power Erosion Deposition (USPED) model. This model predicts degradation patterns by estimating the spa-tial erosion and deposition patterns of soil matter, and was used in this study with the following parameters:
❚ Erodibility: Derived from datasets on spatial distribution of soil types, which calibrated erodibility parameters from the literature;
❚ Management type: From the high-resolution satellite imagery, phys-ical conservation structures were identified using geospatial calcula-tions;
❚ Soil cover: Using Landsat imagery, the cover of the soil was identified and fed into the USPED module in the GIS-software, and;
❚ Elevation: A digital elevation model of the study area was used to obtain information on sloping (which needed to be considered here, as greater slopes increase the need for conservation structures) and the sediment transport capacity.
The resulting information was also ground-truthed with expert opin-ion, to ensure that the land cover identification as well as estimates of land degradation (soil erosion) and its impacts (deposition) were correct. On this basis, the authors had a firm foundation from which they could develop alternative land management scenarios and compare them against ‘business-as-usual’ in a cost benefit analysis.
1 For further information on how to choose appropriate software if one is not already available, see Eldrandaly & Naguib (2013). A knowledge based system for GIS software selection. The International Arab Journal of Information Technology, 10(2): 152-159.

A G L O B A L I N I T I A T I V E F O R S U S T A I N A B L E L A N D M A N A G E M E N T
13
ment infrastructure (e.g., dams, levies, canals), data on farming systems and livelihood patterns, social factors (e.g., distribution of ethnic minori-ties), etc. These outputs can provide the data for an assessment of existing land cover patterns and systems. Furthermore, where suitable time series data is available, the analysis of existing land cover patterns can be supplemented by looking at trends in changing land cover over time. This can be of particular importance for users to identify where present and future degradation pressures are, and can reveal where augmenting existing land resource exploitation values through land management regimes changes could be prior-itized.
A GIS-based approach can provide a straightfor-ward and replicable method for assessing key pat-terns and trends in land resources. Its use tends to be more common in countries that have devel-oped extensive databases but can be adapted to low capacities and low resources contexts (Etter, 2013; Hurni et al., 2014; Morales et al., 2015). This can require more complex models to assess future trends in land cover pattern changes, and several models exist for this purpose already. This includes the Conversion of Land Use and its Effects (CLUE) model, which statistically allocates land use changes to the most suitable locations (Verburg et al., 2002). Another model is the Landscape Ecologi-cal Decision and Evaluation Support System (LEDESS) model (Eupen et al., 2002). LEDESS is a GIS-based computer model used to assess and evaluate the effects of land use changes on ecological func-tions. Originally developed to assess changes in habitat and ecological suitability, it can be adapted to work within an ecosystems services framework to analyse changes to land resource values. The model also allows the implications of different sustainable land management approaches to be assessed in terms of their anticipated effects on basic ecological characteristics of different land cover types, and resulting consequences on the availability of ecosystems service values. One advantage of LEDESS is that it combines empirical quantitative data with values derived from expert opinion and assessments. This is useful where ver-ified empirical data is not available for key param-eters needed for the analysis (Noel & Soussan, 2010).
Assessing land degradation through GIS in Peru: Piura�case�study
B O X 3
The following map was developed by Morales et al. (2015) for the ELD Initiative, based in the Piura region of Peru. It highlights the net primary production trend, based on information obtained from the World Atlas of Desertification by the Joint Research Centre of the European Commis-sion and Piura Regional Government. Authors compared the trend between 1982 and 2009, and calculated an index by overlaying the dif-ferent datasets in GIS with land degradation (erosion) that was associ-ated with high slopes. Shaded areas represent levels of degradation within the different districts – information that was obtained from the regional government of Piura and adapted through local stakeholder workshops. Overlaying these various GIS datasets helped to validate and confirm the findings of participatory consultations on the ground.
Other examples of GIS use in the ELD Initiative include the study by Hurni et al., 2014, the ongoing work of the ELD Working Group on Data and Methodology (see for example, Turner et al., 2015), and ELD case studies in Central Asia that are on-going (expected to be published late 2015).
Medio
Bajo
Niver de degradación
Evolutión del NPP1985–1989 a 2005–2009
+++
+
0
–
––
–––
Alto
S T E P
14
03 Types of ecosystem services
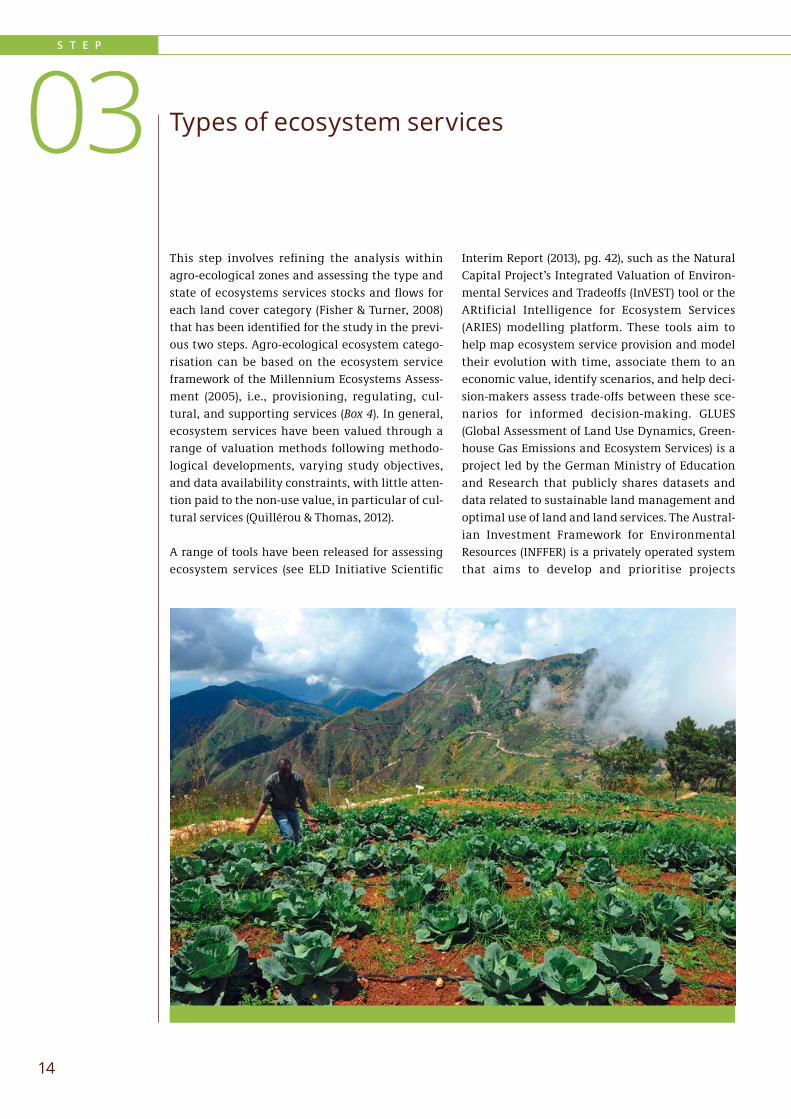
This step involves refining the analysis within agro-ecological zones and assessing the type and state of ecosystems services stocks and flows for each land cover category (Fisher & Turner, 2008) that has been identified for the study in the previ-ous two steps. Agro-ecological ecosystem catego-risation can be based on the ecosystem service framework of the Millennium Ecosystems Assess-ment (2005), i.e., provisioning, regulating, cul-tural, and supporting services (Box 4). In general, ecosystem services have been valued through a range of valuation methods following methodo-logical developments, varying study objectives, and data availability constraints, with little atten-tion paid to the non-use value, in particular of cul-tural services (Quillérou & Thomas, 2012).
A range of tools have been released for assessing ecosystem services (see ELD Initiative Scientific
Interim Report (2013), pg. 42), such as the Natural Capital Project’s Integrated Valuation of Environ-mental Services and Tradeoffs (InVEST) tool or the ARtificial Intelligence for Ecosystem Services (ARIES) modelling platform. These tools aim to help map ecosystem service provision and model their evolution with time, associate them to an economic value, identify scenarios, and help deci-sion-makers assess trade-offs between these sce-narios for informed decision-making. GLUES (Global Assessment of Land Use Dynamics, Green-house Gas Emissions and Ecosystem Services) is a project led by the German Ministry of Education and Research that publicly shares datasets and data related to sustainable land management and optimal use of land and land services. The Austral-ian Investment Framework for Environmental Resources (INFFER) is a privately operated system that aims to develop and prioritise projects
A G L O B A L I N I T I A T I V E F O R S U S T A I N A B L E L A N D M A N A G E M E N T
15
addressing environmental issues such as reduced water quality, biodiversity, environmental pests, and land degradation. MIMES (Multiscale Inte-grated Models of Ecosystem Services) is an initia-tive lead by the University of Vermont which also aims to evaluate ecosystem services. TESSA (Toolkit for Ecosystem Service at Site-based Assessment) compares the net changes of estimates of alterna-tive land use scenarios (e.g., before and after changes in land use) and assesses the benefits for human well-being that may be gained or lost. ESR
(Corporate Ecosystem Services Review) provides a method in developing strategies to manage busi-ness risks and opportunities linked to a company's dependence on ecosystems and their services.
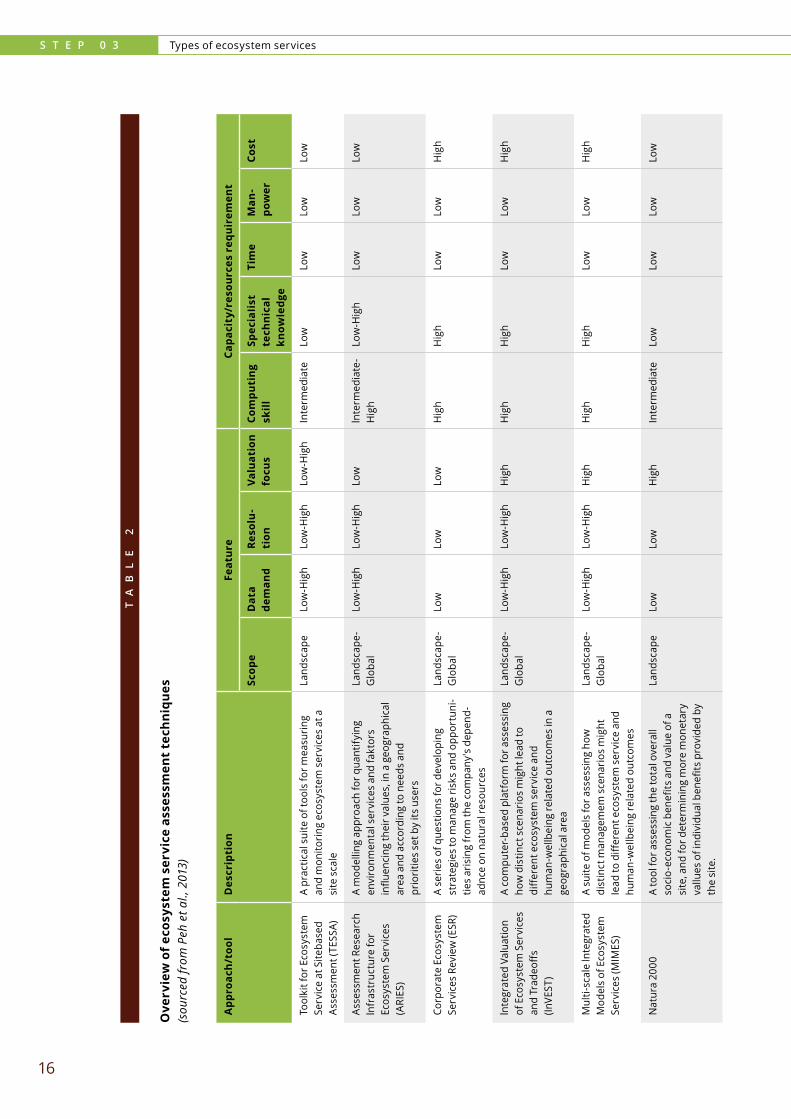
Some of these assessment techniques are summa-rised in Table 2, together with their features (e.g., scope and data demand) and resource require-ment (i.e., skills, knowledge, time, manpower, and cost).
Examples�of�ecosystem�services�
B O X 4
There are four general types of ecosystem ser-vices (Turner et al., 2015):
❚ Provisioning services – these services com-bine with built, human, and social capitals, resulting in food, timber, fibre, water, fuel, min-erals, building materials and shelter, biodiver-sity and genetic resources, or other ‘provision-ing’ benefits. For example, grains are delivered to people as food, but require tools (built capi-tal), farmers (human capital), and farming com-munities (social capital) to produce.
❚ Regulating� services – these combine with t built, human, and social capital to regulate pro-cesses such as climatic events with water flow regulation (e.g., for increased flood or drought control, storm protection), pollution control, decrease in soil erosion, nutrient cycling, human disease regulation, water purification, air quality maintenance, pollination, pest con-trol, and climate control with carbon storage and sequestration. For example, storm protec-tion by coastal wetlands requires built infra-structure, people, and communities to be pro-tected. These services are generally not mar-keted but have clear and direct value to society.
❚ Cultural services – these combine with built, human, and social capital to produce more material benefits linked to recreation (tourism) and hunting as well as non-material benefits such as spiritual or aesthetic, education, cul-tural identity, sense of place, or other ‘cultural’ benefits. For example, production of a recrea-tional benefit requires a beautiful natural asset
(a mountain), in combination with built infra-structure (a road, trail, etc.), human capital (people able to appreciate the mountain expe-rience), and social capital (family, friends and institutions that make the mountain accessible and safe). Such cultural services would tend to be mostly experienced through tourism or reli-gious practices.
❚ Supporting services – these maintain basic ecosystem processes and functions such as soil formation, primary productivity, biogeo-chemistry, soil formation, and nutrient cycling. They affect human well-being indirectly by maintaining processes necessary for provision-ing, regulating, and cultural services. For exam-ple, net primary production is an ecosystem function that supports climate control through carbon sequestration and removal from the atmosphere, which combines with built, human, and social capital to provide climate regulation benefits. Some argue that these supporting ‘services’ should be rather defined as ecosystem ‘functions’, since they have not yet clearly interacted with the other three forms of capital to create benefits in terms of increased human well-being but that support or underlie these benefits. Supporting ecosys-tem services may sometimes be used as prox-ies for benefits when the benefits cannot be easily measured directly.
For examples of ecosystem service categorisa-tion, see Haines-Young & Potschin (2012) and Maes et al., (2013).
S T E P 0 3 Types of ecosystem services
16
TA
BL
E
2
Ove
rview�of�e
cosystem
�service�assessm
ent�tech
niqu
es(s
ourc
ed fr
om P
eh e
t al.,
201
3)
App
roac
h/too
lD
escr
ipti
onFe
atur
eCa
pacity/res
ources�req
uiremen
t
Scop
eD
ata
dem
and
Reso
lu-
tion
Valu
atio
n fo
cus
Com
puti
ng
skill
Spec
iaIi
st
tech
nica
l kn
owle
dge
Tim
eM
an-
pow
erCo
st
Tool
kit f
or E
cosy
stem
Se
rvic
e at
Site
base
d As
sess
men
t (TE
SSA)
A pr
actic
al s
uite
of t
ools
for m
easu
ring
and
mon
itorin
g ec
osys
tem
ser
vice
s at
a
site
sca
le
Land
scap
eLo
w-H
igh
Low
-Hig
hLo
w-H
igh
Inte
rmed
iate
Low
Low
Low
Low
Asse
ssm
ent R
esea
rch
lnfr
astr
uctu
re fo
r Ec
osys
tem
Ser
vice
s (A
RIES
)
A m
odel
ling
appr
oach
for q
uant
ifyin
g en
viro
nmen
tal s
ervi
ces
and
fakt
ors
influ
enci
ng th
eir v
alue
s, in
a g
eogr
aphi
cal
area
and
acc
ordi
ng to
nee
ds a
nd
prio
ritie
s se
t by
its u
sers
Land
scap
e-G
loba
lLo
w-H
igh
Low
-Hig
hLo
wln
term
edia
te-
Hig
hLo
w-H
igh
Low
Low
Low
Corp
orat
e Ec
osys
tem
Se
rvic
es R
evie
w (E
SR)
A se
ries
of q
uest
ions
for d
evel
opin
g st
rate
gies
to m
anag
e ris
ks a
nd o
ppor
tuni
-tie
s ar
isin
g fr
om th
e co
mpa
ny's
dep
end-
adnc
e on
nat
ural
reso
urce
s
Land
scap
e-G
loba
lLo
wLo
wLo
wH
igh
Hig
hLo
wLo
wH
igh
lnte
grat
ed V
alua
tion
of E
cosy
stem
Ser
vice
s an
d Tr
adeo
ffs
(InVE
ST)
A co
mpu
ter-
base
d pl
atfo
rm fo
r ass
essi
ng
how
dis
tinct
sce
nario
s m
ight
lead
to
diffe
rent
eco
syst
em s
ervi
ce a
nd
hum
an-w
ellb
eing
rela
ted
outc
omes
in a
ge
ogra
phic
al a
rea
Land
scap
e-G
loba
lLo
w-H
igh
Low
-Hig
hH
igh
Hig
hH
igh
Low
Low
Hig
h
Mul
ti-sc
ale
lnte
grat
ed
Mod
els
of E
cosy
stem
Se
rvic
es (M
IMES
)
A su
ite o
f mod
els
for a
sses
sing
how
di
stin
ct m
anag
emem
sce
nario
s m
ight
Ie
ad to
diff
eren
t eco
syst
em s
ervi
ce a
nd
hum
an-w
eIlb
eing
rela
ted
outc
omes
Land
scap
e-G
loba
lLo
w-H
igh
Low
-Hig
hH
igh
Hig
hH
igh
Low
Low
Hig
h
Nat
ura
2000
A to
ol fo
r ass
essi
ng th
e to
tal o
vera
ll so
cio-
econ
omic
ben
efits
and
val
ue o
f a
site
, and
for d
eter
min
ing
mor
e m
onet
ary
vallu
es o
f ind
ivid
ual b
enefi
ts p
rovi
ded
by
the
site
.
Land
scap
eLo
wLo
wH
igh
Inte
rmed
iate
Low
Low
Low
Low
17
S T E P
04Role of ecosystem services and economic valuation
This step identifies the role of the assessed ecosys-tems services in the livelihoods of the communi-ties living in each land cover area, and in the over-all economic development of the study zone. This requires estimating the total economic value of these services (use and non-use values), to esti-mate the benefits of action or the cost of inaction (i.e., the maximum benefits from action that could be derived).
Overview of valuation methods
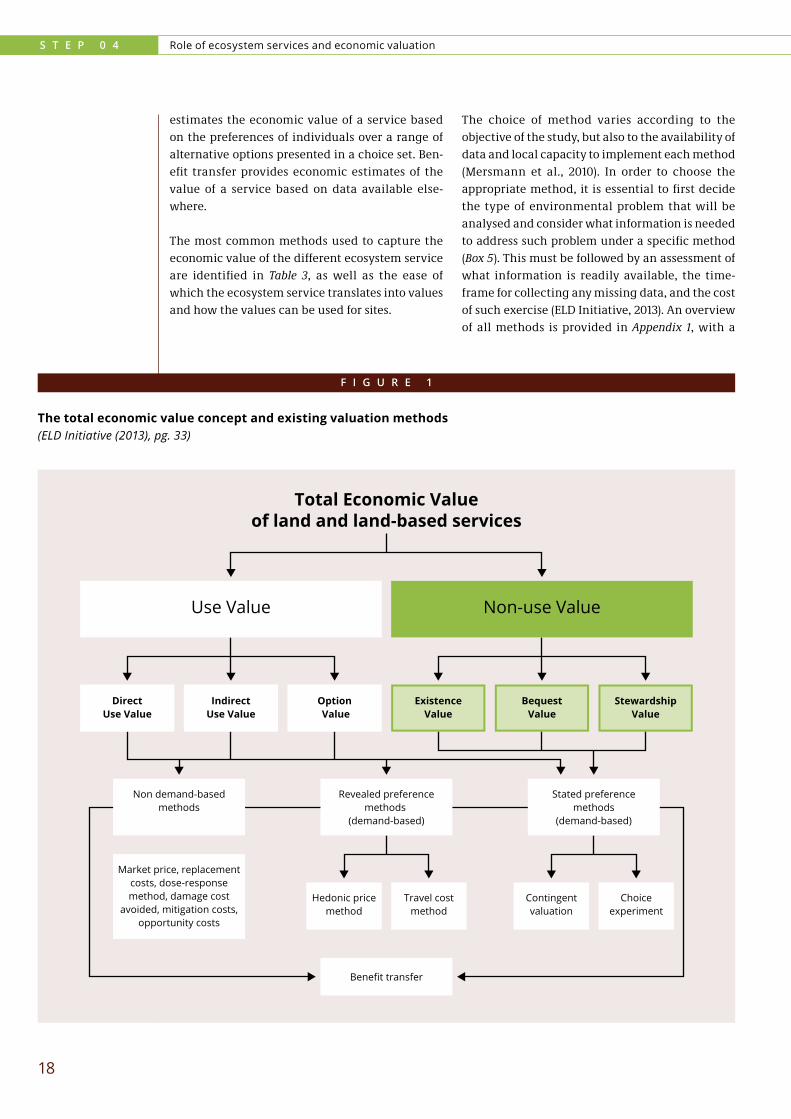
Figure 1 outlines the range of valuation methods that can be used for each sub-component of the total economic value.
Non demand-based methods do not involve the estimation of a demand curve (i.e., a graph that shows the relationship between the price of a ser-vice – vertical axis – and the quantity of the ser-vice demanded – horizontal axis) for each service
and are based on market prices, replacement costs, dose-response estimation, avoided damage costs, mitigation costs and opportunity costs (ELD Initiative, 2013; Favretto et al., 2014a). Methods based on the estimation of the demand curve (demand-based) include revealed preference methods, which rely on actual behaviour in exist-ing markets, and stated preference methods, which estimate the value of services not usually purchased and sold in actual markets. Under the revealed preference, the hedonic price method provides an estimation of the economic value of an ecosystem service from the price paid for some-thing that includes it. The travel cost method esti-mates how much money the user is willing to pay for travel in order to benefit from an ecosystem service. Under the stated preference methods, con-tingent valuation is an estimation of the economic value of a service based on the expression of how much people are willing to pay for it (or willing to accept for its reduction), while choice experiment
S T E P 0 4 Role of ecosystem services and economic valuation
18
estimates the economic value of a service based on the preferences of individuals over a range of alternative options presented in a choice set. Ben-efit transfer provides economic estimates of the value of a service based on data available else-where.
The most common methods used to capture the economic value of the different ecosystem service are identified in Table 3, as well as the ease of which the ecosystem service translates into values and how the values can be used for sites.
The choice of method varies according to the objective of the study, but also to the availability of data and local capacity to implement each method (Mersmann et al., 2010). In order to choose the appropriate method, it is essential to first decide the type of environmental problem that will be analysed and consider what information is needed to address such problem under a specific method (Box 5). This must be followed by an assessment of what information is readily available, the time-frame for collecting any missing data, and the cost of such exercise (ELD Initiative, 2013). An overview of all methods is provided in Appendix 1, with a
F I G U R E 1
The total economic value concept and existing valuation methods (ELD Initiative (2013), pg. 33)
Non demand-basedmethods
Revealed preferencemethods
(demand-based)
Benefit transfer
Hedonic pricemethod
Market price, replacementcosts, dose-responsemethod, damage cost
avoided, mitigation costs,opportunity costs
Travel costmethod
Contingentvaluation
Choiceexperiment
Stated preferencemethods
(demand-based)
DirectUse Value
IndirectUse Value
Option Value
ExistenceValue
BequestValue
Use Value Non-use Value
StewardshipValue
Total Economic Valueof land and land-based services
A G L O B A L I N I T I A T I V E F O R S U S T A I N A B L E L A N D M A N A G E M E N T
19
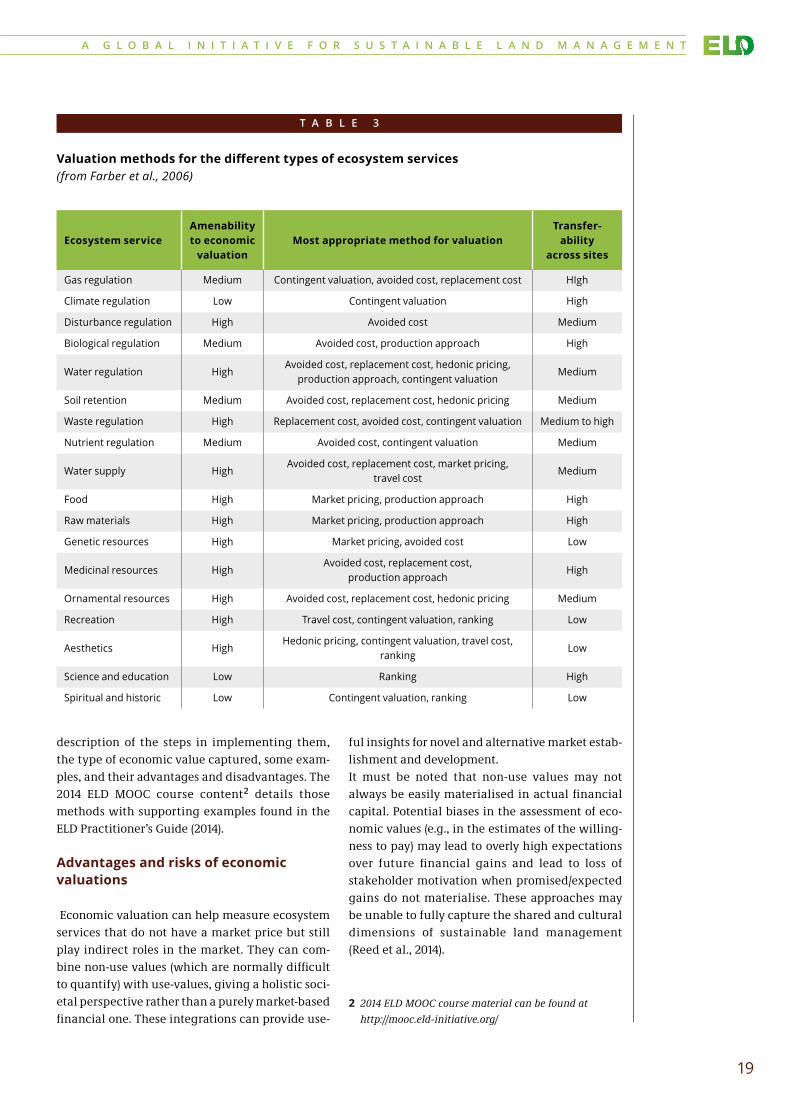
description of the steps in implementing them, the type of economic value captured, some exam-ples, and their advantages and disadvantages. The 2014 ELD MOOC course content2 details those methods with supporting examples found in the ELD Practitioner’s Guide (2014).
Advantages and risks of economic valuations
Economic valuation can help measure ecosystem services that do not have a market price but still play indirect roles in the market. They can com-bine non-use values (which are normally difficult to quantify) with use-values, giving a holistic soci-etal perspective rather than a purely market-based financial one. These integrations can provide use-
ful insights for novel and alternative market estab-lishment and development.It must be noted that non-use values may not always be easily materialised in actual financial capital. Potential biases in the assessment of eco-nomic values (e.g., in the estimates of the willing-ness to pay) may lead to overly high expectations over future financial gains and lead to loss of stakeholder motivation when promised/expected gains do not materialise. These approaches may be unable to fully capture the shared and cultural dimensions of sustainable land management (Reed et al., 2014).
T A B L E 3
Valuation�methods�for�the�different�types�of�ecosystem�services(from Farber et al., 2006)
Ecosystem�service
Amenability�to economic
valuation
Most appropriate method for valuation
Transfer- ability�
across sites
Gas regulation Medium Contingent valuation, avoided cost, replacement cost HIgh
Climate regulation Low Contingent valuation High
Disturbance regulation High Avoided cost Medium
Biological regulation Medium Avoided cost, production approach High
Water regulation HighAvoided cost, replacement cost, hedonic pricing,
production approach, contingent valuationMedium
Soil retention Medium Avoided cost, replacement cost, hedonic pricing Medium
Waste regulation High Replacement cost, avoided cost, contingent valuation Medium to high
Nutrient regulation Medium Avoided cost, contingent valuation Medium
Water supply HighAvoided cost, replacement cost, market pricing,
travel costMedium
Food High Market pricing, production approach High
Raw materials High Market pricing, production approach High
Genetic resources High Market pricing, avoided cost Low
Medicinal resources HighAvoided cost, replacement cost,
production approachHigh
Ornamental resources High Avoided cost, replacement cost, hedonic pricing Medium
Recreation High Travel cost, contingent valuation, ranking Low
Aesthetics HighHedonic pricing, contingent valuation, travel cost,
rankingLow
Science and education Low Ranking High
Spiritual and historic Low Contingent valuation, ranking Low
2 2014 ELD MOOC course material can be found at http://mooc.eld-initiative.org/
S T E P 0 4 Role of ecosystem services and economic valuation
20
Ecosystem�services�valuation�in�Sudan�
B O X 5
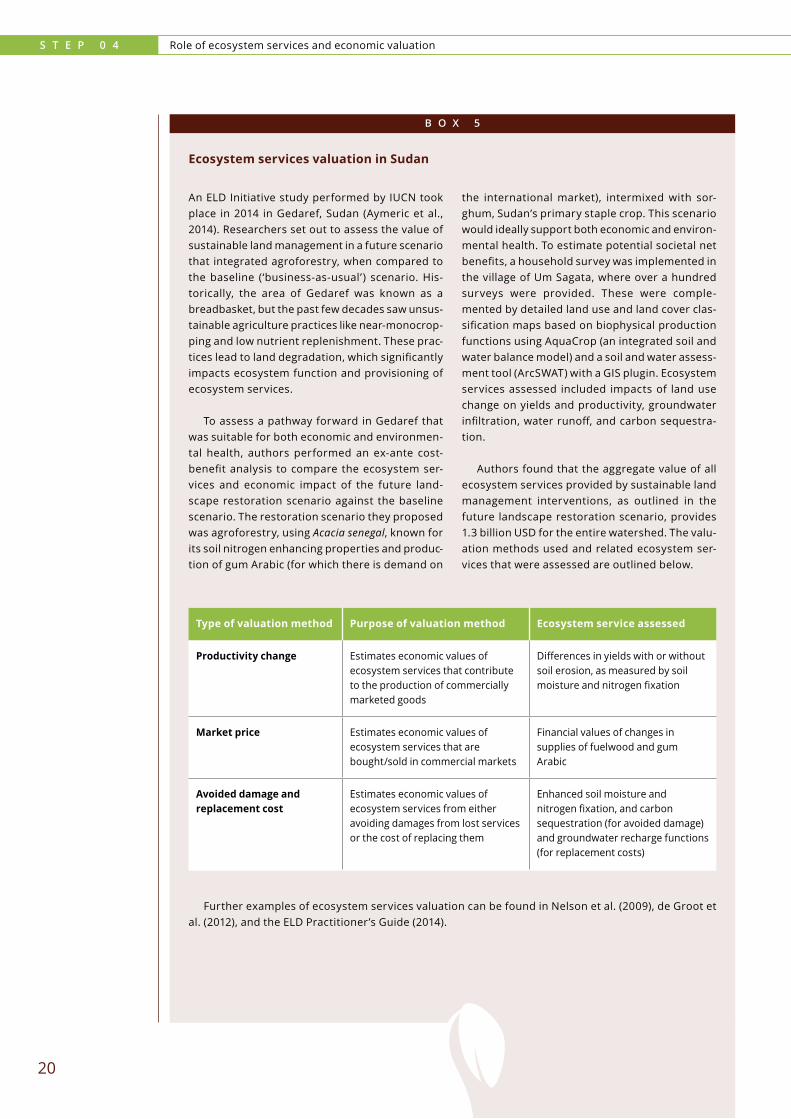
An ELD Initiative study performed by IUCN took place in 2014 in Gedaref, Sudan (Aymeric et al., 2014). Researchers set out to assess the value of sustainable land management in a future scenario that integrated agroforestry, when compared to the baseline (‘business-as-usual’) scenario. His-torically, the area of Gedaref was known as a breadbasket, but the past few decades saw unsus-tainable agriculture practices like near-monocrop-ping and low nutrient replenishment. These prac-tices lead to land degradation, which significantly impacts ecosystem function and provisioning of ecosystem services.
To assess a pathway forward in Gedaref that was suitable for both economic and environmen-tal health, authors performed an ex-ante cost-benefit analysis to compare the ecosystem ser-vices and economic impact of the future land-scape restoration scenario against the baseline scenario. The restoration scenario they proposed was agroforestry, using Acacia senegal, known for its soil nitrogen enhancing properties and produc-tion of gum Arabic (for which there is demand on
the international market), intermixed with sor-ghum, Sudan’s primary staple crop. This scenario would ideally support both economic and environ-mental health. To estimate potential societal net benefits, a household survey was implemented in the village of Um Sagata, where over a hundred surveys were provided. These were comple-mented by detailed land use and land cover clas-sification maps based on biophysical production functions using AquaCrop (an integrated soil and water balance model) and a soil and water assess-ment tool (ArcSWAT) with a GIS plugin. Ecosystem services assessed included impacts of land use change on yields and productivity, groundwater infiltration, water runoff, and carbon sequestra-tion.
Authors found that the aggregate value of all ecosystem services provided by sustainable land management interventions, as outlined in the future landscape restoration scenario, provides 1.3 billion USD for the entire watershed. The valu-ation methods used and related ecosystem ser-vices that were assessed are outlined below.
Further examples of ecosystem services valuation can be found in Nelson et al. (2009), de Groot et al. (2012), and the ELD Practitioner’s Guide (2014).
Type�of�valuation�method Purpose of valuation method Ecosystem�service�assessed
Productivity�change Estimates economic values of ecosystem services that contribute to the production of commercially marketed goods
Differences in yields with or without soil erosion, as measured by soil moisture and nitrogen fixation
Market price Estimates economic values of ecosystem services that are bought/sold in commercial markets
Financial values of changes in supplies of fuelwood and gum Arabic
Avoided damage and replacement cost
Estimates economic values of ecosystem services from either avoiding damages from lost services or the cost of replacing them
Enhanced soil moisture and nitrogen fixation, and carbon sequestration (for avoided damage) and groundwater recharge functions (for replacement costs)

21
S T E P
05Patterns and pressures
This step involves the identification of land degra-dation patterns, and drivers and pressures on the sustainable management of land resources. It includes the spatial distribution of such resources and the assessment of factors causing degrada-
tion. This information is needed to inform the development of alternative scenarios for cost-ben-efit analyses that will be carried out under Step 6 (Box 6).
B O X 6
Scenario planning in Ethiopia
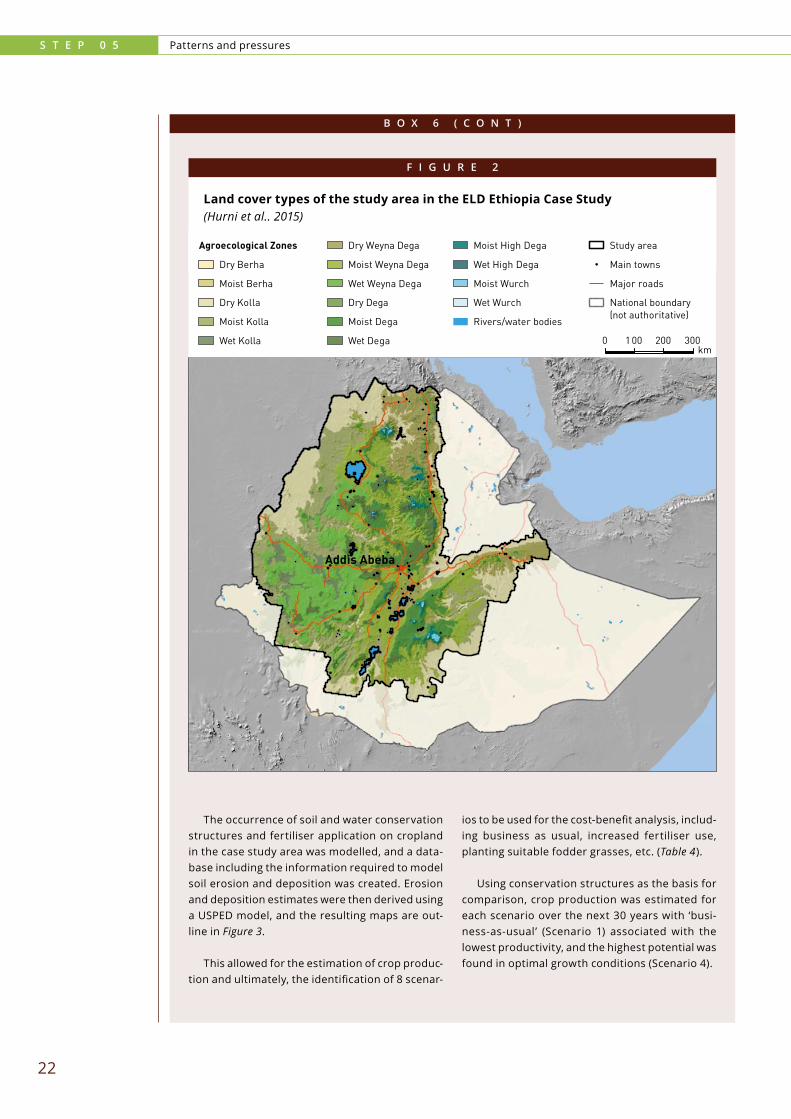
The ELD Ethiopia case study performed by Hurni et al. (2014) (see Box 2) covered an area of 614,000 km2 (or 54 per cent of the country) where rainfed agriculture is practised. By using Landsat imagery and the Homogenous Image Classification Units (HICUs) approach, a high-resolution land cover
map was produced using 50 cover types from for-est to grassland, from cropland to settlement, from bare land to water body (Figure 2). Multiple information sources were used in the HICU devel-opment, including altitude, terrain, farming sys-tem, rainfall pattern and soil.
S T E P 0 5 Patterns and pressures
22
B O X 6 ( C O N T )
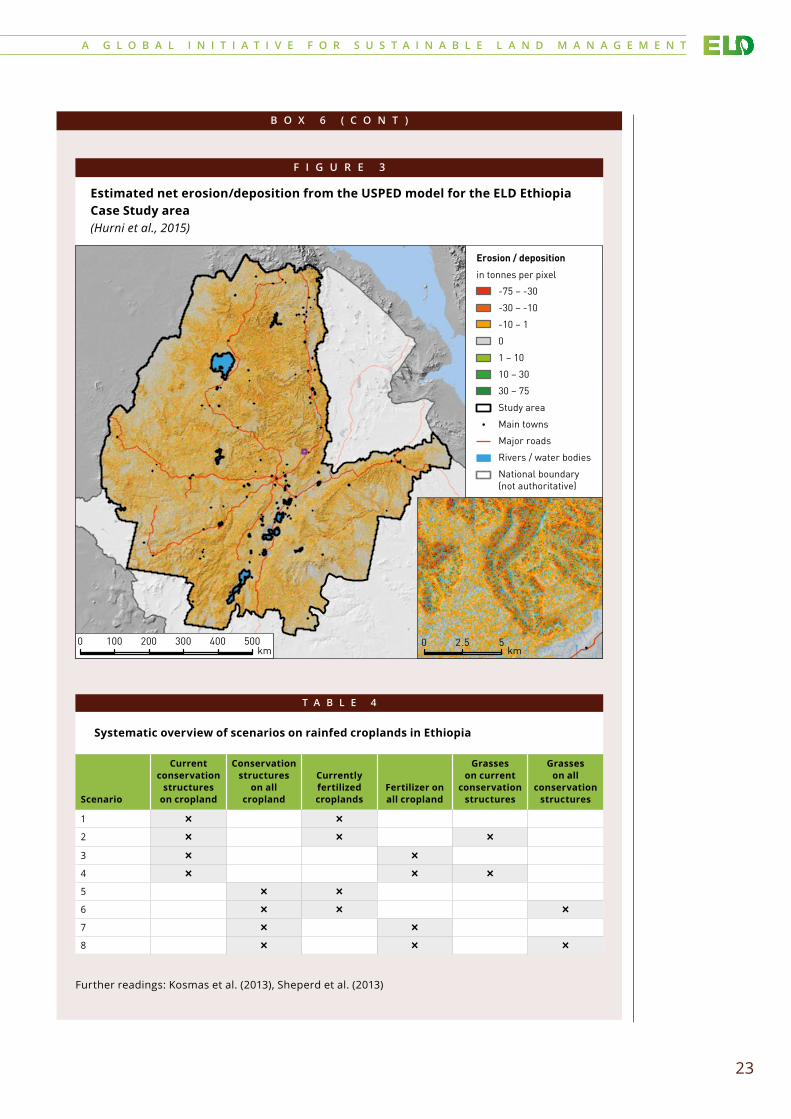
The occurrence of soil and water conservation structures and fertiliser application on cropland in the case study area was modelled, and a data-base including the information required to model soil erosion and deposition was created. Erosion and deposition estimates were then derived using a USPED model, and the resulting maps are out-line in Figure 3.
This allowed for the estimation of crop produc-tion and ultimately, the identification of 8 scenar-
ios to be used for the cost-benefit analysis, includ-ing business as usual, increased fertiliser use, planting suitable fodder grasses, etc. (Table 4).
Using conservation structures as the basis for comparison, crop production was estimated for each scenario over the next 30 years with ‘busi-ness-as-usual’ (Scenario 1) associated with the lowest productivity, and the highest potential was found in optimal growth conditions (Scenario 4).
Addis Abeba
!
Agroecological Zones
Dry Berha
Moist Berha
Dry Kolla
Moist Kolla
Wet Kolla
Dry Weyna Dega
Moist Weyna Dega
Wet Weyna Dega
Dry Dega
Moist Dega
Wet Dega
Moist High Dega
Wet High Dega
Moist Wurch
Wet Wurch
Rivers/water bodies
Study area
Main towns
Major roads
National boundary(not authoritative)
0 1 00 200 300km
F I G U R E 2
Land�cover�types�of�the�study�area�in�the�ELD�Ethiopia�Case�Study��(Hurni et al.. 2015)
A G L O B A L I N I T I A T I V E F O R S U S T A I N A B L E L A N D M A N A G E M E N T
23
B O X 6 ( C O N T )
Further readings: Kosmas et al. (2013), Sheperd et al. (2013)
Debre Birhan!
0 2.5 5km
0 100 200 300 400 500km
!
-75 – -30
-30 – -10
-10 – 1
0
1 – 10
10 – 30
30 – 75
Study area
Main towns
Major roads
Rivers / water bodies
National boundary(not authoritative)
Erosion / deposition
in tonnes per pixel
F I G U R E 3
Estimated�net�erosion/deposition�from�the�USPED�model�for�the�ELD�Ethiopia�Case�Study�area�(Hurni et al., 2015)
T A B L E 4
Systematic�overview�of�scenarios�on�rainfed�croplands�in�Ethiopia
Scenario
Current conservation
structures on cropland
Conservation structures
on all cropland
Currently�fertilized croplands
Fertilizer on all cropland
Grasses on current
conservation structures
Grasses on all
conservation structures
1 l l
2 l l l
3 l l
4 l l l
5 l l
6 l l l
7 l l
8 l l l

S T E P
24
06 Cost-benefit analysis and decision-making
This step involves the assessment of sustainable land management options that can reduce or remove degradation pressures, including analysis of their economic viability and identification of locations for which they are suitable. Cost-benefit analyses are used for this purpose, as it compares the costs of adopting a sustainable land manage-ment practice against the benefits derived from it (ELD Initiative, 2013). Such costs and benefits are estimated using the methods detailed in Step 4, and depend upon the level of action taken and changes achieved. By detracting costs from bene-fits, the net economic benefit from action can be determined.
Key steps in performing a cost-benefit analysis include (Snell, 2011):
(i) Definition of the target group to be guided or informed;
(ii) Definition of criteria: the timeframe for analy-sis and categories of benefits and costs must be defined in advance. A discount rate is also
needed to be able to compare the costs and benefits in time and produce three indicators of success (i.e., net present value, internal rate of return, and benefit-to-cost ratio) to assess whether the action is financially (or economi-cally) worth undertaking;
(iii) Calculating economic benefits and costs under alternative scenarios (e.g., business-as-usual or changes in land use);
(iv) Comparing net benefits of action to net bene-fits from business-as-usual to estimate the ‘added value’ of action compared to what is already being done;
(v) Deriving economic indicators of viability to assess whether an action is worth taking from an economic point of view; and,
(vi) Undertaking a sensitivity analysis to deter-mine the degree and impact of uncertainty.
An example of how cost-benefit analyses can be applied to scenario planning is provided by the ELD Ethiopia Case Study (Box 7).
A G L O B A L I N I T I A T I V E F O R S U S T A I N A B L E L A N D M A N A G E M E N T
25
B O X 7
!
Scenario 1.1
Scenario 1.2
Scenario 2.2
Scenario 3.2
Scenario 4.2
Study area
Main towns
Major roads
Rivers / water bodies
National boundary(not authoritative)
Best scenario based on NPV
F I G U R E 4
The�best�scenario�based�on�net�present�value�(NPV)�for�different�regions�in�the�ELD�Ethiopia�Case�Study�area��(Hurni et al., 2015)
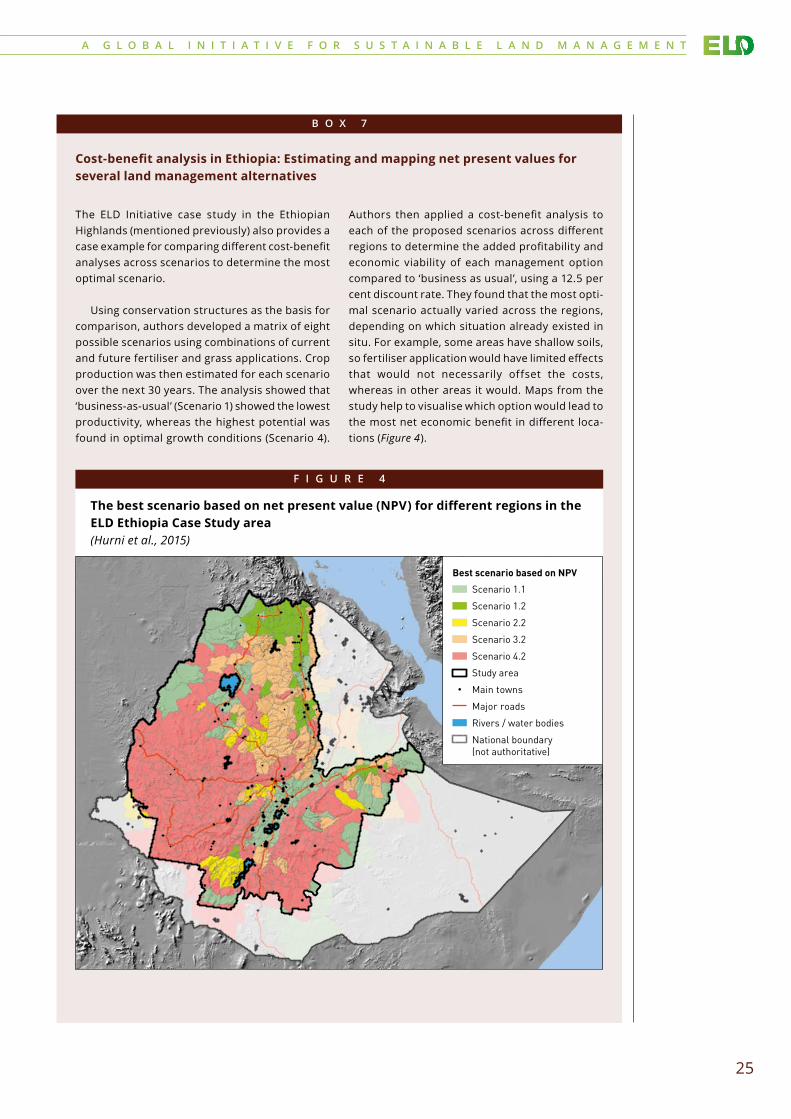
Cost-benefit�analysis�in�Ethiopia:�Estimating�and�mapping�net�present�values�for�several land management alternatives
The ELD Initiative case study in the Ethiopian Highlands (mentioned previously) also provides a case example for comparing different cost-benefit analyses across scenarios to determine the most optimal scenario.
Using conservation structures as the basis for comparison, authors developed a matrix of eight possible scenarios using combinations of current and future fertiliser and grass applications. Crop production was then estimated for each scenario over the next 30 years. The analysis showed that ‘business-as-usual’ (Scenario 1) showed the lowest productivity, whereas the highest potential was found in optimal growth conditions (Scenario 4).
Authors then applied a cost-benefit analysis to each of the proposed scenarios across different regions to determine the added profitability and economic viability of each management option compared to ‘business as usual’, using a 12.5 per cent discount rate. They found that the most opti-mal scenario actually varied across the regions, depending on which situation already existed in situ. For example, some areas have shallow soils, so fertiliser application would have limited effects that would not necessarily offset the costs, whereas in other areas it would. Maps from the study help to visualise which option would lead to the most net economic benefit in different loca-tions (Figure 4).
S T E P 0 6 Cost-benefits analysis and decision-making
26
B O X 7 ( C O N T )
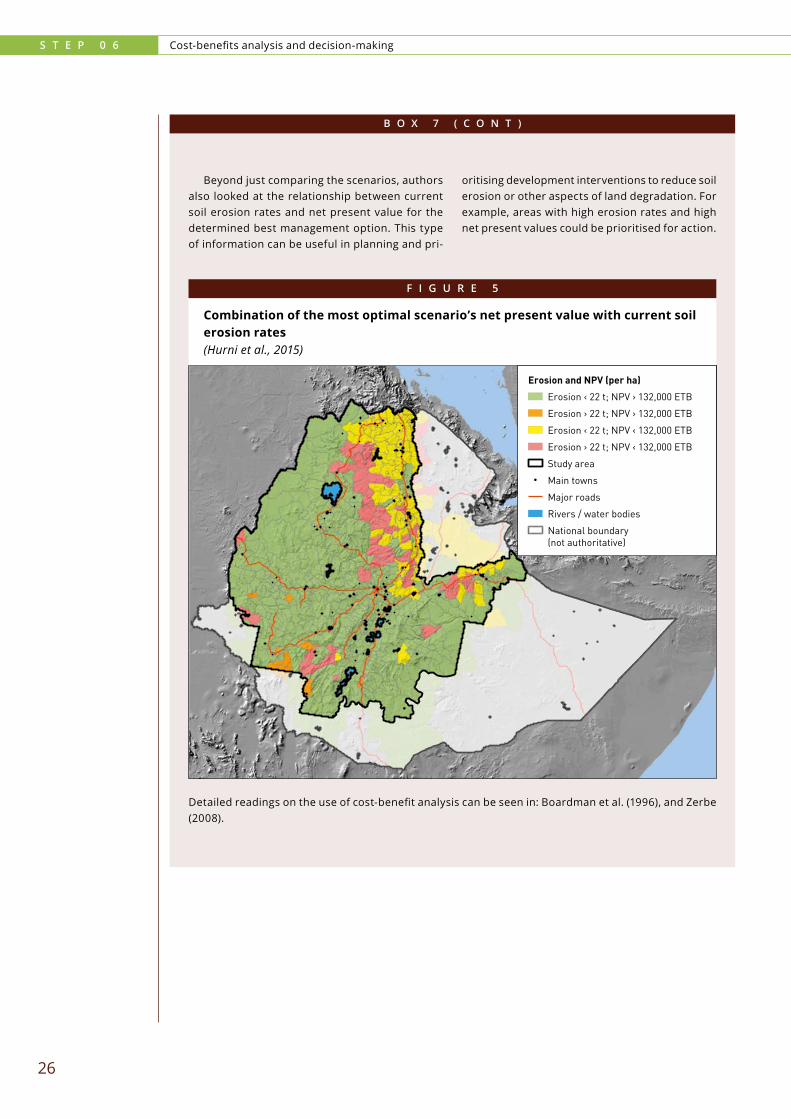
Beyond just comparing the scenarios, authors also looked at the relationship between current soil erosion rates and net present value for the determined best management option. This type of information can be useful in planning and pri-
oritising development interventions to reduce soil erosion or other aspects of land degradation. For example, areas with high erosion rates and high net present values could be prioritised for action.
!
Erosion ‹ 22 t; NPV › 132,000 ETB
Erosion › 22 t; NPV › 132,000 ETB
Erosion ‹ 22 t; NPV ‹ 132,000 ETB
Erosion › 22 t; NPV ‹ 132,000 ETB
Study area
Main towns
Major roads
Rivers / water bodies
National boundary(not authoritative)
Erosion and NPV (per ha)
F I G U R E 5
Combination�of�the�most�optimal�scenario’s�net�present�value�with�current�soil�erosion rates(Hurni et al., 2015)
Detailed readings on the use of cost-benefit analysis can be seen in: Boardman et al. (1996), and Zerbe (2008).

A G L O B A L I N I T I A T I V E F O R S U S T A I N A B L E L A N D M A N A G E M E N T
27
One of the major strengths of cost-benefit analyses is that by quantifying everything homogeneously (in monetary units), it allows for direct compari-sons between costs and benefits across different scenarios. This can help provide an idea of the scale of desired implementation (e.g., from a vil-lage market to international trade) and also to identify the most economically efficient and sus-tainable practice for a given scientific, political, legal, cultural, or social context. As a result, cost-benefit analyses can be used to simulate the impact of and dimension economic incentives or
policy instruments for sustainable land manage-ment (ELD Initiative, 2013).
Scenarios that derive maximum benefits from action can be based on optimistic assumptions (e.g., there are/will be no implementation barriers, everyone collaborates and shares the same ideas about sustainability, etc.). Optimally determined scenarios should be thus used as a guiding ideal, but analyses must stress what can be feasibly achieved in the real world, without creating false expectations of potential benefits.
Alternatives to current rice and mango production practices in the Piura region: benefit-to-cost�ratios(Barrionuevo, 2015)
B O X 8
This study compares the costs of action to the benefits from action for rice and mango produc-tion in the Piura region, both dominating agricul-tural production in the region.
Rice production in the Piura region is affected by soil salinisation, which reduces crop yields. Two more sustainable land management alternatives are considered for economic assessment of ben-efit-to-cost ratios: horizontal desalination for rice production and replacing rice by quinoa produc-tion. The first option is very costly and not really economically attractive. The economic potential of quinoa production is very attractive but depends on demand for quinoa and its market price.
Mango production in the Piura region consti-tutes 75 per cent of mango exports of Peru. Organic production is seen as helping to reduce soil erosion and salinisation, and improve water retention capacity. Organic produce is in demand and is the first alternative to current production practices considered. The second alternative is mango production as part of an agro-forestry sys-tem. Both are financially viable but agro-forestry has higher profitability.
This study did not rely on a full cost-benefit analysis because investment costs were not avail-able, but gives an idea of profitability once the investment has been made.
28
Take action: change, adapt and facilitate
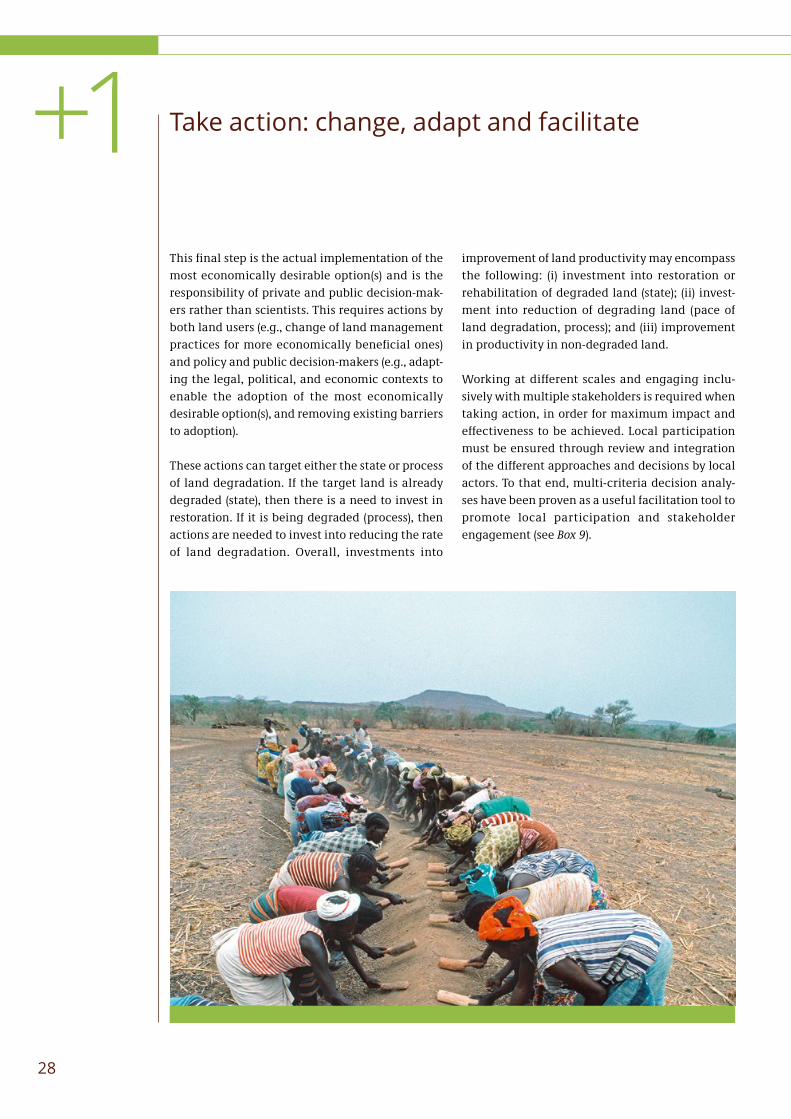
This final step is the actual implementation of the most economically desirable option(s) and is the responsibility of private and public decision-mak-ers rather than scientists. This requires actions by both land users (e.g., change of land management practices for more economically beneficial ones) and policy and public decision-makers (e.g., adapt-ing the legal, political, and economic contexts to enable the adoption of the most economically desirable option(s), and removing existing barriers to adoption).
These actions can target either the state or process of land degradation. If the target land is already degraded (state), then there is a need to invest in restoration. If it is being degraded (process), then actions are needed to invest into reducing the rate of land degradation. Overall, investments into
improvement of land productivity may encompass the following: (i) investment into restoration or rehabilitation of degraded land (state); (ii) invest-ment into reduction of degrading land (pace of land degradation, process); and (iii) improvement in productivity in non-degraded land.
Working at different scales and engaging inclu-sively with multiple stakeholders is required when taking action, in order for maximum impact and effectiveness to be achieved. Local participation must be ensured through review and integration of the different approaches and decisions by local actors. To that end, multi-criteria decision analy-ses have been proven as a useful facilitation tool to promote local participation and stakeholder engagement (see Box 9).
+1
A G L O B A L I N I T I A T I V E F O R S U S T A I N A B L E L A N D M A N A G E M E N T
29
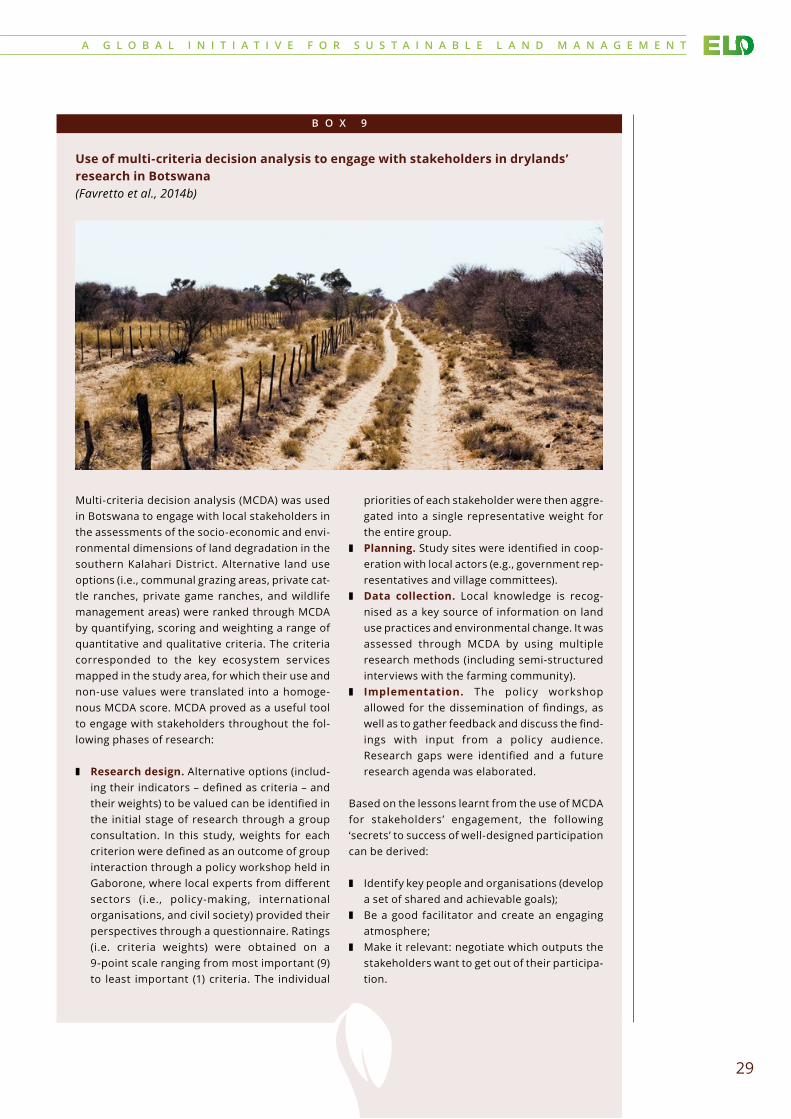
Use�of�multi-criteria�decision�analysis�to�engage�with�stakeholders�in�drylands’�research in Botswana (Favretto et al., 2014b)
B O X 9
Multi-criteria decision analysis (MCDA) was used in Botswana to engage with local stakeholders in the assessments of the socio-economic and envi-ronmental dimensions of land degradation in the southern Kalahari District. Alternative land use options (i.e., communal grazing areas, private cat-tle ranches, private game ranches, and wildlife management areas) were ranked through MCDA by quantifying, scoring and weighting a range of quantitative and qualitative criteria. The criteria corresponded to the key ecosystem services mapped in the study area, for which their use and non-use values were translated into a homoge-nous MCDA score. MCDA proved as a useful tool to engage with stakeholders throughout the fol-lowing phases of research:
❚ Research�design. Alternative options (includ-ing their indicators – defined as criteria – and their weights) to be valued can be identified in the initial stage of research through a group consultation. In this study, weights for each criterion were defined as an outcome of group interaction through a policy workshop held in Gaborone, where local experts from different sectors (i.e., policy-making, international organisations, and civil society) provided their perspectives through a questionnaire. Ratings (i.e. criteria weights) were obtained on a 9-point scale ranging from most important (9) to least important (1) criteria. The individual
priorities of each stakeholder were then aggre-gated into a single representative weight for the entire group.
❚ Planning. Study sites were identified in coop-eration with local actors (e.g., government rep-resentatives and village committees).
❚ Data collection. Local knowledge is recog-nised as a key source of information on land use practices and environmental change. It was assessed through MCDA by using multiple research methods (including semi-structured interviews with the farming community).
❚ Implementation. The policy workshop allowed for the dissemination of findings, as well as to gather feedback and discuss the find-ings with input from a policy audience. Research gaps were identified and a future research agenda was elaborated.
Based on the lessons learnt from the use of MCDA for stakeholders’ engagement, the following ‘secrets’ to success of well-designed participation can be derived:
❚ Identify key people and organisations (develop a set of shared and achievable goals);
❚ Be a good facilitator and create an engaging atmosphere;
❚ Make it relevant: negotiate which outputs the stakeholders want to get out of their participa-tion.

R E F E R E N C E S
30
References
Adhikari, B., & Nadella, K. (2011). Ecological economics
of soil erosion: A review of the current state of
knowledge. Annals of the New York Academy of
Sciences, 1219: 134-152.
Aymeric, R., Myint. M.M., & Westerberg, V. (2015). An
economic valuation of sustainable land manage-
ment through agroforestry in eastern Sudan.
Report for the Economics of Land Degradation Ini-
tiative by the International Union for Conservation
of Nature, Nairobi, Kenya. Available from: www.
eld-initiative.org
Batker, D., de la Torre, I., Costanza, R., Swedeen, P., Day,
J., Boumans, R., & Bagstad, K. (2010). Gaining
ground: Wetlands, hurricanes and the economy:
The value of restoring the Mississippi River Delta.
Tacoma, USA: Earth Economics.
Barrionuevo, M. (2015). La economía de la degradación
de la tierra en la región Piura, Perú. Economics of
Land Degradation (ELD) Initiative, Deutsche
Gesellschaft für Internationale Zusammenarbeit
(GIZ) GmbH. Bonn, Germany: GIZ.
Boardman, A.E., Greenberg, D.H., Vining, A.R., Weimer,
D.L. (1996). Cost-benefit analysis: Concepts and
practice. New Jersey, USA: Prentice Hall Inc.
de Groot, R., Brander, L., van der Ploeg, S., Costanza, R.,
Bernard, F., Braat, L., Christie, M., Crossman, N.,
Ghermandi, A., Hein, L., Hussain, S., Kumar, P.,
McVittie, A., Portela, R., Rodriguez, L.C., ten Brink,
P., & van Beukering, P. (2012). Global estimates of
the value of ecosystems and their services in mon-
etary units. Ecosystem Services 1:50-61.
Dregne, H.E., & Chou, N. (1992). Global desertification
dimensions and costs. In Degradation and Restora-
tion of Arid Lands. Lubbock, USA: Texas Tech.
Egemi, O., & Ganawa, T. (2014). Mapping and consulta-
tions to contexualize the Economics of Land Deg-
radation (ELD) Initiative in Sudan. Report on the
ELD Sudan consultations. Retrieved on [01/06/2015],
from [http://eld-initiative.org/f ileadmin/pdf/
R ep or t s _WG _ S t ac e y / E L D _ S ud a n _ R ep or t _
final_31_Jan_2015.pdf].
ELD Initiative. (2013). The rewards of investing in sus-
tainable land management. Scientific Interim
Report for the Economics of Land Degradation Ini-
tiative: A global strategy for sustainable land man-
agement. Available at: www.eld-initiative.org.
ELD Initiative. (2014). Practitioners Guide: Principles of
economic valuation for sustainable land manage-
ment based on the Massive Open Online Course
‘The Economics of Land Degradation’. Available at:
www.eld-initiative.org.
Etter, H. (2013). Change of a local social ecological sys-
tem in South Africa. Participatory land-use man-
agement as a toolkit for resilience-building. MSc
Thesis, Rheinische Friedrich-Wilhelms Universität
Bonn.
Eupen, M. van, Knol, W., Nijhof, B., & Verweij, P. (2002).
Landscape ecological Decision & Evaluation Sup-
port System LEDESS: Users guide. Retrieved on
[01/06/2015] from [http://library.wur.nl/WebQuery/
wurpubs/427418].
Farber, S.C., Costanza, R., & Wilson, M.A. (2002). Eco-
nomic and ecological concepts for valuing ecosys-
tem services. Ecological Economics, 41(3): 375-392.
Farber, S., R. Costanza, R., Childers, D.L., Erickson, J.,
Gross, K., Grove, M., Hopkinson, C.S., Kahn, H.,
Pincetl, S., Troy, A., Warren, P., & Wilson, M. (2006).
Linking ecology and economics for ecosystem
management. Bioscience 56:121-133.
Favretto, N., Stringer, L.C., Dougill, A.J., Perkins, J.S.,
Atlhopheng, J.R., Reed, M.S., Thomas, A., & Mulale,
K. (2014a). Time-series analysis of policies and mar-
ket prices for provisioning ecosystem services in
Botswana's Kalahari rangelands. Report for the
Economics of Land Degradation Initiative. Availa-
ble at: www.eld-initiative.org.
Favretto, N., Stringer, L.C., Dougill, A.J., Perkins, J.S.,
Akanyang, L., Dallimer, M., Atlhopheng, J.R.,
Mulale, K. 2014b. Assessing the socio-economic
and environmental dimensions of land degrada-
tion: A case study of Botswana’s Kalahari. Report
for the Economics of Land Degradation Initiative.
Available at: www.eld-initiative.org.

A G L O B A L I N I T I A T I V E F O R S U S T A I N A B L E L A N D M A N A G E M E N T
31
Fisher, B. & Turner, R.K. (2008). Ecosystem Services: clas-
sification for valuation. Biological Conservation, 141:
1167–1169.
GAEZ. (2015). Global agro-ecological zones. Retrieved
on [01/06/2015] from [www.fao.org/nr/gaez/en].
Geist, H.J., & Lambin, E.F. (2004). Dynamic Causal Pat-
terns of Desertification. Bioscience, 54: 817-829.
Haines-Young, R.H., & Potschin, M. (2012). Common
International Classification of Ecosystem Services
(CICES): Consultation on Version 4, August-Decem-
ber 2012. Retrieved on [01/06/2015] from [www.
not t i ngha m .ac .u k /cem /p d f /C IC E S % 2 0V4 3 _
Revised%20Final_Report_29012013.pdf].
Hurni, K., Zeleke, G., Kassie, M., Tegegne, B., Kassaw-
mar, T., Teferi, E., Moges, A., Tadesse, D., Ahmed,
M., Degu, Y., Kebebew, Z., Hodel, E., Amdihun, A.,
Mekuriaw, A., Debele, B., Deichert, G., & Hurni, H.
(2015). ELD Ethiopia Case Study. Soil degradation
and sustainable land management in the rainfed
agricultural areas of Ethiopia: An assessment of
the economic implications. Report for the Eco-
nomics of Land Degradation Initiative. Available
at: www.eld-initiative.org.
Juepner & Noel (2014). Support towards the Economics
of Land Degradation (ELD) Initiative. Report on the
ELD Kenya Consultations. Available at: www.eld-
initiative.org.
Kisingo, A.W., Masologwo, D., & Mkanda, F. (2014). Sup-
port towards the Economics of Land Degradation
(ELD) Initiative. Report on the ELD Tanzania Con-
sultation Workshop. Available at: www.eld-initia-
tive.org.
Kosmas, C., Kairis, O., Karavitis, C., Ritsema, C., Salvati,
L., Acikalin, S., Alcalá, M., Alfama, P., Atlhopheng,
J., & Barrera, J. (2013). Evaluation and selection of
indicators for land degradation and desertification
monitoring: methodological approach. Environ-
mental management, 54(5): 951-70.
MAES. (2013). Mapping and Assessment of Ecosystems
and their Services. Discussion paper, European
Union. Retrieved on [01/06/2015] from [http://ec.
europa.eu/environment/nature/knowledge/eco-
system_assessment/pdf/MAESWorkingPaper2013.
pdf].
Mersmann, C., Quatrini, S., Buri, B., Schild, J., & Asen, A.
(2010). Economic valuation of land: An innovative
and scalable approach to advance sustainable
land management. Rome, Italy: GM of the UNCCD.
Millennium Ecosystems Assessment. 2005. Ecosystems
and human well-being: A framework for assess-
ment. Washington, DC: World Resources Institute.
Morales, C., Dascal, G., Aranibar, Z. 2015. Estudio de los
costos de la desertificación y degradación de las
t ierras en el departamento de Piura (Perú).
Comisión Económica para América Latina y el Car-
ibe (CEPAL). Retrieved on [01/06/2015] from [http://
r e p o s i t o r i o . c e p a l . o r g / b i t s t r e a m / h a n -
dle/11362/35900/S2013903_es.pdf?sequence=1].
Nackoney, J., Rybock, D., Dupain, J., & Facheux, C. (2013)
Coupling participatory mapping and GIS to inform
village-level agricultural zoning in the Demo-
cratic Republic of the Congo. Landscape and Urban
Planning, 110: 164–174.
Nelson, E.,Mendoza, G., Regetz, J., Ploasky, S., Tallis, H.,
Cameron, D.R., Chan, K.M.A., Dailey, G.C., Gold-
stein, J., Dareiva, P.M., Lansdorf, E., Naidoo, R.,
Ricketts, T.H., & Shaw, M.R. (2009). Modeling multi-
ple ecosystem services, biodiversity conservation,
commodity production, and tradeoffs at land-
scape scales. Frontiers in Ecology and the Environ-
ment, 7: 4-11.
Nkonya, E., Gerber, N., Baumgartner, P., von Braun, J.,
De Pinto, A., Graw, V., Kato, E., Kloos, J., & Walter, T.
(2011). The economics of land degradation: Towards
an integrated global assessment. Frankfurt, Ger-
many: Peter Lang.
Noel, S., & Soussan, J. (2010). Economics of land degrada-
tion: Supporting evidence-based decision making.
Towards a comprehensive met hodologica l
approach for assessing the costs of land degrada-
tion and the value of sustainable land manage-
ment at national and global level. Rome, Italy: GM
of the UNCCD.
R E F E R E N C E S
32
Peh, K.S., Balmford, A., Bradbury, R.B., Brown, C., Butch-
art, S.H.M, Hughes, F.M.R., Stattersf ield, A.,
Thomas, D.H.L., Walpole, M., Bayliss, J., Gowing, D.,
Jones, J.P.G., Lewis, S.L., Mulligan, M., Pandeya, B.,
Stratford, C., Thompson, J.R., Turner, K., Willcock,
S., & Birch, J.C. (2013). TESSA: A toolkit for rapid
assessment of ecosystem services at sites of biodi-
versity conservation importance. Ecosystem Ser-
vices, 5: 51-57.
Quillérou, E., & Thomas, R.J. (2012). Costs of land degra-
dation and benefits of land restoration: A review of
valuation methods and suggested frameworks for
inclusion into policy-making. CAB Reviews, 7(60):
1-12.
Reed, M.S., Stringer, L.C., Dougill, A.J., Perkins, J.S., Atl-
hopheng, J.R., Mulale, K., & Favretto, N. (2015).
Reorienting land degradation towards sustainable
land management: Linking sustainable liveli-
hoods with ecosystem services in rangeland sys-
tems. Journal of Environmental Management, 151:
472-485.
Requier-Desjardins, M. (2007). Why we should invest in
arid areas. (CSFD Les dossiers thématiques, Issue
5). Montpellier, France: Agropolis International.
Requier-Desjardins, M., Adhikari, B., & Sperlich, S.
(2011). Some notes on the eocnomic assessment of
land degradation. Land Degradation & Develop-
ment, 22: 285-298.
Snell, M. (2011). Cost-benefit analysis. A practical guide.
London, UK: Thomas Telford.
Tan, JP. Anderson, JR., Belli, P., Barnum, HN. and Dixon,
JA. 2001. Economic Analysis of Investment Opera-
tions: Analytical Tools and Practical Applications.
World Bank Institute Development Studies.
Turner, K.G., Anderson, S., Chang, M.G., Costanza, R.,
Courville, S., Dalgaard, T., Dominati, E., Kubisze-
wksi, I., Ogilvy, S., Porfirio, L., Ratna, N., Sandhu, H.,
Sutton, P.C., Svenning, J-C., Turner, G.M, Varennes,
Y-D., Voinov, A., & Wratten, S. (2015). Towards an
integrated assessment of land degradation and
restoration: Methods, data, and models. Ecological
Modelling. (in press).
Verburg, P.H., Soepboer, W., Limpiada, R., Espaldon,
M.V.O., Sharifa, M.A., & Veldkamp, A. (2002). Model-
ling the spatial dynamics of regional land use: The
CLUE-S model. Environmental Management, 30: 391-
405.
Zerbe, R.O. (Ed.) (2008). Benefit-Cost Analysis. Chelten-
ham, UK: Edward Elgar.
A G L O B A L I N I T I A T I V E F O R S U S T A I N A B L E L A N D M A N A G E M E N T
33
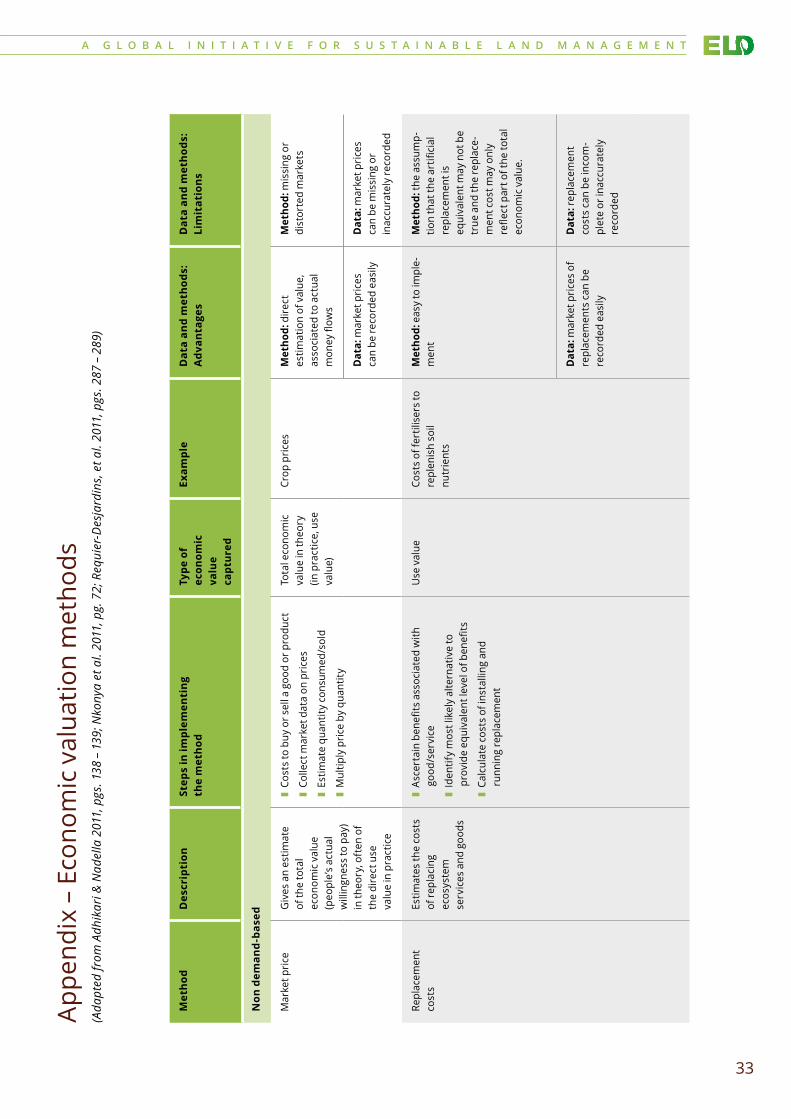
Appe
ndix
– E
cono
mic
val
uatio
n m
etho
ds(A
dapt
ed fr
om A
dhik
ari &
Nad
ella
201
1, p
gs. 1
38 –
139
; Nko
nya
et a
l. 20
11, p
g. 7
2; R
equi
er-D
esja
rdin
s, e
t al.
2011
, pgs
. 287
– 2
89)
Met
hod
Des
crip
tion
Step
s in
impl
emen
ting
th
e m
etho
dTy
pe�of�
econ
omic
va
lue
capt
ured
Exam
ple
Dat
a an
d m
etho
ds:
Adv
anta
ges
Dat
a an
d m
etho
ds:
Lim
itat
ion
s
Non
�dem
and-ba
sed
Mar
ket p
rice
Giv
es a
n es
timat
e of
the
tota
l ec
onom
ic v
alue
(p
eopl
e’s
actu
al
will
ingn
ess
to p
ay)
in th
eory
, oft
en o
f th
e di
rect
use
va
lue
in p
ract
ice
❚ Co
sts
to b
uy o
r sel
l a g
ood
or p
rodu
ct
❚ Co
llect
mar
ket d
ata
on p
rices
❚ Es
timat
e qu
antit
y co
nsum
ed/s
old
❚ M
ultip
ly p
rice
by q
uant
ity
Tota
l eco
nom
ic
valu
e in
theo
ry
(in p
ract
ice,
use
va
lue)
Crop
pric
esM
etho
d: d
irect
es
timat
ion
of v
alue
, as
soci
ated
to a
ctua
l m
oney
flow
s
Met
hod:
mis
sing
or
dist
orte
d m
arke
ts
Dat
a: m
arke
t pric
es
can
be re
cord
ed e
asily
Dat
a: m
arke
t pric
es
can
be m
issi
ng o
r in
accu
rate
ly re
cord
ed
Repl
acem
ent
cost
sEs
timat
es th
e co
sts
of re
plac
ing
ecos
yste
m
serv
ices
and
goo
ds
❚ As
cert
ain
bene
fits
asso
ciat
ed w
ith
good
/ser
vice
❚ Id
entif
y m
ost l
ikel
y al
tern
ativ
e to
pr
ovid
e eq
uiva
lent
leve
l of b
enefi
ts
❚ Ca
lcul
ate
cost
s of
inst
allin
g an
d ru
nnin
g re
plac
emen
t
Use
val
ueCo
sts
of fe
rtili
sers
to
repl
enis
h so
il nu
trie
nts
Met
hod:
eas
y to
impl
e-m
ent
Met
hod:
the
assu
mp-
tion
that
the
artifi
cial
re
plac
emen
t is
equi
vale
nt m
ay n
ot b
e tr
ue a
nd th
e re
plac
e-m
ent c
ost m
ay o
nly
refle
ct p
art o
f the
tota
l ec
onom
ic v
alue
.
Dat
a: m
arke
t pric
es o
f re
plac
emen
ts c
an b
e re
cord
ed e
asily
Dat
a: re
plac
emen
t co
sts
can
be in
com
-pl
ete
or in
accu
rate
ly
reco
rded
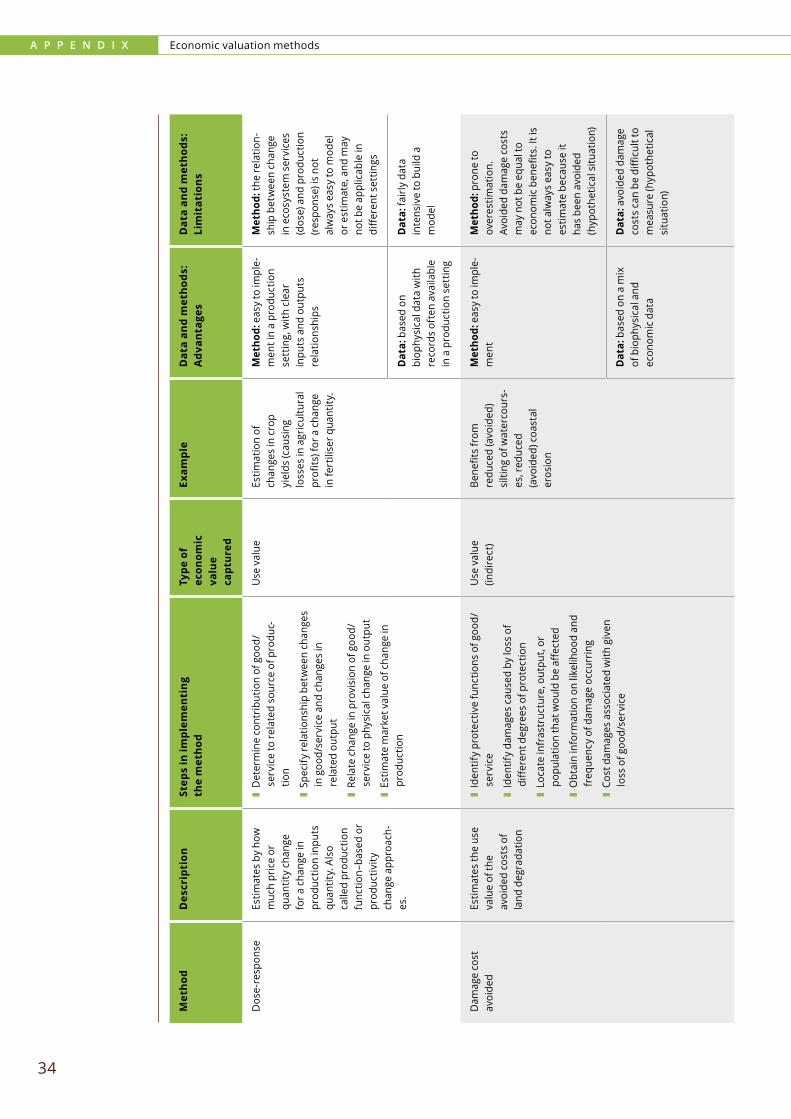
A P P E N D I X Economic valuation methods
34
Met
hod
Des
crip
tion
Step
s in
impl
emen
ting
th
e m
etho
dTy
pe�of�
econ
omic
va
lue
capt
ured
Exam
ple
Dat
a an
d m
etho
ds:
Adv
anta
ges
Dat
a an
d m
etho
ds:
Lim
itat
ion
s
Dos
e-re
spon
seEs
timat
es b
y ho
w
muc
h pr
ice
or
quan
tity
chan
ge
for a
cha
nge
in
prod
uctio
n in
puts
qu
antit
y. A
lso
calle
d pr
oduc
tion
func
tion–
base
d or
pr
oduc
tivity
ch
ange
app
roac
h-es
.
❚ D
eter
min
e co
ntrib
utio
n of
goo
d/se
rvic
e to
rela
ted
sour
ce o
f pro
duc-
tion
❚ Sp
ecify
rela
tions
hip
betw
een
chan
ges
in g
ood/
serv
ice
and
chan
ges
in
rela
ted
outp
ut
❚ Re
late
cha
nge
in p
rovi
sion
of g
ood/
serv
ice
to p
hysi
cal c
hang
e in
out
put
❚ Es
timat
e m
arke
t val
ue o
f cha
nge
in
prod
uctio
n
Use
val
ueEs
timat
ion
of
chan
ges
in c
rop
yiel
ds (c
ausi
ng
loss
es in
agr
icul
tura
l pr
ofits
) for
a c
hang
e in
fert
ilise
r qua
ntity
.
Met
hod:
eas
y to
impl
e-m
ent i
n a
prod
uctio
n se
ttin
g, w
ith c
lear
in
puts
and
out
puts
re
latio
nshi
ps
Met
hod:
the
rela
tion-
ship
bet
wee
n ch
ange
in
eco
syst
em s
ervi
ces
(dos
e) a
nd p
rodu
ctio
n (re
spon
se) i
s no
t al
way
s ea
sy to
mod
el
or e
stim
ate,
and
may
no
t be
appl
icab
le in
di
ffere
nt s
ettin
gs
Dat
a: b
ased
on
biop
hysi
cal d
ata
with
re
cord
s of
ten
avai
labl
e in
a p
rodu
ctio
n se
ttin
g
Dat
a: fa
irly
data
in
tens
ive
to b
uild
a
mod
el
Dam
age
cost
av
oide
dEs
timat
es th
e us
e va
lue
of th
e av
oide
d co
sts
of
land
deg
rada
tion
❚ Id
entif
y pr
otec
tive
func
tions
of g
ood/
serv
ice
❚ Id
entif
y da
mag
es c
ause
d by
loss
of
diffe
rent
deg
rees
of p
rote
ctio
n
❚ Lo
cate
infr
astr
uctu
re, o
utpu
t, or
po
pula
tion
that
wou
ld b
e aff
ecte
d
❚ O
btai
n in
form
atio
n on
like
lihoo
d an
d fr
eque
ncy
of d
amag
e oc
curr
ing
❚ Co
st d
amag
es a
ssoc
iate
d w
ith g
iven
lo
ss o
f goo
d/se
rvic
e
Use
val
ue
(indi
rect
)Be
nefit
s fr
om
redu
ced
(avo
ided
) si
lting
of w
ater
cour
s-es
, red
uced
(a
void
ed) c
oast
al
eros
ion
Met
hod:
eas
y to
impl
e-m
ent
Met
hod:
pro
ne to
ov
eres
timat
ion.
Av
oide
d da
mag
e co
sts
may
not
be
equa
l to
econ
omic
ben
efits
. It i
s no
t alw
ays
easy
to
estim
ate
beca
use
it ha
s be
en a
void
ed
(hyp
othe
tical
situ
atio
n)
Dat
a: b
ased
on
a m
ix
of b
ioph
ysic
al a
nd
econ
omic
dat
a
Dat
a: a
void
ed d
amag
e co
sts
can
be d
ifficu
lt to
m
easu
re (h
ypot
hetic
al
situ
atio
n)
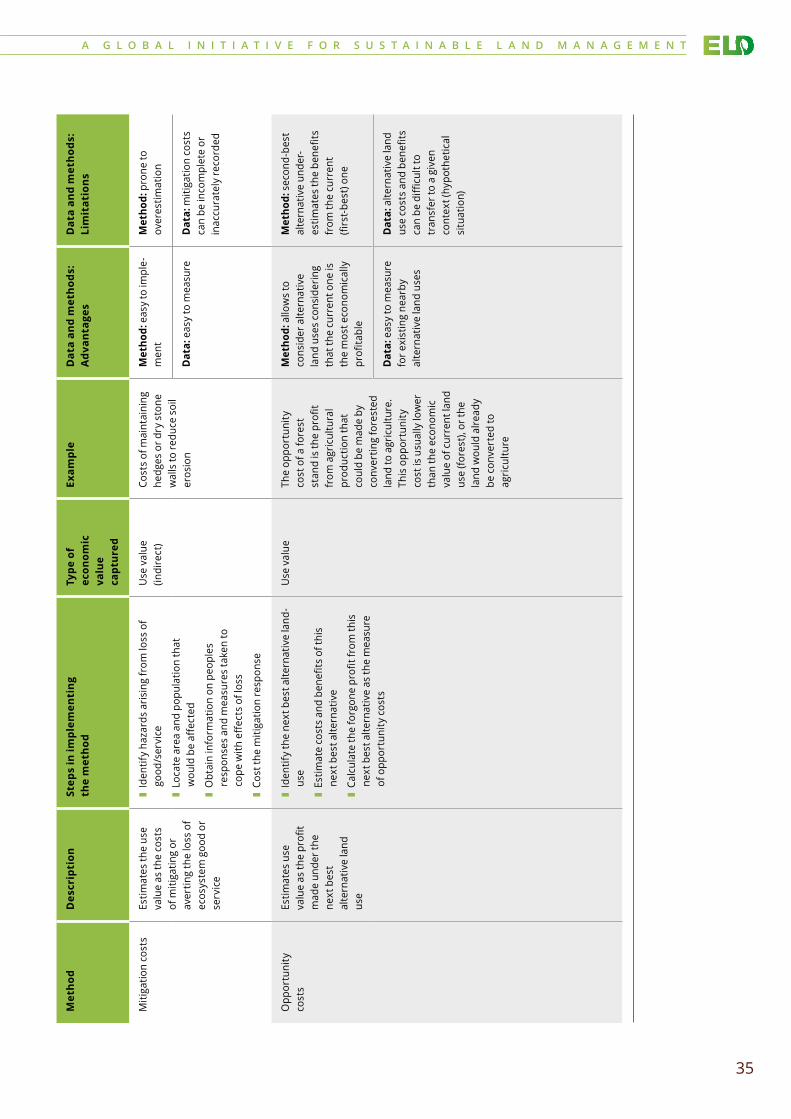
A G L O B A L I N I T I A T I V E F O R S U S T A I N A B L E L A N D M A N A G E M E N T
35
Met
hod
Des
crip
tion
Step
s in
impl
emen
ting
th
e m
etho
dTy
pe�of�
econ
omic
va
lue
capt
ured
Exam
ple
Dat
a an
d m
etho
ds:
Adv
anta
ges
Dat
a an
d m
etho
ds:
Lim
itat
ion
s
Miti
gatio
n co
sts
Estim
ates
the
use
valu
e as
the
cost
s of
miti
gatin
g or
av
ertin
g th
e lo
ss o
f ec
osys
tem
goo
d or
se
rvic
e
❚ Id
entif
y ha
zard
s ar
isin
g fr
om lo
ss o
f go
od/s
ervi
ce
❚ Lo
cate
are
a an
d po
pula
tion
that
w
ould
be
affec
ted
❚ O
btai
n in
form
atio
n on
peo
ples
re
spon
ses
and
mea
sure
s ta
ken
to
cope
with
effe
cts
of lo
ss
❚ Co
st th
e m
itiga
tion
resp
onse
Use
val
ue
(indi
rect
)Co
sts
of m
aint
aini
ng
hedg
es o
r dry
sto
ne
wal
ls to
redu
ce s
oil
eros
ion
Met
hod:
eas
y to
impl
e-m
ent
Met
hod:
pro
ne to
ov
eres
timat
ion
Dat
a: e
asy
to m
easu
reD
ata:
miti
gatio
n co
sts
can
be in
com
plet
e or
in
accu
rate
ly re
cord
ed
Opp
ortu
nity
co
sts
Estim
ates
use
va
lue
as th
e pr
ofit
mad
e un
der t
he
next
bes
t al
tern
ativ
e la
nd
use
❚ Id
entif
y th
e ne
xt b
est a
ltern
ativ
e la
nd-
use
❚ Es
timat
e co
sts
and
bene
fits
of th
is
next
bes
t alte
rnat
ive
❚ Ca
lcul
ate
the
forg
one
profi
t fro
m th
is
next
bes
t alte
rnat
ive
as th
e m
easu
re
of o
ppor
tuni
ty c
osts
Use
val
ueTh
e op
port
unity
co
st o
f a fo
rest
st
and
is th
e pr
ofit
from
agr
icul
tura
l pr
oduc
tion
that
co
uld
be m
ade
by
conv
ertin
g fo
rest
ed
land
to a
gric
ultu
re.
This
opp
ortu
nity
co
st is
usu
ally
low
er
than
the
econ
omic
va
lue
of c
urre
nt la
nd
use
(fore
st),
or th
e la
nd w
ould
alre
ady
be c
onve
rted
to
agric
ultu
re
Met
hod:
allo
ws
to
cons
ider
alte
rnat
ive
land
use
s co
nsid
erin
g th
at th
e cu
rren
t one
is
the
mos
t eco
nom
ical
ly
profi
tabl
e
Met
hod:
sec
ond-
best
al
tern
ativ
e un
der-
estim
ates
the
bene
fits
from
the
curr
ent
(firs
t-bes
t) on
e
Dat
a: e
asy
to m
easu
re
for e
xist
ing
near
by
alte
rnat
ive
land
use
s
Dat
a: a
ltern
ativ
e la
nd
use
cost
s an
d be
nefit
s ca
n be
diffi
cult
to
tran
sfer
to a
giv
en
cont
ext (
hypo
thet
ical
si
tuat
ion)
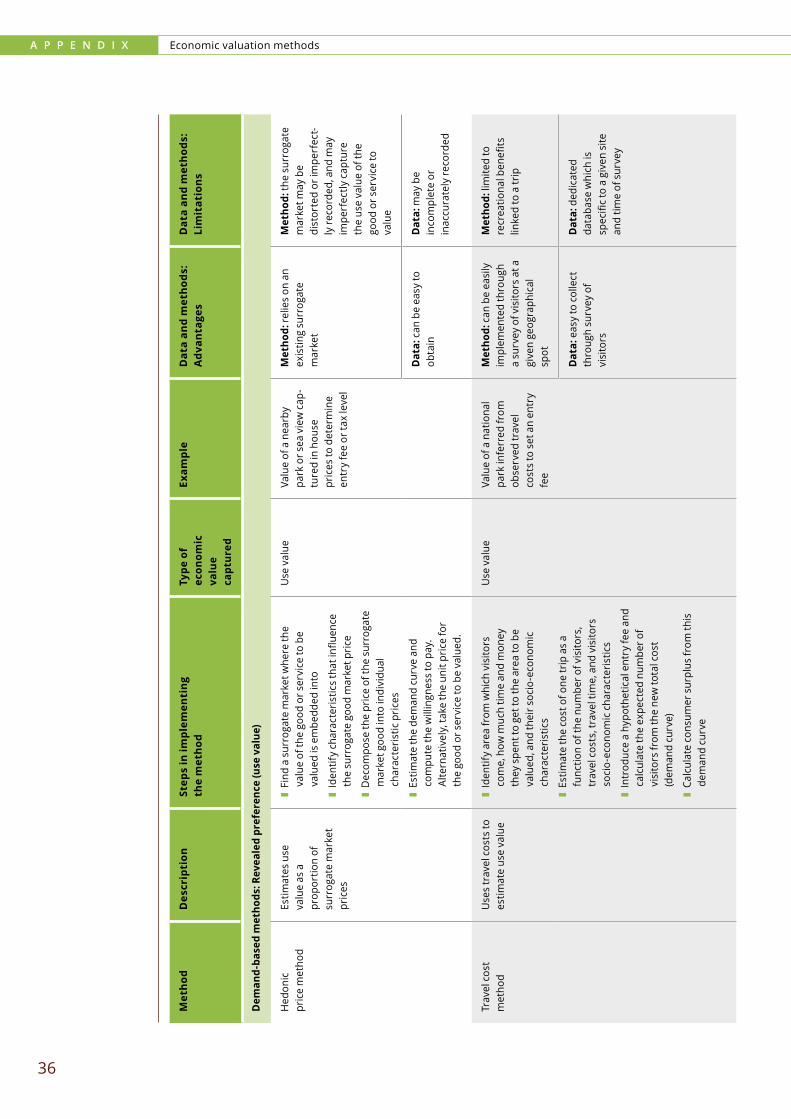
A P P E N D I X Economic valuation methods
36
Met
hod
Des
crip
tion
Step
s in
impl
emen
ting
th
e m
etho
dTy
pe�of�
econ
omic
va
lue
capt
ured
Exam
ple
Dat
a an
d m
etho
ds:
Adv
anta
ges
Dat
a an
d m
etho
ds:
Lim
itat
ion
s
Dem
and-ba
sed�metho
ds:�R
evea
led�preferen
ce�(u
se�value
)
Hed
onic
pr
ice
met
hod
Estim
ates
use
va
lue
as a
pr
opor
tion
of
surr
ogat
e m
arke
t pr
ices
❚ Fi
nd a
sur
roga
te m
arke
t whe
re th
e va
lue
of th
e go
od o
r ser
vice
to b
e va
lued
is e
mbe
dded
into
❚ Id
entif
y ch
arac
teris
tics
that
influ
ence
th
e su
rrog
ate
good
mar
ket p
rice
❚ D
ecom
pose
the
pric
e of
the
surr
ogat
e m
arke
t goo
d in
to in
divi
dual
ch
arac
teris
tic p
rices
❚ Es
timat
e th
e de
man
d cu
rve
and
com
pute
the
will
ingn
ess
to p
ay.
Alte
rnat
ivel
y, ta
ke th
e un
it pr
ice
for
the
good
or s
ervi
ce to
be
valu
ed.
Use
val
ueVa
lue
of a
nea
rby
park
or s
ea v
iew
cap
-tu
red
in h
ouse
pr
ices
to d
eter
min
e en
try
fee
or ta
x le
vel
Met
hod:
relie
s on
an
exis
ting
surr
ogat
e m
arke
t
Met
hod:
the
surr
ogat
e m
arke
t may
be
dist
orte
d or
impe
rfec
t-ly
reco
rded
, and
may
im
perf
ectly
cap
ture
th
e us
e va
lue
of th
e go
od o
r ser
vice
to
valu
e
Dat
a: c
an b
e ea
sy to
ob
tain
Dat
a: m
ay b
e in
com
plet
e or
in
accu
rate
ly re
cord
ed
Trav
el c
ost
met
hod
Use
s tr
avel
cos
ts to
es
timat
e us
e va
lue
❚ Id
entif
y ar
ea fr
om w
hich
vis
itors
co
me,
how
muc
h tim
e an
d m
oney
th
ey s
pent
to g
et to
the
area
to b
e va
lued
, and
thei
r soc
io-e
cono
mic
ch
arac
teris
tics
❚ Es
timat
e th
e co
st o
f one
trip
as
a fu
nctio
n of
the
num
ber o
f vis
itors
, tr
avel
cos
ts, t
rave
l tim
e, a
nd v
isito
rs
soci
o-ec
onom
ic c
hara
cter
istic
s
❚ In
trod
uce
a hy
poth
etic
al e
ntry
fee
and
calc
ulat
e th
e ex
pect
ed n
umbe
r of
visi
tors
from
the
new
tota
l cos
t (d
eman
d cu
rve)
❚ Ca
lcul
ate
cons
umer
sur
plus
from
this
de
man
d cu
rve
Use
val
ueVa
lue
of a
nat
iona
l pa
rk in
ferr
ed fr
om
obse
rved
trav
el
cost
s to
set
an
entr
y fe
e
Met
hod:
can
be
easi
ly
impl
emen
ted
thro
ugh
a su
rvey
of v
isito
rs a
t a
give
n ge
ogra
phic
al
spot
Met
hod:
lim
ited
to
recr
eatio
nal b
enefi
ts
linke
d to
a tr
ip
Dat
a: e
asy
to c
olle
ct
thro
ugh
surv
ey o
f vi
sito
rs
Dat
a: d
edic
ated
da
taba
se w
hich
is
spec
ific
to a
giv
en s
ite
and
time
of s
urve
y
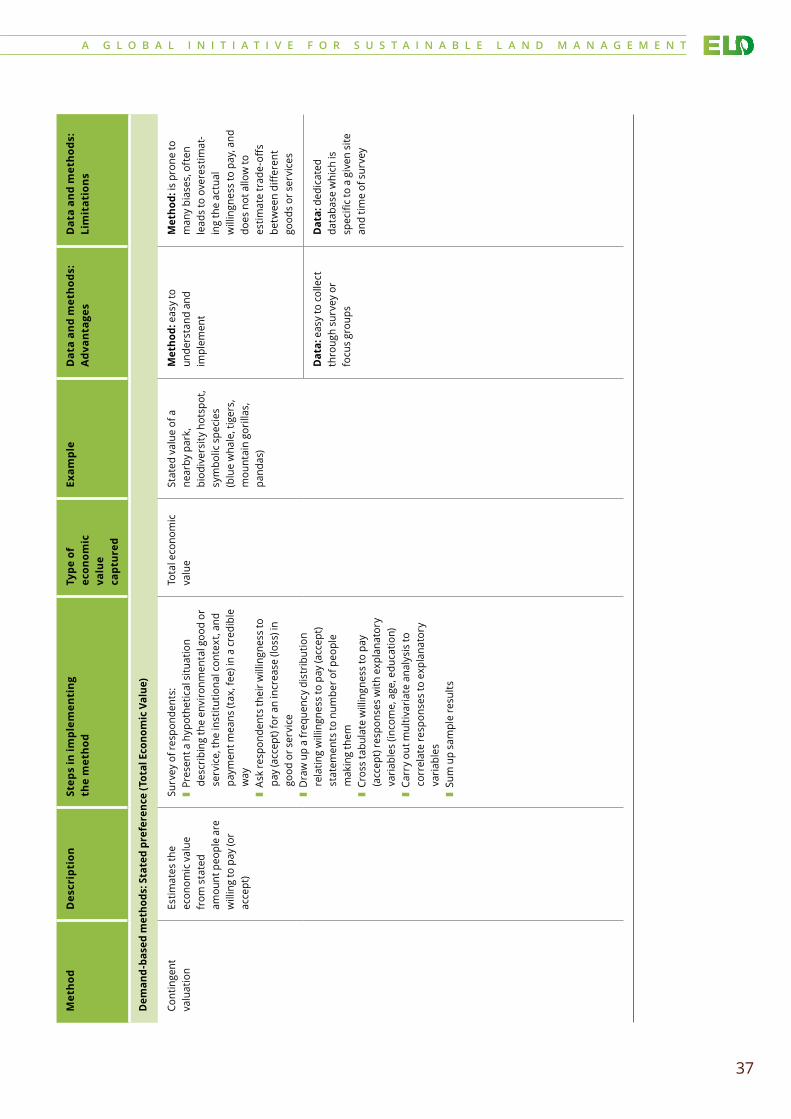
A G L O B A L I N I T I A T I V E F O R S U S T A I N A B L E L A N D M A N A G E M E N T
37
Met
hod
Des
crip
tion
Step
s in
impl
emen
ting
th
e m
etho
dTy
pe�of�
econ
omic
va
lue
capt
ured
Exam
ple
Dat
a an
d m
etho
ds:
Adv
anta
ges
Dat
a an
d m
etho
ds:
Lim
itat
ion
s
Dem
and-ba
sed�metho
ds:�R
evea
led�preferen
ce�(u
se�value
)
Hed
onic
pr
ice
met
hod
Estim
ates
use
va
lue
as a
pr
opor
tion
of
surr
ogat
e m
arke
t pr
ices
❚ Fi
nd a
sur
roga
te m
arke
t whe
re th
e va
lue
of th
e go
od o
r ser
vice
to b
e va
lued
is e
mbe
dded
into
❚ Id
entif
y ch
arac
teris
tics
that
influ
ence
th
e su
rrog
ate
good
mar
ket p
rice
❚ D
ecom
pose
the
pric
e of
the
surr
ogat
e m
arke
t goo
d in
to in
divi
dual
ch
arac
teris
tic p
rices
❚ Es
timat
e th
e de
man
d cu
rve
and
com
pute
the
will
ingn
ess
to p
ay.
Alte
rnat
ivel
y, ta
ke th
e un
it pr
ice
for
the
good
or s
ervi
ce to
be
valu
ed.
Use
val
ueVa
lue
of a
nea
rby
park
or s
ea v
iew
cap
-tu
red
in h
ouse
pr
ices
to d
eter
min
e en
try
fee
or ta
x le
vel
Met
hod:
relie
s on
an
exis
ting
surr
ogat
e m
arke
t
Met
hod:
the
surr
ogat
e m
arke
t may
be
dist
orte
d or
impe
rfec
t-ly
reco
rded
, and
may
im
perf
ectly
cap
ture
th
e us
e va
lue
of th
e go
od o
r ser
vice
to
valu
e
Dat
a: c
an b
e ea
sy to
ob
tain
Dat
a: m
ay b
e in
com
plet
e or
in
accu
rate
ly re
cord
ed
Trav
el c
ost
met
hod
Use
s tr
avel
cos
ts to
es
timat
e us
e va
lue
❚ Id
entif
y ar
ea fr
om w
hich
vis
itors
co
me,
how
muc
h tim
e an
d m
oney
th
ey s
pent
to g
et to
the
area
to b
e va
lued
, and
thei
r soc
io-e
cono
mic
ch
arac
teris
tics
❚ Es
timat
e th
e co
st o
f one
trip
as
a fu
nctio
n of
the
num
ber o
f vis
itors
, tr
avel
cos
ts, t
rave
l tim
e, a
nd v
isito
rs
soci
o-ec
onom
ic c
hara
cter
istic
s
❚ In
trod
uce
a hy
poth
etic
al e
ntry
fee
and
calc
ulat
e th
e ex
pect
ed n
umbe
r of
visi
tors
from
the
new
tota
l cos
t (d
eman
d cu
rve)
❚ Ca
lcul
ate
cons
umer
sur
plus
from
this
de
man
d cu
rve
Use
val
ueVa
lue
of a
nat
iona
l pa
rk in
ferr
ed fr
om
obse
rved
trav
el
cost
s to
set
an
entr
y fe
e
Met
hod:
can
be
easi
ly
impl
emen
ted
thro
ugh
a su
rvey
of v
isito
rs a
t a
give
n ge
ogra
phic
al
spot
Met
hod:
lim
ited
to
recr
eatio
nal b
enefi
ts
linke
d to
a tr
ip
Dat
a: e
asy
to c
olle
ct
thro
ugh
surv
ey o
f vi
sito
rs
Dat
a: d
edic
ated
da
taba
se w
hich
is
spec
ific
to a
giv
en s
ite
and
time
of s
urve
y
Met
hod
Des
crip
tion
Step
s in
impl
emen
ting
th
e m
etho
dTy
pe�of�
econ
omic
va
lue
capt
ured
Exam
ple
Dat
a an
d m
etho
ds:
Adv
anta
ges
Dat
a an
d m
etho
ds:
Lim
itat
ion
s
Dem
and-ba
sed�metho
ds:�Stated�preferen
ce�(T
otal�Econo
mic�Value
)
Cont
inge
nt
valu
atio
nEs
timat
es th
e ec
onom
ic v
alue
fr
om s
tate
d am
ount
peo
ple
are
will
ing
to p
ay (o
r ac
cept
)
Surv
ey o
f res
pond
ents
:❚
Pres
ent a
hyp
othe
tical
situ
atio
n de
scrib
ing
the
envi
ronm
enta
l goo
d or
se
rvic
e, th
e in
stitu
tiona
l con
text
, and
pa
ymen
t mea
ns (t
ax, f
ee) i
n a
cred
ible
w
ay❚
Ask
resp
onde
nts
thei
r will
ingn
ess
to
pay
(acc
ept)
for a
n in
crea
se (l
oss)
in
good
or s
ervi
ce❚
Dra
w u
p a
freq
uenc
y di
strib
utio
n re
latin
g w
illin
gnes
s to
pay
(acc
ept)
stat
emen
ts to
num
ber o
f peo
ple
mak
ing
them
❚ Cr
oss
tabu
late
will
ingn
ess
to p
ay
(acc
ept)
resp
onse
s w
ith e
xpla
nato
ry
varia
bles
(inc
ome,
age
, edu
catio
n)❚
Carr
y ou
t mul
tivar
iate
ana
lysi
s to
co
rrel
ate
resp
onse
s to
exp
lana
tory
va
riabl
es❚
Sum
up
sam
ple
resu
lts
Tota
l eco
nom
ic
valu
eSt
ated
val
ue o
f a
near
by p
ark,
bi
odiv
ersi
ty h
otsp
ot,
sym
bolic
spe
cies
(b
lue
wha
le, t
iger
s,
mou
ntai
n go
rilla
s,
pand
as)
Met
hod:
eas
y to
un
ders
tand
and
im
plem
ent
Met
hod:
is p
rone
to
man
y bi
ases
, oft
en
lead
s to
ove
rest
imat
-in
g th
e ac
tual
w
illin
gnes
s to
pay
, and
do
es n
ot a
llow
to
estim
ate
trad
e-off
s be
twee
n di
ffere
nt
good
s or
ser
vice
s
Dat
a: e
asy
to c
olle
ct
thro
ugh
surv
ey o
r fo
cus
grou
ps
Dat
a: d
edic
ated
da
taba
se w
hich
is
spec
ific
to a
giv
en s
ite
and
time
of s
urve
y

A P P E N D I X Economic valuation methods
38
Met
hod
Des
crip
tion
Step
s in
impl
emen
ting
th
e m
etho
dTy
pe�of�
econ
omic
va
lue
capt
ured
Exam
ple
Dat
a an
d m
etho
ds:
Adv
anta
ges
Dat
a an
d m
etho
ds:
Lim
itat
ion
s
Choi
ce
expe
rimen
tEs
timat
e th
e ec
onom
ic v
alue
fr
om s
tate
d w
illin
g-ne
ss to
pay
(or
will
ingn
ess
to
acce
pt) f
or a
rang
e of
att
ribut
es (l
iked
to
the
sam
e or
ot
her e
cono
mic
ac
tiviti
es) a
nd th
e tr
ade-
offs
betw
een
them
.
Surv
ey o
f res
pond
ents
:
❚ Pr
esen
t a h
ypot
hetic
al s
ituat
ion
desc
ribin
g th
e en
viro
nmen
tal g
ood
or
serv
ice,
the
inst
itutio
nal c
onte
xt a
nd
paym
ent m
eans
(tax
, fee
) in
a cr
edib
le
way
❚ Es
tabl
ish
alte
rnat
ive
optio
ns, e
ach
of
whi
ch a
re d
efine
d by
var
ious
at
trib
utes
and
a p
rice
❚ D
esig
n un
ique
cho
ice
card
s by
sel
ectin
g co
mbi
natio
ns o
f alte
rnat
ive
optio
ns.
The
resp
onde
nt s
houl
d ch
oose
onl
y on
e op
tion
from
eac
h ch
oice
car
d
❚ Ag
greg
ate
resu
lts a
nd e
stim
ate
will
ingn
ess
to p
ay o
vera
ll an
d fo
r eac
h at
trib
ute
Tota
l eco
nom
ic
valu
eTr
ade-
offs
betw
een
cons
erva
tion
mea
sure
s su
ch a
s th
e pr
eser
vatio
n of
em
blem
atic
spe
cies
, a
biod
iver
sity
ho
tspo
t or a
nea
rby
park
, and
oth
er
econ
omic
act
iviti
es
such
as
agric
ultu
ral
prod
uctio
n or
m
inin
g
Met
hod:
onl
y m
etho
d th
at a
llow
s fo
r the
es
timat
ion
of b
oth
tota
l eco
nom
ic v
alue
, an
d tr
ade-
offs
betw
een
good
s an
d se
rvic
es
Met
hod:
pot
entia
l bi
ases
; con
text
spe
cific
Dat
a: c
ompl
ete
data
set
Dat
a: v
ery
data
in
tens
ive
Ben
efit�tran
sfer
Bene
fit tr
ansf
erRe
sults
obt
aine
d in
a
spec
ific
cont
ext
are
tran
sfer
red
to
ano
ther
co
mpa
rabl
e si
te
❚ Id
entif
y “s
ourc
e” s
ite(s
), th
at is
, the
si
te(s
) fro
m w
hich
the
econ
omic
val
ue
will
be
tran
sfer
red
from
, and
thei
r ch
arac
teris
tics
(inco
me
leve
ls, t
ype
of
land
use
, are
a co
vere
d, ty
pe o
f are
a:
hot s
pot o
r oth
er, g
eogr
aphy
)
❚ Es
timat
e th
e w
illin
gnes
s to
pay
as
a
func
tion
of th
e so
urce
site
(s)
char
acte
ristic
s
❚ U
se th
e ch
arac
teris
tics
of th
e si
te to
be
val
ued
in th
e w
illin
gnes
s to
pay
eq
uatio
n ob
tain
ed a
nd d
eriv
e th
e w
illin
gnes
s to
pay
Dep
ends
on
the
met
hod
used
in
the
orig
inal
co
ntex
t, be
fore
tr
ansf
er
The
valu
e of
a
biod
iver
sity
hot
spot
is
est
imat
ed fr
om
valu
es o
f sev
eral
ot
her b
iodi
vers
ity
hots
pots
and
ad
just
ing
for s
peci
fic
char
acte
ristic
s (s
ize,
in
com
e le
vel o
f st
akeh
olde
rs, e
tc.).
Met
hod:
eas
y to
co
ncep
tual
ise
and
impl
emen
t
Met
hod:
can
be
very
da
ta in
tens
ive.
Res
ults
ca
n be
inac
cura
te
depe
ndin
g on
how
di
ffere
nt s
ocia
l pre
fer-
ence
s in
diff
eren
t pla
ces
are,
and
eco
nom
ies
of
scal
e an
d sc
ope.
Dat
a: b
ased
on
data
av
aila
ble
in p
revi
ous
stud
ies
and
does
not
re
quire
prim
ary
data
co
llect
ion
Dat
a: p
revi
ous
stud
y re
sults
can
be
bias
ed
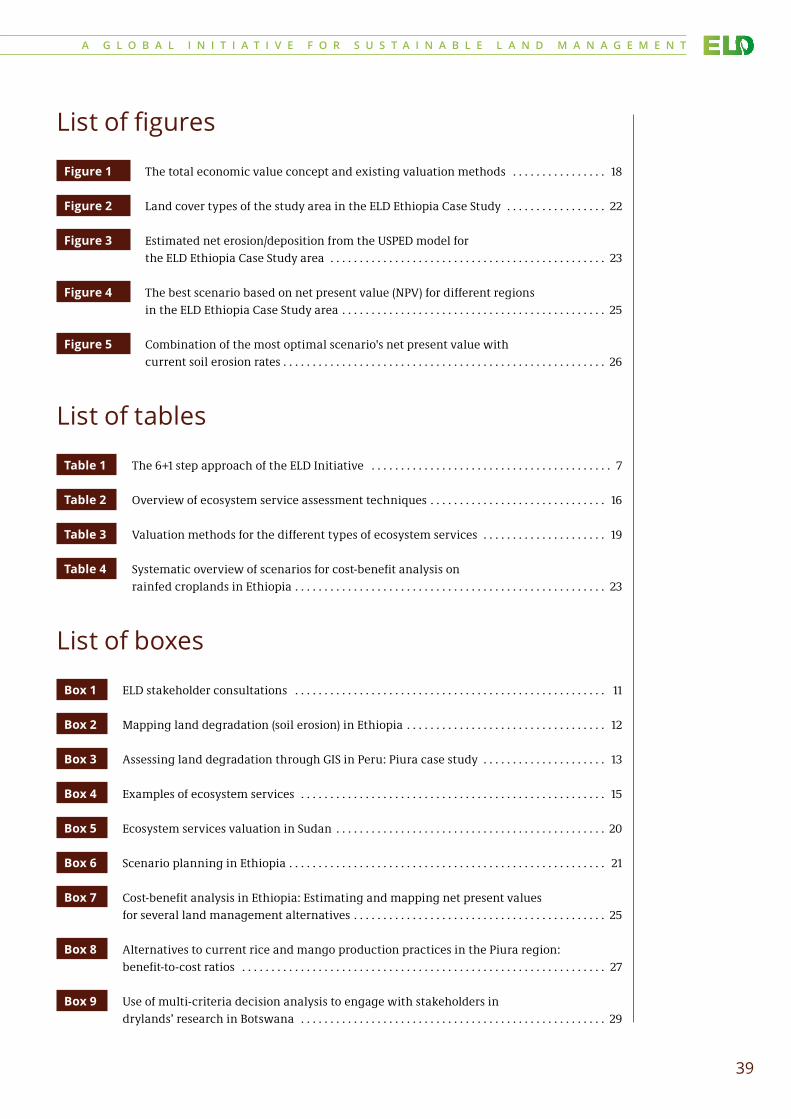
A G L O B A L I N I T I A T I V E F O R S U S T A I N A B L E L A N D M A N A G E M E N T
39
List of figures
Figure 1 The total economic value concept and existing valuation methods . . . . . . . . . . . . . . . . 18
Figure 2 Land cover types of the study area in the ELD Ethiopia Case Study . . . . . . . . . . . . . . . . . 22
Figure 3 Estimated net erosion/deposition from the USPED model for the ELD Ethiopia Case Study area . . . . . . . . . . . . . . . . . . . . . . . . . . . . . . . . . . . . . . . . . . . . . . . 23
Figure 4 The best scenario based on net present value (NPV) for different regions in the ELD Ethiopia Case Study area . . . . . . . . . . . . . . . . . . . . . . . . . . . . . . . . . . . . . . . . . . . . . 25
Figure 5 Combination of the most optimal scenario's net present value with current soil erosion rates . . . . . . . . . . . . . . . . . . . . . . . . . . . . . . . . . . . . . . . . . . . . . . . . . . . . . . . 26
List of tables
Table�1 The 6+1 step approach of the ELD Initiative . . . . . . . . . . . . . . . . . . . . . . . . . . . . . . . . . . . . . . . . . 7
Table�2 Overview of ecosystem service assessment techniques . . . . . . . . . . . . . . . . . . . . . . . . . . . . . . 16
Table�3 Valuation methods for the different types of ecosystem services . . . . . . . . . . . . . . . . . . . . . 19
Table�4 Systematic overview of scenarios for cost-benefit analysis on rainfed croplands in Ethiopia . . . . . . . . . . . . . . . . . . . . . . . . . . . . . . . . . . . . . . . . . . . . . . . . . . . . . 23
List of boxes
Box 1 ELD stakeholder consultations . . . . . . . . . . . . . . . . . . . . . . . . . . . . . . . . . . . . . . . . . . . . . . . . . . . . . 11
Box 2 Mapping land degradation (soil erosion) in Ethiopia . . . . . . . . . . . . . . . . . . . . . . . . . . . . . . . . . . 12
Box 3 Assessing land degradation through GIS in Peru: Piura case study . . . . . . . . . . . . . . . . . . . . . 13
Box 4 Examples of ecosystem services . . . . . . . . . . . . . . . . . . . . . . . . . . . . . . . . . . . . . . . . . . . . . . . . . . . . 15
Box 5 Ecosystem services valuation in Sudan . . . . . . . . . . . . . . . . . . . . . . . . . . . . . . . . . . . . . . . . . . . . . . 20
Box 6 Scenario planning in Ethiopia . . . . . . . . . . . . . . . . . . . . . . . . . . . . . . . . . . . . . . . . . . . . . . . . . . . . . . 21
Box 7 Cost-benefit analysis in Ethiopia: Estimating and mapping net present values for several land management alternatives . . . . . . . . . . . . . . . . . . . . . . . . . . . . . . . . . . . . . . . . . . . 25
Box 8 Alternatives to current rice and mango production practices in the Piura region: benefit-to-cost ratios . . . . . . . . . . . . . . . . . . . . . . . . . . . . . . . . . . . . . . . . . . . . . . . . . . . . . . . . . . . . . . 27
Box 9 Use of multi-criteria decision analysis to engage with stakeholders in drylands’ research in Botswana . . . . . . . . . . . . . . . . . . . . . . . . . . . . . . . . . . . . . . . . . . . . . . . . . . . . 29
www.eld-initiative.org
For further information and feedback please contact:
ELD SecretariatMark Schauerc/o Deutsche Gesellschaftfür Internationale Zusammenarbeit (GIZ) GmbHFriedrich-Ebert-Allee 3653113 BonnGermanyT + 49 228 4460-3740E [email protected] www.eld-initiative.org
This was published with the support of the partner organisations of the ELD Initiative and Deutsche Gesellschaft für Internationale Zusammenarbeit (GIZ) GmbH on behalf of the German Federal Ministry for Economic Cooperation and Development (BMZ).
Photography: Front and back cover © GIZDesign: kippconcept GmbH, BonnPrinted in the EU on FSC-certified paperBonn, July 2015©2015
ISBN 978-92-808-6060-3