user and administration guide
TRANSCRIPT
Foglight® Hybrid Cloud Manager for Azure 1.9.0
User and Administration Guide

© 2020 Quest Software Inc.
ALL RIGHTS RESERVED.
This guide contains proprietary information protected by copyright. The software described in this guide is furnished under a software license or nondisclosure agreement. This software may be used or copied only in accordance with the terms of the applicable agreement. No part of this guide may be reproduced or transmitted in any form or by any means, electronic or mechanical, including photocopying and recording for any purpose other than the purchaser’s personal use without the written permission of Quest Software Inc.
The information in this document is provided in connection with Quest Software products. No license, express or implied, by estoppel or otherwise, to any intellectual property right is granted by this document or in connection with the sale of Quest Software products. EXCEPT AS SET FORTH IN THE TERMS AND CONDITIONS AS SPECIFIED IN THE LICENSE AGREEMENT FOR THIS PRODUCT, QUEST SOFTWARE ASSUMES NO LIABILITY WHATSOEVER AND DISCLAIMS ANY EXPRESS, IMPLIED OR STATUTORY WARRANTY RELATING TO ITS PRODUCTS INCLUDING, BUT NOT LIMITED TO, THE IMPLIED WARRANTY OF MERCHANTABILITY, FITNESS FOR A PARTICULAR PURPOSE, OR NON-INFRINGEMENT. IN NO EVENT SHALL QUEST SOFTWARE BE LIABLE FOR ANY DIRECT, INDIRECT, CONSEQUENTIAL, PUNITIVE, SPECIAL OR INCIDENTAL DAMAGES (INCLUDING, WITHOUT LIMITATION, DAMAGES FOR LOSS OF PROFITS, BUSINESS INTERRUPTION OR LOSS OF INFORMATION) ARISING OUT OF THE USE OR INABILITY TO USE THIS DOCUMENT, EVEN IF QUEST SOFTWARE HAS BEEN ADVISED OF THE POSSIBILITY OF SUCH DAMAGES. Quest Software makes no representations or warranties with respect to the accuracy or completeness of the contents of this document and reserves the right to make changes to specifications and product descriptions at any time without notice. Quest Software does not make any commitment to update the information contained in this document.
If you have any questions regarding your potential use of this material, contact:
Quest Software Inc.Attn: LEGAL Dept.4 Polaris WayAliso Viejo, CA 92656
Refer to our website (https://www.quest.com) for regional and international office information.
Patents
Quest Software is proud of our advanced technology. Patents and pending patents may apply to this product. For the most current information about applicable patents for this product, please visit our website at https://www.quest.com/legal.
Trademarks
Quest, the Quest logo, and Where next meets now are trademarks and registered trademarks of Quest Software Inc. For a complete list of Quest marks, visit https://www.quest.com/legal/trademark-information.aspx. “Apache HTTP Server”, Apache, “Apache Tomcat” and “Tomcat” are trademarks of the Apache Software Foundation. Google is a registered trademark of Google Inc. Android, Chrome, Google Play, and Nexus are trademarks of Google Inc. Red Hat, JBoss, the JBoss logo, and Red Hat Enterprise Linux are registered trademarks of Red Hat, Inc. in the U.S. and other countries. CentOS is a trademark of Red Hat, Inc. in the U.S. and other countries. Fedora and the Infinity design logo are trademarks of Red Hat, Inc. Microsoft, .NET, Active Directory, Internet Explorer, Hyper-V, Office 365, SharePoint, Silverlight, SQL Server, Visual Basic, Windows, Windows Vista and Windows Server are either registered trademarks or trademarks of Microsoft Corporation in the United States and/or other countries. AIX, IBM, PowerPC, PowerVM, and WebSphere are trademarks of International Business Machines Corporation, registered in many jurisdictions worldwide. Java, Oracle, Oracle Solaris, PeopleSoft, Siebel, Sun, WebLogic, and ZFS are trademarks or registered trademarks of Oracle and/or its affiliates in the United States and other countries. SPARC is a registered trademark of SPARC International, Inc. in the United States and other countries. Products bearing the SPARC trademarks are based on an architecture developed by Oracle Corporation. OpenLDAP is a registered trademark of the OpenLDAP Foundation. HP is a registered trademark that belongs to Hewlett-Packard Development Company, L.P. Linux is a registered trademark of Linus Torvalds in the United States, other countries, or both. MySQL is a registered trademark of MySQL AB in the United States, the European Union and other countries. Novell and eDirectory are registered trademarks of Novell, Inc., in the United States and other countries. VMware, ESX, ESXi, vSphere, vCenter, vMotion, and vCloud Director are registered trademarks or trademarks of VMware, Inc. in the United States and/or other jurisdictions. Sybase is a registered trademark of Sybase, Inc. The X Window System and UNIX are registered trademarks of The Open Group. Mozilla and Firefox are registered trademarks of the Mozilla Foundation. “Eclipse”, “Eclipse Foundation Member”, “EclipseCon”, “Eclipse Summit”, “Built on Eclipse”, “Eclipse Ready” “Eclipse Incubation”, and “Eclipse Proposals” are trademarks of Eclipse Foundation, Inc. IOS is a registered trademark or trademark of Cisco Systems, Inc. and/or its affiliates in the United States and certain other countries. Apple, iPad, iPhone, Mac OS, Safari, Swift, and Xcode are trademarks of Apple Inc., registered in the U.S. and other countries. Ubuntu is a registered trademark of Canonical Ltd. Symantec and Veritas are trademarks or registered trademarks of Symantec Corporation or its affiliates in the U.S. and other countries. OpenSUSE, SUSE, and YAST are registered trademarks of SUSE LCC in the United States and other countries. Citrix, AppFlow, NetScaler, XenApp, and XenDesktop are trademarks of Citrix Systems, Inc. and/or one or more of its subsidiaries, and may be registered in the United States Patent and Trademark Office and in other countries. AlertSite and DéjàClick are either trademarks or registered trademarks of Boca Internet Technologies, Inc. Samsung, Galaxy S, and Galaxy Note are registered trademarks of Samsung Electronics America, Inc. and/or its related entities. MOTOROLA is a registered trademarks of Motorola Trademark Holdings, LLC. The Trademark BlackBerry Bold is owned by Research In Motion Limited and is registered in the United States and may be pending or registered in other countries. Quest is not endorsed, sponsored, affiliated with or otherwise authorized by Research In Motion Limited. Ixia and the Ixia four-petal logo are registered trademarks or trademarks of Ixia. Opera, Opera Mini, and the O logo are trademarks of Opera Software ASA. Tevron, the Tevron logo, and CitraTest are registered trademarks of Tevron, LLC. PostgreSQL is a registered trademark of the PostgreSQL Global Development Group. MariaDB is a trademark or registered trademark of MariaDB Corporation Ab in the European Union and United States of America and/or other countries. Vormetric is a registered trademark of Vormetric, Inc. Intel, Itanium, Pentium, and Xeon are trademarks of Intel Corporation in the U.S. and/or other countries. Debian is a registered trademark of Software in the Public Interest, Inc. OpenStack is a trademark of the OpenStack Foundation. Amazon Web Services, the “Powered by Amazon Web Services” logo, and “Amazon RDS” are trademarks of Amazon.com, Inc. or its affiliates in the United States and/or other countries. Infobright, Infobright Community Edition and Infobright Enterprise Edition are trademarks of Infobright Inc. POLYCOM®, RealPresence® Collaboration Server, and RMX® are registered trademarks of Polycom, Inc. All other trademarks and registered trademarks are property of

their respective owners.
Foglight Hybrid Cloud Manager for Azure User and Administration GuideUpdated - December 2020Foglight Version - 5.9.8Software Version - 1.9.0
Legend
WARNING: A WARNING icon indicates a potential for property damage, personal injury, or death.
CAUTION: A CAUTION icon indicates potential damage to hardware or loss of data if instructions are not followed.
IMPORTANT NOTE, NOTE, TIP, MOBILE, or VIDEO: An information icon indicates supporting information.

Contents
Using Foglight Hybrid Cloud Manager for Azure . . . . . . . . . . . . . . . . . . . . . . . . . . . . . . . . 6
Installation requirements . . . . . . . . . . . . . . . . . . . . . . . . . . . . . . . . . . . . . . . . . . . . . . . . . . . . . 6
Azure Performance Agent Configuration . . . . . . . . . . . . . . . . . . . . . . . . . . . . . . . . . . . . . . . . . 7
Minimum application privileges . . . . . . . . . . . . . . . . . . . . . . . . . . . . . . . . . . . . . . . . . . . . . 7
API used to collect Cost metrics . . . . . . . . . . . . . . . . . . . . . . . . . . . . . . . . . . . . . . . . . . . . 7
Azure monitoring setup . . . . . . . . . . . . . . . . . . . . . . . . . . . . . . . . . . . . . . . . . . . . . . . . . . . . . . 8
Getting authentication information through Azure portal . . . . . . . . . . . . . . . . . . . . . . . . . . 9
Configuring firewall settings . . . . . . . . . . . . . . . . . . . . . . . . . . . . . . . . . . . . . . . . . . . . . . 11
Creating Azure Performance Agent . . . . . . . . . . . . . . . . . . . . . . . . . . . . . . . . . . . . . . . . . 11
Dashboard location and UI elements . . . . . . . . . . . . . . . . . . . . . . . . . . . . . . . . . . . . . . . . . . 12
Group selector . . . . . . . . . . . . . . . . . . . . . . . . . . . . . . . . . . . . . . . . . . . . . . . . . . . . . . . . . 13
Actions bar . . . . . . . . . . . . . . . . . . . . . . . . . . . . . . . . . . . . . . . . . . . . . . . . . . . . . . . . . . . 13
Menu bar . . . . . . . . . . . . . . . . . . . . . . . . . . . . . . . . . . . . . . . . . . . . . . . . . . . . . . . . . . . . . 14
Quick view . . . . . . . . . . . . . . . . . . . . . . . . . . . . . . . . . . . . . . . . . . . . . . . . . . . . . . . . . . . . 14
Monitoring Tab . . . . . . . . . . . . . . . . . . . . . . . . . . . . . . . . . . . . . . . . . . . . . . . . . . . . . . . . . . . 15
Regions monitoring . . . . . . . . . . . . . . . . . . . . . . . . . . . . . . . . . . . . . . . . . . . . . . . . . . . . . . . . 16
Virtual Machines monitoring . . . . . . . . . . . . . . . . . . . . . . . . . . . . . . . . . . . . . . . . . . . . . . . . . 19
Resource Groups Monitoring . . . . . . . . . . . . . . . . . . . . . . . . . . . . . . . . . . . . . . . . . . . . . . . . . 24
Storage Accounts monitoring . . . . . . . . . . . . . . . . . . . . . . . . . . . . . . . . . . . . . . . . . . . . . . . . . 28
Virtual Networks monitoring . . . . . . . . . . . . . . . . . . . . . . . . . . . . . . . . . . . . . . . . . . . . . . . . . . 33
Tags Tab . . . . . . . . . . . . . . . . . . . . . . . . . . . . . . . . . . . . . . . . . . . . . . . . . . . . . . . . . . . . . . . . 37
Reports Tab . . . . . . . . . . . . . . . . . . . . . . . . . . . . . . . . . . . . . . . . . . . . . . . . . . . . . . . . . . . . . 38
Available report templates . . . . . . . . . . . . . . . . . . . . . . . . . . . . . . . . . . . . . . . . . . . . . . . . . . . 38
Rule Configuration Tab . . . . . . . . . . . . . . . . . . . . . . . . . . . . . . . . . . . . . . . . . . . . . . . . . . . . 40
Rules view . . . . . . . . . . . . . . . . . . . . . . . . . . . . . . . . . . . . . . . . . . . . . . . . . . . . . . . . . . . . . . . 40
Enabling/Disabling rule(s) . . . . . . . . . . . . . . . . . . . . . . . . . . . . . . . . . . . . . . . . . . . . . . . . . . . 41
Adding a custom rule . . . . . . . . . . . . . . . . . . . . . . . . . . . . . . . . . . . . . . . . . . . . . . . . . . . . . . . 42
Removing custom rule(s) . . . . . . . . . . . . . . . . . . . . . . . . . . . . . . . . . . . . . . . . . . . . . . . . . . . . 42
Usage & Quotas Tab . . . . . . . . . . . . . . . . . . . . . . . . . . . . . . . . . . . . . . . . . . . . . . . . . . . . . . 44
Global Services Tab . . . . . . . . . . . . . . . . . . . . . . . . . . . . . . . . . . . . . . . . . . . . . . . . . . . . . . . 45
Subscription Unhealthy Services . . . . . . . . . . . . . . . . . . . . . . . . . . . . . . . . . . . . . . . . . . . . . . 45
Administration Tab . . . . . . . . . . . . . . . . . . . . . . . . . . . . . . . . . . . . . . . . . . . . . . . . . . . . . . . 47
Tasks view . . . . . . . . . . . . . . . . . . . . . . . . . . . . . . . . . . . . . . . . . . . . . . . . . . . . . . . . . . . . . . . 47
Agents related commands . . . . . . . . . . . . . . . . . . . . . . . . . . . . . . . . . . . . . . . . . . . . . . . . . . . 48
Editing agent properties . . . . . . . . . . . . . . . . . . . . . . . . . . . . . . . . . . . . . . . . . . . . . . . . . . . . . 49
Managing certificates . . . . . . . . . . . . . . . . . . . . . . . . . . . . . . . . . . . . . . . . . . . . . . . . . . . . . . . 52
Syntax Conventions . . . . . . . . . . . . . . . . . . . . . . . . . . . . . . . . . . . . . . . . . . . . . . . . . . . . 52
Managing certificates for FglAM . . . . . . . . . . . . . . . . . . . . . . . . . . . . . . . . . . . . . . . . . . . 52
Foglight Hybrid Cloud Manager for Azure 1.9.0 User and Administration GuideContents
4

Managing certificates for FMS in FIPS-compliant mode . . . . . . . . . . . . . . . . . . . . . . . . . 54
Optimizer Tab . . . . . . . . . . . . . . . . . . . . . . . . . . . . . . . . . . . . . . . . . . . . . . . . . . . . . . . . . . . . 56
Settings . . . . . . . . . . . . . . . . . . . . . . . . . . . . . . . . . . . . . . . . . . . . . . . . . . . . . . . . . . . . . . . . . 58
Configuration tab . . . . . . . . . . . . . . . . . . . . . . . . . . . . . . . . . . . . . . . . . . . . . . . . . . . . . . . 59
Waste tab . . . . . . . . . . . . . . . . . . . . . . . . . . . . . . . . . . . . . . . . . . . . . . . . . . . . . . . . . . . . 60
Excluded tab . . . . . . . . . . . . . . . . . . . . . . . . . . . . . . . . . . . . . . . . . . . . . . . . . . . . . . . . . . 61
Cost Tab . . . . . . . . . . . . . . . . . . . . . . . . . . . . . . . . . . . . . . . . . . . . . . . . . . . . . . . . . . . . . . . . 62
Cost - Overview . . . . . . . . . . . . . . . . . . . . . . . . . . . . . . . . . . . . . . . . . . . . . . . . . . . . . . . . . . . 62
Cost - Azure view . . . . . . . . . . . . . . . . . . . . . . . . . . . . . . . . . . . . . . . . . . . . . . . . . . . . . . . . . . 63
Cost - Admin view . . . . . . . . . . . . . . . . . . . . . . . . . . . . . . . . . . . . . . . . . . . . . . . . . . . . . . . . . 63
Policy Management Tab . . . . . . . . . . . . . . . . . . . . . . . . . . . . . . . . . . . . . . . . . . . . . . . . . . . 65
Policy view . . . . . . . . . . . . . . . . . . . . . . . . . . . . . . . . . . . . . . . . . . . . . . . . . . . . . . . . . . . . . . . 65
Resource view . . . . . . . . . . . . . . . . . . . . . . . . . . . . . . . . . . . . . . . . . . . . . . . . . . . . . . . . . . . . 67
Schedule view . . . . . . . . . . . . . . . . . . . . . . . . . . . . . . . . . . . . . . . . . . . . . . . . . . . . . . . . . . . . 68
Recurrence Pattern . . . . . . . . . . . . . . . . . . . . . . . . . . . . . . . . . . . . . . . . . . . . . . . . . . . . . 69
Policy Executed History view . . . . . . . . . . . . . . . . . . . . . . . . . . . . . . . . . . . . . . . . . . . . . . . . . 70
Run Reports for Policy Management . . . . . . . . . . . . . . . . . . . . . . . . . . . . . . . . . . . . . . . . . . . 70
About Us . . . . . . . . . . . . . . . . . . . . . . . . . . . . . . . . . . . . . . . . . . . . . . . . . . . . . . . . . . . . . . . . 71
Technical support resources . . . . . . . . . . . . . . . . . . . . . . . . . . . . . . . . . . . . . . . . . . . . . . . . . 71
Foglight Hybrid Cloud Manager for Azure 1.9.0 User and Administration GuideContents
5

1
Using Foglight Hybrid Cloud Manager for Azure
Foglight® Hybrid Cloud Manager for Azure is provided to meet the demand for monitoring the hybrid strategy, protecting the business, reducing tasks for users who want to monitor Infrastructure as a Service (IaaS) assets.
Foglight Hybrid Cloud Manager for Azure offers the ability to enable IaaS monitoring across Azure performance agents and to consolidate performance troubleshooting into a single platform, without the manual configuration and hazards of missing elastic or burst workload changes.
Foglight Hybrid Cloud Manager for Azure simplifies the cloud performance monitoring process, allowing users to see VMware, Hyper-V, and Azure inside of a single platform. By the means of unified workflows, pre-configured rules with notifications, and intelligent analytics, Foglight Hybrid Cloud Manager for Azure unscrambles complex troubleshooting and delivers the information that helps user cut down costs.
This section introduces you to the Foglight Hybrid Cloud Manager for Azure environment, and provides you with essential information.
For more information, see the following topics:
• Installation requirements
• Azure Performance Agent Configuration
• Azure monitoring setup
• Dashboard location and UI elements
Installation requirementsFoglight Hybrid Cloud Manager for Azure comes installed on Foglight Evolve and can be installed on a Foglight Management Server.
Foglight Hybrid Cloud Manager for Azure requires the following cartridges for data collection:
1 vUsage-Feedback-5_8_3.car
2 DRP-5.8.3.car
3 OptimizerAutomation-5_8_3.car
4 CommonAnalytics-5_8_3.car
5 Optimizer-5_8_3.car
6 Cloud-Manager-1.9.0.car
While Foglight Evolve comes with these cartridges pre-installed and enabled, a stand-alone Foglight release requires that these components be installed on the Foglight Management Server. The sequence of cartridge installation is important because of their dependencies. For more information about installing Foglight Hybrid Cloud Manager for Azure, and for details about system requirements and version compatibility, see the Foglight Hybrid Cloud Manager Release Notes.
Foglight Hybrid Cloud Manager for Azure 1.9.0 User and Administration GuideUsing Foglight Hybrid Cloud Manager for Azure
6

Azure Performance Agent Configuration
Minimum application privilegesEach Azure Performance Agent monitors the subscriptions inside the same Azure Active Directory (AD). To collect the Azure data, you need register an application in Azure AD, and this application needs be granted the following privileges for all subscriptions to be monitored by Foglight Hybrid Cloud Manager for Azure:
• Reader
• Storage Account Key Operator Service Role
To use the Optimizer Reclaim action, the Virtual Machine Contributor privilege should be granted to the Azure agent.
API used to collect Cost metricsFoglight Hybrid Cloud Manager for Azure offers the following two methods to collect Cost metrics, you need to select either of following based upon your environment:
• Enterprise Agreement Billing API: This approach is used to collect metrics from Enterprise Agreement subscriptions.
• Usage API and Rate Card API: This approach is used to collect metrics from Pay As You Go subscriptions and Azure In-Open subscriptions.
If you use Enterprise Agreement API to collect Cost Metrics, You need the Enrollment Number and API access key associated with your Azure Enterprise account. You can locate these credentials in your Azure Enterprise account. The Enrollment Number and API access key are available only to your account's enterprise administrator, the top-level administrator of your Azure Enterprise.:
• Enrollment Number: Indicates the master account used for Enterprise billing.
• Usage API Access Key: Allows access to the Azure Billing API.
• Offer ID and Billing Cycle day for Subscriptions: Specifies the subscriptions type and information.
To get the Enrollment Number and Usage API Access Key:
1 Log in to your Azure Enterprise account at https://ea.azure.com.
2 Locate your Enrollment Number.
a Click the Enrollment tab, then click Manage.
b Locate the Enrollment Number in the list of enrollment details.
c Copy the Enrollment Number and save it for later use.
3 Generate an API access key.
a Under the Enrollment tab, click Reports.
b Click Download Usage.
TIP: For the detailed information about how to get the subscription type, see To get the subscription information:.
NOTE: Enterprise Agreement Billing API only applies to Enterprise Agreement subscriptions and collects cost metrics directly from the Azure Enterprise Portal. If not, Foglight Hybrid Cloud Manager will use Usage and Rate Card APIs to collect and populate the cost data for subscriptions.
Foglight Hybrid Cloud Manager for Azure 1.9.0 User and Administration GuideUsing Foglight Hybrid Cloud Manager for Azure
7

c Click API Access Key.
d Click the key icon in the Primary Key text box to generate the API access key.
e Copy the entire API access key string into a text file, and save the file.
To get the subscription information:
1 Log in to your Azure Enterprise account at https://portal.azure.com/.
2 Click All services, and then input “Subscriptions” in the All services text box, and then click Subscriptions.
3 On the Subscriptions dashboard, select your subscription, and then record the following information:
▪ Offer: This value indicates the subscription type, for example, Pay As You Go.
▪ Current billing period: This value is used to set the Billing Cycle Day in Editing agent properties. For example, your Current billing period is “6/21/2018-7/20/2018”, then the Billing Cycle Day will be “21”.
Azure monitoring setupTo fully enable the monitoring of Azure environment, Foglight Hybrid Cloud Manager for Azure requires to create an Azure Performance Agent that is to be authenticated using Azure Active Directory ID (Tenant ID), Application ID, and Access Key.
A complete setup includes the following three steps:
1 Get the authentication information through the Azure portal. For more information, see Getting authentication information through Azure portal on page 9.
2 Create an Azure Performance Agent on the Foglight Management Server. For more information, see Creating Azure Performance Agent on page 11.
3 If your Azure Performance Agent is installed behind a firewall, configure firewall settings on the machine running the Foglight Agent Manager. For more information, see Configuring firewall settings on page 11.
Foglight Hybrid Cloud Manager for Azure 1.9.0 User and Administration GuideUsing Foglight Hybrid Cloud Manager for Azure
8

Getting authentication information through Azure portal
To get Tenant ID, Application ID, and Access Key through the Azure portal:
1 Log in to the Azure portal.
2 On the left navigation panel, select Azure Active Directory.
The Azure Active Directory view that belongs to your account opens.
3 In the Azure Active Directory view, select Manage > Properties, and then click to copy the Directory ID, that is also known as Tenant ID.
4 In the Azure Active Directory view, select Manage > App registrations, and then click New registration.
The Register an application view opens.
5 Type the following information, as needed, and then click Register.
▪ Name: type the name of the application.
▪ Supported account types: select who can use this application or access this API.
▪ Redirect URL (optional): type the URL address where users can sign in and use the application.
The Register an application view closes and the App registrations list is refreshed automatically.
6 In the App registrations list, select the application created in Step 5.
Keep the Application ID displayed in the Application details view somewhere safe.
7 In the Application details view, click Manage > Certificates & secrets. The Certificates & secrets view opens on the right.
8 In the Certificates & secrets view, click + New client secret.
The Add a client secret view opens.
9 In the Add a client secret view, specify the values of DESCRIPTION and EXPIRES, and then click Add.
Foglight Hybrid Cloud Manager for Azure 1.9.0 User and Administration GuideUsing Foglight Hybrid Cloud Manager for Azure
9

10 Click to copy the key value.
11 Click Microsoft Azure on the top left corner, to return the default dashboard that appears once logged into the Azure portal.
12 On the left navigation panel, click Subscriptions.
The Subscriptions view opens.
13 In the Subscriptions view, click the subscription that you want to monitor, then the Subscriptions details view opens.
14 In the Subscription details view, click Access control (IAM), then Access control (IAM) view opens on the right.
15 Click Add and select Add role assignment. The Add role assignment view opens.
16 In the Add role assignment view, select Reader from the Role drop-down list, search for the application created in Step 5, and then click Save.
17 Repeat Step 11 to Step 16, to assign the Storage Account Key Operator Service Role to the application created in Step 5.
Foglight Hybrid Cloud Manager for Azure 1.9.0 User and Administration GuideUsing Foglight Hybrid Cloud Manager for Azure
10

Repeat this procedure if there are multiple applications to be monitored.
Configuring firewall settingsIf your Azure Performance Agent is installed behind the firewall, ensure the following URL addresses and ports are open:
• URL addresses:
▪ https://login.microsoftonline.com
▪ *.azure.com
▪ *.azure.net
▪ *.windows.net
• TCP/UDP port: 443
Creating Azure Performance AgentEach of virtual machine can be monitored only by one Azure Performance agent; otherwise the Management Server topology object changes and the performance issue occurs. Quest strongly recommends that each of the Azure Tenant is monitored by an agent. However in some production environments, you have to create two or more agents for monitoring the same Tenant. Under this condition, implement either of the following for those agents to ensure every agent in the same Tenant monitors different virtual machines:
• If Monitor All is selected in the Select IaaS Virtual Machines to Monitor dialog box: In the Edit Properties dialog box, select Select Resource Groups to be monitored, and then ensure every agent monitors various Resource Groups.
• If Monitor All and Automatically Monitor New Virtual Machines are not selected in the Select IaaS Virtual Machines to Monitor dialog box: In the Edit Properties dialog box, ensure every agent monitors various virtual machines.
• If Monitor All is not selected but Automatically Monitor New Virtual Machines is selected in the Select IaaS Virtual Machines to Monitor dialog box: In the Edit Properties dialog box, select Select Resource Groups to be monitored, and then ensure every agent monitors various Resource Groups.
If you still encounter problems, contact Quest Support.
To create an Azure Performance Agent:
1 Log in to the Foglight browser interface.
2 Ensure that the navigation panel is open.
To open the navigation panel, click the right-facing arrow on the left.
3 On the navigation panel, under Homes, click Cloud Manager.
The Cloud Manager dashboard opens.
4 In the Cloud Manager dashboard, click Administration, and then click Add.
The Agent Setup Wizard dialog box opens.
NOTE: Diagnostics settings must be enabled to collect metrics for both ARM-deployed virtual machines and standard Storage Account. For more information, see How to enable metrics using the Azure portal.
NOTE: Each of the virtual machine must be monitored by an agent.
Foglight Hybrid Cloud Manager for Azure 1.9.0 User and Administration GuideUsing Foglight Hybrid Cloud Manager for Azure
11
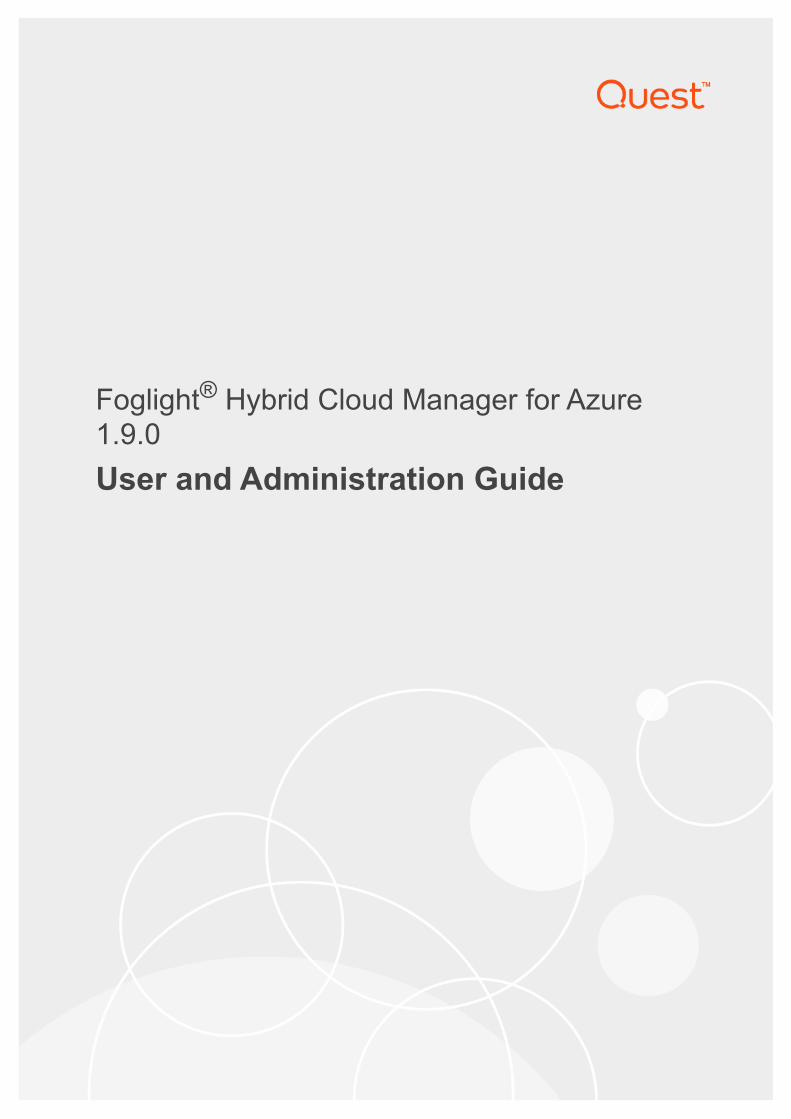
5 In the Agent Manager Host view, select the agent manager on which the new agent is to be deployed, and then click Next.
6 In the Azure Agent Properties view, specify the following values, as needed, then click Next.
▪ Azure Environment*: The value of Azure Environment: Azure.com (default value) or Azure.cn(China).
▪ Tenant Directory ID *: The value of Tenant ID retrieved in Getting authentication information through Azure portal.
▪ Tenant Alias Name: The display name that identifies your Tenant.
▪ Application ID *: The value of Application ID retrieved in Getting authentication information through Azure portal.
▪ Access Key *: The value of Access Key retrieved in Getting authentication information through Azure portal.
▪ Specify an agent name (Optional): Specify the name of agent.
▪ Configure Proxy (Optional): Configure the proxy setting when the Agent Host requires a proxy connection to the Internet. For more details, see Configure Proxy (Optional): on page 51.
7 In the Agent Setup Summary view, confirm the agent information, and then click Finish.
The new Azure Performance Agent is created, and its data is to be displayed on the Monitoring tab after a few minutes.
Dashboard location and UI elementsAfter installing Foglight Hybrid Cloud Manager for Azure, the Cloud Manager entry appears under Homes.
To access the Cloud Manager dashboard:
1 Log in to the Foglight browser interface.
2 Ensure that the navigation panel is open.
To open the navigation panel, click the right-facing arrow on the left.
3 On the navigation panel, under Homes, click Cloud Manager.
The Cloud Manager dashboard opens.
Foglight Hybrid Cloud Manager for Azure 1.9.0 User and Administration GuideUsing Foglight Hybrid Cloud Manager for Azure
12
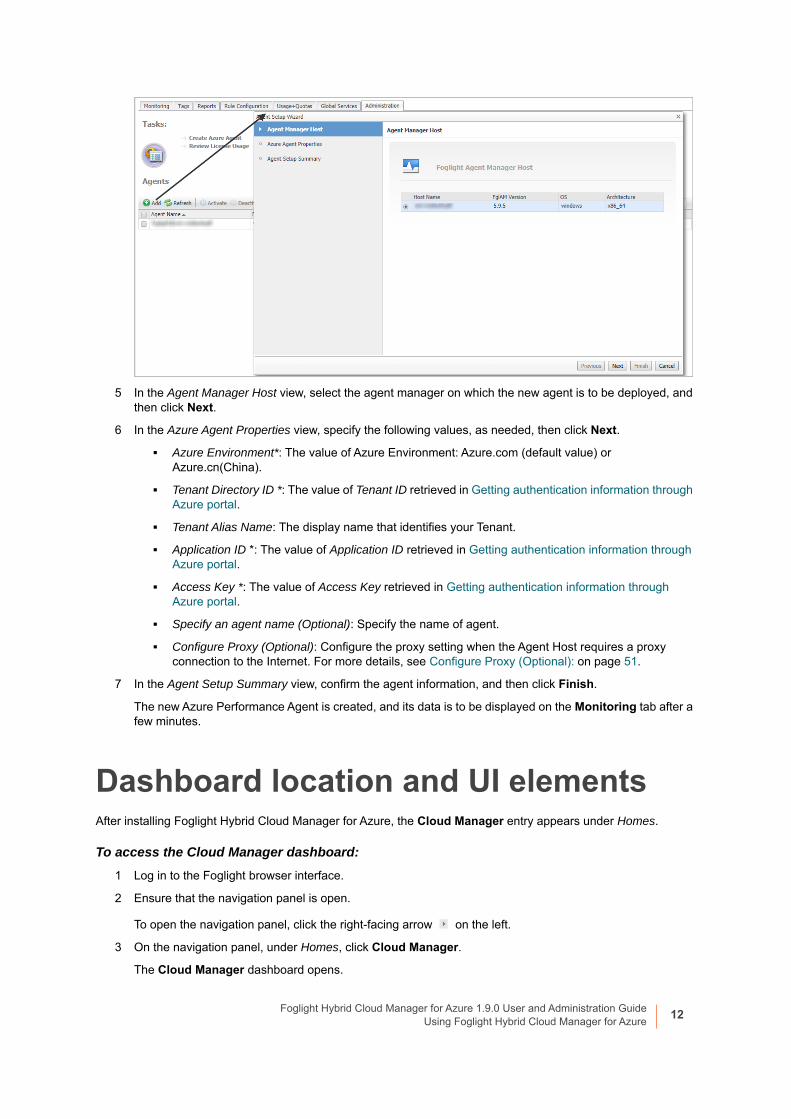
The Cloud Manager dashboard consists of the following UI elements:
• Group selector
• Actions bar
• Menu bar
• Quick view
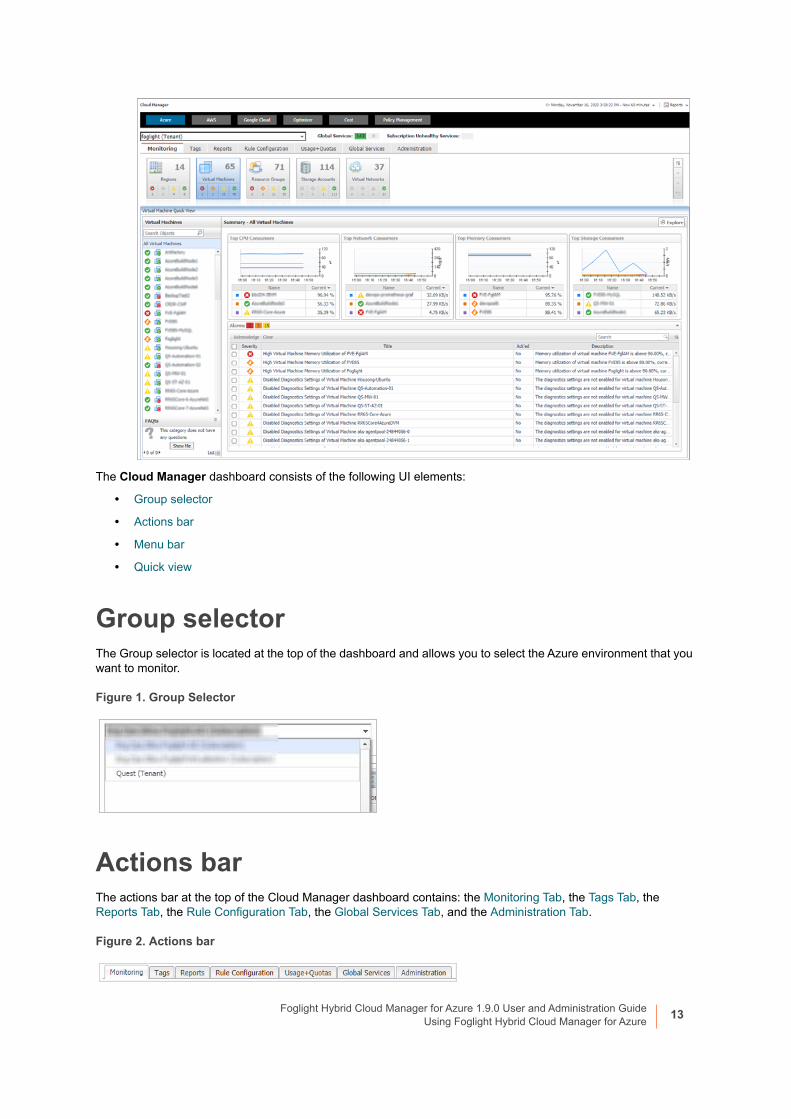
Group selectorThe Group selector is located at the top of the dashboard and allows you to select the Azure environment that you want to monitor.
Figure 1. Group Selector
Actions barThe actions bar at the top of the Cloud Manager dashboard contains: the Monitoring Tab, the Tags Tab, the Reports Tab, the Rule Configuration Tab, the Global Services Tab, and the Administration Tab.
Figure 2. Actions bar
Foglight Hybrid Cloud Manager for Azure 1.9.0 User and Administration GuideUsing Foglight Hybrid Cloud Manager for Azure
13

Menu barThe Menu bar contains the following tiles: Regions monitoring, Virtual Machines monitoring, Resource Groups Monitoring, Storage Accounts monitoring, and Virtual Networks monitoring.
Figure 3. Menu bar
Quick viewThe quick view is located on the lower part of the Cloud Manager dashboard, which is updated based on the tab selected on the Menu bar or the Actions bar.
Foglight Hybrid Cloud Manager for Azure 1.9.0 User and Administration GuideUsing Foglight Hybrid Cloud Manager for Azure
14
2
Monitoring Tab
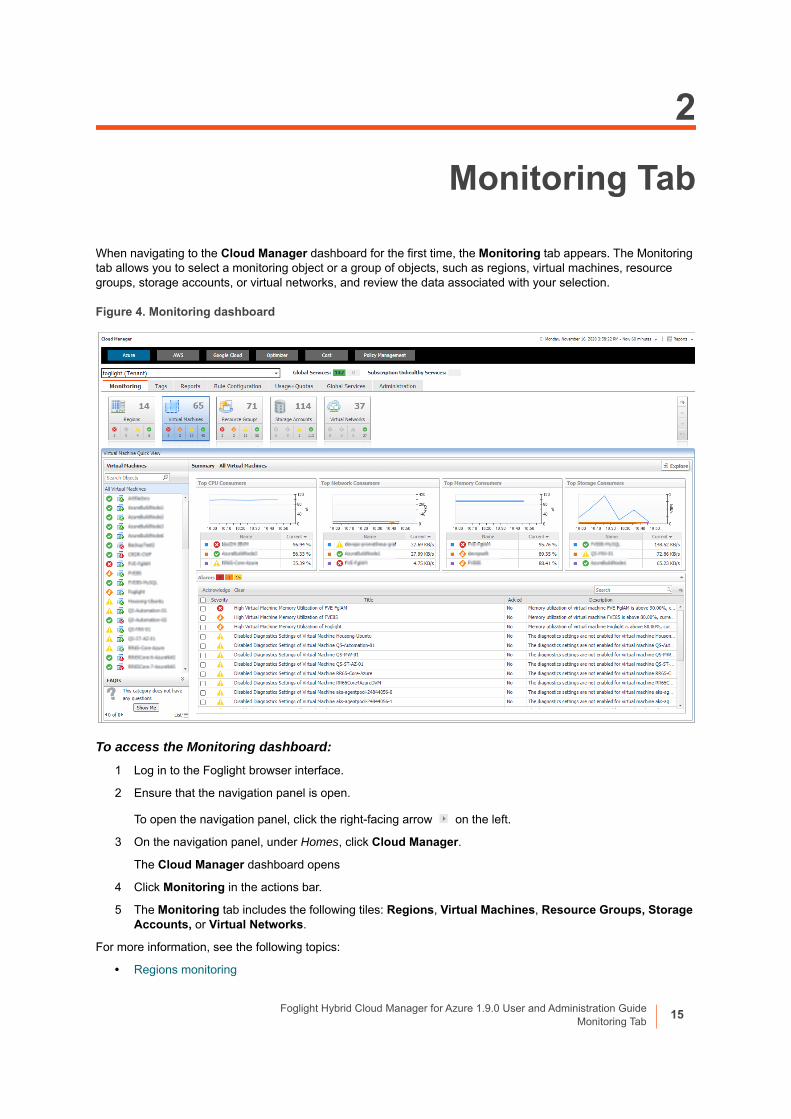
When navigating to the Cloud Manager dashboard for the first time, the Monitoring tab appears. The Monitoring tab allows you to select a monitoring object or a group of objects, such as regions, virtual machines, resource groups, storage accounts, or virtual networks, and review the data associated with your selection.
Figure 4. Monitoring dashboard
To access the Monitoring dashboard:
1 Log in to the Foglight browser interface.
2 Ensure that the navigation panel is open.
To open the navigation panel, click the right-facing arrow on the left.
3 On the navigation panel, under Homes, click Cloud Manager.
The Cloud Manager dashboard opens
4 Click Monitoring in the actions bar.
5 The Monitoring tab includes the following tiles: Regions, Virtual Machines, Resource Groups, Storage Accounts, or Virtual Networks.
For more information, see the following topics:
• Regions monitoring
Foglight Hybrid Cloud Manager for Azure 1.9.0 User and Administration GuideMonitoring Tab
15

• Virtual Machines monitoring
• Resource Groups Monitoring
• Storage Accounts monitoring
• Virtual Networks monitoring
Regions monitoringThe Regions view shows the data collected about a specific region or all Azure regions. For more information, see the following topics:
• Regions view
• Summary - All Regions view
• Region Summary view
Regions viewThe Regions tree view lists the regions existing in your Azure environment and shows their state. This view appears on the left when you select the Regions tile in the Actions bar.
Figure 5. Regions view
Selecting the All Regions node displays the Summary - All Regions view on the right. Similarly, selecting a region node shows region-specific metrics in the Region Summary view on the right.
Summary - All Regions viewThe Summary - All Regions view appears on the right when you select All Regions in the Regions view.
Table 1. Description of the View
Data displayed• Alarm severity. The state of the most recent alarm raised against the associated
virtual machine.
• All Regions. A parent node for the regions that appear in this view.
• Region. The region name.
Where to go next Drill down on:
• All Regions. Shows the Summary - All Regions view on the right.
• Region. Shows the Region Summary view on the right.
Foglight Hybrid Cloud Manager for Azure 1.9.0 User and Administration GuideMonitoring Tab
16
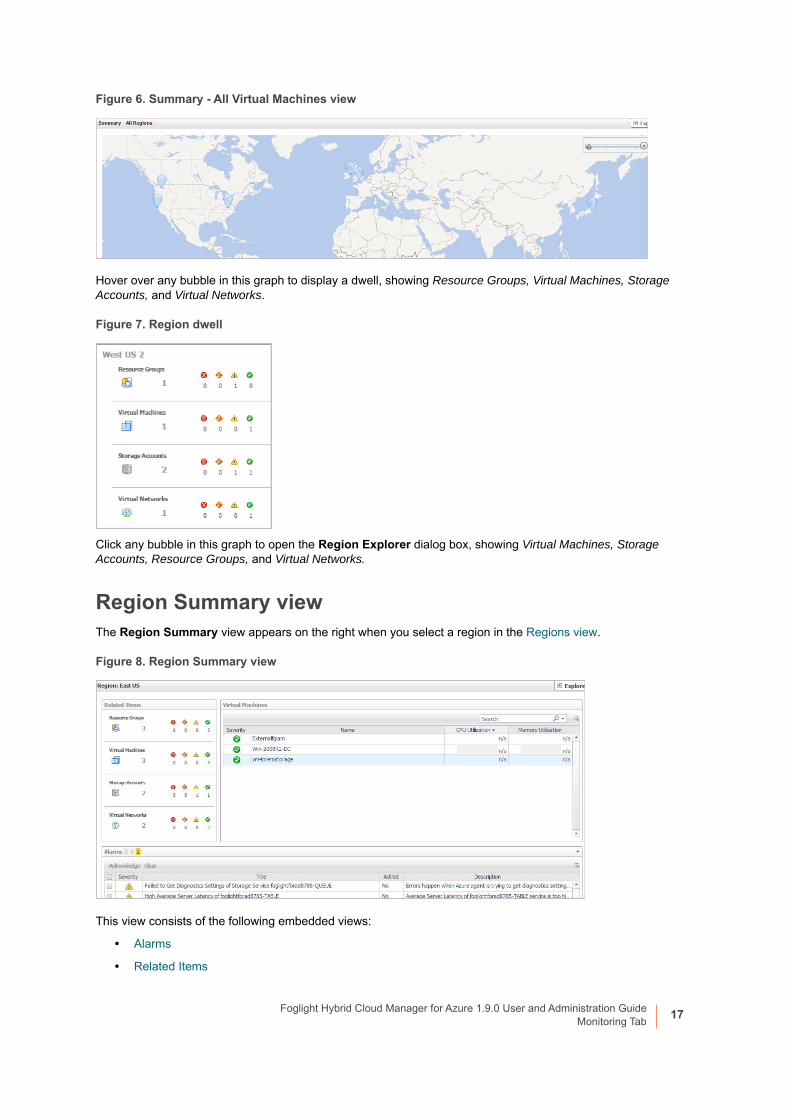
Figure 6. Summary - All Virtual Machines view
Hover over any bubble in this graph to display a dwell, showing Resource Groups, Virtual Machines, Storage Accounts, and Virtual Networks.
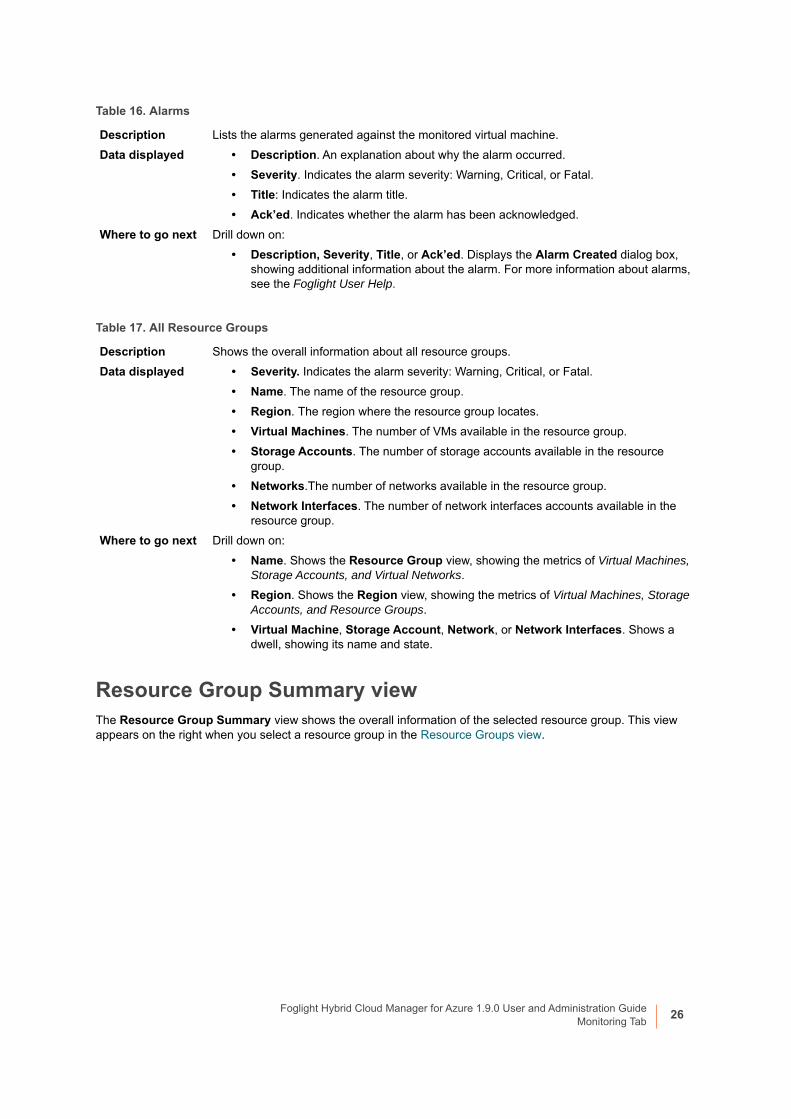
Figure 7. Region dwell
Click any bubble in this graph to open the Region Explorer dialog box, showing Virtual Machines, Storage Accounts, Resource Groups, and Virtual Networks.
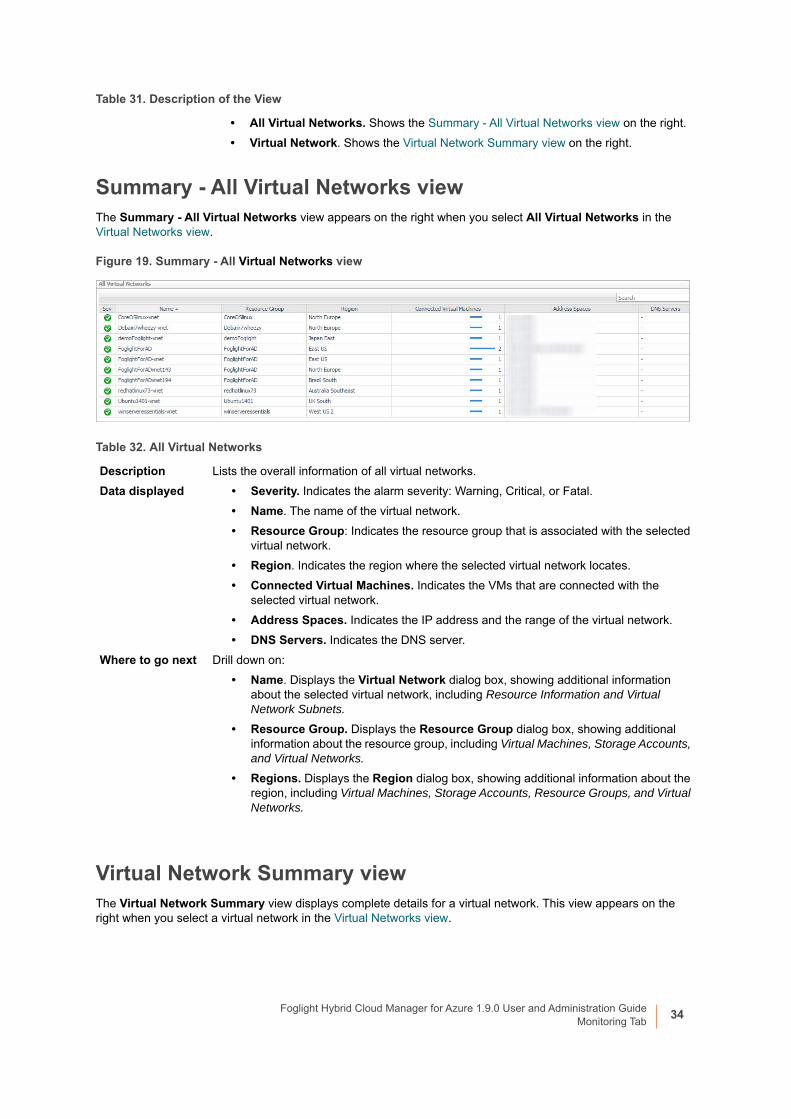
Region Summary viewThe Region Summary view appears on the right when you select a region in the Regions view.
Figure 8. Region Summary view
This view consists of the following embedded views:
• Alarms
• Related Items
Foglight Hybrid Cloud Manager for Azure 1.9.0 User and Administration GuideMonitoring Tab
17

• Virtual Machines
Table 2. Alarms
Description Lists the alarms generated against the selected region.
Data displayed • Description. An explanation about why the alarm occurred.
• Severity. Indicates the alarm severity: Warning, Critical, or Fatal.
• Title. Indicates the alarm title.
• Ack’ed. Indicates whether the alarm has been acknowledged.
Where to go next Drill down on:
• Description, Severity, Title, or Ack’ed. Displays the Alarm Created dialog box, showing additional information about the alarm. For more information about alarms, see the Foglight User Help.
Table 3. Related Items
Description Shows the numbers and states of the selected regions.
Data displayed• Resource Groups. The number of the resource groups that are associated with the
selected region, followed by related alarm counts, broken down by the alarm state (Normal, Warning, Critical, Fatal).
• Virtual Machines. The number of the virtual machines that are associated with the selected region, followed by related alarm counts, broken down by the alarm state (Normal, Warning, Critical, Fatal).
• Storage Accounts. The number of the storage accounts that are that are associated with the selected region, followed by related alarm counts, broken down by the alarm state (Normal, Warning, Critical, Fatal).
• Virtual Networks. The number of the virtual networks that are that are associated with the selected region, followed by related alarm counts, broken down by the alarm state (Normal, Warning, Critical, Fatal).
Where to go next Drill down on:
• Resource Groups. Displays the Resource Groups dwell, showing the name and state of the associated Resource Groups.
• Virtual Machines. Displays the Virtual Machines dwell, showing the name and state of the associated virtual machine.
Foglight Hybrid Cloud Manager for Azure 1.9.0 User and Administration GuideMonitoring Tab
18

Virtual Machines monitoringThe Virtual Machines (VM) view shows the data collected about a specific Azure virtual machine or all Azure virtual machines. For more information, see the following topics:
• Virtual Machines view
• Summary - All Virtual Machines view
• Virtual Machine Summary view
Virtual Machines viewThe Virtual Machines tree view lists the virtual machines existing in your Azure environment and shows their state. This view appears on the left when you select the Virtual Machines tile in the Actions bar.
• Storage Accounts. Displays the Servers dwell, showing the name and state of the associated storage accounts.
• Virtual Networks. Displays the Virtual Networks dwell, showing the name and state of the associated virtual networks.
Table 4. Virtual Machines
DescriptionShows a table, showing the information about the virtual machines associated with the selected region.
Data displayed • Severity. Indicates the alarm severity: Warning, Critical, or Fatal.
• Name. The name of the virtual machine.
• CPU Utilization. The amount of CPU processing speed.
• Memory Utilization. The amount of memory utilization.
Where to go next Drill down on:
• CPU Utilization. Displays the CPU Utilization dialog box, including CPU Utilization, % Privileged Time, and % User Time.
• Memory Utilization. Displays the Memory Usage dialog box, including Memory Utilization and % Available Paging Space.
• Name. Displays the Virtual Machine view, showing the metrics of Resource Information, CPU, Memory, Network, and Storage.
Table 3. Related Items
Foglight Hybrid Cloud Manager for Azure 1.9.0 User and Administration GuideMonitoring Tab
19

Figure 9. Virtual Machines view
Selecting the All Virtual Machines node displays overall resource utilization for all virtual machines in your Azure environment and the elements that consume the highest amount of system resources in the Summary - All Virtual Machines view on the right. Similarly, selecting a virtual machine node shows virtual machine-specific metrics in the Virtual Machine Summary view on the right.
Summary - All Virtual Machines viewThe Summary - All Virtual Machines view displays overall resource utilization information for a group of virtual machines and shows the elements that consume the highest amount of system resources. This view appears on the right when you select All Virtual Machines in the Virtual Machines view.
Figure 10. Summary - All Virtual Machines view
This view consists of the following embedded views:
• Alarms
• Top CPU Consumers
• Top Network Consumers
Table 5. Description of the View
Data displayed• Alarm severity. The state of the most recent alarm raised against the associated
virtual machine.
• All Virtual Machines. A parent node for the virtual machine object instances that appear in this view.
• Virtual machine Power State. The power state of the virtual machine.
• Virtual machine. The virtual machine name.
Where to go next Drill down on:
• All Virtual Machines. Shows the Summary - All Virtual Machines view on the right.
• Virtual machine. Shows the Virtual Machine Summary view on the right.
Foglight Hybrid Cloud Manager for Azure 1.9.0 User and Administration GuideMonitoring Tab
20

• Top Memory Consumers
• Top Storage Consumers
Table 6. Alarms
Description Lists the alarms generated against the monitored virtual machine.
Data displayed • Description. An explanation about why the alarm occurred.
• Severity. Indicates the alarm severity: Warning, Critical, or Fatal.
• Title: Indicates the alarm title.
• Ack’ed. Indicates whether the alarm has been acknowledged.
Where to go next Drill down on:
• Description, Severity, Title, or Ack’ed. Displays the Alarm Created dialog box, showing additional information about the alarm. For more information about alarms, see the Foglight User Help.
Table 7. Top CPU Consumers
Description Shows the top three virtual machines with the highest average CPU utilization.
Data displayed• Utilization. The amount of CPU processing speed each of the top three CPU
consumers spend on executing system code and user programs, during the selected time range.
• Virtual Machine. The name of the virtual machine.
Where to go next Drill down on:
• Virtual Machine. Displays the fundamental VM information, including Resource Information, CPU, Memory, Network, and Storage.
Table 8. Top Network Consumers
Description Shows the top three virtual machines that are consuming most network bandwidth.
Data displayed• Rate. The rate at which the top three network consumers transfer data to or from the
network during the selected time range.
• Virtual Machine. The name of the virtual machine that is one of the top three network consumers.
Where to go next Drill down on:
• Virtual Machine. Displays the fundamental VM information, including Resource Information, CPU, Memory, Network, and Storage.
Table 9. Top Memory Consumers
Description Shows the top three virtual machines with the highest average memory utilization.
Data displayed• Virtual Machine. The name of the virtual machine that is one of the top three
memory consumers.
• Rate. The amount of memory the top three memory consumers use during the selected time range.
Where to go next Drill down on:
• Virtual Machine or Rate. Displays the fundamental VM information, including Resource Information, CPU, Memory, Network, and Storage.
Foglight Hybrid Cloud Manager for Azure 1.9.0 User and Administration GuideMonitoring Tab
21

Virtual Machine Summary viewThe Virtual Machine Summary view shows the overall resource utilization and the amounts of system resource consumption for a virtual machine. This view appears on the right when you select a virtual machine in the Virtual Machines view.
Figure 11. Virtual Machine Summary view
This view consists of the following embedded views:
• Alarms
• Related Items
• Resource Utilizations
• Resource Information
Table 10. Top Storage Consumers
Description Shows the top three virtual machines with the highest available disk space.
Data displayed• Virtual Machine. The name of the virtual machine that is one of the top three disk
consumers.
• Rate. The rate at which the top three disk consumers read or write data to the storage during the selected time range.
Where to go next Drill down on:
• Virtual Machine or Rate.Displays the fundamental VM information, including Resource Information, CPU, Memory, Network, and Storage.
Table 11. Alarms
Description Lists the alarms generated against the selected virtual machine.
Data displayed • Description. An explanation about why the alarm occurred.
• Severity. Indicates the alarm severity: Warning, Critical, or Fatal.
• Title. Indicates the alarm title.
• Ack’ed. Indicates whether the alarm has been acknowledged.
Where to go next Drill down on:
• Description, Severity, Title, or Ack’ed. Displays the Alarm Created dialog box, showing additional information about the alarm. For more information about alarms, see the Foglight User Help.
Foglight Hybrid Cloud Manager for Azure 1.9.0 User and Administration GuideMonitoring Tab
22

Table 12. Related Items
DescriptionShows the numbers and states of the selected virtual machine running on the monitored Azure environment.
Data displayed• Resource Groups. The number of the resource groups that are associated with the
selected virtual machine, followed by related alarm counts, broken down by the alarm state (Normal, Warning, Critical, Fatal).
• Regions. The number of the region that are associated with the selected virtual machine, followed by related alarm counts, broken down by the alarm state (Normal, Warning, Critical, Fatal).
• Storage Accounts. The number of the storage accounts that are that are associated with the selected virtual machine, followed by related alarm counts, broken down by the alarm state (Normal, Warning, Critical, Fatal).
• Virtual Networks. The number of the virtual networks that are that are associated with the selected virtual machine, followed by related alarm counts, broken down by the alarm state (Normal, Warning, Critical, Fatal).
Where to go next Drill down on:
• Resource Groups. Displays the Resource Groups dwell, showing the name and the state of the resource group in which the selected virtual machine is running.
• Regions. Displays the Regions dwell, showing the name and state of the region in which the selected virtual machine is running.
• Storage Accounts. Displays the Servers dwell, showing the name and state of the storage on which the selected virtual machine is running.
• Virtual Networks. Displays the Virtual Networks dwell, showing the name and state of the selected virtual machine.
Table 13. Resource Utilizations
DescriptionShows the resource consumption for the selected virtual machine, broken down into four simple views.
Data displayed• CPU Load. The current percentage of the selected virtual machine’s CPU load,
used to execute system code and user programs, based on the total CPU capacity allocated to that virtual machine.
• Storage I/O. The current storage I/O rate for the selected virtual machine.
• Network I/O. The current rate at which the selected virtual machine transfers data from and to the network.
Foglight Hybrid Cloud Manager for Azure 1.9.0 User and Administration GuideMonitoring Tab
23

Resource Groups MonitoringThe Resource Groups view shows the data collected about a specific resource group or all resource groups. For more information, see the following topics:
• Resource Groups view
• Summary - All Resource Groups view
• Resource Group Summary view
Resource Groups viewThe Resource Groups tree view lists the resource groups existing in your Azure environment and shows their state. This view appears on the left when you select the Resource Groups tile in the Actions bar.
• Memory. The total amount of memory that is available to the selected virtual machine.
Where to go next Drill down on:
• CPU Load spinner. Displays the CPU Load dialog box.
• CPU Utilization graph. Displays the CPU Utilization dialog box, including CPU Utilization, % Privileged Time, and % User Time.
• Network I/O spinner. Displays the Network I/O dialog box.
• Network Utilization graph. Displays the Network Utilization dialog box, including Network Transfer Rate, Network In, and Network Out.
• Memory spinner. Displays the Memory dialog box.
• Memory Utilization graph. Displays the Memory Utilization dialog box, including Memory Utilization and % Available Paging Space.
• Storage I/O spinner. Displays the Storage I/O dialog box.
• Storage Utilization graph. Displays the Storage Utilization dialog box, including Storage Utilization, Read Operations / Second, and Write Operations / Second.
Table 14. Resource Information
Description
Shows the name of the selected virtual machine, its status, the basic configuration, and cost information, including the name of the resource group associated with this virtual machine, the region on which this virtual machine is running, its IP address, the Operating System (OS), current month billing, and last month billing.
Table 13. Resource Utilizations
Foglight Hybrid Cloud Manager for Azure 1.9.0 User and Administration GuideMonitoring Tab
24

Figure 12. Resource group view
Selecting the All Resource Groups node displays all resource groups in the Summary - All Resource Groups view on the right. Similarly, selecting a resource group shows resource group-specific metrics in the Resource Group Summary view on the right.
Summary - All Resource Groups viewThe Summary - All Resource Groups view displays overall resource group information. This view appears on the right when you select All Virtual Machines in the Resource Groups view.
Figure 13. Summary - All Resource Groups view
This view consists of the following embedded views:
• Alarms
• All Resource Groups
Table 15. Description of the View
Data displayed• Alarm severity. The state of the most recent alarm raised against the associated
virtual machine.
• All Resource Groups. A parent node for the resource groups that appear in this view.
• Resource Group. The resource group name.
Where to go next Drill down on:
• All Resource Groups. Shows the Summary - All Resource Groups view on the right.
• Resource Groups. Shows the Resource Group Summary view on the right.
Foglight Hybrid Cloud Manager for Azure 1.9.0 User and Administration GuideMonitoring Tab
25
Resource Group Summary viewThe Resource Group Summary view shows the overall information of the selected resource group. This view appears on the right when you select a resource group in the Resource Groups view.
Table 16. Alarms
Description Lists the alarms generated against the monitored virtual machine.
Data displayed • Description. An explanation about why the alarm occurred.
• Severity. Indicates the alarm severity: Warning, Critical, or Fatal.
• Title: Indicates the alarm title.
• Ack’ed. Indicates whether the alarm has been acknowledged.
Where to go next Drill down on:
• Description, Severity, Title, or Ack’ed. Displays the Alarm Created dialog box, showing additional information about the alarm. For more information about alarms, see the Foglight User Help.
Table 17. All Resource Groups
Description Shows the overall information about all resource groups.
Data displayed • Severity. Indicates the alarm severity: Warning, Critical, or Fatal.
• Name. The name of the resource group.
• Region. The region where the resource group locates.
• Virtual Machines. The number of VMs available in the resource group.
• Storage Accounts. The number of storage accounts available in the resource group.
• Networks.The number of networks available in the resource group.
• Network Interfaces. The number of network interfaces accounts available in the resource group.
Where to go next Drill down on:
• Name. Shows the Resource Group view, showing the metrics of Virtual Machines, Storage Accounts, and Virtual Networks.
• Region. Shows the Region view, showing the metrics of Virtual Machines, Storage Accounts, and Resource Groups.
• Virtual Machine, Storage Account, Network, or Network Interfaces. Shows a dwell, showing its name and state.
Foglight Hybrid Cloud Manager for Azure 1.9.0 User and Administration GuideMonitoring Tab
26

Figure 14. Resource Group Summary view
This view consists of the following embedded views:
• Alarms
• Related Items
• Virtual Machines
Table 18. Alarms
Description Lists the alarms generated against the selected virtual machine.
Data displayed • Description. An explanation about why the alarm occurred.
• Severity. Indicates the alarm severity: Warning, Critical, or Fatal.
• Title. Indicates the alarm title.
• Ack’ed. Indicates whether the alarm has been acknowledged.
Where to go next Drill down on:
• Description, Severity, Title, or Ack’ed. Displays the Alarm Created dialog box, showing additional information about the alarm. For more information about alarms, see the Foglight User Help.
Table 19. Related Items
DescriptionShows the numbers and states of the selected resource group on the monitored Azure environment.
Data displayed• Virtual Machines. The number of the VMs that are associated with the selected
resource group, followed by related alarm counts, broken down by the alarm state (Normal, Warning, Critical, Fatal).
• Regions. The number of the region that are associated with the selected virtual machine, followed by related alarm counts, broken down by the alarm state (Normal, Warning, Critical, Fatal).
• Storage Accounts. The number of the storage accounts that are that are associated with the selected virtual machine, followed by related alarm counts, broken down by the alarm state (Normal, Warning, Critical, Fatal).
• Virtual Networks. The number of the virtual networks that are that are associated with the selected virtual machine, followed by related alarm counts, broken down by the alarm state (Normal, Warning, Critical, Fatal).
Where to go next Drill down on:
Foglight Hybrid Cloud Manager for Azure 1.9.0 User and Administration GuideMonitoring Tab
27

Storage Accounts monitoringThe Storage Accounts view shows the data collected about a specific storage account or all storage accounts. For more information, see the following topics:
• Virtual Machines. Displays the Virtual Machines dwell, showing the name of VM and its state.
• Regions. Displays the Regions dwell, showing the name and state of the region in which the selected virtual machine is running.
• Storage Accounts. Displays the Servers dwell, showing the name and state of the storage on which the selected virtual machine is running.
• Virtual Networks. Displays the Virtual Networks dwell, showing the name and state of the selected virtual machine.
Table 20. Virtual Machines
Description Shows a table, showing the information about the selected resource group.
Data displayed • Severity. Indicates the alarm severity: Warning, Critical, or Fatal.
• Name. The name of the virtual machine.
• Region. The region on which the virtual machine is running.
• CPU Utilization. The amount of CPU processing speed.
• Memory Utilization. The amount of memory utilization.
Where to go next Drill down on:
• CPU Utilization. Displays the CPU Utilization dialog box, including CPU Utilization, % Privileged Time, and % User Time.
• Memory Utilization. Displays the Memory Usage dialog box, including Memory Utilization and % Available Paging Space.
• Name. Displays the Virtual Machine view, showing the metrics of Resource Information, CPU, Memory, Network, and Storage.
• Region. Displays the Virtual Machine view, showing the metrics of Virtual Machines, Storage Accounts, and Resource Groups.
Table 19. Related Items
Foglight Hybrid Cloud Manager for Azure 1.9.0 User and Administration GuideMonitoring Tab
28

• Storage Accounts view
• Summary - All Storage Accounts view
• Storage Account Summary view
Storage Accounts viewThe Storage Accounts view is a tree view. It lists the storage accounts existing in your environment, and shows their severity state.This view appears on the left when you select the Storage Accounts tile in the Actions bar.
Figure 15. Storage Accounts view
Selecting the All Storage Accounts node displays the overall resource utilization for all storage accounts in your integrated system and identifies the ones that consume the highest amount of system resources in the Summary - All Storage Accounts view on the right. Similarly, selecting a storage node shows storage-specific metrics in the Storage Account Summary view.
Summary - All Storage Accounts viewThe Summary - All Storage Accounts view displays overall information for all volumes in the selected service and identifies the elements that consume the highest amount of resources. This view appears on the right when you select All Storage Accounts in the Storage Accounts view.
Table 21. Description of the View
Data displayed • Alarm severity. The state of the most recent alarm raised against the volume.
• All Storage Accounts. A parent node for the instances of all volumes that appear in this view.
• Storage Account. The instance of storage account.
Where to go next Drill down on:
• All Storage Accounts. Shows the Summary - All Storage Accounts view on the right.
• Storage Account. Shows the Storage Account Summary view on the right.
Foglight Hybrid Cloud Manager for Azure 1.9.0 User and Administration GuideMonitoring Tab
29

Figure 16. Summary - All Storage Accounts view
This view consists of the following embedded views:
• Alarms
• Top E2E Latency
• Top Server Latency
• Top Total Egress
• Top Total Egress
Table 22. Alarms
Description Lists the alarms generated against the monitored virtual machine.
Data displayed • Description. An explanation about why the alarm occurred.
• Severity. Indicates the alarm severity: Warning, Critical, or Fatal.
• Title: Indicates the alarm title.
• Ack’ed. Indicates whether the alarm has been acknowledged.
Where to go next Drill down on:
• Description, Severity, Title, or Ack’ed. Displays the Alarm Created dialog box, showing additional information about the alarm. For more information about alarms, see the Foglight User Help.
Table 23. Top E2E Latency
Description Shows the top three storage accounts with the highest end-to-end (E2E) latency.
Data displayed • Current. The value of E2E latency (in seconds).
• Storage Account. The name of the storage account.
Where to go next Drill down on:
• Current, Storage Account. Shows the Storage Account view, including Resource Information, and Average E2E Latency, Average Server Latency, Total Egress, Total Ingress, Total Requests, and Total Billable Requests.
Table 24. Top Server Latency
Description Shows the top three storage accounts with the highest server latency.
Data displayed • Current. The value of E2E latency (in milliseconds).
• Storage Account. The name of the storage account.
Foglight Hybrid Cloud Manager for Azure 1.9.0 User and Administration GuideMonitoring Tab
30

Storage Account Summary viewThe Storage Account Summary view displays complete details for a storage account. This view appears on the right when you select a storage account in the Storage Accounts view.
Figure 17. Storage Account Summary view
This view consists of the following embedded views:
• Alarms
Where to go next Drill down on:
• Current, Storage Account. Shows the Storage Account view, including Resource Information, and Average E2E Latency, Average Server Latency, Total Egress, Total Ingress, Total Requests, and Total Billable Requests.
Table 25. Top Total Egress
Description Shows the top three storage accounts with the highest Egress.
Data displayed • Current. The value of Egress (in KB).
• Storage Account. The name of the storage account.
Where to go next Drill down on:
• Current, Storage Account. Shows the Storage Account view, including Resource Information, and Average E2E Latency, Average Server Latency, Total Egress, Total Ingress, Total Requests, and Total Billable Requests.
Table 26. Top Total Ingress
Description Shows the top three storage accounts with the highest Egress.
Data displayed • Current. The value of Ingress (in KB).
• Rate. The rate at which the top three disk consumers read or write data to the storage during the selected time range.
Where to go next Drill down on:
• Current, Storage Account. Shows the Storage Account view, including Resource Information, and Average E2E Latency, Average Server Latency, Total Egress, Total Ingress, Total Requests, and Total Billable Requests.
Table 24. Top Server Latency
Foglight Hybrid Cloud Manager for Azure 1.9.0 User and Administration GuideMonitoring Tab
31

• Related Items
• Metrics
• Resource Information
Table 27. Alarms
Description Lists the alarms generated against the selected virtual machine.
Data displayed • Description. An explanation about why the alarm occurred.
• Severity. Indicates the alarm severity: Warning, Critical, or Fatal.
• Title. Indicates the alarm title.
• Ack’ed. Indicates whether the alarm has been acknowledged.
Where to go next Drill down on:
• Description, Severity, Title, or Ack’ed. Displays the Alarm Created dialog box, showing additional information about the alarm. For more information about alarms, see the Foglight User Help.
Table 28. Related Items
DescriptionShows the numbers and states of the selected virtual machine running on the monitored Azure environment.
Data displayed• Resource Groups. The number of the resource groups that are associated with the
selected storage account, followed by related alarm counts, broken down by the alarm state (Normal, Warning, Critical, Fatal).
• Regions. The number of the region that are associated with the selected storage account, followed by related alarm counts, broken down by the alarm state (Normal, Warning, Critical, Fatal).
• Virtual Machines. The number of the virtual machines that are that are associated with the selected storage account, followed by related alarm counts, broken down by the alarm state (Normal, Warning, Critical, Fatal).
Where to go next Drill down on:
• Resource Groups. Displays the Resource Groups dwell, showing the name of Resource Groups and its state.
• Regions. Displays the Regions dwell, showing the name and state of the region in which the selected storage account is running.
• Virtual Machines. Displays the Virtual Machines dwell, showing the name and state of the selected storage account.
Foglight Hybrid Cloud Manager for Azure 1.9.0 User and Administration GuideMonitoring Tab
32

Virtual Networks monitoringThe Virtual Networks view shows the data collected about a specific virtual network or all virtual networks. For more information, see the following topics:
• Virtual Networks view
• Summary - All Virtual Networks view
• Virtual Network Summary view
Virtual Networks viewThe Virtual Networks view is a tree view. It lists the virtual networks existing in your environment, and shows their severity state.This view appears on the left when you select the Virtual Networks tile in the Actions bar.
Figure 18. Virtual Networks view
Selecting the All Virtual Networks node displays the overall information all virtual networks in the Summary - All Virtual Networks view on the right. Similarly, selecting a virtual network node shows virtual network-specific metrics in the Virtual Network Summary view.
Table 29. Metrics
Description Shows the metrics of the selected storage account, broken down into four simple views.
Data displayed • Average E2E Latency. Shows the average E2E latency in seconds.
• Average Server Latency. Shows the average server latency in milliseconds.
• Total Egress. Shows the total Egress in KB.
• Total Ingress. Shows the Total Ingress in KB.
Table 30. Resource Information
DescriptionShows the name of the selected storage account, its status, and the basic configuration, including the name of the resource group associated with this storage account, the location where this storage account locates, its created time, and its replication.
Table 31. Description of the View
Data displayed• Alarm severity. The state of the most recent alarm raised against the virtual
network.
• All Virtual Networks. A parent node for the instances of all virtual networks.
• Virtual Network. The instance of virtual network.
Where to go next Drill down on:
Foglight Hybrid Cloud Manager for Azure 1.9.0 User and Administration GuideMonitoring Tab
33
Summary - All Virtual Networks viewThe Summary - All Virtual Networks view appears on the right when you select All Virtual Networks in the Virtual Networks view.
Figure 19. Summary - All Virtual Networks view
Virtual Network Summary viewThe Virtual Network Summary view displays complete details for a virtual network. This view appears on the right when you select a virtual network in the Virtual Networks view.
• All Virtual Networks. Shows the Summary - All Virtual Networks view on the right.
• Virtual Network. Shows the Virtual Network Summary view on the right.
Table 32. All Virtual Networks
Description Lists the overall information of all virtual networks.
Data displayed • Severity. Indicates the alarm severity: Warning, Critical, or Fatal.
• Name. The name of the virtual network.
• Resource Group: Indicates the resource group that is associated with the selected virtual network.
• Region. Indicates the region where the selected virtual network locates.
• Connected Virtual Machines. Indicates the VMs that are connected with the selected virtual network.
• Address Spaces. Indicates the IP address and the range of the virtual network.
• DNS Servers. Indicates the DNS server.
Where to go next Drill down on:
• Name. Displays the Virtual Network dialog box, showing additional information about the selected virtual network, including Resource Information and Virtual Network Subnets.
• Resource Group. Displays the Resource Group dialog box, showing additional information about the resource group, including Virtual Machines, Storage Accounts, and Virtual Networks.
• Regions. Displays the Region dialog box, showing additional information about the region, including Virtual Machines, Storage Accounts, Resource Groups, and Virtual Networks.
Table 31. Description of the View
Foglight Hybrid Cloud Manager for Azure 1.9.0 User and Administration GuideMonitoring Tab
34

Figure 20. Virtual Network Summary view
This view consists of the following embedded views:
• Subnets
• Connected Virtual Machines
• Resource Information
Table 33. Subnets
Description Lists the subnets associated with the selected virtual network.
Data displayed • Subnet Name. The name of the subnet.
• Address Range. Indicates the IP address and its range.
Table 34. Connected Virtual Machines
Description Lists the virtual machines connected with the selected virtual network.
Data displayed • Severity. Indicates the alarm severity: Warning, Critical, or Fatal.
• Name. The name of the virtual machine.
• Resource Group: Indicates the resource group that is associated with the selected virtual network.
• Region. Indicates the region where the selected virtual network locates.
• Network Transfer Rate. Indicates the network transfer rate.
• Network In. Indicates bytes received for the virtual machine.
• Network Out. Indicates bytes sent for the virtual machine.
Where to go next Drill down on:
• Name. Displays the Virtual Machine dialog box, showing additional information about the virtual machine, including Resource Information, CPU, Memory, Network, and Storage.
• Resource Group. Displays the Resource Group dialog box, showing additional information about the resource group, including Virtual Machines, Storage Accounts, and Virtual Networks.
• Regions. Displays the Region dialog box, showing additional information about the region, including Virtual Machines, Storage Accounts, Resource Groups, and Virtual Networks.
• Network Transfer Rate. Displays the Network Usages dialog box, showing Network Transfer Rate, Network In, and Network Out.
Foglight Hybrid Cloud Manager for Azure 1.9.0 User and Administration GuideMonitoring Tab
35
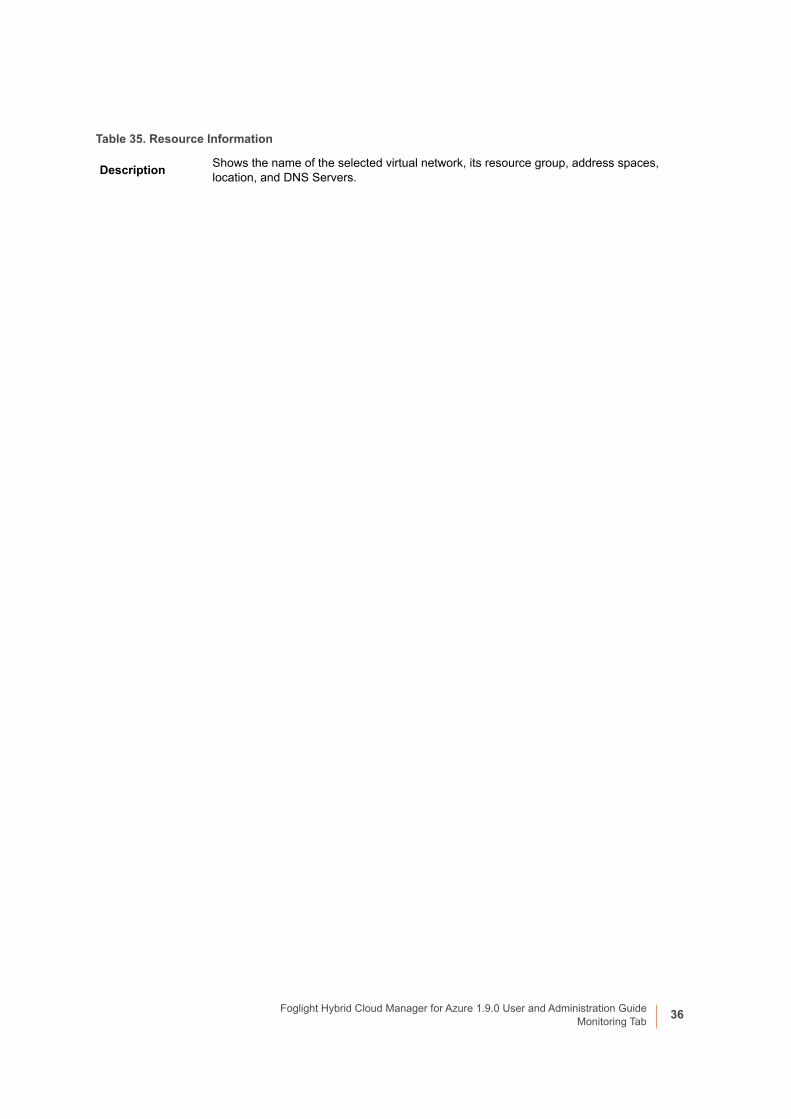
Table 35. Resource Information
DescriptionShows the name of the selected virtual network, its resource group, address spaces, location, and DNS Servers.
Foglight Hybrid Cloud Manager for Azure 1.9.0 User and Administration GuideMonitoring Tab
36
Foglight Hybrid Cloud Manager for Azure 1.9.0 User and Administration GuideTags Tab
3
37
Tags Tab
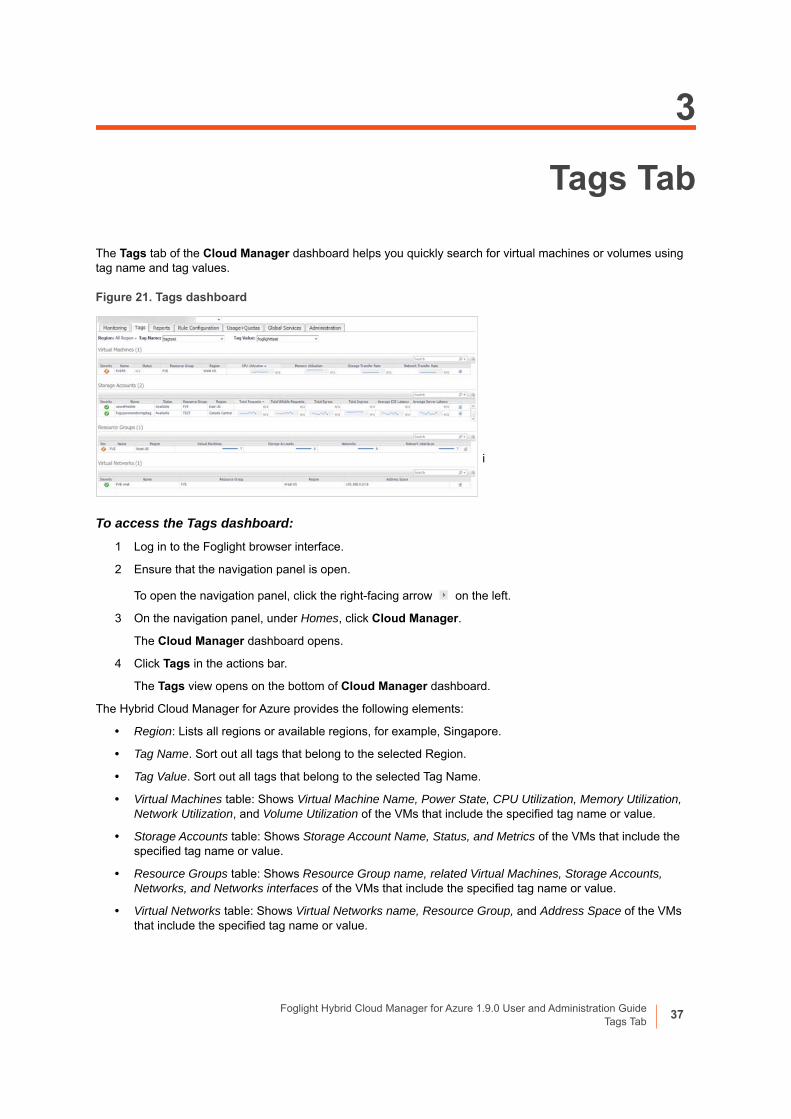
The Tags tab of the Cloud Manager dashboard helps you quickly search for virtual machines or volumes using tag name and tag values.
Figure 21. Tags dashboard
i
To access the Tags dashboard:
1 Log in to the Foglight browser interface.
2 Ensure that the navigation panel is open.
To open the navigation panel, click the right-facing arrow on the left.
3 On the navigation panel, under Homes, click Cloud Manager.
The Cloud Manager dashboard opens.
4 Click Tags in the actions bar.
The Tags view opens on the bottom of Cloud Manager dashboard.
The Hybrid Cloud Manager for Azure provides the following elements:
• Region: Lists all regions or available regions, for example, Singapore.
• Tag Name. Sort out all tags that belong to the selected Region.
• Tag Value. Sort out all tags that belong to the selected Tag Name.
• Virtual Machines table: Shows Virtual Machine Name, Power State, CPU Utilization, Memory Utilization, Network Utilization, and Volume Utilization of the VMs that include the specified tag name or value.
• Storage Accounts table: Shows Storage Account Name, Status, and Metrics of the VMs that include the specified tag name or value.
• Resource Groups table: Shows Resource Group name, related Virtual Machines, Storage Accounts, Networks, and Networks interfaces of the VMs that include the specified tag name or value.
• Virtual Networks table: Shows Virtual Networks name, Resource Group, and Address Space of the VMs that include the specified tag name or value.

4
Reports Tab
Foglight Hybrid Cloud Manager for Azure includes a report generation ability. This allows you to create reports using a set of predefined templates to report on the various aspects of your cloud environment. Foglight Hybrid Cloud Manager for Azure includes a collection of predefined report templates.
You can generate, copy, and edit reports using the Reports tab on the Report dashboard, or alternatively the Reports dashboard included with the Management Server.
Figure 22. Report dashboard
To access the Report dashboard:
1 Log in to the Foglight browser interface.
2 Ensure that the navigation panel is open.
To open the navigation panel, click the right-facing arrow on the left.
3 On the navigation panel, under Homes, click Cloud Manager.
The Cloud Manager dashboard opens.
4 Click Report in the actions bar.
For complete information about this tab, see the Managing Capacity in Virtual Environments User Guide. For more information about the Reports dashboard, see the Foglight User Help.
Available report templatesThe following templates are available with Foglight Hybrid Cloud Manager for Azure.
Table 36. Report templates
Report Template Name This template can be used to generate a report that…
Azure Optimizer - All Reports Summarizes the Azure Optimizer resources.
Azure Optimizer - Potential Zombie VMs Reports
Summarizes the potential zombie VM resources.
Azure Optimizer - Unused Resources Reports
Summarizes the unused VM resources.
Foglight Hybrid Cloud Manager for Azure 1.9.0 User and Administration GuideReports Tab
38

Azure Optimizer - VM Resizing Reports
Summarizes the VM resizing resources.
Azure Resource Group Performance Report - Summary
Summarizes your Resource Group, so that you could know all Resource Group' performance.
Azure Storage Account Performance Report - Detail
Summarizes the capacity and performance details of the selected Storage Account.
Azure Tenant Performance Report - Summary
Summarizes your Tenant infrastructure, so that you could know your Tenant's performance.
Azure Virtual Machine Performance Report - Detail
Summarizes the capacity and performance details of the selected Virtual Machine.
Azure Virtual Machine Performance Report By Tenant - Summary
Summarizes the capacity and performance details of all Virtual Machines.
Cost - All Subscriptions Summary Report
Summarizes the cost for all subscriptions.
Cost - Single Subscription Cost Report
Summarizes the cost for select subscription.
Table 36. Report templates
Report Template Name This template can be used to generate a report that…
Foglight Hybrid Cloud Manager for Azure 1.9.0 User and Administration GuideReports Tab
39

5
Rule Configuration Tab
The Rule Configuration tab of the Cloud Manager dashboard contains links to rules and alarms tasks that you can use to manage Azure rules and alarms.
Figure 23. Rule Configuration dashboard
To access the Rule Configuration dashboard:
1 Log in to the Foglight browser interface.
2 Ensure that the navigation panel is open.
To open the navigation panel, click the right-facing arrow on the left.
3 On the navigation panel, under Homes, click Cloud Manager.
The Cloud Manager dashboard opens.
4 Click Rule Configuration in the actions bar.
For more information, see the following topics:
• Rules view
• Enabling/Disabling rule(s)
• Adding a custom rule
• Removing custom rule(s)
Rules viewBy default, the following columns are displayed in the Rules view:
• Enabled: Indicates if the rule is enabled or disabled . You can sort the list of rules by state, by clicking the Enabled column.
• Rule: Contains the rule name. Click the rule name to start the workflow for viewing and editing rule details.
• Fatal , Critical , and Warning thresholds (multiple-severity rules only):
Foglight Hybrid Cloud Manager for Azure 1.9.0 User and Administration GuideRule Configuration Tab
40

▪ For expressions that include one registry variable, these columns contain the current value of that variable. Click the value to edit it.
▪ For expressions that include multiple registry variables, the column contains an icon . Clicking that icon shows the list of referenced registry variables and their values. Click a value to edit it.
▪ For expressions that do not include any registry variables, this column contains an icon . Clicking that icon navigates to the Edit Rule dashboard.
▪ For rule states that do not have a conditional expression defined, this column is empty.
• Alarms: Contains the number of alarms (multiple-severity rules only) generated by the rule. Clicking that column shows a list of alarms indicating for each alarm its severity, when the alarm was generated, and the alarm message.
• Applies to: Shows the object name that is applied to this custom rule.
• Description: Contains the rule description.
Enabling/Disabling rule(s)The Rule Configuration dashboard shows a list of existing rules and a set of rule management commands at the top of the list. Use the Enable Rule and Disable Rule buttons to activate or deactivate one or multiple rules at once.
To enable a rule:
1 Log in to the Foglight browser interface.
2 Ensure that the navigation panel is open.
To open the navigation panel, click the right-facing arrow on the left.
3 On the navigation panel, under Homes, click Cloud Manager.
The Cloud Manager dashboard opens.
4 Click Rule Configuration.
The Rule Configuration dashboard opens.
5 On the Rules list, select one or more check boxes in the left-most column, and then click Enable Rule.
The Enable Rules dialog box opens.
6 In the Enable Rules dialog box, click Yes.
The Rules list refreshes with the rules’ status updated automatically.
To disable a rule:
1 Log in to the Foglight browser interface.
2 Ensure that the navigation panel is open.
To open the navigation panel, click the right-facing arrow on the left.
3 On the navigation panel, under Homes, click Cloud Manager.
The Cloud Manager dashboard opens.
4 Click Rule Configuration.
The Rule Configuration dashboard opens.
5 On the Rules list, select one or more check boxes in the left-most column, and then click Disable Rule.
The Disable Rules dialog box opens.
Foglight Hybrid Cloud Manager for Azure 1.9.0 User and Administration GuideRule Configuration Tab
41

6 In the Disable Rules dialog box, click Yes.
The Rules list refreshes with the rules’ status updated automatically.
Adding a custom ruleThe Rule Configuration dashboard shows a list of existing rules and a set of rule management commands at the top of the list. Use the Add Custom Rule button to create a new rule as needed.
To customize a rule:
1 Log in to the Foglight browser interface.
2 Ensure that the navigation panel is open.
To open the navigation panel, click the right-facing arrow on the left.
3 On the navigation panel, under Homes, click Cloud Manager.
The Cloud Manager dashboard opens.
4 Click Rule Configuration.
The Rule Configuration dashboard opens.
5 Click Add Custom Rule on the Rules table.
The Create Custom Rule dialog box opens.
6 In the Create Custom Rule dialog box, specify the following:
a Alarm Type:
a Type the name of custom rule in the Name field.
b Select an Object Type, and then select a metric from the Metric drop-down list. The value of Metric varies from the Object Type.
c Select either Threshold or % Change, and then specify the following values as needed.
- Threshold: Specify Condition, Time Period, Severity, and then specify whether or not fire actions if the specified data attempts are reached. The value of Condition cannot be negative.
- % Change: Specify Condition, Time Period, and Severity Label. The value of Condition cannot be negative.
b (Optional) Scope: Choose the objects to which you want to apply this rule. If no objects are selected in this step, the custom rule will apply to all objects which type is the Object Type specified in Step 6.
c (Optional) Notifications: Click Add New, then the Edit Notification Config - Dialog box appears. In this dialog box, type the E-mail Address and Description as needed, and then click Add.
7 Click Save.
The Rules table refreshes automatically to show the newly added rule.
Removing custom rule(s)The Rule Configuration dashboard shows a list of existing rules and a set of rule management commands at the top of the list. Use the Remove Custom Rule button to delete existing custom rule(s) as needed.
To remove a custom rule:
1 Log in to the Foglight browser interface.
Foglight Hybrid Cloud Manager for Azure 1.9.0 User and Administration GuideRule Configuration Tab
42

2 Ensure that the navigation panel is open.
To open the navigation panel, click the right-facing arrow on the left.
3 On the navigation panel, under Homes, click Cloud Manager.
The Cloud Manager dashboard opens.
4 Click Rule Configuration.
The Rule Configuration dashboard opens.
5 Click Remove Custom Rule on the Rules table.
The Remove dialog box opens.
6 Click Yes.
The Rules table refreshes automatically and removes the selected rule.
Foglight Hybrid Cloud Manager for Azure 1.9.0 User and Administration GuideRule Configuration Tab
43
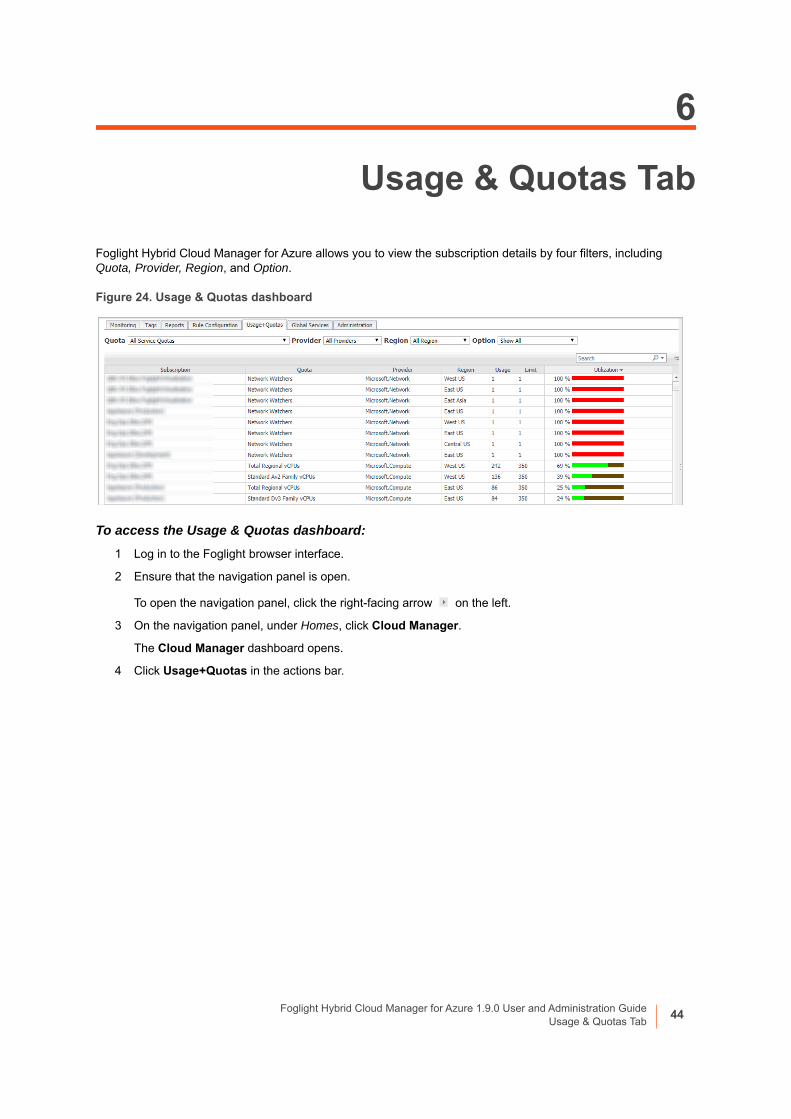
Foglight Hybrid Cloud Manager for Azure 1.9.0 User and Administration GuideUsage & Quotas Tab
6
44
Usage & Quotas Tab
Foglight Hybrid Cloud Manager for Azure allows you to view the subscription details by four filters, including Quota, Provider, Region, and Option.
Figure 24. Usage & Quotas dashboard
To access the Usage & Quotas dashboard:
1 Log in to the Foglight browser interface.
2 Ensure that the navigation panel is open.
To open the navigation panel, click the right-facing arrow on the left.
3 On the navigation panel, under Homes, click Cloud Manager.
The Cloud Manager dashboard opens.
4 Click Usage+Quotas in the actions bar.
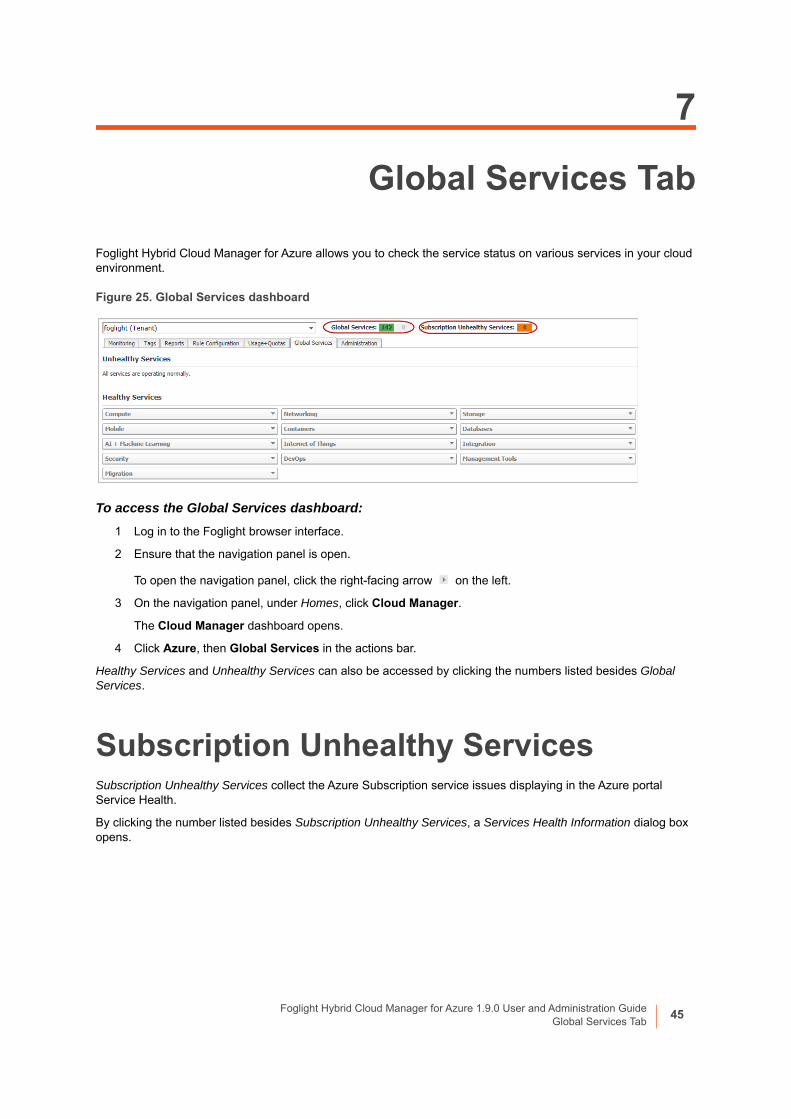
7
Global Services Tab
Foglight Hybrid Cloud Manager for Azure allows you to check the service status on various services in your cloud environment.
Figure 25. Global Services dashboard
To access the Global Services dashboard:
1 Log in to the Foglight browser interface.
2 Ensure that the navigation panel is open.
To open the navigation panel, click the right-facing arrow on the left.
3 On the navigation panel, under Homes, click Cloud Manager.
The Cloud Manager dashboard opens.
4 Click Azure, then Global Services in the actions bar.
Healthy Services and Unhealthy Services can also be accessed by clicking the numbers listed besides Global Services.
Subscription Unhealthy ServicesSubscription Unhealthy Services collect the Azure Subscription service issues displaying in the Azure portal Service Health.
By clicking the number listed besides Subscription Unhealthy Services, a Services Health Information dialog box opens.
Foglight Hybrid Cloud Manager for Azure 1.9.0 User and Administration GuideGlobal Services Tab
45

Figure 26. Services Health Information dialog box
: Click to display the Summary of impact.
: Click the label to mark the service issue as resolved.
Foglight Hybrid Cloud Manager for Azure 1.9.0 User and Administration GuideGlobal Services Tab
46

8
Administration Tab
The Administration tab of the Cloud Manager dashboard contains links to agent administration tasks that you can use to manage Azure performance agents.
Figure 27. Administration dashboard
To access the Administration dashboard:
1 Log in to the Foglight browser interface.
2 Ensure that the navigation panel is open.
To open the navigation panel, click the right-facing arrow on the left.
3 On the navigation panel, under Homes, click Cloud Manager.
The Cloud Manager dashboard opens.
4 Click Administration in the actions bar.
For more information, see the following topics:
• Tasks view
• Agents related commands
• Creating Azure Performance Agent
• Editing agent properties
Tasks viewThe Tasks view allows you to create an Azure agent, to create virtual machine credentials, and to review license usage. For more information about how to create an Azure agent, refer to Creating Azure Performance Agent on page 11.
To review license usage:
1 Log in to the Foglight browser interface.
2 Ensure that the navigation panel is open.
To open the navigation panel, click the right-facing arrow on the left.
Foglight Hybrid Cloud Manager for Azure 1.9.0 User and Administration GuideAdministration Tab
47

3 On the navigation panel, under Homes, click Cloud Manager.
The Cloud Manager dashboard opens.
4 Click Administration.
The Administration dashboard opens.
5 On the Tasks view, click Review License Usage.
The Review License Usage dialog box opens.
6 Click Azure in the Review License Usage dialog box to review the current Azure license information.
The Azure license table shows the Account, Monitoring Agent, and Monitored Virtual Machine Count of your license.
7 Click the number in the Monitored Virtual Machine Count column.
The Virtual Machines dialog box opens and shows the detailed information about all monitored virtual machines.
If the number of monitored virtual machines goes beyond your valid license, the following message will shows on the Cloud Manager dashboard: “Caution: Foglight Hybrid Cloud Manager is over-deployed by <number> monitored virtual machines. Please contact Quest to purchase additional licenses.”
Agents related commandsThe Administration dashboard shows a list of existing agent instances and a set of agent management commands at the top of the list. Use it to verify that your agents are collecting data from the monitored environment.
The following commands are available:
• Add: Starts a workflow for creating new agent instances. For more information, see Creating Azure Performance Agent on page 11.
• Refresh: Refreshes the list of agent instances and their states.
• Activate: Activates one or more selected agent instances. Activating an agent instance starts the agent process on the machine on which the agent is installed.
• Deactivate: Deactivates one or more selected agent instances. Deactivating an agent stops the agent process on the machine on which the agent is installed.
• Start Data Collection: Starts the data collection for one or more selected agent instances. Starting an agent’s data collection causes the agent to begin monitoring the Azure accounts and to send the collected metrics back to the Management Server.
• Stop Data Collection: Stops the data collection for one or more selected agent instances. Stopping an agent’s data collection causes the agent to stop monitoring the Azure accounts.
• Edit Properties: Starts a workflow for editing the properties of one or more selected agent instances. Each agent comes with a set of properties that it uses to configure its correct running state. Editing agent properties on page 49.
• Remove: Deletes the selected agent instance.
• Update Agent: Updates the agent package to the latest version.
IMPORTANT: Updating the agent package using this command generates the previously existing credentials. However, if you update the agent package by re-deploying its .gar file through the Agent Status page, the credentials need to be re-created. To do that, select an agent instance, click Edit Properties, and configure the required credentials on the Credentials tab of the Edit Tab Manager dialog box.
Foglight Hybrid Cloud Manager for Azure 1.9.0 User and Administration GuideAdministration Tab
48
To perform any of the available commands, select one or more check boxes in the left-most column and click the appropriate button. For example, to start an agent’s data collection, select the check box in the agent row and click Start Data Collection.
Editing agent propertiesThe Azure Performance Agents collect data from your Azure infrastructure and sends it to the Management Server. The agents keep track of resource utilization metrics and alerts you when certain pre-defined thresholds are reached.
Default versions of these properties are installed with Foglight. However, you can edit the default shareable and agent properties, configure agent properties that apply only to a specific agent instance, and create edited clones of shareable properties that are used by a subset of agents of a certain type.
To edit the Azure Performance Agent properties:
1 Log in to the Foglight browser interface.
2 Ensure that the navigation panel is open.
To open the navigation panel, click the right-facing arrow on the left.
3 On the navigation panel, under Homes, click Cloud Manager.
The Cloud Manager dashboard opens.
4 Click Administration.
The Administration dashboard opens.
5 Select the instance of the Azure Performance Agent which properties that you want to modify, and then click Edit Properties.
6 In the Edit Properties dialog box, edit the properties as needed, and then click Save.
▪ Azure Environment*: The value of Azure Environment: Azure.com (default value) or Azure.cn (China).
▪ Tenant Directory ID *: The value of Tenant ID retrieved in Getting authentication information through Azure portal.
▪ Tenant Alias Name: The display name that identifies your Tenant.
▪ Application ID *: The value of Application ID retrieved in Getting authentication information through Azure portal.
▪ Access Key *: The value of Access Key retrieved in Getting authentication information through Azure portal.
▪ Select Resource Groups to be monitored: Specify to monitor all resource groups or only monitor specified resource group.
▫ If Monitor All is selected: By monitoring all Resource Groups or any Resource Group that is running on the monitored cloud which will be monitored 24x7 may consume licenses depending the number of virtual machines in the Resource Group.
▫ If Monitor All is not selected: The following view appears on the bottom of the Select Resource Groups to be monitored dialog box. Select virtual machines that you want to monitor, and then click >> to move selected Resource Groups to the Resource Groups Monitored by Foglight Hybrid Cloud Manager table.
Foglight Hybrid Cloud Manager for Azure 1.9.0 User and Administration GuideAdministration Tab
49

▫ If the Removed from Monitoring and Virtual Machines Monitored by Foglight Hybrid Cloud Manager tables are empty, and Monitor All is not selected, the Azure agent will not collect any Virtual Machine data.
▪ Select IaaS Virtual Machines to Monitor: Specify to monitor all virtual machines or only monitor specified virtual machine.
▫ If Monitor All is selected: By monitoring all virtual machines any virtual machine that is running in the monitored cloud will be monitored 24x7 consuming a monitored virtual machine license. Every virtual machine that is monitored will count against the purchased license pool. Any Monitored Virtual Machine that is above the purchased license limit will require an additional Foglight Hybrid Cloud Manager per Monitored Virtual Machine license.
▫ If Monitor All is not selected: The following view appears on the bottom of the Selected IaaS Virtual Machines to Monitor dialog box.
Foglight Hybrid Cloud Manager for Azure 1.9.0 User and Administration GuideAdministration Tab
50
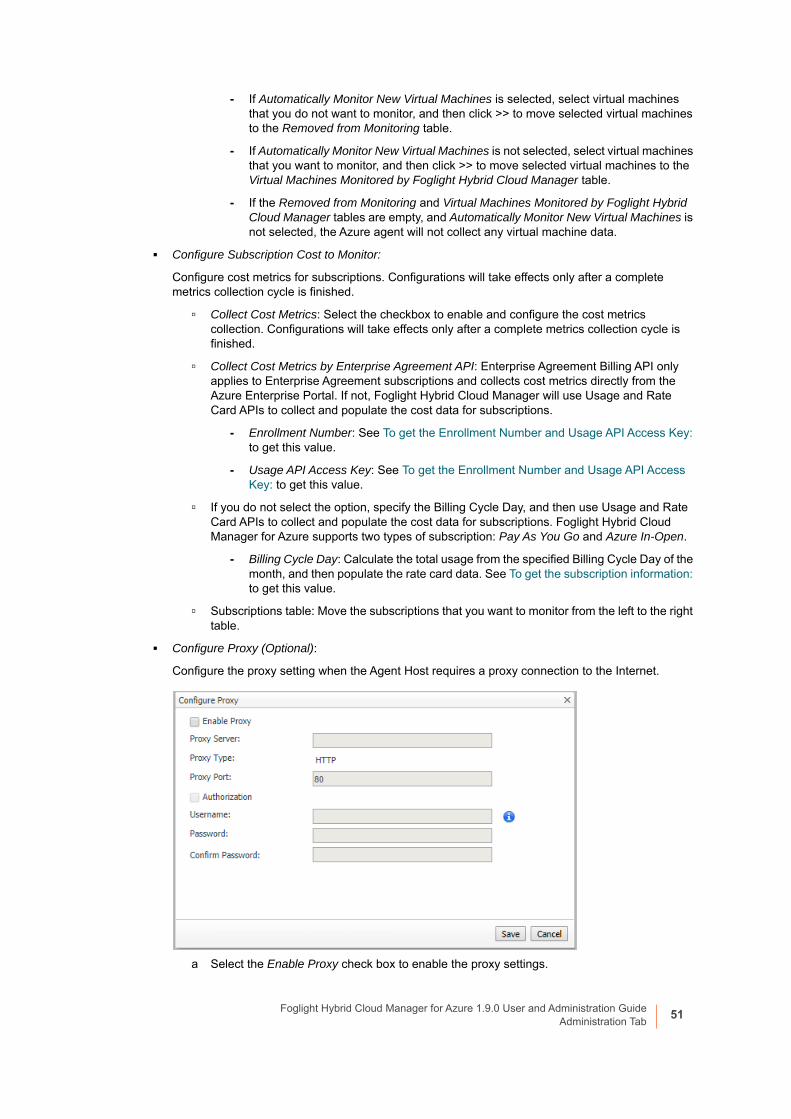
- If Automatically Monitor New Virtual Machines is selected, select virtual machines that you do not want to monitor, and then click >> to move selected virtual machines to the Removed from Monitoring table.
- If Automatically Monitor New Virtual Machines is not selected, select virtual machines that you want to monitor, and then click >> to move selected virtual machines to the Virtual Machines Monitored by Foglight Hybrid Cloud Manager table.
- If the Removed from Monitoring and Virtual Machines Monitored by Foglight Hybrid Cloud Manager tables are empty, and Automatically Monitor New Virtual Machines is not selected, the Azure agent will not collect any virtual machine data.
▪ Configure Subscription Cost to Monitor:
Configure cost metrics for subscriptions. Configurations will take effects only after a complete metrics collection cycle is finished.
▫ Collect Cost Metrics: Select the checkbox to enable and configure the cost metrics collection. Configurations will take effects only after a complete metrics collection cycle is finished.
▫ Collect Cost Metrics by Enterprise Agreement API: Enterprise Agreement Billing API only applies to Enterprise Agreement subscriptions and collects cost metrics directly from the Azure Enterprise Portal. If not, Foglight Hybrid Cloud Manager will use Usage and Rate Card APIs to collect and populate the cost data for subscriptions.
- Enrollment Number: See To get the Enrollment Number and Usage API Access Key: to get this value.
- Usage API Access Key: See To get the Enrollment Number and Usage API Access Key: to get this value.
▫ If you do not select the option, specify the Billing Cycle Day, and then use Usage and Rate Card APIs to collect and populate the cost data for subscriptions. Foglight Hybrid Cloud Manager for Azure supports two types of subscription: Pay As You Go and Azure In-Open.
- Billing Cycle Day: Calculate the total usage from the specified Billing Cycle Day of the month, and then populate the rate card data. See To get the subscription information: to get this value.
▫ Subscriptions table: Move the subscriptions that you want to monitor from the left to the right table.
▪ Configure Proxy (Optional):
Configure the proxy setting when the Agent Host requires a proxy connection to the Internet.
a Select the Enable Proxy check box to enable the proxy settings.
Foglight Hybrid Cloud Manager for Azure 1.9.0 User and Administration GuideAdministration Tab
51
b Input the host name or IP address for the Proxy Server and input the Proxy Port number.
c If the proxy requires an authorization, select the Authorization check box, and input the
Username and Password.
7 Click Save. The Edit Properties dialog box closes and the list of agent instances automatically refreshes in the display area.
Managing certificates
Syntax ConventionsIn order to successfully make use of the Foglight commands in your monitoring environment, review the syntax conventions before getting started. The syntax conventions are as follows:
• Generic examples follow the UNIX path structure that uses forward slashes '/' to separate directories.
• Platform-specific examples follow standard platform conventions. For example, UNIX-specific examples use forward slashes ‘/’ as directory delimiters, while Windows examples use backslashes ‘\’.
• <foglight_home> is a placeholder that represents the path to the Foglight Management Server installation.
• <foglight_agent_mgr_home> is a placeholder that represents the path to the Foglight Agent Manager installation. This can be the location of the Foglight Agent Manager installation on a monitored host, or the home directory of the Foglight Agent Manager that comes embedded with the Foglight Management Server. For example:
Path to the Foglight Agent Manager installation on a monitored host (Windows):
C:\Quest\Foglight_Agent_Manager
Path to the embedded Foglight Agent Manager installation (Windows):
C:\Quest\Foglight\fglam
• Unless otherwise specified, Foglight commands are case-sensitive.
Managing certificates for FglAMFoglight Evolve agents use Foglight Agent Manager (FglAM) to manage certificates for SSL encryption connection.
PrerequisiteAll the certificate-related command line options require that FglAM be up and running.
Add a certificatebin/fglam --add-certificate "user alias 1"=/path/to/certificate/file
• Validate the certificate and ensure the following:
▪ It is not expired.
NOTE: In FIPS-compliant mode, if proxy settings are configured, you need to import the proxy server application root certificate into FMS KeyStore and FgLAM. For more information, see Managing certificates.
Foglight Hybrid Cloud Manager for Azure 1.9.0 User and Administration GuideAdministration Tab
52

▪ It is an X.509 format.
▪ FglAM requires the Base64 format. To verify if the certificate file is encoded with Base64, open the certificate with a notepad and the certificate should be similar to the following example:-----BEGIN CERTIFICATE-----XXXXXXXX=-----END CERTIFICATE-----
• The alias is required and is used in the list and delete operations to refer to the certificate. It can be anything.
List installed certificatesbin/fglam --list-certificates
Print out a list of certificates and the aliases that refer to them.
Refer to the example output below:
List of installed certificates:
Alias Certificate Info
----- ----------------
user alias 1 XXXX
Delete a certificateRemove a certificate referred to by an alias.
bin/fglam --delete-certificate "user alias 1"
A full example for managing certificate for FglAM• Add an example certificate into FglAM certificate store
C:\Quest\Foglight\fglam\bin>fglam.exe --add-certificate "Evolve-test"="D:/Evolve-test.crt"
…
2020-02-27 16:31:01.000 INFO [native] Certificate added: Certificate from
D:\Evolve-test.crt added as Evolve-test
• List the example certificate in the FglAM certificate store
C:\Quest\Foglight\fglam\bin>fglam.exe --list-certificate
…
Alias Certificate
----- -----------
Evolve-test Issuer:
CN: XXX
• Delete the example certificate from the FglAM certificate store
NOTE: If the certificate is not Base64 format, use openssl command to convert the certificate file into a Base64 file. Use either of the following commands depending on the source form:openssl x509 -inform DER -in xxx.cer -out xxx.crtor openssl x509 -inform PEM -in xxx.cer -out xxx.crt
Foglight Hybrid Cloud Manager for Azure 1.9.0 User and Administration GuideAdministration Tab
53

C:\Quest\Foglight\fglam\bin>fglam.exe --delete-certificate "Evolve-test"
…
2020-02-27 16:28:21.000 INFO [native] Certificate deleted: Certificate
Evolve-test deleted
Managing certificates for FMS in FIPS-compliant modeUse the keytool utility shipped with Foglight to create, import, or export certificates. This utility can be found at: <foglight_home>\jre\bin\keytool.
The KeyStore Foglight used in FIPS-compliant mode is located at: <foglight_home>/config/security/trust.fips.keystore (default password: nitrogen)
Add a certificate in FIPS-compliant modeUse the keytool command in FMS JRE located in <foglight>/jre/bin.
keytool -import -trustcacerts -alias "<alias>" -file "<certificate path>" -keystore "<Foglight_home>/config/security/trust.fips.keystore" -deststoretype BCFKS -provider org.bouncycastle.jcajce.provider.BouncyCastleFipsProvider -providerpath "<Foglight_home>/server/core/bc-fips.jar" -storepass nitrogen
• Validate the certificate and ensure the following:
▪ It is not expired.
▪ It is an X.509 format.
• Change the following before executing the command
▪ <alias>: The alias is required and is used in the list and delete operations to refer to the certificate. It can be anything.
▪ <Foglight_home>: The folder path where Foglight is installed.
▪ <certificate path>: Your custom certificate path.
List installed certificateskeytool -list -keystore "<Foglight_home>/config/security/trust.fips.keystore" -deststoretype BCFKS -provider org.bouncycastle.jcajce.provider.BouncyCastleFipsProvider -providerpath "<Foglight_home>/server/core/bc-fips.jar" -storepass nitrogen
Prints out a list of certificates and the aliases that refer to them.
Refer to the example output below:
Keystore type: BCFKS
Keystore provider: BCFIPS
Your keystore contains 151 entries
camerfirmachambersignca [jdk], Dec 18, 2019, trustedCertEntry,
Certificate fingerprint (SHA1): 4A:BD:EE:EC:95:0D:35:9C:89:AE:C7:52:A1:2C:5B:29:F6:D6:AA:0C
entrust2048ca [jdk], Dec 18, 2019, trustedCertEntry
Foglight Hybrid Cloud Manager for Azure 1.9.0 User and Administration GuideAdministration Tab
54

…
Delete a certificateRemove a certificate referred to by an alias.
keytool -delete -alias <alias> -keystore "<Foglight_home>/config/security/trust.fips.keystore" -deststoretype BCFKS -provider org.bouncycastle.jcajce.provider.BouncyCastleFipsProvider -providerpath "<Foglight_home>/server/core/bc-fips.jar" -storepass nitrogen
A full example for managing certificate for FMS in FIPS-compliant mode
Add example certificate into FMS certificate store in FIPS-compliant mode
C:\Quest\Foglight\jre\bin>keytool -import -trustcacerts -alias "Evolve-Test" -file "D:/Evolve-test.crt" -keystore "C:/Quest/Foglight/config/security/trust.fips.keystore" -deststoretype BCFKS -provider org.bouncycastle.jcajce.provider.BouncyCastleFipsProvider -providerpath "C:/Quest/Foglight/server/core/bc-fips.jar" -storepass nitrogen
Owner: CN=CA, DC=ca, DC=local
Issuer: CN=CA, DC=ca, DC=local
Serial number: xxxx
Valid from: Sun Jan 06 23:07:06 CST 2019 until: Wed Apr 06 23:07:06 CST 2022
Certificate fingerprints:
...
Extensions:
...
Trust this certificate? [no]: yes
Certificate was added to keystore
Foglight Hybrid Cloud Manager for Azure 1.9.0 User and Administration GuideAdministration Tab
55

9
Optimizer Tab
Click Optimizer on the top of the Cloud Manager dashboard to navigate to the Optimizer tab.
Figure 28. Optimizer tab
To access the Optimizer tab:
1 Log in to the Foglight browser interface.
2 Ensure that the navigation panel is open.
To open the navigation panel, click the right-facing arrow on the left.
3 On the navigation panel, under Homes, click Cloud Manager.
The Cloud Manager dashboard opens.
4 Click Optimizer. The Optimizer tab opens on the bottom of Cloud Manager dashboard.
5 Click Azure. The Optimizer - Azure view opens.
The Optimizer - Azure view includes the following elements:
• Group selector: The group selector is located at the top of the Optimizer - Azure view and allows you to select the Azure environment that you want to optimize.
NOTE: If your FMS host doesn't have Internet connection, VM Resizing recommendations will not work properly. Ensure that the proxy is enabled and the settings are configured under Administration > Proxy Configuration.
Foglight Hybrid Cloud Manager for Azure 1.9.0 User and Administration GuideOptimizer Tab
56

• Recalculate. Click the button to recalculate the data. Click Recalculate on the Recalculate Confirmation dialog box to start recalculating.
• Total Potential Savings. Shows the potential savings per month. Click the savings and a Total Potential Savings dialog box opens. It displays the total resources and total savings for VM resizing, potential zombie VMs, and unused resources.
• Settings. The Settings dialog box is used to change the time period and properties that are used for calculation. For more information, see Settings on page 58.
• Scheduled Actions. The Scheduled Actions dialog shows the list of operations scheduled to be run at a particular time in the future, and allows you to edit or remove any scheduled actions. To view only the actions specific to Foglight Resource Optimizer, select the show only Optimizer actions checkbox. When the checkbox is not selected, the dialog shows all actions scheduled for your virtual environment.
• VM Resizing. Shows virtual machine name, utilization and recommendations for both CPU and memory resources.
• Potential Zombie VMs table. Shows virtual machine name, regions, CPU, memory, disk throughput, network, current month Billing, and last month billings of the zombie virtual machines based on calculation settings.
• Unused Resources table. Detects and shows those unused resources. For example, a virtual machine has been deleted, but its Disk/Network Interface/Public IP/Network Security Group/Storage Account are still remained in Azure.
• Reclaiming Savings bar. The Reclaiming Savings bar enables the system administrator to select instances from the list and review the resources that can be reclaimed.
▪ To reclaim the resources wasted for a selected instance, click Reclaim Now.
▪ To schedule reclaiming the resources wasted for a selected instance, click Reclaim Later.
• The Exclude button. Select an object from the Virtual Machine table and click Exclude. Then this object is
added to the list of excluded objects under a specific category.
NOTE: To use the Optimizer Reclaim actions, the minimum application privileges are required. For more information, see Minimum application privileges on page 7.
NOTE: The Reclaim Now and Reclaim Later buttons and the Exclude link are enabled only after selecting an instance from the table.
Foglight Hybrid Cloud Manager for Azure 1.9.0 User and Administration GuideOptimizer Tab
57

• The Show Excluded Items button. If you want to see the excluded objects, click Show Excluded Items. The Settings dialog box appears. For more information, see Settings on page 58.
• Change History view. The Change History embedded view shows the changes that have been implemented in the environment during the History Period [x] Day(s), the object that was affected, and the result of the operation.
To view the change history of all Optimizer tabs, select the show all Optimizer history checkbox. When the checkbox is not selected, the view shows only the change history for the selected Optimizer tab.
The number at the top of the view indicates the total number of changes executed for the selected VM component, during the History Period [x] Day(s).
▪ Target Name. Virtual machine that was affected by the change.
▪ Change. Type of change.
▪ Executed. Date and time when the change was executed.
▪ Created By. User who scheduled the change.
▪ Description. Operation result: Completed, In progress, or Failed (and an explanation why the job has failed).
SettingsUse the Settings menu to define the default optimization settings for your environment. The Settings Dialog box provides information about the following components:
• Configuration tab
• Waste tab
• Excluded tab
Foglight Hybrid Cloud Manager for Azure 1.9.0 User and Administration GuideOptimizer Tab
58

Configuration tab
The Configuration tab provides the recommended settings for CPU, memory, and storage optimization.
• Thresholds. Provides the values of a resource metric that define the Warning and Critical levels (for CPU, memory, and storage).
• Recommendation Calculation area. Allows you to define the following parameters for optimizing the CPU, memory resources in your environment, Storage resources not supported at current version:
▪ Reserve Margin [x]%. This parameter is used for calculating the Evaluation Result, which is needed for making recommendations. The Recommendation Reserve Margin percentage is the percentage above the recommended basis, reserved for unexpected increases in utilization.
▪ Acceptable Variation. This parameter is used for calculating the Evaluation Result, which is needed for making recommendations. The Acceptable Variation percentage is the minimum percentage deviation of the Evaluation Result from the current setting, which results in a recommendation. The Acceptable Variation value is the minimum difference between the Evaluation Result and the current setting, which results in a recommendation.
▪ Recommended Basis. Use this list to select the “Recommended Basis” to be used for calculating the Evaluation Result. Currently just support Average Utilization.
▪ Evaluate calculation over this period of time [x] Day(s). Defines the time interval during which the right-sizing calculation is performed.
▪ History Period [x] Day(s). The Change History view displays the changes for the time interval defined here.
To save any changes made to the Configuration settings, click Save at the bottom of the tab.
Foglight Hybrid Cloud Manager for Azure 1.9.0 User and Administration GuideOptimizer Tab
59

Waste tab
The Waste tab allows you to configure the settings for determining resources wasted in your environment. These include powered-off instances, and potential zombie VMs:
• Determine as a potential zombie if area: A VM is considered a zombie VM if the following five settings are met:
▪ Time period used for average calculation is [x] Days. Defines when a resource is considered a zombie VM, by looking at the period used for average calculations.
▪ Average Resource Utilization-Deviation. Defines when a resource is considered a zombie VM, by looking at the CPU, memory, disk throughput, and network utilization values.
To save any changes made to the Waste settings, click Save at the bottom of the tab.
TIP: Deviation is the maximum deviation from the average resource utilization that is allowed for a VM considered to be a zombie.
Foglight Hybrid Cloud Manager for Azure 1.9.0 User and Administration GuideOptimizer Tab
60

Excluded tab
The Excluded tab allows you to remove a VM from the list of excluded objects. The Excluded tab includes the following information:
• On the left side, a navigation tree, that allows you to select the VM component category.
• On the right side, the list of VMs excluded from the selected VM category.
To remove VMs from the list of Excluded objects, select the check boxes for these VMs and click Remove. To save any changes made to the Excluded settings, click Save at the bottom of the tab.
The Excluded tab can also be accesses by clicking Show Excluded Items on the Optimizer tab.
Foglight Hybrid Cloud Manager for Azure 1.9.0 User and Administration GuideOptimizer Tab
61
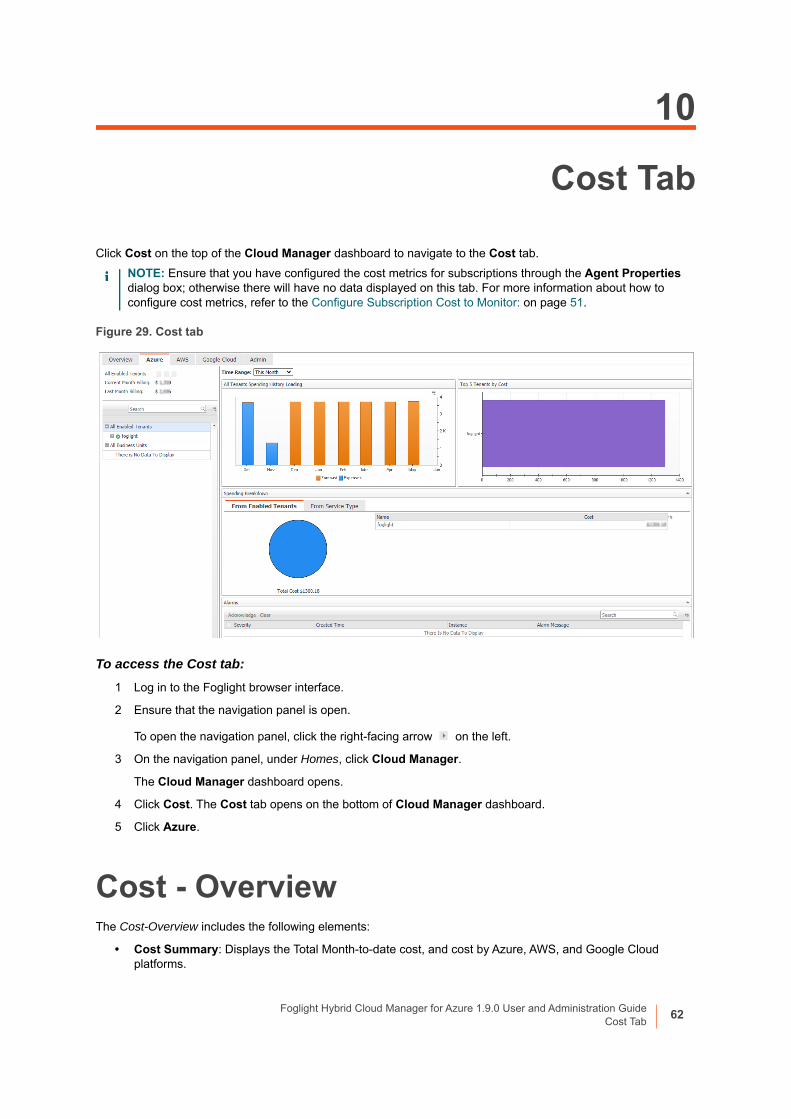
10
Cost Tab
Click Cost on the top of the Cloud Manager dashboard to navigate to the Cost tab.
Figure 29. Cost tab
To access the Cost tab:
1 Log in to the Foglight browser interface.
2 Ensure that the navigation panel is open.
To open the navigation panel, click the right-facing arrow on the left.
3 On the navigation panel, under Homes, click Cloud Manager.
The Cloud Manager dashboard opens.
4 Click Cost. The Cost tab opens on the bottom of Cloud Manager dashboard.
5 Click Azure.
Cost - OverviewThe Cost-Overview includes the following elements:
• Cost Summary: Displays the Total Month-to-date cost, and cost by Azure, AWS, and Google Cloud platforms.
NOTE: Ensure that you have configured the cost metrics for subscriptions through the Agent Properties dialog box; otherwise there will have no data displayed on this tab. For more information about how to configure cost metrics, refer to the Configure Subscription Cost to Monitor: on page 51.
Foglight Hybrid Cloud Manager for Azure 1.9.0 User and Administration GuideCost Tab
62

• Cost Overview: A stacked bar chart to display the Month-to-date Expenses and Forecast by Azure, AWS, and Google Cloud platforms.
• Infrastructure: Displays an Infrastructure resource table across clouds.
▪ Accounts Configured: The number of Azure subscription, AWS Accounts, or Google Cloud Billing Accounts.
▪ Total VMs: The total number of VMs running in the Cloud platform.
• Top 5 Business Units by Cost: Aggregates the total cost for Business Units after users assign the AWS accounts, Azure Subscriptions, or Google Cloud Billing Accounts to a BU under Cost > Admin.
• Cost Breakdown by Platforms: Displays the Month-to-date cost by Azure, AWS, and Google Cloud platforms.
Cost - Azure viewThe Cost - Azure view includes the following elements:
• Overview of all enabled Tenants cost: Lists the enabled tenants, billing of the current month, and billing of the last month.
• Object tree view: Lists the enabled tenants and business units.
• Time Range Selector: Lists the time range for billing. The time bar of the Management Server does not take effects on the Cost dashboard.
• All Enabled Tenants Spending History/Top 5 Tenants by cost/Spending Breakdown: These three views will display the relevant cost information if you select All Enabled Tenants or All Business Units from the object tree view.
• Tenant Spending History/Top 5 Subscriptions by Cost/Cost Breakdown By Service Type/Subscriptions: These four views will display the cost information of the selected tenant or business unit.
• Alarms: Lists all alarms against the selected tenant or business unit.
• Select a Target Tenant displays the cost overview and subscriptions cost for the selected Tenant.
• Select a Subscription displays the cost overview, virtual machines in subscription, resource group cost overview, and Resource cost overview.
Cost - Admin viewThe Cost - Admin view includes the following:
• Subscriptions tab: Displays the overview of all subscriptions, including the subscription name, tenant, business unit, spending, monthly budget, last month billing, current month billing, and next month projection.
▪ Set Monthly Budget: Update monthly budget for selected subscription.
▪ Assign Business Unit: Assign the select subscriptions to a Business Unit,
▪ Remove from Business Units: Exit the selected business units.
• Business Units tab: Lists business units name, location, organization, and subscriptions.
▪ Add Business Units: Create a business unit, specify Business Unit name, description, location, longitude, latitude, and assign to a new organization or existing organization.
▪ Delete Business Units: Delete selected business units.
NOTE: The Month-to-date (MTD) indicates a period starting from the beginning of the current month till the end of the current date.
Foglight Hybrid Cloud Manager for Azure 1.9.0 User and Administration GuideCost Tab
63

▪ Assign Organization: Select the organization from the list for selected business units.
Foglight Hybrid Cloud Manager for Azure 1.9.0 User and Administration GuideCost Tab
64

11
Policy Management Tab
Policy Management enables user to start or stop their resources by schedule. Currently, only the resource type of VM is supported.
Figure 30. Policy Management tab
To access the Policy Management tab:
1 Log in to the Foglight browser interface.
2 Ensure that the navigation panel is open.
To open the navigation panel, click the right-facing arrow on the left.
3 On the navigation panel, under Homes, click Cloud Manager.
The Cloud Manager dashboard opens.
4 Click Policy Management. The Policy Management tab opens on the bottom of Cloud Manager dashboard.
Policy viewThe Policy view includes the following elements:
• Total Potential Savings: Shows the total potential savings of this month under the policies. The potential savings are calculated by the total hours the VMs has been stopped by the policy multiply the unit price of each VM.
• Total resources under policy: Shows the total number of resources managed under the policies. For a detailed resource list, refer to Resource view on page 67.
• Alarms: Shows the number of alarms (multiple-severity rules only) generated by the policy. Clicking the numbers, an alarm list will be displayed. The list shows the severity of each alarm, when the alarm was generated, and the detailed alarm message.
• Execute Now: Click Execute Now to execute the selected policy immediately.
• Filters. Including by Schedule, by Resource Action (Start or Stop), and by Policy Status (Enable or Disable).
• Add Policy. Click Add Policy and an Add Policy dialog box appears. It includes the following elements:
NOTE: To use the Policy Management feature, a Foglight Evolve Cloud or Flex license is required. Contact Quest Support to purchase a license.
Foglight Hybrid Cloud Manager for Azure 1.9.0 User and Administration GuidePolicy Management Tab
65

▪ Policy Name: Specify a policy name.
▪ Description: Add descriptions about the policy.
▪ Enable: Select the checkbox to enable the policy.
▪ Action: Select an action for the policy. You can either start a VM or stop a VM.
▪ Schedule: Select a schedule. You can either assign the policy to a new schedule or assign the policy to an existing schedule.
▪ Apply Resources: Select the resources you would like to apply the policy. Click Apply Resources and a Select Resources dialog box appears.
Select Resources by types:
▫ Azure Virtual Machines: A tree table lists VMs by Resource Groups.
▫ AWS EC2 Instances: A Tree table lists Instances by Auto scaling group.
▫ Services: Lists the service from Dashboards > Services > Service Builder.
▪ Email Notification: Enter e-mail addresses to notify the users when the policy is executed.
▪ Process Service Dependencies: If applying resources by a service and the resources are collected by the same agent, the VMs under the child service will be executed first.
• A policy list table. The table includes the following elements:
▪ Edit: Click the icon and an Edit Policy dialog box appears. Update the policy and save the changes.
▪ Enable: Click the icon to enable a policy.
▪ Policy Name: Lists the name of the policy.
▪ Resource Action: Shows the action status of the policy, including start and stop.
▪ Schedule: Shows the schedule of the policy.
▪ Next Enforcement: Shows the time when the policy will be executed again.
▪ Last Status: Shows the last status after the policy was executed. Click the status and a Policy Executed History by Agent dialog box will appear.
NOTE: Only the enabled policies will be executed by schedule.
Foglight Hybrid Cloud Manager for Azure 1.9.0 User and Administration GuidePolicy Management Tab
66

▪ Apply Resources: Shows the selected resources by object type. Click the resources and an Apply VMs Detail Table will appear.
▪ Potential Saving: Shows the total potential savings of this month under the policy. The potential savings are calculated by the total hours the VMs stopped by the policy multiply the unit price of each VM.
Resource viewThe Resource view shows all the VMs which are managed by the polices. Users can add resources to polices or remove resources from polices.
Figure 31. Resource view
The Resource view includes the following elements:
• Filters. By Cloud Platform and by Policy.
• A resources table. Shows a list of resources managed by the policies. The table includes the following elements:
▪ Edit: Click the icon and an Edit VM dialog box will appear.
▪ Resource Name: Shows the name of the resource.
▪ Cloud Platform: Shows the cloud platform the resource belongs to.
▪ Policies: Shows the policy that manages the resource.
▪ Last Executed Time: Shows the last time when the policy was executed. Click the time and a Policy Executed History by VM dialog box will appear.
▪ Executed Status: Shows the last status after the policy was executed. Click the status and a Policy Executed History by VM dialog box will appear.
Foglight Hybrid Cloud Manager for Azure 1.9.0 User and Administration GuidePolicy Management Tab
67

▪ Power State: Shows the power status of the resource.
Schedule viewThe Schedule view enables users to create, edit, delete, or copy a schedule.
Figure 32. Schedule view
To create a new schedule, do either of the following:
• Click Add and a Create Schedule dialog box appears.
1 Occurrence: Select the start date and start time and click Next.
2 Recurrence: Select the recurrence and click Next.
a Specify the Recurrence Pattern according to the screen prompt. Click Next. For detailed information of the Recurrence Pattern, see Recurrence Pattern on page 69.
b Choose Never Stop or specify an End Time. Click Next.
3 Summary: Specify a name for the schedule and descriptions for the schedule. Click Finish.
• Click Copy and a Copy [Schedule name] dialog box appears. Edit the schedule name and description. Click OK.
The schedule list refreshes and the newly-created schedule will be displayed in the list.
To delete a schedule, do the following:
1 Select a schedule from the schedule list and click Delete.
2 A Delete Schedules Confirmation dialog box appears.
3 Click OK.
4 The schedule list refreshes and the schedule will be removed from the schedule list.
To edit a schedule, do the following:
1 Click the schedule you want to edit and an Edit Schedule dialog box appears.
Foglight Hybrid Cloud Manager for Azure 1.9.0 User and Administration GuidePolicy Management Tab
68

2 Click the schedule and an Edit Schedule Item dialog box appears.
3 Edit the Occurrence, Recurrence, and Summary if necessary and click Finish.
Recurrence Pattern
Table 37. Description of the Recurrence Pattern
Pattern Name
Pattern Description Pattern Settings
Once Starts at a specified date and time, for a specified duration, and ends at a defined end date and time.
N/A
Interval Starts at a specified time and date for a certain duration, repeats at specified time periods, with or without a defined end date and time.
Specify Every xx and select from Days, Hours, Minutes, or Seconds.
Daily Starts at a specified time and date, runs for a whole day or a fraction of a day, repeats at a regular interval of days, with or without a defined end date and time.
Specify Every xx days.
Weekly Starts at a specified time and date, runs for a whole day or a fraction of a day, repeats at a regular interval of weeks on one or more days of the week, with or without a defined end date and time.
Specify Every xx week (s) and select the weekdays.
Monthly Starts at a specified time and date, runs for a whole day or a fraction of a day, repeats at a regular interval of months on one or more days of the month, with or without a defined end date and time.
Select by Day or Week.
Specify Day xx of Every xx month(s).
Yearly Starts at a specified time and date, runs for a whole day or a fraction of a day, repeats at a regular interval of years on one or more days of the year, with or without a defined end date and time.
Select by Day of Month or Week of Month.
Specify the date and select the month.
IMPORTANT: Schedules consisting of multiple scheduled items must include a relevant start time. By default, the start time is the day the schedule is created. The start time of each schedule item must be specified to reflect the first run of the scheduled item.
Foglight Hybrid Cloud Manager for Azure 1.9.0 User and Administration GuidePolicy Management Tab
69

Policy Executed History viewThe Policy Executed History view shows the detailed history records of the executed policy by each Resource.
Figure 33. Policy Executed History view
Run Reports for Policy ManagementClick Reports on the top right corner of the interface and choose All Polices Execution Report. An All Polices Execution Report dialog box will appear. Fill in required information to run the report.
The All Polices Execution Report will summarize the status for all of the Policies Execution.
Figure 34. Run reports for Policy Management
Foglight Hybrid Cloud Manager for Azure 1.9.0 User and Administration GuidePolicy Management Tab
70

About Us
Quest creates software solutions that make the benefits of new technology real in an increasingly complex IT landscape. From database and systems management, to Active Directory and Office 365 management, and cyber security resilience, Quest helps customers solve their next IT challenge now. Around the globe, more than 130,000 companies and 95% of the Fortune 500 count on Quest to deliver proactive management and monitoring for the next enterprise initiative, find the next solution for complex Microsoft challenges and stay ahead of the next threat. Quest Software. Where next meets now. For more information, visit https://www.quest.com/.
Technical support resourcesTechnical support is available to Quest customers with a valid maintenance contract and customers who have trial versions. You can access the Quest Support Portal at https://support.quest.com.
The Support Portal provides self-help tools you can use to solve problems quickly and independently, 24 hours a day, 365 days a year. The Support Portal enables you to:
• Submit and manage a Service Request.
• View Knowledge Base articles.
• Sign up for product notifications.
• Download software and technical documentation.
• View how-to-videos.
• Engage in community discussions.
• Chat with support engineers online.
• View services to assist you with your product.
Foglight Hybrid Cloud Manager for Azure 1.9.0 User and Administration GuideAbout Us
71