use of software-defined radio receivers in two-way
TRANSCRIPT

685 Not subject to copyright in the USA. Contribution of NIST. © 2018 BIPM & IOP Publishing Ltd Printed in the UK
Metrologia
Use of software-defined radio receivers in two-way satellite time and frequency transfers for UTC computation
Zhiheng Jiang1, Victor Zhang2,18, Yi-Jiun Huang3, Joseph Achkar4, Dirk Piester5, Shinn-Yan Lin3, Wenjun Wu6, Andrey Naumov7, Sung-hoon Yang8, Jerzy Nawrocki9, Ilaria Sesia10, Christian Schlunegger11, Zhiqiang Yang12, Miho Fujieda13, Albin Czubla14, Hector Esteban15, Carsten Rieck16 and Peter Whibberley17
1 BIPM: Bureau International des Poids et Mesures, Sévres, France2 NIST: National Institute of Standards and Technology, 325 Broadway, Boulder, CO 80305, United States of America3 TL: National Standard Time and Frequency Laboratory, Telecommunication Laboratories, Chunghwa Telecom, Chung-Li, Chinese Taipei4 OP: LNE-SYRTE, Observatoire de Paris, Université PSL, CNRS, Sorbonne Université, 61 avenue de l’Observatoire 75014 Paris, France5 PTB: Physikalisch-Technische Bundesanstalt, Bundesallee 100, 38116 Braunschweig, Germany6 NTSC: National Time Service Center, Lintong, Xian, People’s Republic of China7 SU/VNIIFTRI: Main Metrological Center for State Service of Time and Frequency, FGUP VNIIFTRI, Mendeleevo, Moscow, Region, Russia8 KRISS: Korea Research Institute of Standards and Science, Daejeon, Republic of Korea9 AOS: Space Research Center, Astrogeodynamic Observatory, Borowiec, Poland10 IT/INRIM: Istituto Nazionale di Ricerca Metrologica, 10135 Turin, Italy11 CH/METAS: Federal Institute of Metrology METAS, Lindenweg 50, 3003 Bern-Wabern, Switzerland12 NIM: National institute of Metrology, 100029 Beijing, People’s Republic of China13 NICT: National Institute of Information and Communications Technology, Tokyo, Japan14 PL/GUM: Central Office of Measures, Warsaw, Poland15 ROA: Real Instituto y Observatorio de la Armada, San Fernando, Spain16 RISE/SP: Research Institutes of Sweden, Borås, Sweden17 NPL: National Physical Laboratory, Teddington, United Kingdom
E-mail: [email protected] and [email protected]
Received 2 April 2018, revised 29 May 2018Accepted for publication 12 June 2018Published 3 August 2018
AbstractTwo-way satellite time and frequency transfer (TWSTFT) is a primary technique for the generation of coordinated universal time (UTC). About 20 timing laboratories around the world continuously operate TWSTFT using satellite time and ranging equipment (SATRE19) modems for remote time and frequency comparisons in this context. The precision of the SATRE TWSTFT as observed today is limited by an apparent daily variation pattern (diurnal) in the TWSTFT results. The observed peak-to-peak variation have been found as high as 2 ns in some cases. Investigations into the origins of the diurnals have so far provided no complete understanding about the cause of the diurnals. One major contributor to the diurnals, however, could be related to properties of the receive part in the modem. In 2014 and 2015, it was demonstrated that bypassing the receive part and the use of software-defined radio (SDR)
Z Jiang et al
Printed in the UK
685
MTRGAU
Not subject to copyright in the USA. Contribution of NIST. © 2018 BIPM & IOP Publishing Ltd
55
Metrologia
MET
10.1088/1681-7575/aacbe6
Paper
5
685
698
Metrologia
IOP
Bureau International des Poids et Mesures
18 Author to whom any correspondence should be addressed.19 Disclaimer: Commercial products are identified for the sake of technical clarity. No endorsement by the authors or their institutes are implied. We further caution the readers that none of the described equipment’s apparent strengths or weaknesses may be characteristic of items currently marketed.
2018
1681-7575
1681-7575/18/050685+14$33.00
https://doi.org/10.1088/1681-7575/aacbe6Metrologia 55 (2018) 685–698

Z Jiang et al
686
receivers in TWSTFT ground stations (SDR TWSTFT) instead could considerably reduce both the diurnals and the measurement noise.
In 2016, the International Bureau of Weights and Measures (BIPM) and the Consultative Committee for Time and Frequency (CCTF) working group (WG) on TWSTFT launched a pilot study on the application of SDR receivers in the TWSTFT network for UTC computation.
The first results of the pilot study were reported to the CCTF WG on TWSTFT annual meeting in May 2017, demonstrating that SDR TWSTFT shows superior performance compared to that of SATRE TWSTFT for practically all links between participating stations. In particular, for continental TWSTFT links, in which the strongest diurnals appear, the use of SDR TWSTFT results in a significant suppression of the diurnals by a factor of between two and three. For the very long inter-continental links, e.g. the Europe-to-USA links where the diurnals are less pronounced, SDR TWSTFT achieved a smaller but still significant gain of 30%. These findings are supported by an evaluation of some of the links with an alternate technique based on GPS signals (GPS IPPP) as reported in this paper.
Stimulated by these results, the WG on TWSTFT prepared a recommendation for the 21st CCTF meeting, which proposed the introduction of SDR TWSTFT in UTC generation. With CCTF approval of the recommendation, a roadmap was developed for the implementation of SDR TWSTFT in UTC generation. In accordance with the roadmap, most of the stations that participated in the pilot study have updated the SDR TWSTFT settings to facilitate the use of SDR TWSTFT data in UTC generation. In addition, the BIPM conducted a final evaluation to validate the long-term stability of SDR TWSTFT links, made test runs using the BIPM standard software for the calculation of UTC, now including SDR TWSTFT data, and started to calculate SDR TWSTFT time links as backup from October 2017. The use of SDR TWSTFT in UTC generation will begin in 2018.
Keywords: UTC, TWSTFT, SDR, diurnal, uncertainty, time transfer
(Some figures may appear in colour only in the online journal)
List of acronyms and specific terms
1 PPS 1 pulse per second timing signalA/D Analog to digitalBIPM, NIST, TL, OP/LNE-SYRTE, PTB, NTSC, SU/VNIIFTRI, KRISS/KRIS, AOS, IT/INRIM, CH/METAS, NIM, NICT, PL/GUM, ROA, RISE/SP, NPL
Acronyms of the UTC laboratories, see the authorship for their full names
BPSK Binary phase-shift keyingCALR Calibration result value of station
delays for a two-way link, defined in the recommendation ITU-R TF.1153-4
CCTF Consultative committee for time and frequency
CI Calibration identifier as defined in the recommendation ITU-R TF.1153-4
DCD Double clock difference, the difference between two time links which are connected to the same clocks at both ends
DCD′ DCD after removing a linear tendency; note that a non-zero slope indicates weakness of at least one part of the equipment involved
Diurnal A daily variation pattern apparent in the TWSTFT results, dominant uncertainty source in SATRE TWSTFT
ESDVAR Earth station delay variation with respect to the earth station delay presented at the time of a calibra-tion, defined in the recommendation ITU-R TF.1153-4
Gain factor or gain Ratio of σ(A)/σ(B) or σx(A)/σx(B).If gain ⩽ 1, there is no improvement. Statistically, if gain ⩾ 1.10, the im-provement is considered as significant.
GPS PPP or PPP for short GPS carrier-phase precise point positioning solution for time and frequency transfer
GPS IPPP or IPPP for short GPS carrier-phase integer ambiguity PPP solution for time and frequency transfer
GPU Graphic processing unitIF Intermediate frequency at 70 MHz
for TWSTFTIGST International global navigation
satellite system (GNSS) service timeITU-R TF International telecommunication
union radiocommunication sector, time signals and frequency standards emissions series
Ku-band Frequency band (10.7 GHz–14.5 GHz) used for space radiocommunications
MJD Modified Julian datePRN Pseudorandom noiseREFDELAY Delay of the modem time reference
with respect to UTC(k), defined in the recommendation ITU-R TF.1153-4
Metrologia 55 (2018) 685

Z Jiang et al
687
1. Introduction
Two-way satellite time and frequency transfer (TWSTFT) is a primary technique for the realization of coordinated universal time (UTC) [1, 2, 6]. Since 2003 TWSTFT data provided by the international timing community have been used in this context. TWSTFT is carried out by transmission of pseudo-random noise (PRN) signals modulated via binary phase-shift keying (BPSK) onto the carrier signal in Ku-band. The phase modulation is synchronized with the local clock’s 1 PPS output. Each station uses a dedicated PRN code for its BPSK sequence in the transmitted signal. In the receive part of the modem, the BPSK sequence of the remote station is generated and correlated with the received signal. As a result, the time-of-arrival of the received signal is obtained with respect to the local clock. All TWSTFT stations involved in the current study have been equipped with SATRE modems. Diurnal vari-ations in TWSTFT results have been observed in many links with varying amplitudes and several causes could potentially contribute to their existence. They are the dominant source of time transfer uncertainty, with peak-to-peak amplitudes of up to 2 ns in the case of the widely used BPSK modulations of 1 MChip/s.
A software-defined radio (SDR) receiver can operate in parallel with a SATRE modem, and data generated that way are free from the effects of processing in the SATRE receive part. In each station the transmission signal is generated by the SATRE modem and the down-converted received signal is split and fed to both the SDR setup and SATRE modem. The key components of the SDR consist of an analog to digital (A/D) sampler recording the received PRN signal at the 70 MHz intermediate frequency (IF), and a graphic processing unit (GPU) card installed in a computer for processing the TWSTFT measurements with dedicated software developed by TL [3, 4]. In addition, one or two amplifiers and a band-pass filter are used to optimize the input signal to the A/D sampler. The arrival time of the signal is thus determined by the SATRE modem and SDR receiver independently [3, 4], as illustrated in figure 1. With the application of SDR receivers
in TWSTFT, a significant reduction of the diurnals and the measurement noise in Asian TWSTFT links was observed. Based on the encouraging results and a first validation of the method by the International Bureau of Weights and Measures (BIPM), the BIPM and the Consultative Committee for Time and Frequency (CCTF) Working Group (WG) on TWSTFT launched a pilot study in February 2016. Its goal was to investigate the improvements to be gained from using SDR TWSTFT in Asia-to-Asia, Asia-to-Europe, Europe-to-Europe and Europe-to-USA links with different satellites, linking a number of laboratories as illustrated in figure 2.
The following 16 timing laboratories have installed SDR receivers and have participated in routine SDR TWSTFT measurements: TL, NICT, KRISS (KRIS), NTSC and NIM in Asia; PTB, OP, VNIIFTRI (SU), INRIM (IT), METAS (CH), AOS, PL (GUM), RISE (SP), ROA and NPL in Europe; and NIST in the USA. The characters in brackets represent the designation of their time scales (e.g. UTC(SU)). In the pilot study, Ku-band transponders on three satellites were used. The Asia-to-Asia links used 2.5 MHz bandwidth on the Eutelsat 172A (E172A) satellite20 until November 2017. The E172A was then replaced by the Eutelsat 172B (E172B) satel-lite21. The Asia-to-Europe links used 2.5 MHz bandwidth on the Express AM22 satellite22 until June 2017, and spectrally filtered signals with a 2.5 MChip/s BPSK were transmitted. The Europe-to-Europe and the Europe-to-USA links use 1.7 MHz and 1.6 MHz bandwidths, respectively, on the Telstar 11N (T-11N) satellite23, and thus a smaller modulation rate of only 1 MChip/s can be used. The Europe-to-USA links are through two different transponders whereas one transponder handles the Europe-to-Europe links. The successor to the AM22 satellite has been selected as the ABS-2A satellite24 and some of the Asia-to-Europe TWSTFT links have been reinstalled in March 2018, but no data are available at the time of the writing.
Continental (within Asia and Europe) and also transconti-nental (Asia-to-Europe, Europe-to-USA) SDR time links have been established. Thus, this pilot study has a global coverage involving laboratories from countries around the world. SDR TWSTFT proved to provide superior or at least similar per-formance compared to that of the SATRE TWSTFT for all links [7, 8]. In the case of the continental links, such as those within Europe where the strongest diurnals are present, the magnitude of the diurnals in SDR TWSTFT was reduced by a factor of two to three. For the very long inter-continental links, such as the transatlantic links where the diurnals’ impact is less, SDR TWSTFT displays a smaller gain of only 30%, but it is still significant.
Based on these findings, the CCTF WG on TWSTFT pre-pared a recommendation ‘On improving the uncertainty of two-way satellite time and frequency transfer (TWSTFT) for UTC generation’ [5] for the 21st CCTF meeting held on
20 See footnote 19.21 See footnote 19.22 See footnote 19.23 See footnote 19.24 See footnote 19.
SATRE Satellite time and ranging equipment, brand name of a modem developed by Time Tech GmbH, Stuttgart, Germany
SATRE TWSTFT, SATRE link or SATRE for short
TWSTFT using the satellite time and ranging equipment (modems)
SDR TWSTFT, SDR link or SDR for short
TWSTFT with data from software-defined radio receivers
Slope affecting factor σ(DCD′)/σ(DCD)TWSTFT or TW for short Two-way satellite time and
frequency transferUTC Coordinated universal timeWG on TWSTFT CCTF working group on TWSTFTσ(A) Standard deviation of a time series Aσx(A) or TDev(A) Time deviation of a time series A
(see e.g. requirement ITU-R TF.538, or NIST Special Publication 1065 (2008): handbook of frequency stability analysis)
Metrologia 55 (2018) 685

Z Jiang et al
688
9–10 June 2017 at the BIPM, where the recommendation was approved. Thereafter, the process of implementing SDR TWSTFT into UTC generation was started. Setup changes are necessary to install SDR receivers into operational TWSTFT ground stations. Furthermore, the data computation, e.g. for calibrated time transfer, requires caution during data pro-cessing based on standard procedures, which is not trivial. An ad hoc group was therefore established in May 2017 to develop a roadmap for the coordinated operation and schedule needed to implement the use of SDR TWSTFT in UTC. Its attention was focused on the practical issues including verifi-cation of the SDR hardware setup, the software performance in the participating laboratories, a standard data format and submission procedure, the software package for Circular T computation at the BIPM, and the attainable uncertainty based on a final evaluation using the most recent continuous data collected over six months.
In this paper, we report the state-of-the-art of the SDR TWSTFT method and the main results of the final evalua-tion. We compare SDR TWSTFT with the recently introduced integer ambiguity solution for GPS precise point positioning,
IPPP [12], which is considered as an alternative high-accuracy method for frequency and time comparisons, and represents a further development of the ‘conventional’ PPP. The use of IPPP solutions is preferred for comparisons with GPS links. In fact, the phase ambiguities of GPS carrier signals are physi-cally integer number of cycles, which are taken into account in the IPPP technique, while the standard PPP solves the ambi-guities as real values. The associated error in PPP solutions may be summed up as a random walk instability for reason-able averaging times. The IPPP method may eliminate this bias. It is generally accepted that IPPP is diurnal free and the most precise of the presently available GPS comparison tech-niques. IPPP data are, however, not yet produced on a regular basis. We use IPPP when possible in the discussions below, and only use PPP solutions when it is not available.
We first discuss the key issues of the pilot study, such as the methods used in the BIPM evaluations, calibration of SDR TWSTFT links, and the attainable uncertainty, in sec-tion 2 of this paper. Section 3 provides the evaluation results based on the monthly SDR TWSTFT data sets. The evaluation results of SDR TWSTFT long-term stability are presented in
Figure 1. Illustration of the main signal paths of a TWSTFT link based on the combination of SATRE modems with SDR receivers for comparison of two separated time scales UTC(1) and UTC(2).
Figure 2. Participating stations in the SDR pilot study (status of March 2018). The links/circle in blue are for the Europe-to-Europe and Europe-to-USA SDR TWSTFT. The laboratories circled in red are for the Asia-to-Europe SDR TWSTFT. Until June 2017, the AM22 satellite was used in place of the ABS-2A satellite. The laboratories in the black circle are for the Asia-to-Asia SDR TWSTFT. In November 2017, the E172B satellite replaced the E172A satellite.
Metrologia 55 (2018) 685

Z Jiang et al
689
section 4. Finally, we summarize the study of the use of SDR TWSTFT in UTC generation in section 5.
2. Key issues in the SDR pilot study
2.1. Methods of validation and evaluation
The validation and evaluation of SDR TWSTFT are based on analysing the differences of time links operated in parallel between two clocks. In this way, the properties of the clocks do not matter. The analysis of so-called double clock differ-ences (DCD) have been made over selected baselines between (a) the SATRE and the SDR links, and (b) the SATRE and/or SDR TWSTFT against GPS PPP and/or GPS IPPP time transfer links. Examples of time links used in the calculation of UTC are also presented.
The validation and evaluation employs the following sta-tistical measurands:
– The σx of time links, the σ(DCD) and the σx(DCD); – The following four indicators of the assessment of the
quality and the level of the improvement:
1. σx for evaluation of the time link instabilities at dif-ferent averaging times (τ)
2. σ (DCD) and σ (DCD′) for revealing the agreement of SDR TWSTFT with SATRE TWSTFT, GPS PPP, and GPS IPPP
3. Deviation from zero and σ of triangle closures for indication of systematic offsets and noise level of the links
4. σ of discrepancies between SATRE TWSTFT, SDR TWSTFT and GPS PPP for the long-term stability
– Gain factors: the ratios of σ(SATRE)/σ(SDR) and σx(SATRE)/σx(SDR).
The majority of the data used are monthly and long-term data sets. The monthly data is the basis of the BIPM Circular T com-putation whereas the latter is employed for a long-term stability analysis. Long-term stability of time transfer techniques is a very important characteristic for their application in the production of UTC. The data were collected mainly in 2016 and 2017. In par-ticular, the latest data sets investigated in this work are from the six months period between July and December 2017.
2.2. Setup of SDR TWSTFT and data processing
The SDR receivers were installed in 16 TWSTFT laboratories by the end of October 2017. Most of them have gathered more
than one year of data. Unfortunately, the Asia-to-Europe links are currently interrupted due to a change of satellite.
The SATRE TWSTFT data are reported in the format defined in the Recommendation ITU-R TF.1153-4 [6] (ITU for short). Following the roadmap, it was decided to adopt the same file name and format for reporting the SDR TWSTFT data in UTC computation as those already in use for SATRE measurements. A comment line in the file header and the SDR identifier are used to indicate the SDR measurements. The parameters of CALR, ESDVAR, REFDELAY etc are suitably adapted. For the SDR TWSTFT data, the session length of a single measurement recording is 300 s. The measurement process is carried out automatically by the SDR software obs2ITU, release V2018.1, developed and distributed by TL to all participants. It records measurements and the corre-sponding parameters and identifiers in the data file. The BIPM UTC computation software, Tsoft, can recognise the SATRE and SDR TWSTFT data and perform the time transfer compu-tation and all other operations required to publish the results on the BIPM website with the standard procedure. More details can be found in [8].
2.3. Calibration of SDR TWSTFT links
The use of SDR TWSTFT links in UTC generation requires that the signal delays in the ground stations have been deter-mined. According to the TWSTFT calibration guidelines [2], a SDR link calibration can be made using a ‘two-step procedure’:
1. For UTC links:
(a) if the SATRE link is calibrated, the SDR link should be aligned to it by using the same CALR and to deter-mine the corresponding ESDVAR value. In this case, the calibration identifier (CI) of the SDR link is the same as that of the SATRE link;
(b) if the SATRE link is not calibrated, both of the SATRE and the SDR links should be calibrated together by using a TWSTFT mobile station or a GPS calibrator with the ‘link’ method [2].
2. The non-UTC link delay should be calibrated by the triangle closure calibration (TCC) method [2].
In the final evaluation and also in the UTC backup compu-tation, the SDR links are calibrated with respect to the related SATRE links using the data set from September 2017. Table 1 lists the SDR calibration corrections for the UTC links in Europe, from USA and the TL-KRIS link in Asia that were
Table 1. The SDR link calibration corrections.
Link Correction (ns) N-point σ (ns) CI of SATRE link Data set used (yymm)
AOS-PTB −54.449 329 0.659 449 1709CH-PTB −128.909 356 0.454 284 1709IT-PTB −188.926 376 0.519 434 1709NIST-PTB −113.862 245 0.108 393 1709OP-PTB 2263.247 305 0.428 437 1709TL-KRIS −2441.649 4101 0.241 GPS PPP 1710
Metrologia 55 (2018) 685

Z Jiang et al
690
calibrated using the PPP link. For example, the calibrated AOS-PTB SDR TWSTFT link results are achieved by sub-tracting 54.449 ns from the raw SDR solutions. The column ‘N-Point’ contains the number of points used in the calibration computations. Here, and in the following discussion, yymm stands for year and month.
2.4. Uncertainty
We define the conventional uncertainties uA and uB, which are values assigned and used in BIPM Circular T and which are usually substantially higher than the estimated uncertainties in order to allow the use of a general value for all links of the same kind.
For the UTC SATRE links, the conventional value of uA is 0.5 ns, and uB is 1.0 ns (when using a TWSTFT mobile station for calibration) or 1.5 ns (with a GPS calibrator). These values are assigned to the time scale differences UTC-UTC(k). They are derived from a detailed report on the link data and reported in section 5 of BIPM Circular T [1].
We assign the corresponding values of uA = 0.2 ns and uB = 1.0 ns or 1.5 ns, respectively, for SDR links. In fact, as reported in [7, 8] and concluded in this paper, for short baselines, such as OP-PTB, a gain factor of two or three is obtained in the stabilities of SDR TWSTFT compared with SATRE TWSTFT. For long baselines, such as NIST-PTB
which has a much smaller diurnal than most of the other links (e.g. OP-PTB), the stability of the SATRE link is already below 0.2 ns; see [8] and the discussion in the section below. We consider that for uB, the same conventional value is valid for both the SATRE and the SDR links because, as mentioned above, the conventional uB of the SATRE link is always higher than the estimated one, and an additional uncertainty comp-onent for transferring a calibration to the SDR equipment will not increase the uncertainty significantly. The conventional value of uB for the SDR TCC calibration is 2.0 ns, the same as when using SATRE data [1, 2]. The uB of SDR links may be improved if a direct SDR link calibration using a mobile sta-tion equipped with the SDR receiver is performed. This study is ongoing.
Figure 3. The SDR and the SATRE links and the corresponding TDev over the baseline of OP-PTB via satellite T-11N.
Table 2. Gain factor in TDev at different averaging times for the OP-PTB SDR versus SATRE links.
Average time (1)
σx(SATRE) (ps) (2)
σx(SDR) (ps) (3) Gain = (2)/(3)
2 h 307 94 3.34 h 398 99 4.08 h 322 62 5.216 h 171 44 3.932 h 100 48 2.1Mean 3.7
Metrologia 55 (2018) 685

Z Jiang et al
691
3. TWSTFT monthly data analysis and comparisons
UTC is computed and published monthly. The monthly data set is therefore taken as the base for this analysis of the SDR TWSTFT evaluation. We use the SATRE TWSTFT, SDR TWSTFT, GPS PPP, and IPPP data types and the validation methods given in section 2.1. We will discuss the gain factors of SDR TWSTFT versus the SATRE TWSTFT through the following numerical examples. All time scales involved in the study, and in particular those referred to in the examples are realized based on signals from active hydrogen masers, with different strategies for steering towards UTC.
3.1. Comparison between SATRE and SDR time links
Figure 3 plots both the SATRE and the SDR links for the clock comparison of [UTC(OP)-UTC(PTB)] during a 100 d period between MJDs 57630 and 57730 (UTC data sets: 1609–1611) with 1151 TWSTFT results in total. The OP-PTB SATRE TWSTFT is a Europe-to-Europe UTC link. We observe on the upper part of the figure that the SATRE TWSTFT is very noisy. However, the enlarged plot shows that the scatter is not white noise but dominated by diurnals of 2 ns peak-to-peak. In the SDR link the diurnal variations are no longer evident and the peak-to-peak variation become less than 0.4 ns. This is confirmed by the TDev plot shown in figure 3.
By virtue of the technique involved, SDR TWSTFT can bring an improvement in TDev only up to averaging times of the order of 1 d. After that, the properties of the time scales involved contribute significantly to the TDev value. We see in figure 3 that at an averaging time of >64 h the two curves start to coincide. Table 2 gives the gain in TDev at different aver-aging times from 2 h to 32 h. The TDev at 2 h averaging time is 307 ps for SATRE TWSTFT and 94 ps for SDR TWSTFT, representing an improvement in the short-term stability by a gain factor of 3.3. The maximum and minimum gains are 5.2 and 2.1 for eight and 32 h, respectively. The mean gain for dif-ferent averaging times is 3.7.
The AOS-PTB SATRE TWSTFT is also a Europe-to-Europe UTC link. In figure 4, we compare the AOS-PTB SATRE and the SDR TWSTFT links between MJDs 57785 and 57815 (UTC data set 1702). The diurnal in the SATRE link is clearly shown by the two ns or even larger peak-to-peak variations. As seen in the figure, the diurnals have almost disappeared in the SDR TWSTFT difference. There are some disturbances in the SDR results in the first half of the data set
between MJDs 57785 and 57800; the cause is unknown. As shown in table 3, the mean gain factor in TDev is 2.9.
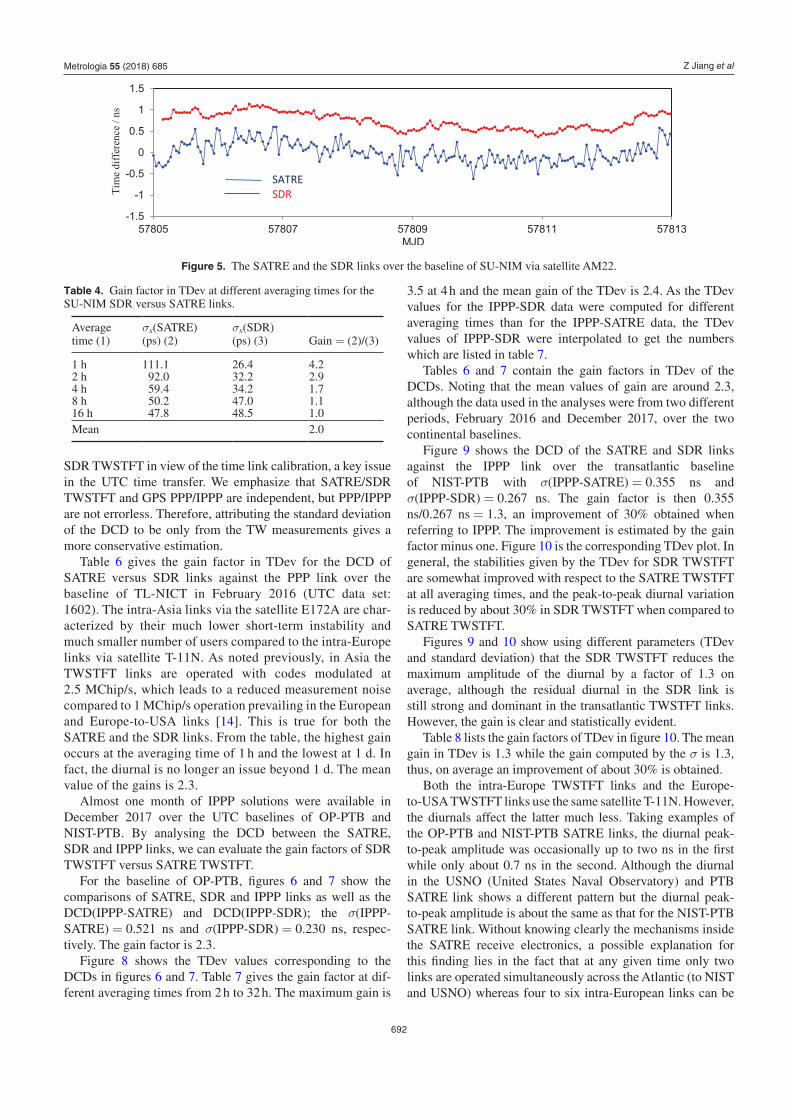
The SU-NIM SATRE TWSTFT link is a long-distance Europe-to-Asia link between SU in Russia and NIM in China via the satellite AM22. Figure 5 shows a comparison of the SDR and SATRE TWSTFT (for an 8 d segment of UTC data set 1702). The gain of SDR TWSTFT over SATRE TWSTFT is clearly significant for the SU-NIM baseline. As shown in table 4, gain factors have been calculated for the available averaging times up to 16 h although there are indications that the two time scales involved are less stable than those in the previous examples. A mean gain factor in TDev of 2.0 is computed.
Table 5 contains a few more comparisons between SATRE and SDR links for the Asia-to-Asia, Asia-to-Europe, Europe-to-Europe and Europe-to-USA baselines. The comparisons are presented with TDev at averaging times of 2 h and 12 h. The TDevs are computed from the monthly data sets.
3.2. Comparison between SATRE/SDR links and the PPP/IPPP links
Unlike the examples in section 3.1 where the TWSTFT links are compared, we now use the GPS IPPP or PPP as reference in DCD calculations to compare SATRE and SDR links over the baselines of TL-NICT in Asia, OP-PTB in Europe, and NIST-PTB across the Atlantic.
Being independent of TWSTFT, the GPS PPP or IPPP solu-tions are able to validate the improvement of SDR TWSTFT. The GPS solutions’ statistical uncertainty is small (uA ⩽ 0.3 ns [1]) and it is almost unaffected by diurnal variations. When we make a choice between SATRE and SDR links using a GPS solution as the reference, the TWSTFT link whose statis-tical uncertainty is closer to that of the GPS is considered the better one. Comparing TWSTFT to GPS also allows for the invest igation of the short-term and long-term instabilities of
Figure 4. The SATRE and the SDR links over the baseline of AOS-PTB via satellite T-11N.
Table 3. Gain factor in TDev at different averaging times for the AOS-PTB SDR versus SATRE links.
Average time (1)
σx(SATRE) (ps) (2)
σx(SDR) (ps) (3) Gain = (2)/(3)
2 h 422.6 181.6 2.34 h 537.2 147.3 3.78 h 955.2 165.0 5.816 h 523.8 153.2 3.432 h 376.3 207.5 1.8Mean 2.9
Metrologia 55 (2018) 685
Z Jiang et al
692
SDR TWSTFT in view of the time link calibration, a key issue in the UTC time transfer. We emphasize that SATRE/SDR TWSTFT and GPS PPP/IPPP are independent, but PPP/IPPP are not errorless. Therefore, attributing the standard deviation of the DCD to be only from the TW measurements gives a more conservative estimation.
Table 6 gives the gain factor in TDev for the DCD of SATRE versus SDR links against the PPP link over the baseline of TL-NICT in February 2016 (UTC data set: 1602). The intra-Asia links via the satellite E172A are char-acterized by their much lower short-term instability and much smaller number of users compared to the intra-Europe links via satellite T-11N. As noted previously, in Asia the TWSTFT links are operated with codes modulated at 2.5 MChip/s, which leads to a reduced measurement noise compared to 1 MChip/s operation prevailing in the European and Europe-to-USA links [14]. This is true for both the SATRE and the SDR links. From the table, the highest gain occurs at the averaging time of 1 h and the lowest at 1 d. In fact, the diurnal is no longer an issue beyond 1 d. The mean value of the gains is 2.3.
Almost one month of IPPP solutions were available in December 2017 over the UTC baselines of OP-PTB and NIST-PTB. By analysing the DCD between the SATRE, SDR and IPPP links, we can evaluate the gain factors of SDR TWSTFT versus SATRE TWSTFT.
For the baseline of OP-PTB, figures 6 and 7 show the comparisons of SATRE, SDR and IPPP links as well as the DCD(IPPP-SATRE) and DCD(IPPP-SDR); the σ(IPPP-SATRE) = 0.521 ns and σ(IPPP-SDR) = 0.230 ns, respec-tively. The gain factor is 2.3.
Figure 8 shows the TDev values corresponding to the DCDs in figures 6 and 7. Table 7 gives the gain factor at dif-ferent averaging times from 2 h to 32 h. The maximum gain is
3.5 at 4 h and the mean gain of the TDev is 2.4. As the TDev values for the IPPP-SDR data were computed for different averaging times than for the IPPP-SATRE data, the TDev values of IPPP-SDR were interpolated to get the numbers which are listed in table 7.
Tables 6 and 7 contain the gain factors in TDev of the DCDs. Noting that the mean values of gain are around 2.3, although the data used in the analyses were from two different periods, February 2016 and December 2017, over the two continental baselines.
Figure 9 shows the DCD of the SATRE and SDR links against the IPPP link over the transatlantic baseline of NIST-PTB with σ(IPPP-SATRE) = 0.355 ns and σ(IPPP-SDR) = 0.267 ns. The gain factor is then 0.355 ns/0.267 ns = 1.3, an improvement of 30% obtained when referring to IPPP. The improvement is estimated by the gain factor minus one. Figure 10 is the corresponding TDev plot. In general, the stabilities given by the TDev for SDR TWSTFT are somewhat improved with respect to the SATRE TWSTFT at all averaging times, and the peak-to-peak diurnal variation is reduced by about 30% in SDR TWSTFT when compared to SATRE TWSTFT.
Figures 9 and 10 show using different parameters (TDev and standard deviation) that the SDR TWSTFT reduces the maximum amplitude of the diurnal by a factor of 1.3 on average, although the residual diurnal in the SDR link is still strong and dominant in the transatlantic TWSTFT links. However, the gain is clear and statistically evident.
Table 8 lists the gain factors of TDev in figure 10. The mean gain in TDev is 1.3 while the gain computed by the σ is 1.3, thus, on average an improvement of about 30% is obtained.
Both the intra-Europe TWSTFT links and the Europe-to-USA TWSTFT links use the same satellite T-11N. However, the diurnals affect the latter much less. Taking examples of the OP-PTB and NIST-PTB SATRE links, the diurnal peak-to-peak amplitude was occasionally up to two ns in the first while only about 0.7 ns in the second. Although the diurnal in the USNO (United States Naval Observatory) and PTB SATRE link shows a different pattern but the diurnal peak-to-peak amplitude is about the same as that for the NIST-PTB SATRE link. Without knowing clearly the mechanisms inside the SATRE receive electronics, a possible explanation for this finding lies in the fact that at any given time only two links are operated simultaneously across the Atlantic (to NIST and USNO) whereas four to six intra-European links can be
Figure 5. The SATRE and the SDR links over the baseline of SU-NIM via satellite AM22.
Table 4. Gain factor in TDev at different averaging times for the SU-NIM SDR versus SATRE links.
Average time (1)
σx(SATRE) (ps) (2)
σx(SDR) (ps) (3) Gain = (2)/(3)
1 h 111.1 26.4 4.22 h 92.0 32.2 2.94 h 59.4 34.2 1.78 h 50.2 47.0 1.116 h 47.8 48.5 1.0Mean 2.0
Metrologia 55 (2018) 685

Z Jiang et al
693
active at a given time. The simultaneous reception of eight to twelve modulated signals, even with a priori orthogonal PRN codes, might challenge the correlation electronics of the SATRE modem. Regarding remaining diurnals along Europe-to-USA links, one should recall that the signals East–West and West–East are routed through two different transponders on the satellite, whereas one transponder handles the Europe-to-Europe TWSTFT.
3.3. Comparison of the triangle closures given by the SATRE and SDR measurements
A triangle closure is the sum of the three links that compose a triangle. In theory, a triangle closure, that is, [A − B] + [B − C] + [C − A], should be zero (see e.g. [15]). Unlike a GPS triangle configuration, the three links in a TWSTFT tri-angle are at least partly independent and a non-zero closure indicates there are systematic and statistical errors. The statis-tical error contains, and is in fact dominated by, the diurnals. Therefore, the closure is another excellent indicator of the advantages of using SDR TWSTFT.
Table 9 gives the statistical results of three triangles covering three regions of Asia, Europe and USA, through three different satellites, see figure 2. Data between MJDs 57645–57733 are used in the triangle analysis. The standard deviation of the closures using the T-11N satellite is 2.5 times higher than that obtained using the AM22 and E172A satellites. This agrees with the observations discussed in section 3.2 that the Asian links are more stable than the European links. It is interesting to note that although the three triangles are in quite different configurations, the gain factors are quite similar, in a range between 4.3 and
4.8, with a mean of 4.5. It is reasonable to state the averaged gain factor over all the triangles of Asia-PTB, within Europe (via NIST), and within Asia is about 4.5. We conclude that the chiprate of the PRN codes and bandwidth of the TWSTFT sig-nals define the general level of measurement precision, and the difference in the measurement technique (SATRE and SDR) determines the achievable gain.
Figure 11 shows a comparison of the SATRE TWSTFT and SDR TWSTFT triangle closures for the OP-NIST-PTB triangle in a period of four and half months between MJDs 57920 and 58060 (June and November 2017). It should be noted that in May 2017, the PTB01 station was replaced by the PTB05 station. The calibration correction values calculated by the BIPM were implemented on MJD 57997. A time step of 0.61 ns has been corrected in all SATRE links with PTB. With σ(SATRE) = 0.566 ns and σ(SDR) = 0.156 ns, the gain factor is 0.566 ns/0.156 ns = 3.6 for the triangle closure.
In section 3, we studied the direct comparison between SDR TWSTFT and SATRE TWSTFT links, the comparison of DCDs with GPS PPP or IPPP as reference, as well as the comparison of the triangle closure of SDR and SATRE links using the monthly data sets. We confirmed again that the SDR TWSTFT improves the stability of SATRE TWSTFT in the short-term (over averaging times up to about 3 d) by reducing the diurnals and the measurement noise. The improvements from these analyses are summarized in table 10. The mean value of the gain factors obtained from different evaluations is 2.5.
4. Long-term stability of the SDR TWSTFT links
The long-term stability of SDR links is no doubt one of the most important issues in UTC time transfer. Once a SDR link has been calibrated, it should remain stable. By using the following numerical examples, we investigate the con-sistency of SDR TWSTFT with respect to SATRE TWSTFT and GPS PPP links. It has been reported that there are long-term variations between TWSTFT and GPS links. Studies [9, 10] have demonstrated that a slope (a linear deviation as a function of time) of up to two ns per year is possible. This slope should be taken into account when studying the long-term DCD between TWSTFT and GPS PPP links. In the fol-lowing examples, we use the six months data set obtained during July–December 2017 to study the long-term stability of SDR links. The SDR links are calibrated according to the discussions in section 2.2.
Table 5. Gain in TDev at averaging times of two and twelve hours for the SATRE and SDR links.
Baseline
σx (ps) @ 2 h σx (ps) @ 12 h
SATRE SDR Gain SATRE SDR Gain
TL-NICT (Asia–Asia, via E172A) 90 45 2 79 48 1.7NIM-PTB (Asia–Europe, via AM22) 266 126 2.1 315 272 1.2NTSC-PTB (Asia–Europe, via AM22) 149 105 1.4 283 289 1.0SU-PTB (Europe–Europe, via AM22) 147 43.8 3.4 212 169 1.3AOS-PTB (Europe–Europe, via T-11N) 400 289 1.4 891 548 1.6OP-PTB (Europe–Europe, via T-11N) 318 104 3.1 342 70 4.9NIST-PTB (Europe–USA, via T-11N) 92.5 75.5 1.2 197 199 1.0
Table 6. Gain factor in TDev for the DCD of SATRE versus SDR links against the PPP link over the baseline of TL-NICT. The TL-NICT TWSTFT measurements were made in 5 min sessions every hour, and the diurnal peak in the SATRE link occurred at averaging times of 6 h. To have a better estimate of the SDR link improvement, the averaging times (τ) used in this computation are different than that used in computing the other TDevs in this paper.
Averaging time (1)
σx(SATRE-PPP) (ps) (2)
σx(SDR-PPP) (ps) (3) Gain = (2)/(3)
1 h 140 40 3.52 h 90 45 2.06 h 125 38 3.312 h 79 48 1.624 h 68 59 1.2Mean 2.3
Metrologia 55 (2018) 685

Z Jiang et al
694
4.1. Long-term consistency between SDR and SATRE TWSTFT links
Figure 12 shows the six months SATRE and SDR TWSTFT results and the DCD over the baseline of OP-PTB. Here the DCD is the direct difference between SATRE and SDR links. A linear regression is made over the DCD to determine a possible slope between the two links. A slope of 0.279 ns per year is found. The DCD′ is the DCD after removing the slope. The σ(DCD) = 0.400 ns and the σ(DCD′) = 0.398 ns, which are almost the same. This suggests that the slope does not affect the DCD and the SDR link calibration (systematic uncertainty) is stable and perfectly consistent with that of the SATRE link during the six months.
Figure 13 shows the TDev of the SDR and SATRE TWSTFT results illustrated in figure 12. Here the SDR link stability given by the six months data set is more evident than
for the monthly data set (see figure 3). For averaging times within 1 d, the gain factor is between three and five. After 3 d however, the gain is diminished. This is considered reasonable as the diurnal effect is averaged out beyond 3 d.
4.2. Long-term consistency between SDR TWSTFT and GPS PPP links
Figure 14 illustrates the SDR link compared to the PPP link over 750 d for the baseline of TL-KRIS. The PPP data are obtained from the PPP solutions of TL-IGST and KRIS-IGST used in Circular T computation. The σ(DCD) = 0.92 ns within the combined uncertainty of the SDR link and PPP in the DCD. This early study did not take into account the long-term variation (the slope) between TWSTFT and GPS.
Figure 15 shows the six months’ SDR and PPP links and the DCD(SDR-PPP) over the baseline of OP-PTB. As can be seen, there is an obvious tendency in the DCD: a slope of 2.22 ns/yr, as described in [9, 10], the so-called long-term variation between TWSTFT and GPS. In section 4.1 we showed that the SDR link is consistent with the SATRE link, and there is roughly the same slope of 1.98 ns/yr in the DCD(SATRE-PPP) as shown in figure 16. The difference between 2.22 ns and 1.98 ns per year is negligible compared to the measurement noise and the diurnals in the SATRE link. Whereas the SDR-SATRE comparison can only show
Figure 6. SATRE and IPPP links and the DCD over the baseline of OP-PTB with σ(DCD) = 0.521 ns.
Figure 7. SDR and IPPP links and the DCD over the baseline of OP-PTB with σ(DCD) = 0.230 ns.
Figure 8. TDev of the DCDs data plotted in figures 6 and 7 for the baseline of OP-PTB. The axes of the plot are expressed in logarithmic scale. The numbers in the plot represent σx values in picoseconds.
Table 7. Gain factor in TDev for the DCD of SATRE and SDR links against the IPPP link over the baseline of OP-PTB corresponding to figure 8.
Averaging time (1)
σx(IPPP-SATRE) (ps) (2)
σx(IPPP-SDR) (ps) (3)
Gain = (2)/(3)
2 h 280 104 2.74 h 337 96 3.58 h 213 112 1.916 h 134 62 2.232 h 89 62 1.4Mean 2.4
Metrologia 55 (2018) 685

Z Jiang et al
695
the combined effect of delay changes in the two SATRE and SDR receive parts, SDR-GPS and SATRE-GPS disclose all kinds of delay changes in both sets of equipment. Thus, a larger slope was to be expected, and of course efforts are needed to identify the root cause and then reduce it closer to zero. We consider the observed slope as a systematic drift of either GPS time transfer or TWSTFT or both, indepen-dently of the use of SATRE or SDR receivers. In our fur-ther analysis we remove the linear trend and analyse the residual data to investigate other processes of instability in the SATRE and SDR links with respect to the PPP link. It is important to note that the previous studies [9, 10] showed the long-term variation between GPS and TWSTFT does not occur in all baselines. In this analysis, we are interested in investigating if the SDR and SATRE links have the same long-term change with respect to each other and to the GPS link. Therefore, only a few baselines showing the long-term variation are analysed here.
When DCD′ is used as the DCD after removing the slope, see figures 15 and 16, the σ(DCD) = 0.511 ns and σ(DCD′) = 0.432 ns for the SATRE-PPP comparison and σ(DCD) = 0.377 ns and σ(DCD′) = 0.217 ns for the SDR-PPP comparison. Noting that the conventional statis-tical uncertainty for PPP is uA = 0.3 ns and the standard deviation for the SDR-PPP comparison is σ(DCD′) = 0.217 ns, the results show very good consistency between the SDR and PPP links. In other words, over the long-term, the SDR link is as statistically stable as that of SATRE and GPS. Table 11 gathers the statistical results of the DCD and the DCD′. Here the ‘Slope affecting factor’ indicates by how much the long-term systematic stability may affect the link comparisons.
By using the σ(DCD′), we can compute the gain factor of the SDR links. From σ[DCD′(SATRE-PPP)] and σ[DCD′(SDR-PPP)] in table 11, the gain factor is 0.432/0.217 = 2.0. The true factor values could be larger than 2.0 because it also contains the uncertainty of PPP that may be about 0.1 ns to 0.3 ns.
Finally, the long-term stability in the SDR links using the baselines in Europe and Asia was estimated. The results are given in table 12. The mean value σ(DCD′) = 0.264 ns is
Figure 9. DCDs of SATRE and SDR links against IPPP link over the baseline of NIST-PTB with σ(IPPP-SATRE) = 0.355 ns and σ(IPPP-SDR) = 0.267 ns.
Figure 10. TDev of the DCDs in figure 9 over the baseline of NIST-PTB.
Table 8. Gain factors of TDev in figure 10.
Averaging time (1)
σx(IPPP-SATRE) (ps) (2)
σx(IPPP-SDR) (ps) (3)
Gain = (2)/(3)
1 h 36 30 1.22 h 69 52 1.34 h 141 107 1.38 h 315 229 1.416 h 200 160 1.332 h 79 78 1.0Mean 1.3
Table 9. Gain factor of the SDR versus the SATRE links given by the triangle analysis.
Triangles/satellites (1)
σ(SATRE) (ps) (2)
σ(SDR) (ps) (3)
Gain factor = (2)/(3)
OP-NIST-PTB/T-11N 470 110 4.3NICT-KRIS-TL/E172A 190 40 4.8PTB-NTSC-SU/AM22 180 40 4.5Mean 4.5
Metrologia 55 (2018) 685

Z Jiang et al
696
smaller than the conventional statistical uncertainty uA = 0.3 ns of the PPP [1] showing a very good statistical stability agreement between the SDR and PPP links. The mean value of the slope affecting factor is 1.7. This suggests that roughly speaking, σ(DCD)/1.7 is the real standard deviation (statis-tical instability) of the difference between the TWSTFT and GPS links.
From the six months data analysis, we observe that SDR TWSTFT is statistically stable relative to SATRE TWSTFT. However, SDR TWSTFT and GPS PPP links over some base-lines exhibit a systematic deviation similar to the comparison of SATRE TWSTFT and GPS PPP links. After removing the linear deviation, the DCD between SDR and PPP gives the appearance of white noise, i.e. SDR TWSTFT is stable and consistent with respect to GPS PPP results. It should be pointed out that when the six months data set is used to com-pute annual variations, the slopes given in this section could be half of a seasonal variation. Readers who are interested in
Figure 11. Comparison of the OP-NIST-PTB triangle closure formed by SATRE links (blue) and SDR links (red) over a period of 4.5 months from June to November 2017.
Table 10. Summary of the gain factor of SDR versus the SATRE links based on the monthly data analysis.
Gain factor computation method Link used in the analysis Mean gain factor
σx(SATRE)/σx(SDR) OP-PTB, AOS-PTB and SU-NIM 3.7, 2.9, 2.0σx[DCD(SATRE-PPP/IPPP)]/σx[DCD(SDR-PPP/IPPP)] TL-NICT, OP-PTB 2.3, 2.4σx[DCD(SATRE-PPP/IPPP)]/σx[DCD(SDR-PPP/IPPP)] NIST-PTB 1.4σ[DCD(SATRE-IPPP)]/σ[DCD(SDR-IPPP)] OP-PTB 2.3σ[DCD(SATRE-IPPP)]/σ[DCD(SDR-IPPP)] NIST-PTB 1.3σ(SATRE triangle closure)/σ(SDR triangle closure) OP-NIST-PTB, NICT-KRIS-TL, PTB-NTSC-SU 4.5
Mean 2.5
Figure 12. Six-month SATRE and SDR results and the DCD(SATRE-SDR) over the baseline of OP-PTB.
Figure 13. TDev of the SDR and SATRE TWSTFT results in figure 12.
Metrologia 55 (2018) 685

Z Jiang et al
697
the long-term variation between TWSTFT and GPS links may refer to [9, 10].
5. Summary
The SDR TWSTFT pilot study started about two years ago. In this paper, we reviewed the history, technical aspects and
settings, as well as the major results of the pilot study. We also presented the results of the BIPM final evaluation that used the approaches of direct SDR and SATRE link comparisons, tri-angle closure comparisons and the comparison with GPS PPP or IPPP as reference. The evaluation used SATRE TWSTFT, SDR TWSTFT, GPS PPP, and GPS IPPP data to examine the performance of the SDR TWSTFT with the standard UTC gen-eration procedure, Tsoft. Starting from October 2017 (Circular
Figure 14. SDR link compared to PPP link (left) and the DCD (PPP-SDR) (right) over the baseline of TL-KRIS during MJDs 57304–58054 with σ(DCD) = 0.92 ns. The PPP data are extracted from the PPP solutions used in Circular T.
Figure 15. Six months’ SDR and PPP links (left) and the DCD(SDR-PPP) (right) over the baseline of OP-PTB with a slope of 2.22 ns/yr, σ(DCD) = 0.377 ns and with σ(DCD′) = 0.217 ns.
Figure 16. Six months’ SATRE and PPP links (left) and the DCD(SATRE-PPP) (right) over the baseline of OP-PTB with a slope of 1.98 ns/yr, σ(DCD) = 0.511 ns and with σ(DCD′) = 0.432 ns.
Table 11. Agreement between SATRE, SDR and PPP links over the baseline of OP-PTB (comparing the DCD before/after removing the slope).
DCD (1)Slope (ns/yr) (2)
σ(DCD) (ns) (3)
σ(DCD′) (ns) (4)
Slope affecting factor (3)/(4)
σ(SATRE-SDR)
0.279 0.400 0.398 1.00
σ(SATRE-PPP)
1.980 0.511 0.432 1.18
σ(SDR-PPP)
2.220 0.377 0.217 1.73
Table 12. Agreement between SDR and PPP links over different UTC baselines (comparing the DCD before/after removing the slope).
Baseline (1)Slope (ns/yr) (2)
σ(DCD) (ns) (3)
σ(DCD′) (ns) (4)
Slope affecting factor(3)/(4)
OP-PTB 2.2 0.377 0.217 1.7CH-PTB 2.7 0.374 0.222 1.7IT-PTB 2.4 0.695 0.431 1.6TL-KRIS 2.9 0.313 0.188 1.7Mean 0.440 0.264 1.7
Metrologia 55 (2018) 685

Z Jiang et al
698
T 359), the SDR TWSTFT has been used as a backup UTC time link. The results are, and will continue to be, published monthly on the BIPM website, e.g. the link and link comparison results of November 2017 can be found in [16–18].
To summarize the work of the BIPM’s final evaluation and the pilot study, we can conclude that:
– the monthly data analysis confirmed again that SDR TWSTFT improves the short-term (for averaging times up to 3 d) stability of SATRE TWSTFT by reducing the diurnal and the measurement noise for all the baselines;
– the six months data analysis showed that SDR TWSTFT calibration is stable in the long-term when compared to SATRE TWSTFT;
– for some baselines, analysis showed a long-term deviation between SDR TWSTFT and GPS PPP or GPS IPPP links, after removing the linear trend, SDR TWSTFT is statisti-cally stable compared to GPS PPP or IPPP;
– the BIPM has validated the SDR TWSTFT results for the Asia-to-Asia, Asia-to-Europe, Europe-to-Europe and Europe-to-USA links using three different satellites operating in the Ku-band;
– most of the SDR TWSTFT participants have implemented the settings for facilitating the use of SDR TWSTFT data in UTC computation;
– the BIPM has made test runs using SDR TWSTFT data in UTC generation and has started using SDR TWSTFT as backup time links since October 2017;
– the use of SDR TWSTFT in UTC generation will be implemented in 2018, based on the link-by-link decisions made by the BIPM and the link participants;
– for the computation of Circular T, the uncertainty comp-onents of the SDR TWSTFT are by convention: uA of 0.2 ns, uB equal to the corresponding uncertainty of the SATRE link if the SDR link is not independently calibrated;
– further improvements of SDR TWSTFT is possible by fully using the redundancy in UTC time transfer networks [11];
– a significant work remains to be done with the SDR link calibration issue: a joint study by the BIPM and the WG on TWSTFT is ongoing;
– from a technical and practical point of view, the SDR TWSTFT is now ready to be accepted for UTC time links.
The SDR is an open platform for operators of TWSTFT ground stations. Laboratories may undertake further (or more in-depth) studies, including the use of the carrier phase information for various applications [13] or by developing a complete SDR transmission and reception platform as an alternative to the modem technique for two-way time and fre-quency transfer.
Acknowledgments
The authors acknowledge Tadahiro GOTOH and Wen-Hung TSENG for their earlier contributions to this study. We thank Gérard PETIT and Julia LEUTE for supplying the IPPP data and Andreas BAUCH for helpful advice.
This paper includes contributions from the US Government and is not subject to copyright.
References
[1] BIPM Circular T 360 ftp://ftp2.bipm.org/pub/tai/Circular-T/cirthtm/cirt.360.html (January 2018)
[2] TWSTFT Calibration Guidelines for UTC Time Links V2016 ftp://ftp2.bipm.org/pub/tai/publication/twstft-calibration/guidelines/
[3] Huang Y J, Tseng W H, Lin S Y, Yang S H and Fujieda M 2016 TWSTFT results by using software-defined receiver data Proc. European Frequency and Time Forum 2016 (York, UK, April 2016) pp 137–40
[4] Huang Y J, Fujieda M, Takiguchi H, Tseng W H and Tsao H W 2016 Stability improvement of an operational two-way satellite time and frequency transfer system Metrologia 53 881–90
[5] Recommendation CCTF 5 2017 On improving the uncertainty of two-way satellite time and frequency transfer (TWSTFT) for UTC generation www.bipm.org/en/committees/cc/cctf/publications-cc.html
[6] Recommendation ITU-R TF.1153-4 2015 The operational use of two-way satellite time and frequency transfer employing pseudorandom noise codes (Geneva, Switzerland)
[7] Zhang V, Achkar J, Huang Y J, Jiang Z, Lin S Y, Parker T and Piester D 2017 A study on using SDR receivers for the Europe–Europe and transatlantic TWSTFT links Proc. 48th Annual Precise Time and Time Interval Systems and Applications Meeting (Monterey, CA, USA, January 2017) pp 206–18
[8] Jiang Z et al 2018 Implementation of SDR TWSTFT in UTC computation Proc. 49th Annual Precise Time and Time Interval Systems and Applications Meeting (Reston, VA, USA, January 2018) pp 184–208
[9] Jiang Z, Matsakis D and Zhang V 2017 Long-term instability in UTC time links Proc. 48th Annual Precise Time and Time Interval Systems and Applications Meeting (Monterey, CA, January 2017) pp 105–26
[10] Lin S Y and Jiang Z 2018 The long term stability and redundancy test of GPS multi-receiver ensemble Proc. 49th Annual Precise Time and Time Interval Systems and Applications Meeting (Reston, VA, USA, January 2018) pp 154–63
[11] Jiang Z, Zhang V, Parker T E, Petit G and Huang Y 2018 Improving two-way time and frequency transfer with redundant links for UTC generation Metrologia submitted
[12] Petit G, Kanj A, Loyer S, Delporte J, Mercier F and Perosanz F 2015 1 × 10⁻¹⁶ frequency transfer by GPS PPP with integer ambiguity resolution Metrologia 52 301–9
[13] Fujieda M, Piester D, Gotoh T, Becker J, Aida M and Bauch A 2014 Carrier-phase two-way satellite frequency transfer over a very long baseline Metrologia 51 253–62
[14] Piester D, Bauch A, Becker J, Staliuniene E and Schlunegger C 2008 On measurement noise in the European TWSTFT network IEEE Trans. UFFC 55 1906–12
[15] Piester D, Bauch A, Breakiron L, Matsakis D, Blanzano B and Koudelka O 2008 Time transfer with nanosecond accuracy for the realization of International Atomic Time Metrologia 45 185–98
[16] ftp://ftp2.bipm.org/pub/tai/timelinks/lkc/1711/opptb/lnk/opptb.tttts.gif BIPM OP-PTB SDR link computation results for November 2017
[17] ftp://ftp2.bipm.org/pub/tai/timelinks/lkc/1711/opptb/dlk/opptb.ttts5.gif BIPM computation results for November 2017 comparison of OP-PTB SDR and SATRE links
[18] ftp://ftp2.bipm.org/pub/tai/timelinks/lkc/1711/opptb/dlk/opptb.t3sa5.gif for the comparison of SDR and GPSPPP links
Metrologia 55 (2018) 685