use of sensor systems with spectral pttern recognition for
TRANSCRIPT

Use of Sensor Systems with Spectral Pattern
Recognition for Food Authentication
Weiran Song
Ulster University

Outline
• Overview of food authentication• Methods • Challenge
• Research problems and aims
• Spectral pattern recognition• Classification• Model interpretation
• Sensor systems• Near-infrared spectroscopy• Diffraction grating• Computer vision (video based)
• Conclusion
• Future work
1. Overview
• Food adulteration and fraudulent labelling • Damage public health
• Reduce consumer confidence
• Ruin brand reputation
• Examples:• “Foreign beef ‘is sold as British,” BBC News, 2008.
• “Germany investigates possible organic egg fraud,” Reuters, 2013.
• “Meat testing: A fifth of samples reveal unspecified animals’ DNA,” BBC News, 2018.
1. Overview
• Food authentication is a process which verifies the food compliance with its label description.• Origin (species, geographical or genetic)
• Production method (conventional, organic, traditional procedures, free range)
• Processing technologies (irradiation, freezing, microwave heating).
• Conventional authentication methods • Sensory analysis → five organs perception → expensive, subjective and
inconsistent
• Laboratory-based instrumentation → wet chemistry and chromatography → time-consuming, require complex sample preparation and technical knowledge
1. Overview
• Challenge: seek and develop efficient and low-cost methods for food authentication • Accurate determination
• Fast and non-destructive
• Minimal or no sample preparation and reagent consumption
• Novel methods for real-time food authentication methods• Optical measuring technologies, such as NIR spectroscopy, hyperspectral
imaging and computer vision
• Pattern recognition algorithms
2. Research problems and aims
• Problems:• Low-cost and portable sensors
• Variable sampling conditions and instrumental limitations• Lower fingerprint data quality• Pose a serious challenge to pattern recognition methods
• Nonlinear conditions• Caused by instrumental and experimental artefacts• Classical methods (PLS) often degrade in performance
• Aims:• Extract useful fingerprint data from noisy field data • Assist low-cost spectral-based sensors in obtaining the required level of performance
compared to high-resolution spectrometers• Develop efficient and low-cost sensor systems

3. Spectral pattern recognition
• An interdisciplinary science of using mathematical, statistical and machine learning methods to identify regularities in spectral data• Regularities → chemical compositions and physical properties
• Data presentation → radiation intensity versus wavelengths or frequencies
• Essential characteristics• High-dimensionality
• High-collinearity
• Non-linearity
3. Spectral pattern recognition: framework
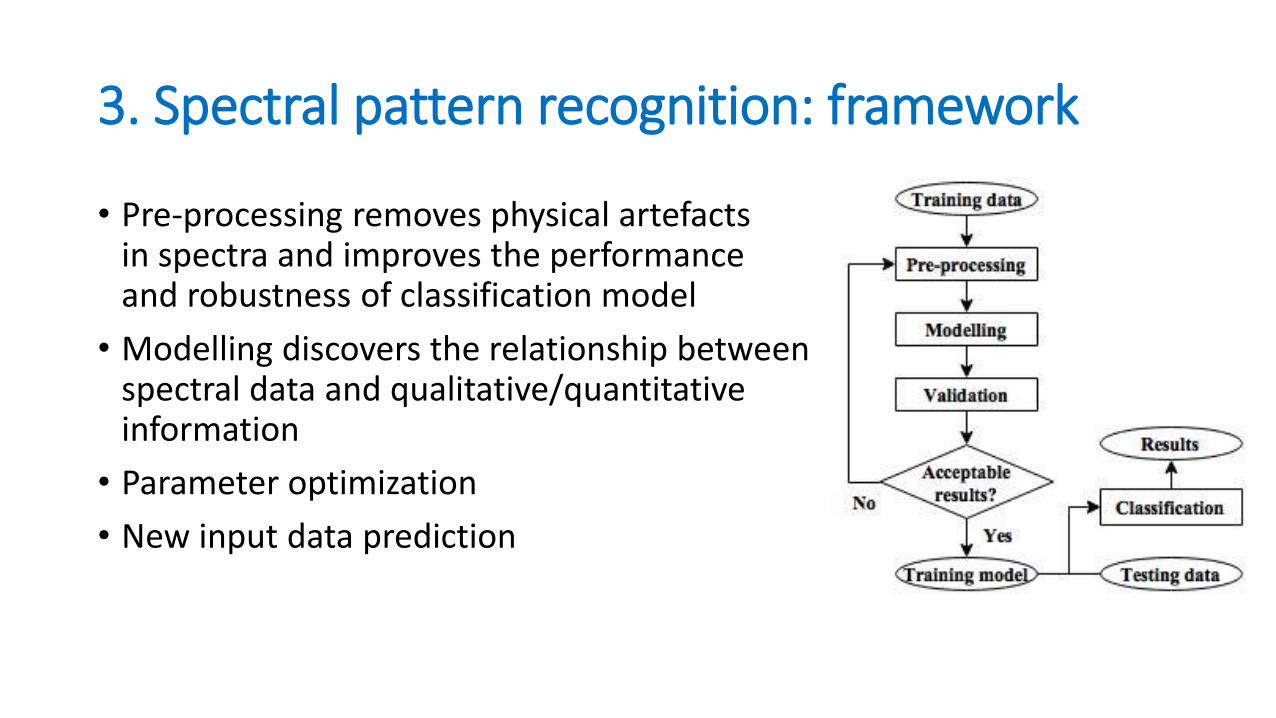
• Pre-processing removes physical artefacts in spectra and improves the performance and robustness of classification model
• Modelling discovers the relationship between spectral data and qualitative/quantitative information
• Parameter optimization
• New input data prediction
3. Spectral pattern recognition: partial least squares (PLS)
• PLS is standard chemometric method for processing a wide spectrum of chemical data problems.
• Basic assumption: the investigated system or process is driven by a set of underlying latent variables (LVs).
• PLS searches for linear combinations of independent variables that maximize the covariance between the LV and the response:
max wT XT Y c,
s.t. wT w = cT c = 1.
where X is the matrix of independent variables, Y is the matrix of response, w and c is the weight vector of X and Y, respectively.

3. Spectral pattern recognition: partial least squares (PLS)
• PLS classification: dummy matrix coding transforms category information into numerical responses.
• Advantages• Stably estimate regression coefficients from low-dimensional LVs• Efficiently handle some ill-conditioned problems
• Small sample size• High-dimensionality• High-collinearity
• Model interpretation: PLS is good at showing significant variables via loadings or weights compared to SVM and LDA.
• Performance degradation in nonlinear, class imbalance and multiclass conditions

3. Spectral pattern recognition: some proposed methods
• Motivations• PLS is practically suitable for high-dimensionality and multicollinearity • Local models reduce global nonlinearity• Use weighting schemes based on the distance between query and training
samples
• The proposed methods• Local PLS for classification
• Nearest neighbors • Nearest clusters• Locally weighted
• Representation classification with PLS regression• Model interpretation

3. Spectral pattern recognition: some proposed methods
• Example 1: nearest clusters PLS-DA• Generate multimodal PCA scores
• Simulate orthogonal combination of Gaussian peaks and reference spectrumcan produce simulated data
• The black-cross (+) sample is wrongly classified by PLS-DA
• Local PLS approaches shows simplified and distinctive structure which is approximately linear separable.
3. Spectral pattern recognition: some proposed methods
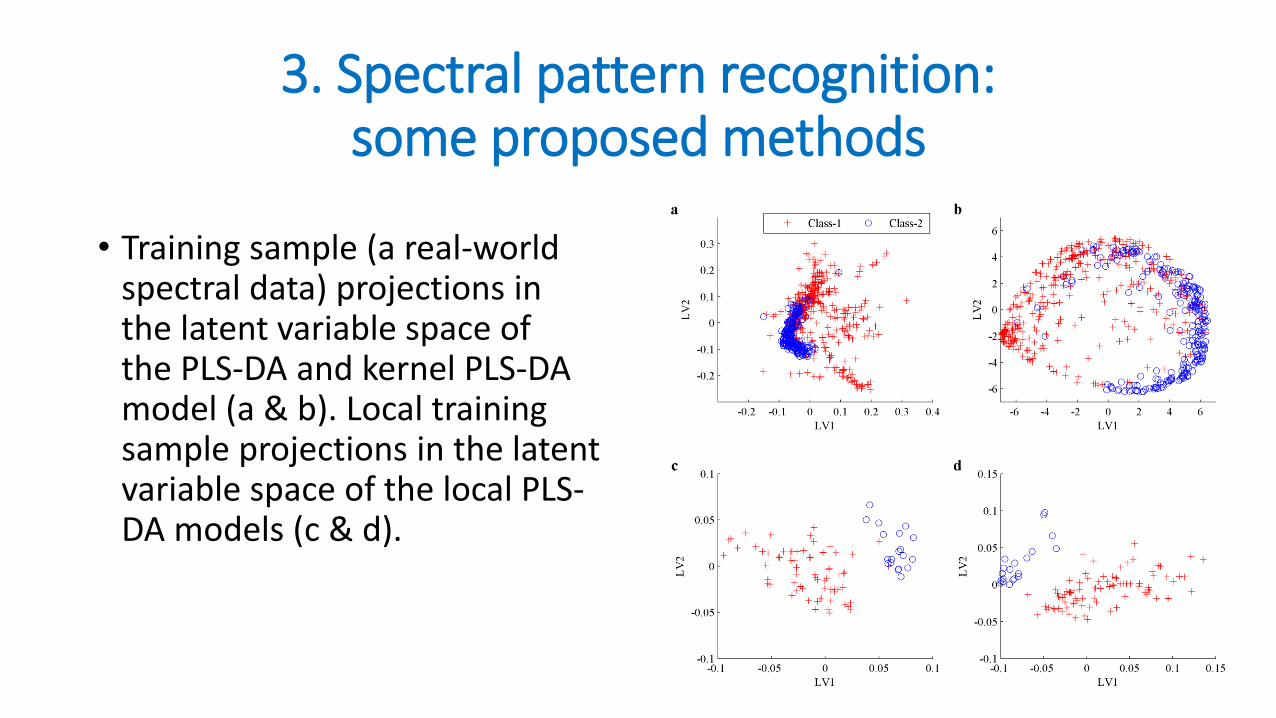
• Training sample (a real-world spectral data) projections in the latent variable space of the PLS-DA and kernel PLS-DA model (a & b). Local training sample projections in the latent variable space of the local PLS-DA models (c & d).
3. Spectral pattern recognition: some proposed methods
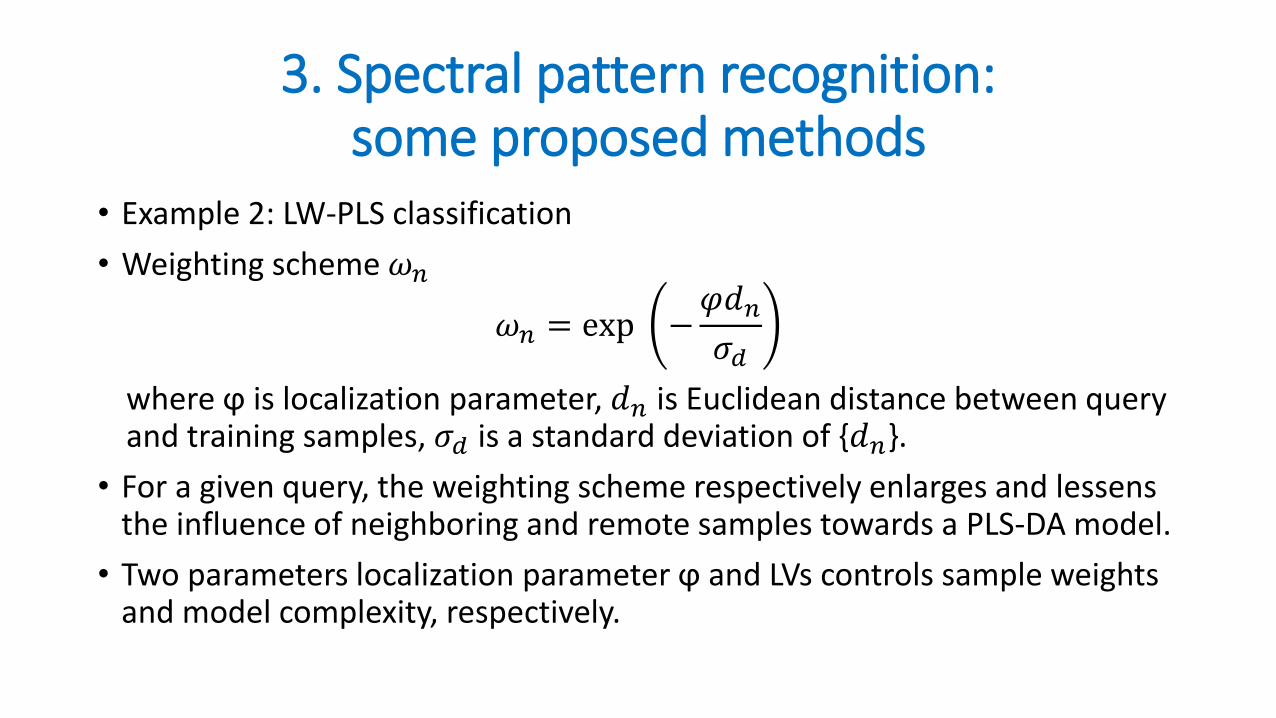
• Example 2: LW-PLS classification
• Weighting scheme 𝜔𝑛
𝜔𝑛 = exp −𝜑𝑑𝑛𝜎𝑑
where ϕ is localization parameter, 𝑑𝑛 is Euclidean distance between query and training samples, 𝜎𝑑 is a standard deviation of {𝑑𝑛}.
• For a given query, the weighting scheme respectively enlarges and lessens the influence of neighboring and remote samples towards a PLS-DA model.
• Two parameters localization parameter ϕ and LVs controls sample weights and model complexity, respectively.

3. Spectral pattern recognition: some proposed methods
• Graphical representation of different ϕ values with respect to sample weights for a query sample• Small ϕ value: LW-PLSC becomes to PLS-DA
• Large ϕ value: enlarged influence of neighboring samples
3. Spectral pattern recognition: some proposed methods
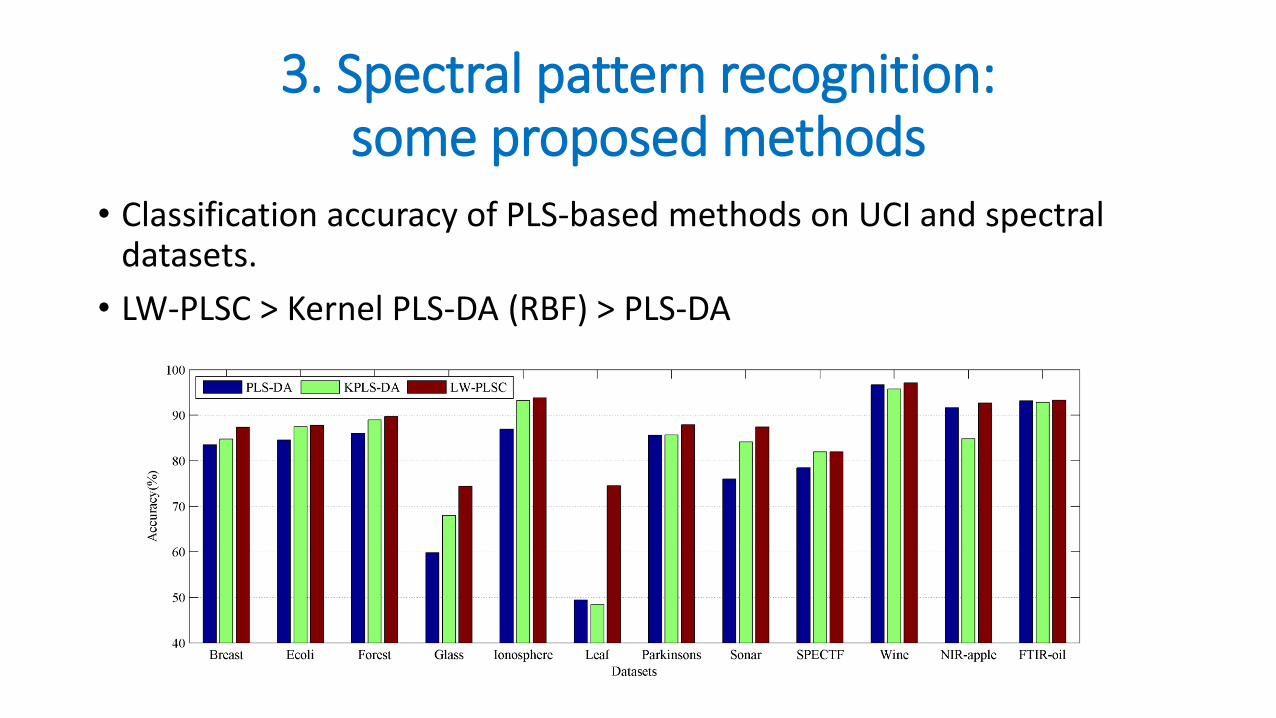
• Classification accuracy of PLS-based methods on UCI and spectral datasets.
• LW-PLSC > Kernel PLS-DA (RBF) > PLS-DA

3. Spectral pattern recognition: some proposed methods
• Example 3: representation classification with weighted PLS regression• Use a weighted linear combination of training samples to represent a query
• Attribute the query to the class which yields the least PLS approximation error
• Classification model interpretation (comparison)
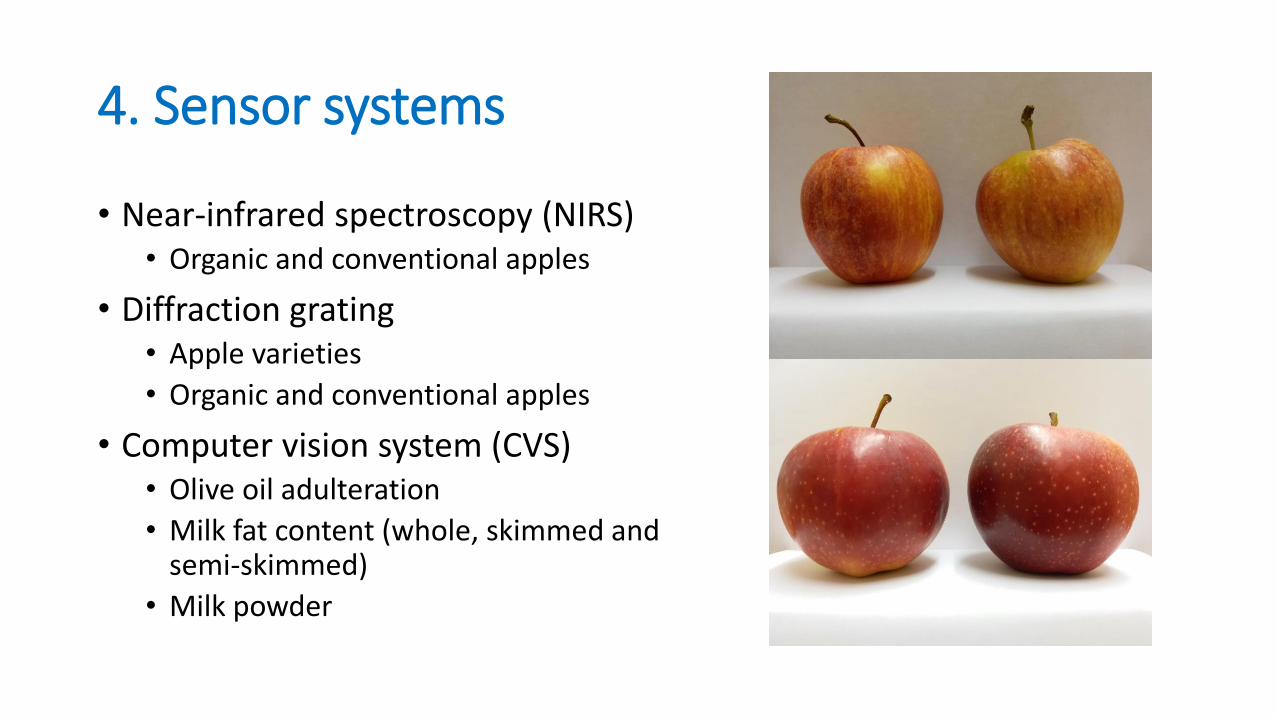
4. Sensor systems
• Near-infrared spectroscopy (NIRS)• Organic and conventional apples
• Diffraction grating• Apple varieties
• Organic and conventional apples
• Computer vision system (CVS)• Olive oil adulteration
• Milk fat content (whole, skimmed and semi-skimmed)
• Milk powder
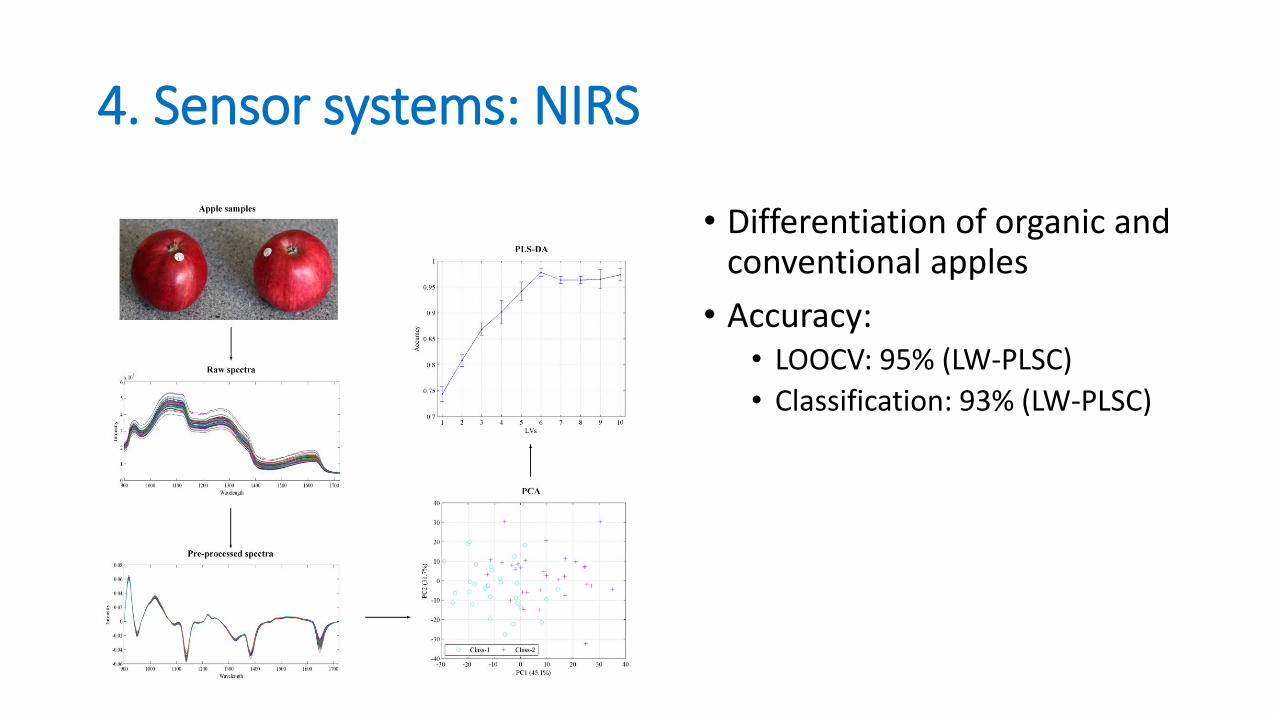
4. Sensor systems: NIRS
• Differentiation of organic and conventional apples
• Accuracy: • LOOCV: 95% (LW-PLSC)
• Classification: 93% (LW-PLSC)

4. Sensor systems: diffraction grating
• Framework
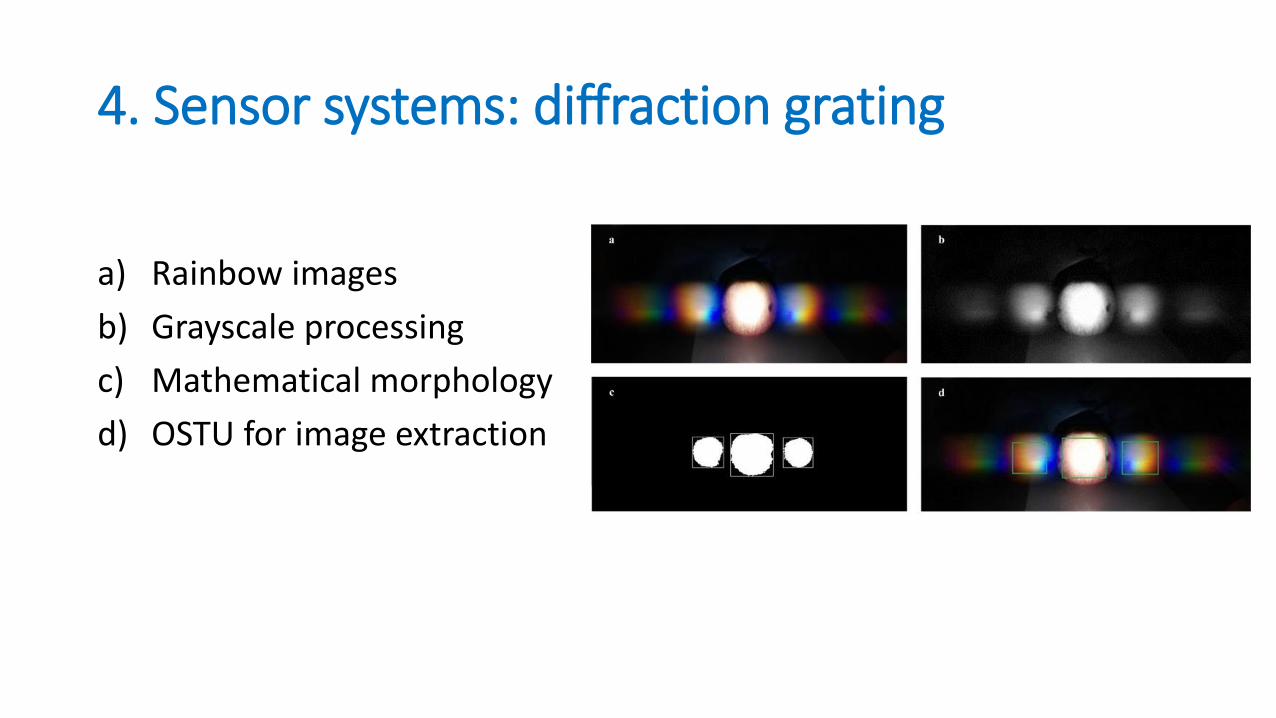
4. Sensor systems: diffraction grating
a) Rainbow images
b) Grayscale processing
c) Mathematical morphology
d) OSTU for image extraction

4. Sensor systems: diffraction grating
• Rainbow image (a) → numerical values (c) → PCA scores (b)
• Results• Over 93% accuracy
• LW-PLSC, SVM and LS-SVM outperforms other 9 baseline classifiers
• Comparable to portable NIR spectrometers
4. Sensor systems: computer vision system
• CVS aims to replace human visual system by artificial sensor and automatically gain high-level understanding from digital images.
• It extracts useful food external information, such as colour, size and shape.
• Procedures: image acquisition, processing and analysis
• Hardware: illumination, camera and computer
• Common applications: • content estimation• freshness assessment • defect detection
4. Sensor systems: computer vision system
• Limitations of conventional CVS• Less practical for consumers
• Properly designed illumination
• Careful setting of camera
• Varying sampling conditions
• External camera and computer software
• Motivations• A feasible alternative to external camera: smartphone
• Use CVS to capture spectral information (video)

4. Sensor systems: smartphone video
a) The user interface of Camera2Video app;
b) Image (960 × 720 pixels) of oil sample illuminated by yellow light. The selected ROI is marked by a red box with 100× 100 pixels;
c) Images of ROI illuminated by lights with a sequence of spectral colours.

4. Sensor systems: smartphone video
• Video data of unadulterated and adulterated olive oil.
• Distinction of unadulterated and adulterated 80 samples in red colour channel variables 85-125.
4. Sensor systems: smartphone video
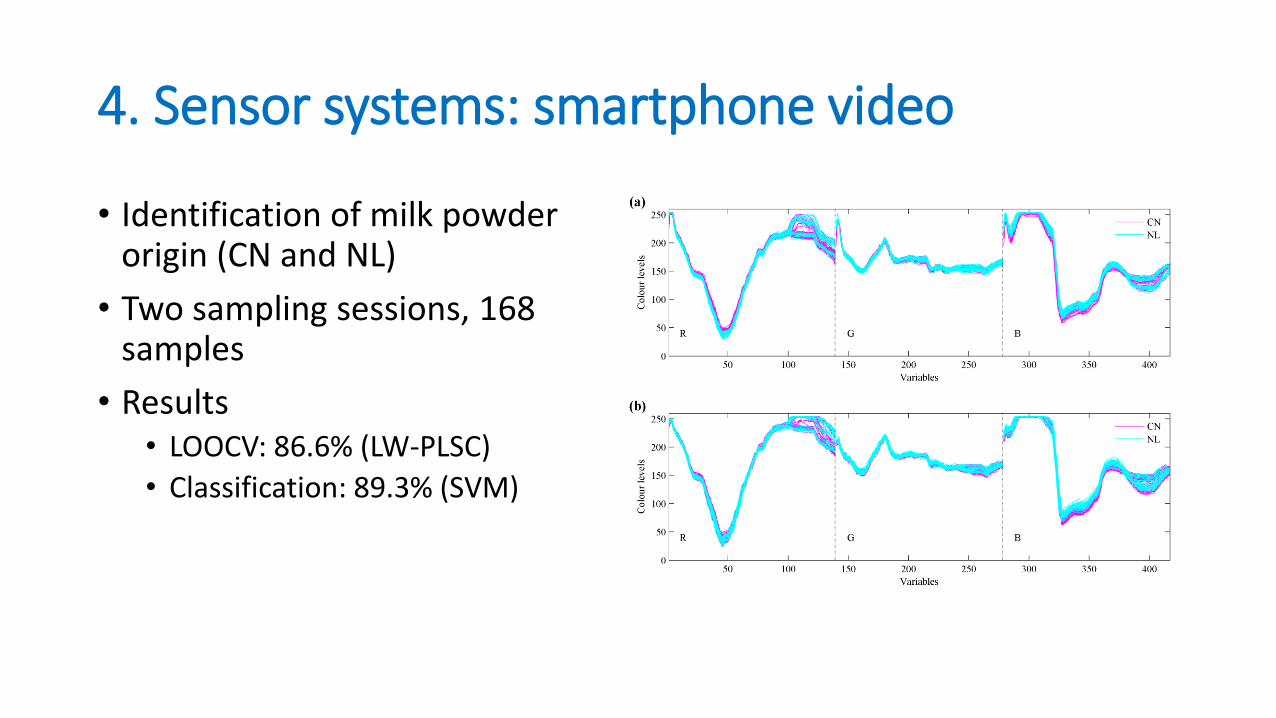
• Identification of milk powder origin (CN and NL)
• Two sampling sessions, 168samples
• Results• LOOCV: 86.6% (LW-PLSC)
• Classification: 89.3% (SVM)
4. Sensor systems: smartphone video
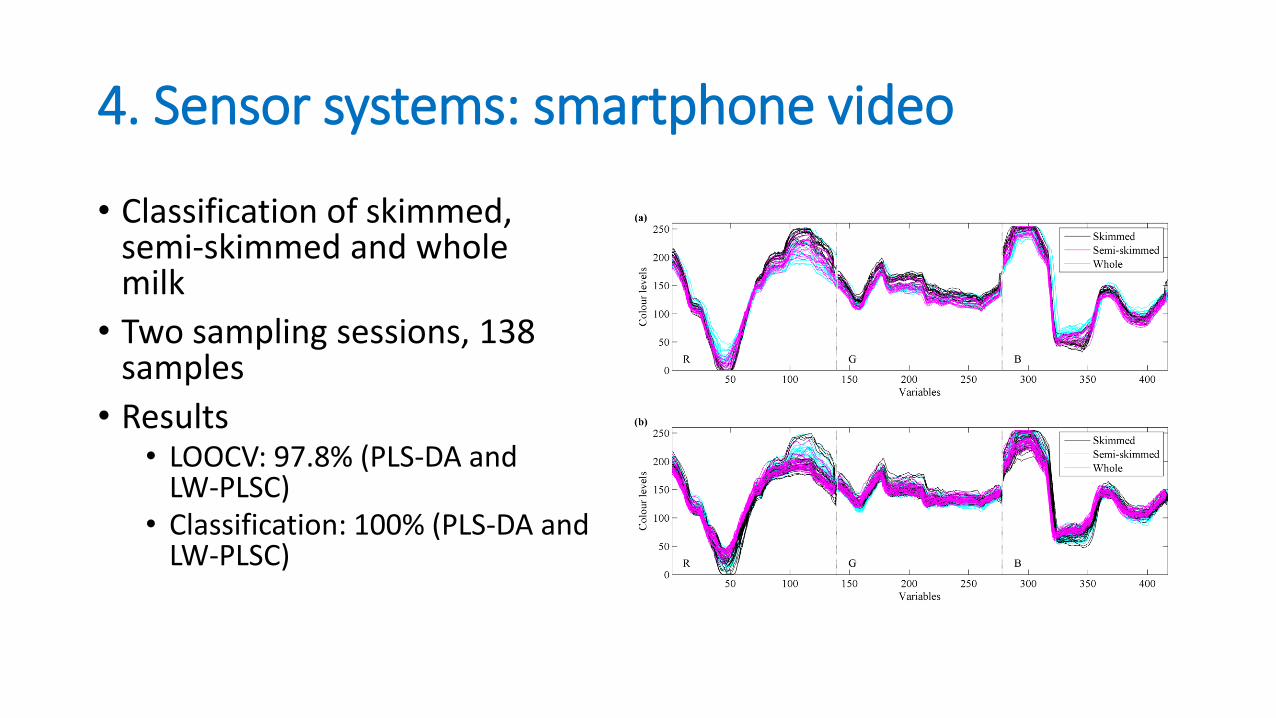
• Classification of skimmed, semi-skimmed and wholemilk
• Two sampling sessions, 138samples
• Results• LOOCV: 97.8% (PLS-DA and
LW-PLSC)• Classification: 100% (PLS-DA and
LW-PLSC)

5. Conclusion
• The proposed methods improve the modelling performance and simplicity in classifying nonlinear spectral data.
• They outperform baseline methods in most of the time.
• Low-cost sensor yields comparable results to commercial spectrometer with the aid of state of the art methods, such as LW-PLSC.
• The use of phone videos coupled with pattern recognition has great potential for efficient and low-cost food authentication.
6. Future work
• Model interpretation • A comparison between machine learning and chemometrics variable
selection.
• Data representation• Small sample size• ‘Variable’ weighted regression• Between class regularization
• Big data and deep learning• Sampling • Modelling• App development

Publications
• W. Song, H. Wang, P. Maguire, O. Nibouche, Differentiation of organic and non-organic apples using near infrared reflectance spectroscopy — A pattern recognition approach, in: SENSORS, 2016 IEEE, IEEE, 2016.
• W. Song, H. Wang, P. Maguire, O. Nibouche, Local Partial Least Squares classifier in high dimensionality classification, Neurocomputing. 234 (2017) 126–136.
• W. Song, H. Wang, P. Maguire, O. Nibouche, Nearest clusters based partial least squares discriminant analysis for the classification of spectral data, Anal. Chim. Acta. 1009 (2018) 27–38.
• W. Song, H. Wang, P. Maguire, O. Nibouche, Collaborative representation based classifier with partial least squares regression for the classification of spectral data, Chemom. Intell. Lab. Syst. 182 (2018) 79-86.
• W. Song, H. Wang, P. Maguire, O. Nibouche, Spectral data classification using locally weighted partial least squares classifier, Data Science and Knowledge Engineering for Sensing Decision Support – Proceedings of the 13th International FLINS Conference (2018) 700-707.
• N. Jiang, W. Song, H. Wang, G. Guo, Y. Liu, Differentiation between organic and non-organic apples using diffraction grating and image processing—A cost-effective approach, Sensors (Switzerland). 18 (2018) 1667.