use of saccharomyces boulardii in alcohol-free beer production final.pdf · i use of saccharomyces...
TRANSCRIPT
i
Use of Saccharomyces boulardii in Alcohol-Free Beer
Production
Inês Alexandra Graça Dias
Thesis to obtain the Master of Science Degree in
Biological Engineering
Supervisors:
Professor Tomás Brányik
Professor Marília Clemente Velez Mateus
Examination Committee
Chairperson: Professor Arsénio do Carmo Sales Mendes Fialho
Supervisor: Professor Marília Clemente Velez Mateus
Member of the Committee: Professor Nuno Gonçalo Pereira Mira
October 2016

ii

iii
ACKNOWLEDGEMENTS
After spending five years in Técnico Lisboa, full of good moments but also many concerns, this is
the end of the journey. It would not have been as exciting and rewarding if some people were not
a part of it.
First of all, I would like to express my sincere gratitude to Prof. Tomáš Brányik for accepting me
at UCT Prague and giving me the opportunity to develop my master thesis project under his
supervision. Also, for all the support during these six months and the availability to answer my
questions and providing me advices when needed. Děkuji!
I would like to acknowledge to all of my colleagues in the laboratory that in one way or another
helped me during my stay. Especially to Jan Strejc for showing me around and for the support
with GC and the fermentations; to Tomáš Humhal for the important assistance with HPLC and
David Matuška. Without them my work would have been much more difficult. Also, I would like to
refer the importance of Bára Šenkárčinová for the knowledge and tips to overcome problems. For
being always so lovely and helpful with me and interested in knowing how my work was going. A
really big thank you!
I would also like to thank to my supervisor from Técnico Lisboa, Prof. Marília Mateus, who was
always concerned about my work progress and always available to answer to any question. It
was a crucial help in the final part of my thesis, giving me a lot of advices.
To all my Erasmus friends in Prague, thank you so much for being my family during these 6
months and making me feel at home. For all the support and endless friendship developed from
Volha Residence, I will never forget all the good moments spent in Prague with you. It is
unbelievable how we can develop such strong friendships and connections in a short period of
time. I can say that it was definitely one of the best times of my life. Developing this experience
abroad in a multi-cultural environment made me, without doubts, improve as a person. I am very
grateful to each one of you!
Also, I would like to thank to all my friends from NAPE and to NAPE itself. Being part of this team
before going to Prague was an honor and a great opportunity for me to grow. I was able to improve
many soft skills and I can say that the experience of working with you prepared me (and a lot) for
my master thesis. And none of this could have been possible if I have not met the best colleagues
that someone can ask for. Colleagues that today are friends. Thank you very much to all of you!
Besides, I need to thank to all my university friends that spent the last five years with me and they
totally understand the difficulties that we have been through. For all of these five years, for all the
good moments and all the concerns: it was a pleasure! Also, all of my friends from Massamá that
I already know for more than 10 years. It is amazing how some friendships can last a lifetime.
Thank you all for the support along these years and for being there always!

iv
Lastly, I am very grateful for the family I have. I would like to thank to my parents for the patience
and the affection provided because without them this could not be possible. To my brother,
grandparents, uncles and cousins, for supporting me and believing in me. Thank you so much!
v
ABSTRACT
Saccharomyces boulardii is a yeast with probiotic properties already used in several
commercialized medicines and food supplements. On the other hand, alcohol-free beers (AFB)
are an attractive segment of beer market both for brewing industry and consumers. Therefore,
producing a “medicinal beer” able to provide human health benefits would be an interesting
improvement in beer markets.
This study focuses not only in testing the possibility of producing a beer with probiotic properties,
but also in verifying the effects this strain produces in the beer wort. In the first part of the study,
S. boulardii growth was tested at different temperatures and media. In the second part, 13
fermentation columns were analyzed under different parameters (original extract, temperature
and pitching rate). The amount of volatile compounds was monitored in each column as well as
sugar consumption and ethanol formation, using GC and HPLC. Response surface methodology
was used to enhance the formation of flavor active volatile compounds by optimization of
fermentation conditions.
Results indicated S. boulardii is capable of fermenting sugars from beer wort, being a promising
yeast to beer production. The experiment focused on wort fermentation revealed that the
statistically most significant effect on volatile formation was the temperature. Overall, the
statistical model proved to be a useful tool in predicting the volatile formation by this non-brewery
yeast. Beers with higher amount of volatile compounds revealed to have more aroma.
Keywords: alcohol-free beer, medicinal beer, probiotics, Saccharomyces boulardii, volatile
compounds.

vi
vii
RESUMO
Saccharomyces boulardii é uma levedura com propriedades probióticas utilizada em diversos
medicamentos já comercializados ou suplementos alimentares. Por outro lado, cervejas sem
álcool (AFB) são uma fração atraente de mercado de cerveja. Desta forma, a produção de uma
"cerveja medicinal" capaz de fornecer benefícios para a saúde humana seria uma inovação
interessante considerando o mercado já existente.
O presente estudo concentra-se não só em testar a possibilidade de produção de cerveja com
propriedades probióticas, mas também na avaliação dos efeitos sensoriais que esta estirpe
produz no mosto de cerveja. Na primeira parte do estudo, testou-se o crescimento de S. boulardii
a diferentes temperaturas e meios de crescimento. Na segunda, foram analisadas 13 colunas de
fermentação sob diferentes parâmetros (extrato original, temperatura e pitching rate). Foi
monitorizada a quantidade de compostos voláteis em cada coluna, bem como o consumo de
açúcar e formação de etanol, usando GC e HPLC. O método de response surface foi utilizado
para melhorar a formação de compostos voláteis aromatizantes activos por optimização das
condições de fermentação.
Os resultados indicaram que a estirpe é capaz de fermentar os açúcares a partir do mosto de
cerveja, sendo uma estirpe promisora para produção de cerveja. O estudo relativo às colunas de
fermentação revelou que o efeito estatisticamente mais significativo na formação de voláteis foi
a temperatura. Em geral, o modelo estatístico provou ser uma ferramenta útil na previsão da
formação de compostos voláteis. Cervejas com maior quantidade de compostos voláteis
revelaram ter mais aroma.
Palavras-chave: cerveja medicinal, cerveja sem álcool, compostos voláteis, probióticos,
Saccharomyces boulardii.

viii
ix
TABLE OF CONTENTS
Acknowledgements ....................................................................................................... iii
Abstract…… ................................................................................................................. v
Resumo… .................................................................................................................... vii
Table of Contents ........................................................................................................ ix
List of Tables ............................................................................................................... xi
List of Figures ............................................................................................................. xiii
List of Abbreviations ................................................................................................... xv
1. Introduction and Problem Statement 1
1.1. Scope of the project and specific objectives ........................................................... 1
2. Literature Review 3
2.1. Probiotics ............................................................................................................. 3
2.1.1. Probiotic Microorganisms ................................................................................ 4
2.1.2. Target Sites of Action ...................................................................................... 5
2.1.3. Strain Survival ................................................................................................. 5
2.1.4. Delivery Mode ................................................................................................. 6
2.1.5. Human Target Groups..................................................................................... 7
2.1.6. Biological Effects of Probiotics ........................................................................ 8
2.2. Saccharomyces boulardii ................................................................................... 10
2.2.1. Genus Saccharomyces ................................................................................. 10
2.2.2. Taxonomy of S. boulardii ............................................................................... 11
2.2.3. Physiology and Growth Conditions ................................................................ 11
2.2.4. Probiotic Effect .............................................................................................. 13
2.3. Alcohol-Free and Alcoholic Beers ...................................................................... 14
2.3.1. Lager Beers .................................................................................................. 14
2.3.2. Alcohol-Free Beer Production ....................................................................... 15
2.3.3. Properties of Alcohol-Free Beer and Sensory Analysis ................................. 18
2.3.4. Esters and Higher Alcohols as active flavor compounds in beer .................... 19
3. Methodology 22
3.1. Microorganism ..................................................................................................... 22
3.2. Microbial Growth .................................................................................................. 22
3.2.1. Media Preparation .......................................................................................... 22
x
3.2.2. Inoculum Preparation ...................................................................................... 23
3.2.3. Cultivation ....................................................................................................... 24
3.3. Fermentation ........................................................................................................ 24
3.3.1. Fermentation Method ............................................................................... 24
3.3.2. Inoculum Preparation ............................................................................... 25
3.3.3. Experimental Design and Response Surface Methodology (RSM) ................. 25
3.4. Analytical Methods ............................................................................................... 27
3.4.1. Biomass Concentration ................................................................................... 27
3.4.2. Volatiles Analysis ............................................................................................ 28
3.4.3. Fermentable Sugars and Ethanol Analysis ..................................................... 28
3.4.4. Sensory Analysis ............................................................................................ 29
4. Results and Discussion 30
4.1. Biomass Growth in Simulated Wort ...................................................................... 30
4.1.1. Effect of Growth Temperature ......................................................................... 30
4.1.2. Biomass Growth in Presence of Ethanol ......................................................... 38
4.1.3. Biomass Growth in Presence of Iso-alpha Acids ............................................. 39
4.1.4. Biomass Growth on Lactose ........................................................................... 40
4.2. Fermentation of Wort ........................................................................................... 41
4.2.1. Fermentation columns trials ............................................................................ 41
4.2.2. Sensory Analysis ............................................................................................ 51
5. Conclusions 52
6. Future Perspectives 53
7. References 54
8. Appendices 58
8.1 Appendix A – Information about iso-alpha acids used .......................................... 58
8.2. Appendix B - Calculations to know when the fermentation should stop ................ 61
8.3. Appendix C – Sensory Analysis Form .................................................................. 62
8.4. Appendix D - Response Surface Designs: Why this Experimental Design?..........63
8.5. Appendix E – Results from ES and HA formation and Sugars consumption (RSM
and HPLC) .................................................................................................................. 65
xi
LIST OF TABLES
TABLE 1 - MICROORGANISMS CONSIDERED AS PROBIOTICS ............................................... 5
TABLE 2 - TAXONOMIC CLASSIFICATION OF SACCHAROMYCES BOULARDII ........................ 11
TABLE 3 - S. BOULARDII TOLERANCE TO ETHANOL (YEPD LIQUID MEDIUM, 30ᵒC, PH=5.5,
160 RPM) ............................................................................................................... 12
TABLE 4 – THRESHOLD VALUES OF MOST IMPORTANT ESTERS AND HIGHER ALCOHOLS
PRESENT IN LAGER BEERS USING SACCHAROMYCES SPP. AS FERMENTING YEAST ...... 19
TABLE 5 – YPG MEDIUM WITH GLUCOSE. ....................................................................... 22
TABLE 6 – YPG MEDIUM WITH GLUCOSE AND DEXTRIN. ................................................... 23
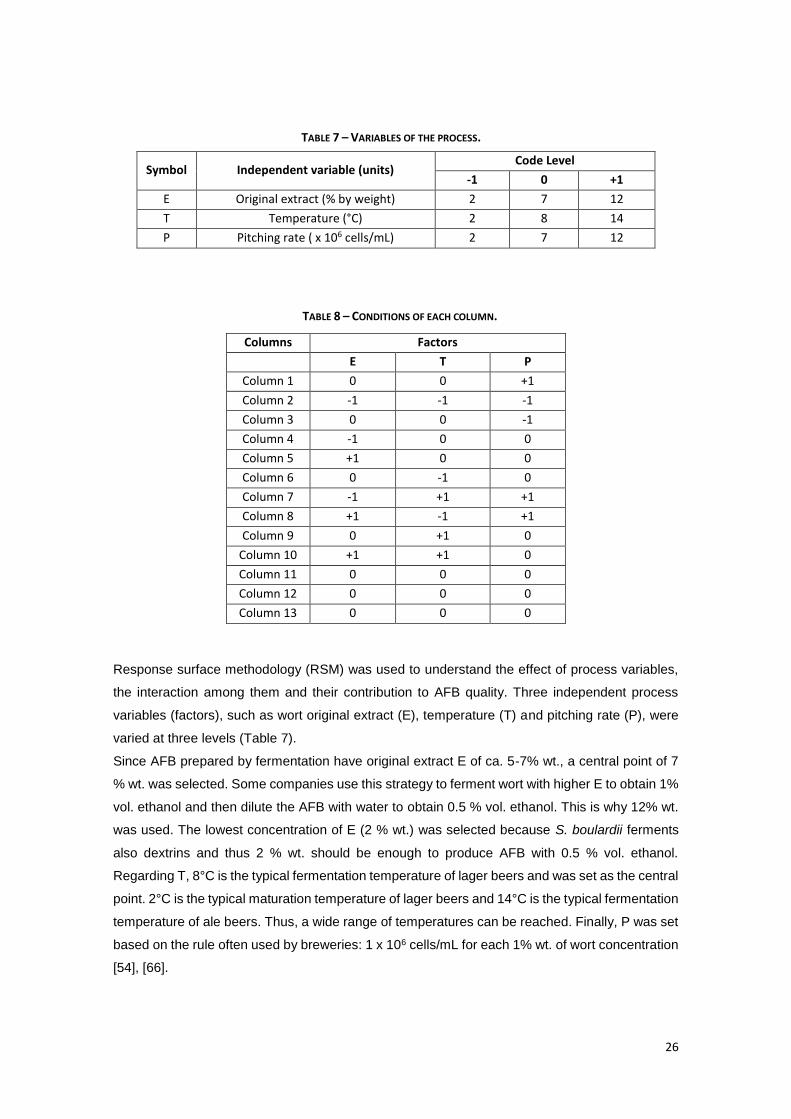
TABLE 7 – VARIABLES OF THE PROCESS. ........................................................................ 26
TABLE 8 – CONDITIONS OF EACH COLUMN. ..................................................................... 26
TABLE 9 - SPECIFIC GROWTH RATES AT 2°C. .................................................................. 31
TABLE 10 - SPECIFIC GROWTH RATES AT 8°C. ................................................................ 33
TABLE 11 - SPECIFIC GROWTH RATES AT 16ºC. .............................................................. 34
TABLE 12 - SPECIFIC GROWTH RATES AT 16°C (YPG MEDIUM WITH 30 G/L OF DEXTRIN). .. 35
TABLE 13 - ANOVA FOR RESPONSE SURFACE QUADRATIC MODEL OF ES FORMATION BY
SACCHAROMYCES BOULARDII. ................................................................................ 43
TABLE 14 - ANOVA FOR RESPONSE SURFACE QUADRATIC MODEL OF HA FORMATION BY
SACCHAROMYCES BOULARDII. ................................................................................ 43
TABLE 15 – OPTIMAL VARIABLE VALUES TO MAXIMIZE ES AND HA FORMATION. ................ 47
TABLE 16 – COMPARISON OF COLUMNS 4 AND 5 RESULTS. .............................................. 49
TABLE 17 - COMPARISON OF COLUMNS 1 AND 3 RESULTS................................................ 50
TABLE 18 – SENSORY EVALUATION OF AFB. .................................................................. 51

xii
xiii
LIST OF FIGURES
FIGURE 1 - MAJOR BENEFITS OF PROBIOTICS FOR HUMAN HEALTH AND NUTRITION ............. 4
FIGURE 2 - COMPARISON OF THE TOLERANCE OF DIFFERENT STRAINS OF S. CEREVISIAE IN
AN ACIDIC ENVIRONMENT ....................................................................................... 12
FIGURE 3 - S. BOULARDII CELLS DENSITY AT DIFFERENT PH. (YEPD LIQUID MEDIUM, 30ᵒC,
160 RPM) ............................................................................................................... 13
FIGURE 4 - SCHEME OF THE MOST COMMON ALCOHOL-FREE BEER PRODUCTION METHODS.
............................................................................................................................. 15
FIGURE 5 – THE EHLRICH PATHWAY AND THE MAIN GENES INVOLVED. .............................. 20
FIGURE 6 – CHEMICAL REACTIONS INVOLVED IN ACETATE ESTERS (A) AND ETHYL ESTERS
BIOSYNTHESIS (B) ................................................................................................ 21
FIGURE 7 – SCHEME OF EXPERIMENTS CARRIED OUT TO MONITOR THE GROWTH OF CELLS.
............................................................................................................................. 24
FIGURE 8 – SCALE CHOSEN TO EVALUATE EACH PARAMETER OF EACH SAMPLE. ............... 29
FIGURE 9 - GROWTH CURVE OF SACCHAROMYCES BOULARDII AT 0°C IN YPG MEDIUM WITH
GLUCOSE AND DEXTRIN (TABLE 6, SECTION 3.2.1.) ................................................... 30
FIGURE 10 - GROWTH CURVE OF SACCHAROMYCES BOULARDII AT 2°C IN YPG MEDIUM WITH
GLUCOSE (TABLE 5, SECTION 3.2.1.) ....................................................................... 31
FIGURE 11 - GROWTH CURVE OF SACCHAROMYCES BOULARDII AT 2°C IN YPG MEDIUM WITH
GLUCOSE AND DEXTRIN (TABLE 6, SECTION 3.2.1.) ................................................... 31
FIGURE 12 - GROWTH CURVE OF SACCHAROMYCES BOULARDII AT 8°C IN YPG MEDIUM WITH
GLUCOSE (TABLE 5, SECTION 3.2.1.) ....................................................................... 32
FIGURE 13 - GROWTH CURVE OF SACCHAROMYCES BOULARDII AT 8°C IN YPG MEDIUM WITH
GLUCOSE AND DEXTRIN (TABLE 6, SECTION 3.2.1.) ................................................... 32
FIGURE 14 - GROWTH CURVE OF SACCHAROMYCES BOULARDII AT 16°C IN YPG MEDIUM
WITH GLUCOSE (TABLE 5, SECTION 3.2.1.). .............................................................. 33
FIGURE 15 - GROWTH CURVE OF SACCHAROMYCES BOULARDII AT 16ᵒC IN YPG MEDIUM
WITH GLUCOSE AND DEXTRIN (TABLE 6, SECTION 3.2.1.) ........................................... 34
FIGURE 16 - GROWTH CURVE OF SACCHAROMYCES BOULARDII AT 16°C IN YPG MEDIUM
WITH DEXTRIN. ....................................................................................................... 35
FIGURE 17 - GROWTH CURVES OF SACCHAROMYCES BOULARDII AT 0°C, 2°C, 8°C AND
16°C IN YPG MEDIUM WITH GLUCOSE AND DEXTRIN. ................................................ 36
FIGURE 18 - GROWTH CURVES OF SACCHAROMYCES BOULARDII IN PRESENCE OF ETHANOL
AT 8°C IN YPG MEDIUM WITH GLUCOSE. .................................................................. 38
xiv
FIGURE 19 - GROWTH CURVES OF SACCHAROMYCES BOULARDII IN YPG MEDIUM WITH
GLUCOSE AT 8ᵒC IN PRESENCE OF DIFFERENT CONCENTRATIONS OF ISO-ALPHA ACIDS.
............................................................................................................................. 39
FIGURE 20 – GROWTH CURVES OF SACCHAROMYCES BOULARDII IN YPG MEDIUM WITH
LACTOSE AT 8ᵒC. .................................................................................................... 40
FIGURE 21 – TOTAL FERMENTABLE SUGARS CONSUMPTION IN EACH COLUMN DEPENDING ON
(E) ORIGINAL EXTRACT - % WT. T – TEMPERATURE (ᵒC), P – PITCHING RATE (X 106
CELLS/ML). NUMBERS REPRESENT THE NUMBER OF THE COLUMN STUDIED. ............... 41
FIGURE 22 - RESPONSE SURFACE PLOTS OF THE 3 DIFFERENT INDEPENDENT VARIABLES
AND THEIR EFFECTS ON THE FORMATION OF ESTERS BY SACCHAROMYCES BOULARDII.45
FIGURE 23 - RESPONSE SURFACE PLOTS OF THE 3 DIFFERENT INDEPENDENT VARIABLES
AND THEIR EFFECTS ON THE FORMATION OF HIGHER ALCOHOLS BY SACCHAROMYCES
BOULARDII. ............................................................................................................ 46

xv
LIST OF ABBREVIATIONS
3D Three dimensional space
ᵒC Degrees Celsius (Temperature)
µ Specific growth rate (h-1)
amu Atomic Mass unit
rpm Rotations per minute
mL Mililiter
MPa Mega Pascal
ABV Alcohol by volume
AFB Alcohol Free Beer
ATF Acetyltransferase
BATH Bacterial Adherence to Hydrocarbons
CCD Central Composit Design
CCP Cold Contact Process
CO2 Carbon Dioxide
E Original Extract (% wt.)
EFFCA European Food and Feed Cultures Association
ES Total Esters
FAO Food and Agriculture Organization
GC-MS Gas Chromatography – Mass Spectrometry
GI Gastrointestinal
HA Total Higher Alcohols
HPLC High Performance Liquid Chromatography
HS-SPME Headspace – Solid Phase Microextraction
IgA Immunoglobulin A
ILSI International Life Sciences
KNO3 Potassium Nitrate
LAB Low Alcohol Beer
NaCl Sodium Cloride

xvi
(NH4)2SO4 Ammonium Sulfate
OD Optical Density
P Pitching Rate (x106 cells/mL)
RSM Response Surface Methodology
T Temperature (ᵒC)
WHO World Health Organization
YPG Yeast extract-Peptone-Glucose

1
1. INTRODUCTION AND PROBLEM STATEMENT
Since the early times beer is recognized as one of the most wanted products among beverages.
To face the market competition and to match the society needs, in the latest years brewers started
making efforts to expand the assortment of products. Therefore, it is possible today to find several
different types of beer with different characteristics, for instance alcohol-free beers, functional
beers, low-calorie beers or flavored beers [1] .
One possibility of new product development is the use of non-traditional microorganisms
throughout the fermentation process in order to create a functional beer with medicinal properties.
One such group of non-traditional microorganisms are probiotics, known by its significant human
health benefits when consumed. These benefits are related typically with improvements in the
host immune system and with the balance/maintenance of intestinal microflora [2].
In order to have a functional beer with probiotic properties many different microorganisms can be
used to ferment the wort. Bacteria such as Bifidobacterium bifidum, Lactobacillus acidophilus,
Lactobacillus casei Shitota and yeast Saccharomyces boulardii are some examples.
The yeast Saccharomyces cerevisiae var. boulardii has long been known effective for treating
gastroenteritis. It was discovered in 1920 and is commercially available since 1964. Although
previously the effectiveness of medications with S. boulardii was only based on empirical
knowledge, this efficiency on human health was confirmed from trials performed in the US [3], [4].
Regarding this matter, Saccharomyces boulardii was chosen as fermenting yeast in this work.
Although this yeast is known for its pharmaceutical benefits and is already commercialized as a
medicine or a food supplement, little is known about the ability of this yeast to ferment wort. The
aim of this project is not only to study the possibility of creating an alcohol-free beer by using this
yeast, providing the consumers a new beer option, but also to understand the effects that this
yeast would have on the sensory properties of beer.
1.1. SCOPE OF THE PROJECT AND SPECIFIC OBJECTIVES
This project was conducted in the University of Chemistry and Technology of Prague, during 6
months, under the supervision of Prof. Tomás Brányik.
The project was implemented in two different phases. The first phase was based on the study of
the growth conditions of S. boulardii. The influence of the temperature and different carbon
sources on growth rates was monitored. Moreover, the tolerance of S. boulardii towards ethanol,
hop compounds and lactose was evaluated.

2
In the second phase, the effect of fermentation conditions on formation of sensory active
compounds (esters and higher alcohols) was tested. The fermentations were carried out at a lab
scale in fermentation columns and the wort was prepared from wort concentrate.
Limited fermentation strategy was used to constrain the fermentation with the objective of
producing an alcohol-free beer.
From each column, fermentation products were analyzed. Esters and higher alcohols were
analyzed using GC and RSM and fermentable sugars consumption was analyzed by HPLC.
Finally, selected beers were chosen, after maturation, to sensory analysis.
3
2. LITERATURE REVIEW
2.1. PROBIOTICS
Originally defined as “…microorganisms promoting the growth of other microorganisms” [5], many
similar definitions of probiotics have been released from different organizations during the last
years. According to Food and Agriculture Organization (FAO), World Health Organization (WHO),
International Life Sciences (ILSI) and European Food and Feed Cultures Association (EFFCA),
probiotics have been defined as live microorganisms which when administrated in adequate
amounts confer a health benefit to the host [6].
In 2002, an association between research groups from FAO and WHO released a guideline for
evaluate probiotics in food. Four minimum requirements resulted from the experiments to consider
a specific microorganism to be probiotic [6]:
assessment of strain identity (genus, species, strain level);
in vitro tests to screen potential probiotics: e.g. resistance to gastric acidity, bile acid, and
digestive enzymes, antimicrobial activity against potentially pathogenic bacteria;
safety assessment: requirements for proof that a candidate probiotic strain is safe and
without contamination in its delivery form;
in vivo studies for substantiation of the health effects in the target host.
However, the science and studies related to probiotics are recent, and always in constant
evolution. Despite that definition, there are many questions regarding this matter that do not have
answers yet. For instance, it is not specified the delivery mode of the probiotic nor if there are
some specific requirements regarding the mode of action in the human body. A definition stating
that a probiotic must survive gastrointestinal tract transit or have an impact on normal microflora
is too restrictive and thus, the survival through all the gastrointestinal should not be a prerequisite.
This question comes from the case of the delivery of the lactase through administration of live
Streptococcus thermophilus to the small intestine. This can be considered as a probiotic activity,
although the bacterial strain itself does not survive in the digestive tract [7].
Thus, when considering probiotics functionality, the abovementioned definition of probiotics has
to be interpreted in a very broad way. This complicates the functional characterization of
probiotics. For example, the use of probiotics may target many different sites of the human body
(mouth, respiratory tract, urinary tract, gastrointestinal (GI) tract, vagina, etc), and its application
can also target specific human subpopulations: children, elderly, healthy individuals, ill subjects,
among others. There is also a diverse range of potential biological effects and new functional
activities are constantly being explored [6].
4
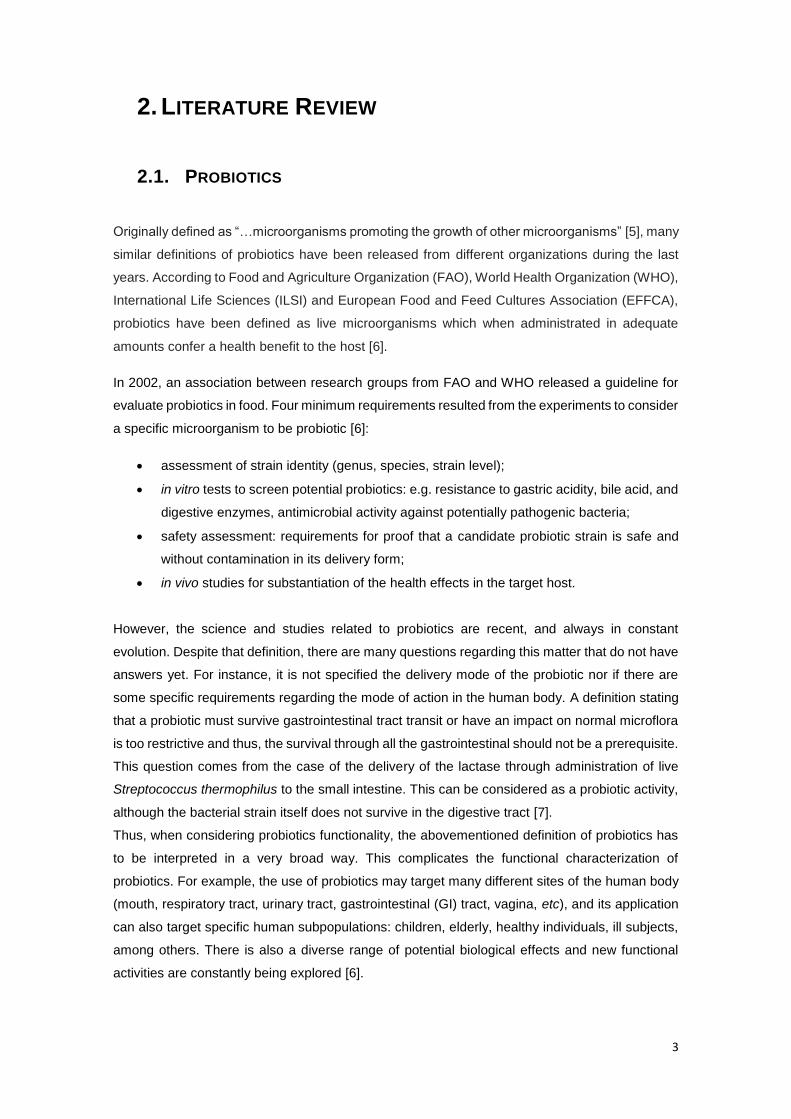
The benefits of these microorganisms are countless. Among them, the protection and treatment
of diarrhea and the expansion of the immune system can be highlighted. In Figure 1, all of the
benefits that probiotics can provide are represented.
FIGURE 1 - MAJOR BENEFITS OF PROBIOTICS FOR HUMAN HEALTH AND NUTRITION [2].
2.1.1. PROBIOTIC MICROORGANISMS
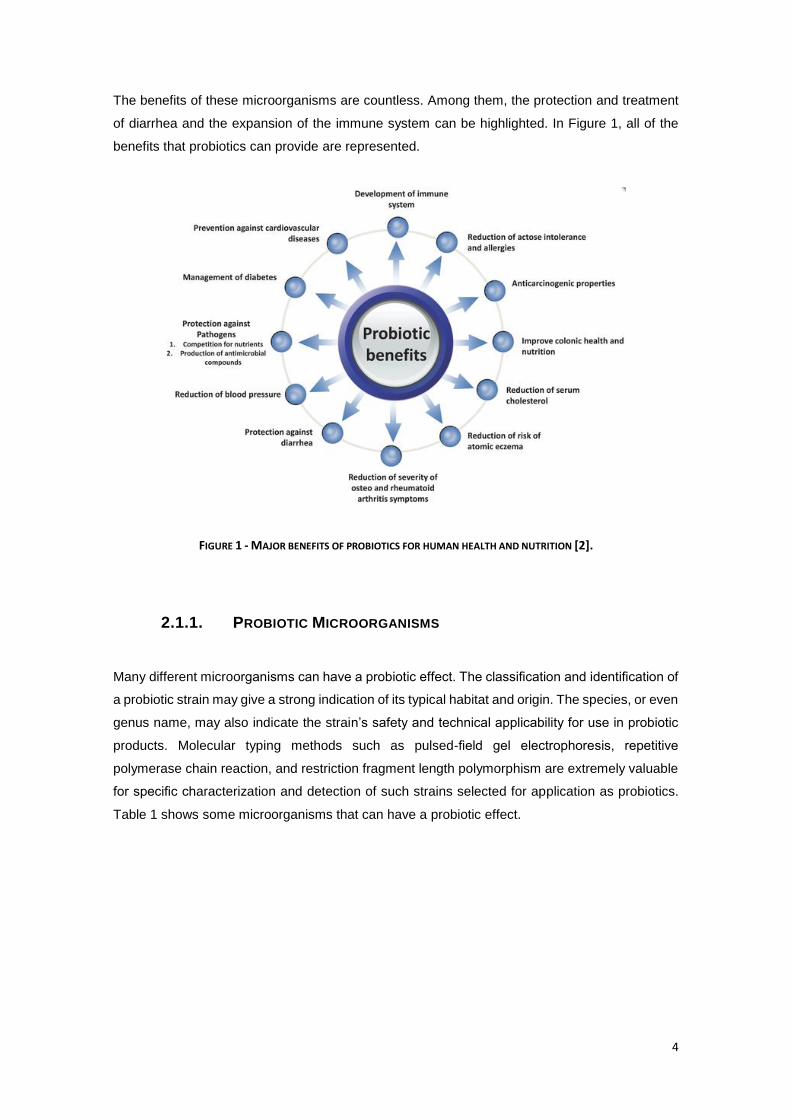
Many different microorganisms can have a probiotic effect. The classification and identification of
a probiotic strain may give a strong indication of its typical habitat and origin. The species, or even
genus name, may also indicate the strain’s safety and technical applicability for use in probiotic
products. Molecular typing methods such as pulsed-field gel electrophoresis, repetitive
polymerase chain reaction, and restriction fragment length polymorphism are extremely valuable
for specific characterization and detection of such strains selected for application as probiotics.
Table 1 shows some microorganisms that can have a probiotic effect.
5
[8].
2 Main application for animals 3 Applied mainly as pharmaceutical preparations 4 There is either little known about the probiotic properties or the microorganism is nonprobiotic 5 Probably synonymous with B. animalis
2.1.2. TARGET SITES OF ACTION
Probiotic microorganisms can act in many differents places in the human body such as the mouth,
the urogenital tract, the skin and in oral medicine and dentistry [9], [10]. Also, probiotics are known
to control and prevent infections in the urinary and reproductive tract [11], [12], [13], [14].
Regarding the skin applications, probiotics can be consumed orally to control skin inflammation
[15] and dermatological diseases in general [16]. Another application of these microorganisms is
in the respiratory tract to control respiratory infections [17].
Despite of all abovementioned applications the most important body site where probiotics have
influence is in the GI tract.There is a wide range of probiotic strains and applications available in
the GI tract as target site. These applications aim to provide several health benefits such as
control and decrease of pathogenic colonization, optimization of the intestinal transit, improving
vitamins synthesis, alleviating the lactose intolerance, promoting immunemodulatory effects and
reducing bloating, among others [6].
2.1.3. STRAIN SURVIVAL
There are some stress factors to have into account when considering strain survival conditions.
In many cases, health benefits are only obtained when a probiotic strain reaches the target site
in a metabolically active state and in sufficient numbers. In the case of oral delivery, probiotics
have to survive over the physicochemical, enzymatic and microbial conditions throughout the GI
transit.
TABLE 1 - MICROORGANISMS CONSIDERED AS PROBIOTICS
6
The first barrier to overcome is the acidic environment in the stomach. At this moment, the
absence or presence of a food matrix determines significantly the pH profile that the probiotic
microorganism can support. Despite of the food matrix can act as a pH buffer for the probiotics
providing a larger range of survival pH, a longer digestion time in the stomach may subject part
of the probiotic microorganisms to acidic conditions. Thus, it is necessary to wisely select the
strain and choose the ones with higher resistance under such conditions. New metodologies are
available to encapsulate probiotic strains for this purpose [18].
Another stress condition to consider is the presence of bile salts. These salts have an amphiphilic
character what exert membrane compromising properties towards microorganisms. The solution
to overcome this problem is via bile salt hydrolase. Bile salt hydrolase bacteria typically cleave
the glycin or taurin moiety from conjugated bile salts, rendering the latter less bacteriostatic. This
feature is of particular importance to optimize strain survival during intestinal transit and has been
proposed as a mechanism to explain how probiotics could lower cholesterol levels [19].
Finally, another feature of probiotic strain survival is the ability to colonize the GI tract. This feature
depends on two different factors: the competition of the specific strain against microbial
communities that already exist in the GI tract; and the ability of the strain to adhere and thrive the
mucus surface that covers the gut epithelium. After a probiotic organism has survived gastric acid
and duodenal bile salts, it reaches the ileum and colon, and it has the possibility to develop in a
less severe environment. However, this new environment is rich in different microorganisms
(ileum and colon bacterial concentrations are up to 107 and 1011 cells/mL of chyme, respectively).
Once the probiotic strain is considered a foreing microorganism to the GI tract and unless specific
substrates are provided, the strain would have to compete with the residing microflora for
available substrates. Thus, the dosed probiotic strain should occupy a functional niche in the gut
microbial ecosystem. This is only possible if the probiotic strain has the capacity to adhere and
grow on the gut wall. This characteristic relies on cells wall properties.The hydrophobic nature of
microbial strain can be assessed with a straightforward BATH assay, while a specific mucus
adhesion can be measured using short term adhesion assays with gut-derived mucins [20], [6].
2.1.4. DELIVERY MODE
The most studied and known delivery mode of probiotics is oral, being known as the most
effective. This method includes the introduction of probiotics in conventional food products such
as milk [21], kefir [22], [23], yoghurts or in more specific matrices such as cereals, cheese,
sausages and cookies. These matrices provide an optimal strain survival along the GI tract [21].
Recently, a chocolate matrix has been used wich results in a more optimal survival of the probiotic
strains when compared with the conventional methods of delivery [24]. Obviously, many
probiotics are introduced in food products for commercial reasons, to integrate and compete in
7
probiotics market or to obtain a better product placement. Some examples are fruit juices, granola
bars, ice creams and candies [6].
Besides the incorpration of the probiotics in food products, probiotic strains are also provided as
food suplements, often targeting specific diseases. For example, to face pediatric gastroentritis
strains as L. rhamnosus and L. reuteri are used as food suplements and S. boulardii as medication
[6].
Another delivery mode is the introduction of probiotics in the formulation of ointments and nasal
sprays [23]. Also the use of probiotics in mattresses and cleaning detergents is now a reality in
order to optimize hygienic control [6].
2.1.5. HUMAN TARGET GROUPS
Probiotics are used in a wide range of health claims: they can target both healthy and ill
individuals, their effects can have a preventive or a treatment nature and the goal can be to fight
the cause of a disease or just lessen the symptoms associated with the progression of a disease
or metabolic alteration.
As the main and principal objective of probiotics is to improve human health, the intake of a
probiotic strain by healthy individuals has primarily preventive objectives. However, the
introduction of a foreign strain – even if it is a probiotic – has to be approched with care and must
be performed after a well-considered evaluation of the situation. When applied to the gut of
sensitive human subpopulations such as children, for example, probiotics have to be handled with
extra attention once their gut environment undergoes a high degree of development and
transition.
Many studies have shown beneficial effects in all age-related subgroups, such as newborns,
preterm infants, older children, mother-infant pairs, infants and eldery people [6]. For example,
fermented milk drinks with L. casei strain Shirota positively stimulate the imune system in healthy
human subjects [25]. To study the effects of long term consumption of these probiotic milks in
different age groups on infections, a group of children daily attending a day care centre was
monotorized [26]. Also, with the same objective L delbueckii subsp. bulgaricus OLL1073R-1 was
given to eldery people to reduce the risk of infection [27].
Another example of probiotics admnistration is when the microbial community of a specific body
region is disturbed, leading to dysbiosis, which happens when an altered pathogenic bacteria
becomes available in the ecosystem. This perturbation of the ecosystem often happens in the
mouth associated with dental caries or dysbiosis associated with bacterial vaginosis [6]. There
are recent reviews claiming that a long term application of probiotics strains such as L.
rhamnosus GG lowered the risk of dental caries in children [28]. However, there is the need to
8
improve and develop more probotic concepts for children under modified risks, once their bodies
are in constant development.
2.1.6. BIOLOGICAL EFFECTS OF PROBIOTICS
MICROBIOLOGICAL FUNCTIONALITY
The main objectives of microbiological interventions through probiotics may be to stabilize and
improve the microbial homeostasis and to lower pathogen invasion and colonization. The
resilience of a microbial community against invasion of exogenous strains depends on the
availability of non-occupied functional niches. If not all the functional niches are occupied for the
endogenous microbial community, there is a risk of being invaded by some pathogen community.
This microbiological activity from probiotic microorganisms can happen in two different scenarios.
The first one is based in the occupation of the available niches from probiotic strains that are left
open for the endogenous community. If the niche is occupied first by the probiotic strain,
pathogenic strains will not have available places. Thus, this process is often referred as
competitive exclusion.
In the second scenario probiotics lower pathogenic invasion and development actively. This
approach is constituted by 3 steps. In the first one there is a production of short chain of fatty
acids and other organic acids by the probiotic strain, providing lower pH and increasing the
bacteriostatic effect of organic acids towards pathogens; the second step is the production of
bacteriocins, small microbial peptides with bacteriostatic or bactericidal activity; the final step is
the production of reactive oxygen species which can be highly reactive and increase oxidative
stress for pathogens. An example of these compounds is hydrogen peroxide [6].
NUTRITIONAL FUNCTIONALITY
Many different microbial groups produce vitamins in the human host [6]. This type of activity may
affect positively or negatively the host health and probiotic strains can act as a solution. Vitamin
K [29], vitamin B12 [30], pyridoxine [31], biotin and thiamine are examples of vitamins that can be
produced by gut microorganisms.
As an example of probiotic nutritional functionality, may be mentioned that towards lactose
intolerance. A lactase deficiency in the organism causes lactose intolerance which can result in
abdominal cramping, bloating and nausea. Probiotic strains that are lactase-positive have been
successfully added to the hosts organism in order to relieve the discomfort caused by the lactose
intolerance [32].
9
Another nutritional functionality may include the production of health-promoting compounds by
probiotic. When there is an insufficient production of these compounds in the gut, one solution to
consider is the use of probiotic strains to do it. For instance, the production of linoleic acid has
been reported for Bifidobacterium strains [33], L. plantarum JCM 1551 [34] and some strains of
L. acidophilus [35].
PHYSIOLOGICAL FUNCTIONALITY
The most important physiological function of probiotics is to enhance the GI transit, which is the
more common application for elderly people. Other potential physiological functions may be the
reduction of bloating and gas production by probiotics, and the enhancement of ion absorption by
intestinal epithelial cells [36], the decrease of bile salt toxicity and finally the decrease of serum
cholesterol levels by bile salt hydrolase positive probiotics [37], [38].
IMMUNOLOGICAL FUNCTIONALITY
Regarding the immunological effects, the benefits from the probiotics can be due to activation of
local macrophages and modulation of IgA production locally and systemically, changes in
pro/anti-inflammatory cytokine profiles, or modulation of response towards food antigens [39],
[40].
LOWERING THE DETRIMENTAL COMPONENTS IN THE GUT
Probiotics can also be applied to reduce the risks from dangerous components presents in the
human organism. The mode of action relates to the sorption of the hazardous compounds by the
microbial biomass. This is the case for aflatoxin B1, which has been shown that can be bound to
probiotic strains in vitro [41]. Further experiments need to be carried out to confirm this effect in
vivo.
10
2.2. SACCHAROMYCES BOULARDII
Yeasts are a large and heterogeneous group of microorganisms that has traditionally been
attracting attention from scientists and industry. Diverse and numerous biological activities make
them promising candidates for a wide range of applications not limited to the food sector.
While the design of foods containing probiotics has focused primarly on Lactobacillus and
Bifidobacterium, the yeast Saccharomyces cerevisiae var. boulardii has long been known
effective for treating gastroenteritis. It was discovered by the french Henri Boulard in 1920, in
Indochina, and first isolated from litchi fruit. Being commercially available since 1964 in a
lyophilized form and patented by the French company Laboratoires Biocodex, has been mainly
used to treat diarrhea induced by the use of antibiotics. Since then, this strain has expanded
through other products in many countries in Europe, Africa and Americas. Although previously
the effectiveness of medications with S. boulardii was only based on empirical knowledge, this
efficiency on human health was confirmed from trials performed in the US [3], [4].
2.2.1. GENUS SACCHAROMYCES
This genus of yeast is one of the most important and with a wide range of members.
Saccharomyces form normally oval or slightly long cells with a 6-10 microns of length and 5-8
microns of width.
The major application of Saccharomyces yeasts is in food industry. Due to its high growth rate,
these microorganisms may serve as a food supplement or as dietary supplement since they
contain vitamins B. Also, these yeasts are extensively used in production of alcoholic beverages
(beer, wine and spirituous drinks) for their metabolic properties.
As a result of sexual reproduction, spores – or ascospores are formed. This sporulation only
happens in absence of fermentable sugars, under aerobic metabolism. Examples of these
fermentable sugars are glucose, galactose, maltose and saccharose.
Brewing yeasts are polyploid and belong to the Saccharomyces genus. The strains used
industrially have usually reduced sporulation. The brewing strains can be classified into two
groups: the ale strains and the lager strains. Lager strains are hybrid strains of S.
cerevisiae and S. eubayanus and are often referred to as bottom fermenting yeasts. In contrast,
ale strains are referred to as top fermenting strains, reflecting their separation characteristics in
fermenters. The two species differ in a number of ways, including their response to temperature,
sugar transport and use and formation of flavor active compounds [4], [42].
11
2.2.2. TAXONOMY OF S. BOULARDII
According to taxonomic studies based on DNA analysis, S. boulardii and S. cerevisiae are
members of the same species, being S. boulardii a strain of S. cerevisiae [4], [42]. Nevertheless,
these two strains differ mainly metabolically and physiologically. S. boulardii is characterized by
a specific microsatellite allele and recent studies showed that its genome presents trisomy of the
chromosome 9, altered copy numbers of genes potentially contributing to the increased growth
rate and a better survival in acidic environment [4], [43]. The taxonomic classification is given in
Table 2.
TABLE 2 - TAXONOMIC CLASSIFICATION OF SACCHAROMYCES BOULARDII [44].
Species Saccharomyces cerevisiae
Genus Saccharomyces
Family Saccharomycetaceae
Order Saccharomycetales
Class Saccharomycetes
Phylum Ascomycota
Subphylum Saccharomycotina
Kingdom Fungi
2.2.3. PHYSIOLOGY AND GROWTH CONDITIONS
As mentioned above, Saccharomyces boulardii genotype is identical to Saccharomyces
cerevisiae. However, some of the crucial physiological properties needed for an efficient probiotic
effect are different in these two yeasts, for instance the survival conditions in the digestive system.
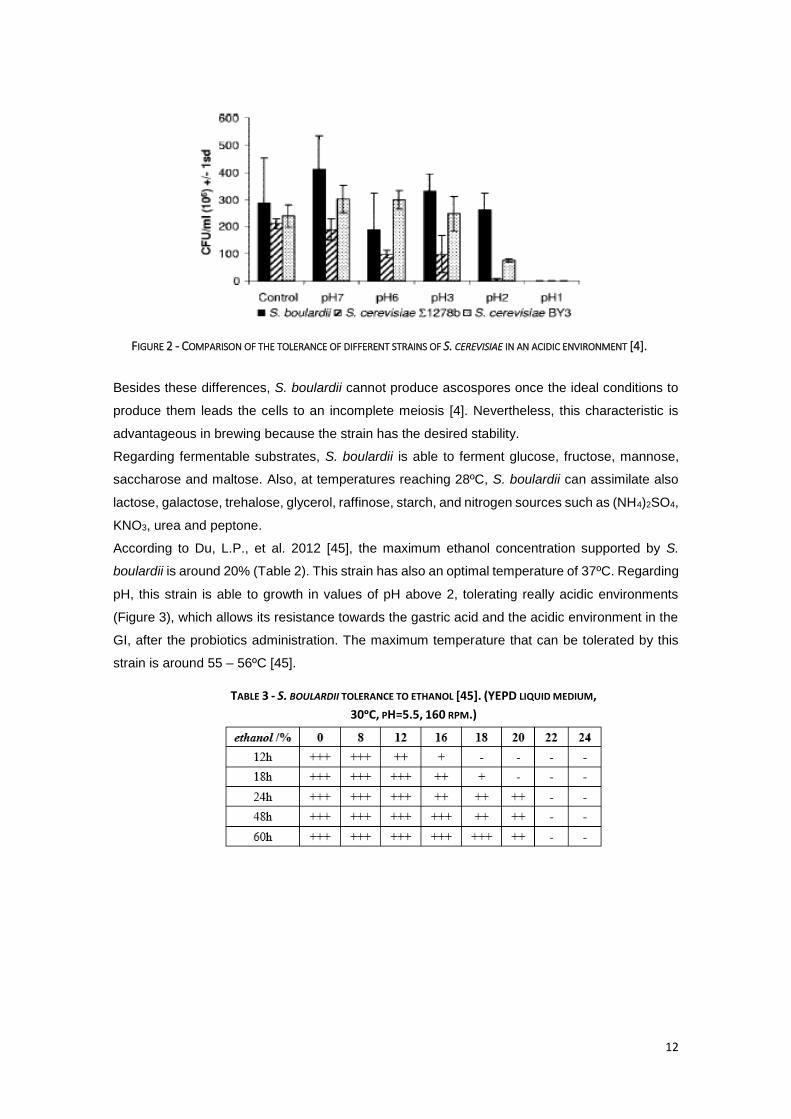
An interesting feature of this strain of S. cerevisiae is that it survives substantially better in an acid
pH when compared with other strains (Figure 2). Also, the enhanced ability for pseudohyphal
growth in response to nitrogen limitation leads S. boulardii to the success in acting as a probiotic.
This pseudohyphal growth allows a better penetration in the lining of the GI tract, improving the
cells mobility [4].
12
Besides these differences, S. boulardii cannot produce ascospores once the ideal conditions to
produce them leads the cells to an incomplete meiosis [4]. Nevertheless, this characteristic is
advantageous in brewing because the strain has the desired stability.
Regarding fermentable substrates, S. boulardii is able to ferment glucose, fructose, mannose,
saccharose and maltose. Also, at temperatures reaching 28ºC, S. boulardii can assimilate also
lactose, galactose, trehalose, glycerol, raffinose, starch, and nitrogen sources such as (NH4)2SO4,
KNO3, urea and peptone.
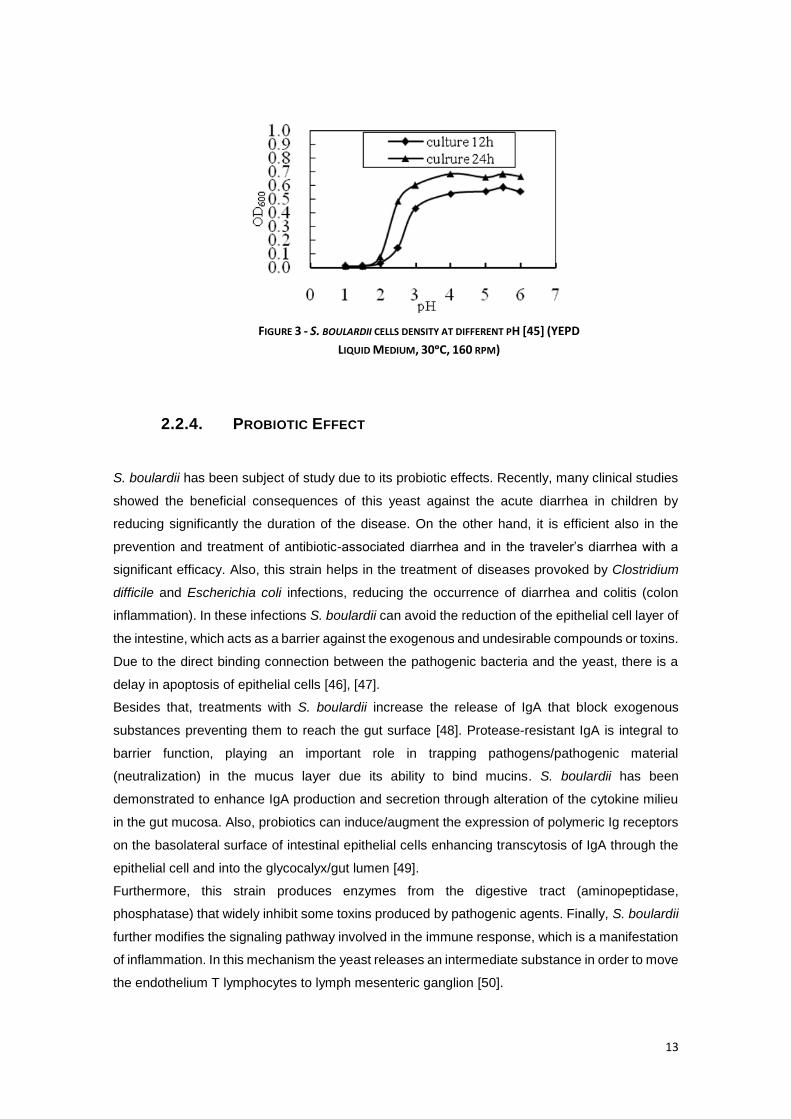
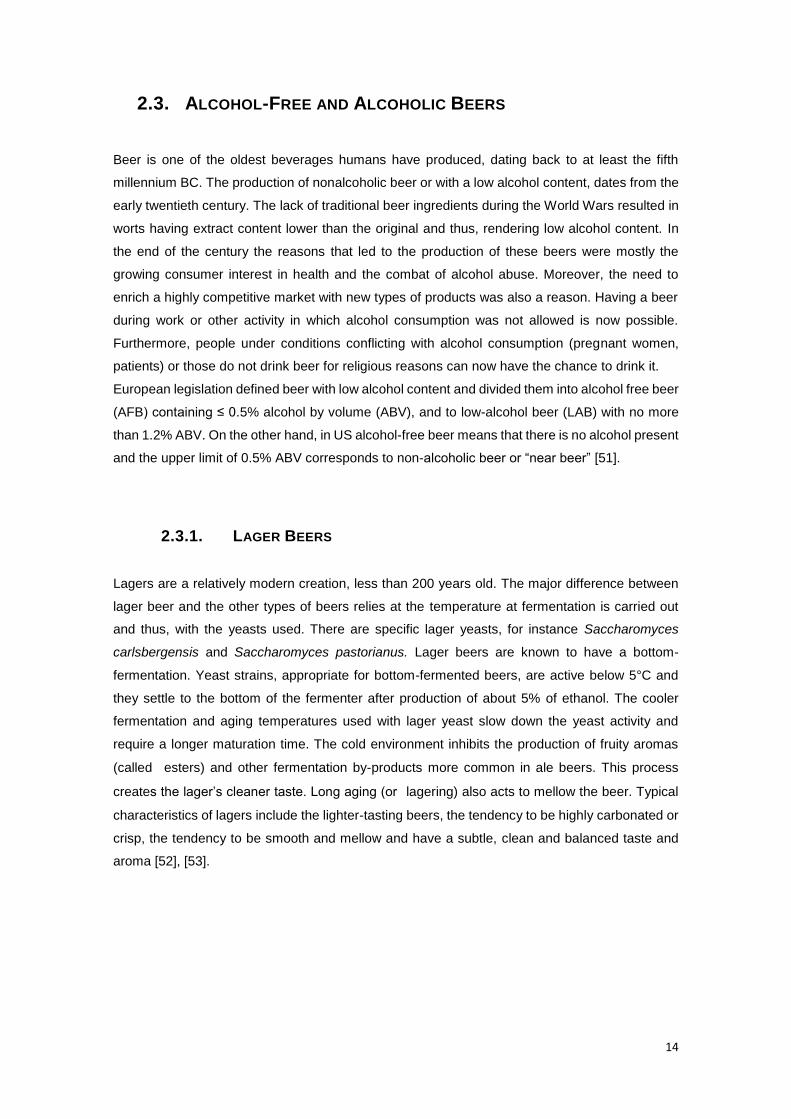
According to Du, L.P., et al. 2012 [45], the maximum ethanol concentration supported by S.
boulardii is around 20% (Table 2). This strain has also an optimal temperature of 37ºC. Regarding
pH, this strain is able to growth in values of pH above 2, tolerating really acidic environments
(Figure 3), which allows its resistance towards the gastric acid and the acidic environment in the
GI, after the probiotics administration. The maximum temperature that can be tolerated by this
strain is around 55 – 56ºC [45].
FIGURE 2 - COMPARISON OF THE TOLERANCE OF DIFFERENT STRAINS OF S. CEREVISIAE IN AN ACIDIC ENVIRONMENT [4].
TABLE 3 - S. BOULARDII TOLERANCE TO ETHANOL [45]. (YEPD LIQUID MEDIUM,
30ᵒC, PH=5.5, 160 RPM.)
13
2.2.4. PROBIOTIC EFFECT
S. boulardii has been subject of study due to its probiotic effects. Recently, many clinical studies
showed the beneficial consequences of this yeast against the acute diarrhea in children by
reducing significantly the duration of the disease. On the other hand, it is efficient also in the
prevention and treatment of antibiotic-associated diarrhea and in the traveler’s diarrhea with a
significant efficacy. Also, this strain helps in the treatment of diseases provoked by Clostridium
difficile and Escherichia coli infections, reducing the occurrence of diarrhea and colitis (colon
inflammation). In these infections S. boulardii can avoid the reduction of the epithelial cell layer of
the intestine, which acts as a barrier against the exogenous and undesirable compounds or toxins.
Due to the direct binding connection between the pathogenic bacteria and the yeast, there is a
delay in apoptosis of epithelial cells [46], [47].
Besides that, treatments with S. boulardii increase the release of IgA that block exogenous
substances preventing them to reach the gut surface [48]. Protease-resistant IgA is integral to
barrier function, playing an important role in trapping pathogens/pathogenic material
(neutralization) in the mucus layer due its ability to bind mucins. S. boulardii has been
demonstrated to enhance IgA production and secretion through alteration of the cytokine milieu
in the gut mucosa. Also, probiotics can induce/augment the expression of polymeric Ig receptors
on the basolateral surface of intestinal epithelial cells enhancing transcytosis of IgA through the
epithelial cell and into the glycocalyx/gut lumen [49].
Furthermore, this strain produces enzymes from the digestive tract (aminopeptidase,
phosphatase) that widely inhibit some toxins produced by pathogenic agents. Finally, S. boulardii
further modifies the signaling pathway involved in the immune response, which is a manifestation
of inflammation. In this mechanism the yeast releases an intermediate substance in order to move
the endothelium T lymphocytes to lymph mesenteric ganglion [50].
FIGURE 3 - S. BOULARDII CELLS DENSITY AT DIFFERENT PH [45] (YEPD
LIQUID MEDIUM, 30ᵒC, 160 RPM)
14
2.3. ALCOHOL-FREE AND ALCOHOLIC BEERS
Beer is one of the oldest beverages humans have produced, dating back to at least the fifth
millennium BC. The production of nonalcoholic beer or with a low alcohol content, dates from the
early twentieth century. The lack of traditional beer ingredients during the World Wars resulted in
worts having extract content lower than the original and thus, rendering low alcohol content. In
the end of the century the reasons that led to the production of these beers were mostly the
growing consumer interest in health and the combat of alcohol abuse. Moreover, the need to
enrich a highly competitive market with new types of products was also a reason. Having a beer
during work or other activity in which alcohol consumption was not allowed is now possible.
Furthermore, people under conditions conflicting with alcohol consumption (pregnant women,
patients) or those do not drink beer for religious reasons can now have the chance to drink it.
European legislation defined beer with low alcohol content and divided them into alcohol free beer
(AFB) containing ≤ 0.5% alcohol by volume (ABV), and to low-alcohol beer (LAB) with no more
than 1.2% ABV. On the other hand, in US alcohol-free beer means that there is no alcohol present
and the upper limit of 0.5% ABV corresponds to non-alcoholic beer or “near beer” [51].
2.3.1. LAGER BEERS
Lagers are a relatively modern creation, less than 200 years old. The major difference between
lager beer and the other types of beers relies at the temperature at fermentation is carried out
and thus, with the yeasts used. There are specific lager yeasts, for instance Saccharomyces
carlsbergensis and Saccharomyces pastorianus. Lager beers are known to have a bottom-
fermentation. Yeast strains, appropriate for bottom-fermented beers, are active below 5°C and
they settle to the bottom of the fermenter after production of about 5% of ethanol. The cooler
fermentation and aging temperatures used with lager yeast slow down the yeast activity and
require a longer maturation time. The cold environment inhibits the production of fruity aromas
(called esters) and other fermentation by-products more common in ale beers. This process
creates the lager’s cleaner taste. Long aging (or lagering) also acts to mellow the beer. Typical
characteristics of lagers include the lighter-tasting beers, the tendency to be highly carbonated or
crisp, the tendency to be smooth and mellow and have a subtle, clean and balanced taste and
aroma [52], [53].
15
2.3.2. ALCOHOL-FREE BEER PRODUCTION
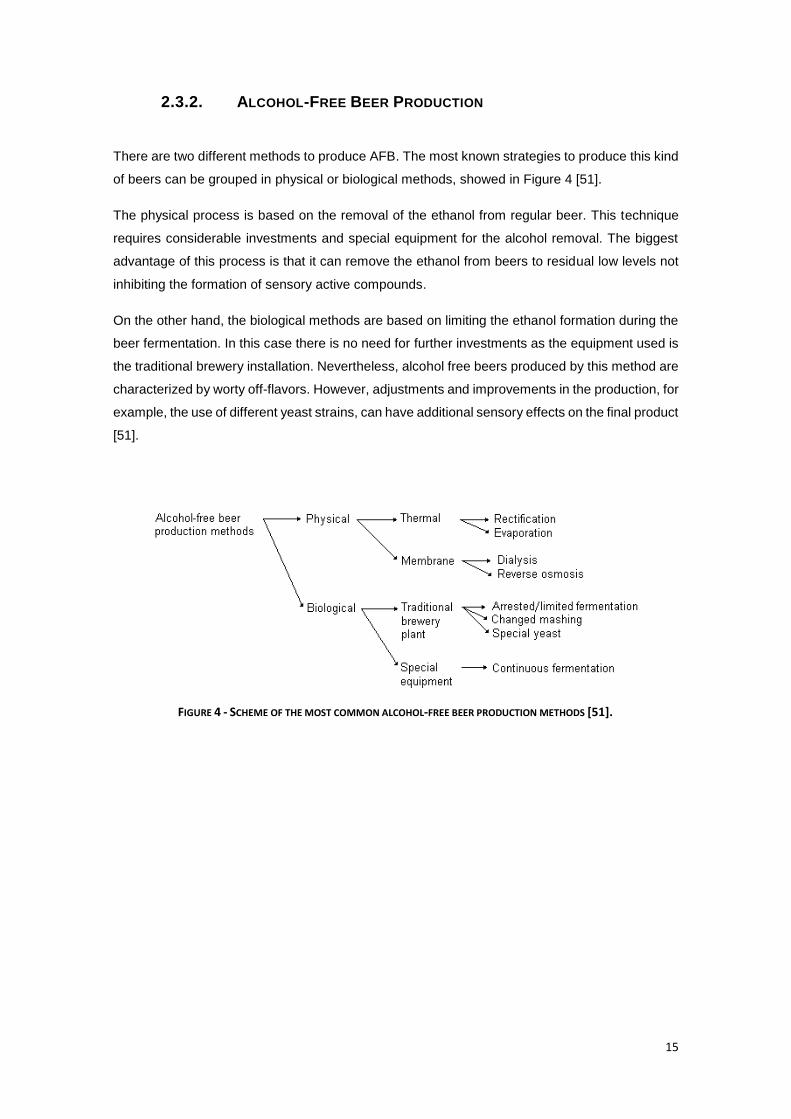
There are two different methods to produce AFB. The most known strategies to produce this kind
of beers can be grouped in physical or biological methods, showed in Figure 4 [51].
The physical process is based on the removal of the ethanol from regular beer. This technique
requires considerable investments and special equipment for the alcohol removal. The biggest
advantage of this process is that it can remove the ethanol from beers to residual low levels not
inhibiting the formation of sensory active compounds.
On the other hand, the biological methods are based on limiting the ethanol formation during the
beer fermentation. In this case there is no need for further investments as the equipment used is
the traditional brewery installation. Nevertheless, alcohol free beers produced by this method are
characterized by worty off-flavors. However, adjustments and improvements in the production, for
example, the use of different yeast strains, can have additional sensory effects on the final product
[51].
FIGURE 4 - SCHEME OF THE MOST COMMON ALCOHOL-FREE BEER PRODUCTION METHODS [51].
16
PHYSICAL METHODS
The physical methods are divided into thermal and membrane processes. Commonly used
methods are vacuum distillation, vacuum evaporation, dialysis and reverse osmosis. Besides
these methods, others have been tested in laboratories. For instance, membrane extraction,
supercritical CO2 extraction, pervaporation, adsorption on hydrophobic zeolites and freeze
concentration.
In the case of the thermal processes a reduced pressure must be used so that the alcohol can be
separated at a lower temperature and thus, the loss of aromatic and flavor compounds is
minimized.
Vacuum distillation is the most used method with temperatures around 30-45º C. Firstly there is
a preheating of the filtered alcoholic beer in a plate heat exchanger. After there is the degassing
of the beer and the simultaneous liberation of the volatile compounds in a vacuum degasser. This
is followed by dealcoholization in a vacuum column with the recovery of the aroma components
from CO2 by spraying with dealcoholized beer or water. Finally these components are redirected
to the dealcoholized beer. The main advantage of the vacuum evaporation is the reduced
exposition time of the beer to high temperatures, which reduces the negative effects on product
quality.
Regarding membrane processes, the temperature is not an important factor. Thus, to remove
ethanol, it selective transfer with a semi-permeable membrane is used.
Reverse osmosis process is characterized by a higher pressure than the beer osmotic pressure
(2-8MPa) allowing the flow of small water and ethanol molecules through the membrane.
Permeate can be separated from the volatiles by fraccionated distillation which afterwards are
returned to dealcoholized beer. The operation temperature is kept around 15ºC and membranes
are made of different materials such as cellulose or polyamide.
Concerning dialysis, this method works on a principal similar to reverse osmosis, but the driving
force of the mass transfer across the semipermeable membrane used is the concentration
gradient of the compounds between beer and dialysate. In theory, this technique is simpler and
more attractive than reverse osmosis, but it was only recently introduced in industry. Beer is
passed through a dialysis module made by a semipermeable membrane normally composed by
cellulose. The dialysate passes through the reactor in counter current. Alcohol passes through
the membrane to the dialysate, but the aroma compounds can be retained completely in the beer.
This process is performed at low temperatures (1-6ºC) and slightly high pressure in order to keep
the dissolved carbon dioxide level. The result product is of excellent quality and the dialysate can
be easily distilled with yields of high values of alcohol. However, this method is limited to the
production of beers with an ethanol content higher than 0.5 % [51], [42], [54].

17
BIOLOGICAL METHODS
Biological methods are based on reduced formation of ethanol during fermentation. For instance,
mashing, limited fermentation and the use of special yeasts are some of the strategies used in
this case.
Mashing has as a main purpose to degrade starch, fermentable sugars and soluble dextrins,
based on the fact that the fermentable sugars in the wort are the responsible for the alcohol
amount in the beer. Therefore, by changing the mashing process it is possible to modulate the
quantity of wort sugars in a way that the fermentation is limited and the total amount of alcohol is
low. In order to achieve this objective there are different strategies that can be followed. For
example, mashing temperature can be increased (75-80ºC) resulting in the inactivation of β-
amylase, which cleaves the starch in fermentable sugars. Another option is using cold water for
malt extraction with temperatures < 60ºC. These temperatures are insufficient for starch
gelatinization and subsequent enzymatic hydrolysis, but sufficient for the extraction of the aroma
flavors.
However, the most frequently used biological method is limiting the fermentation process. This
method is based on the termination of the main fermentation by rapid cooling and removal of the
yeast before a complete attenuation has been reached, keeping the ethanol content low. The
initial fermentation temperature is low and the oxygenation of the wort is limited to avoid diacetyl
formation. In some cases, the yeast is not removed but its metabolism is constrained. The easiest
way to perform this method is by reducing the temperature using “cold contact process” (CCP)
when the temperatures decrease almost until 0ºC. Because of the low temperature, the metabolic
activity of the yeast is low, inhibiting ethanol formation. However, there is an adsorption of hop
and wort compounds to the surface of the yeast and some reduction occurs of the carbonyl
compounds from the wort that are responsible for the worty flavor. Thus, other biochemical
processes, such as formation of higher alcohols and esters, can exhibit moderate activities [55].
Another method to produce non-alcoholic beer consists in using a special yeast. This can be
achieved by selecting a proper microbial strain with specific properties or intentional modification
of brewing yeast by random genome mutation or genetic engineering. The most successful strain
used for the industrial production of alcohol-free beer is Saccharomycodes ludwigii. It is the
disability of this strain to ferment maltose and maltotriose that gives the brewers the power to
control the fermentation. This yeast ferments about 15 % of the normally fermentable sugars, not
fermenting glucose, fructose and sucrose. The result is a beer not too sweet since maltose is less
sweet than glucose [54].
Finally, another technique is the use of immobilized cells. By using this strategy, the contact time
(residence time) between immobilized yeast and wort is very short. Therefore, there is not enough
time to convert the wort into alcoholic beer [42], [51].

18
2.3.3. PROPERTIES OF ALCOHOL-FREE BEER AND SENSORY ANALYSIS
The aroma and taste of the AFB is usually different from the regular beers. Depending on the
method used to create AFB these differences can change. For instance, alcohol-free beers
produced by membrane methods have usually less body and a low aromatic profile; the ones
produced by biological processes have often a sweet and worty flavor; while beers produced by
thermal strategies normally suffer from heat damage. The majority of these shortcomings can be
overcome by process adjustments as well as by adding flavor active compounds into the final
product [42].
The usual small amount of volatile products (esters and high alcohols) in AFB production by
arrested fermentation can cause restrictions in the flavor of the final beer. These AFB flavors are
comparable with AFB produced by alcohol removal [42], [51].
Sensory analysis may be defined as the measurement of both the flavor and the assessor’s
characteristics using human senses. This is the most logical approach, since there is no way of
simulating instrumentally the complex sensing mechanism of the human palate and nose. The
first widely-applied empirical system for evaluating complex flavors was the Arthur D. Little flavor
profile method [55]. This employs 4-6 trained and experienced tasters using predetermined
intensity scales to score the independently recognizable aroma and flavor notes according to type
and order of perception. Agreement on the notes present, and the scoring of their intensities, is
reached by discussion amongst the tasters under the direction of panel leader. Later, the potential
value of this method to the brewing industry was demonstrated as means of quality control, but,
at the same time, indicated the limitations of quality control format to the broader field of research
and development. Flavor descriptions so devised will obviously be product-orientated and the
aroma/flavor notes recognized will be appropriate only to limited range of beers with similar or
closely related flavors. Moreover it is possible, and indeed likely, that different panels in different
places will formulate different descriptions of the flavor of the same beer [56].
Different types of tests can be chosen to perform the sensory evaluation. Descriptive tests, scale
based tests, preference tests, and drinkability tests are some examples. Descriptive tests are the
type of sensory test used for the characterizing beer flavors. The format can be a blank sheet of
paper on which descriptors of flavors commonly experienced in beer are printed. In some cases
panellists are asked to classify the intensity of the perceived flavors.
The preference tests are based on the question: “Which sample do you prefer?”. For a two-sample
test, preference can be expressed simply by a check mark. If there are more than two samples,
a ranking test is usually performed.
In the case of scale based tests, panellists are given a paper sheet with different characteristic
parameters of the beer. There is a numeric scale where each number will score each parameter
(normally from extremely strong/good to extremely weak/bad).
19
Finally, the drinkability test is designed to evaluate which beer is more amenable to consumption
in quantity. For a long time, brewers have paid the closest attention to the quality of the beer and
towards improving its quality. They have drunk beer a lot and evaluated whether it tasted as good
as before. A good beer possesses the individual characteristics of the beer and gives the desire
to drink more [57].
Knowledge of taste and flavor of beer has been developed by many chemists and tasters since
the early years of beer production. However, each method can be improved and new ones can
be developed. Through well-design experiments coupled with well-trained sensory observers,
more precise and more precious knowledge will be compiled without doubt in the future. In
general, there is no technique more suitable than another. The evaluation must have into account
several factors and beer characteristics and the evaluation must be carried out by specialists [57].
2.3.4. ESTERS AND HIGHER ALCOHOLS AS ACTIVE FLAVOR
COMPOUNDS IN BEER
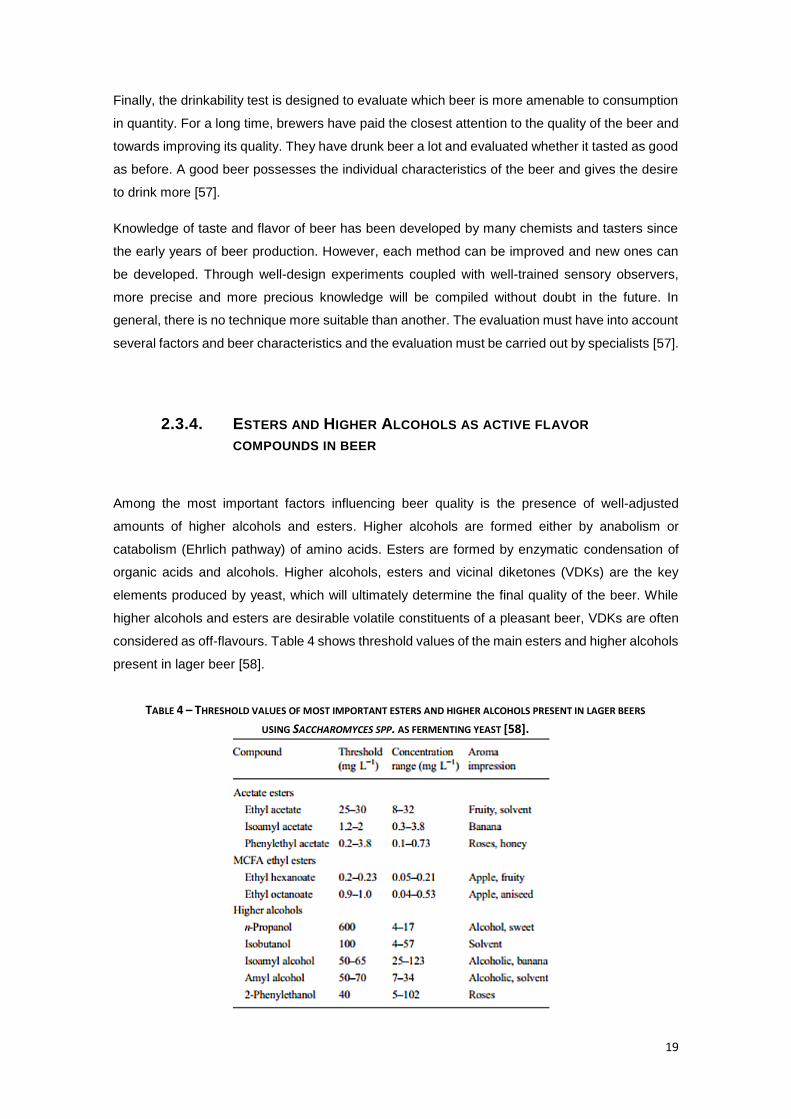
Among the most important factors influencing beer quality is the presence of well-adjusted
amounts of higher alcohols and esters. Higher alcohols are formed either by anabolism or
catabolism (Ehrlich pathway) of amino acids. Esters are formed by enzymatic condensation of
organic acids and alcohols. Higher alcohols, esters and vicinal diketones (VDKs) are the key
elements produced by yeast, which will ultimately determine the final quality of the beer. While
higher alcohols and esters are desirable volatile constituents of a pleasant beer, VDKs are often
considered as off-flavours. Table 4 shows threshold values of the main esters and higher alcohols
present in lager beer [58].
TABLE 4 – THRESHOLD VALUES OF MOST IMPORTANT ESTERS AND HIGHER ALCOHOLS PRESENT IN LAGER BEERS
USING SACCHAROMYCES SPP. AS FERMENTING YEAST [58].
20
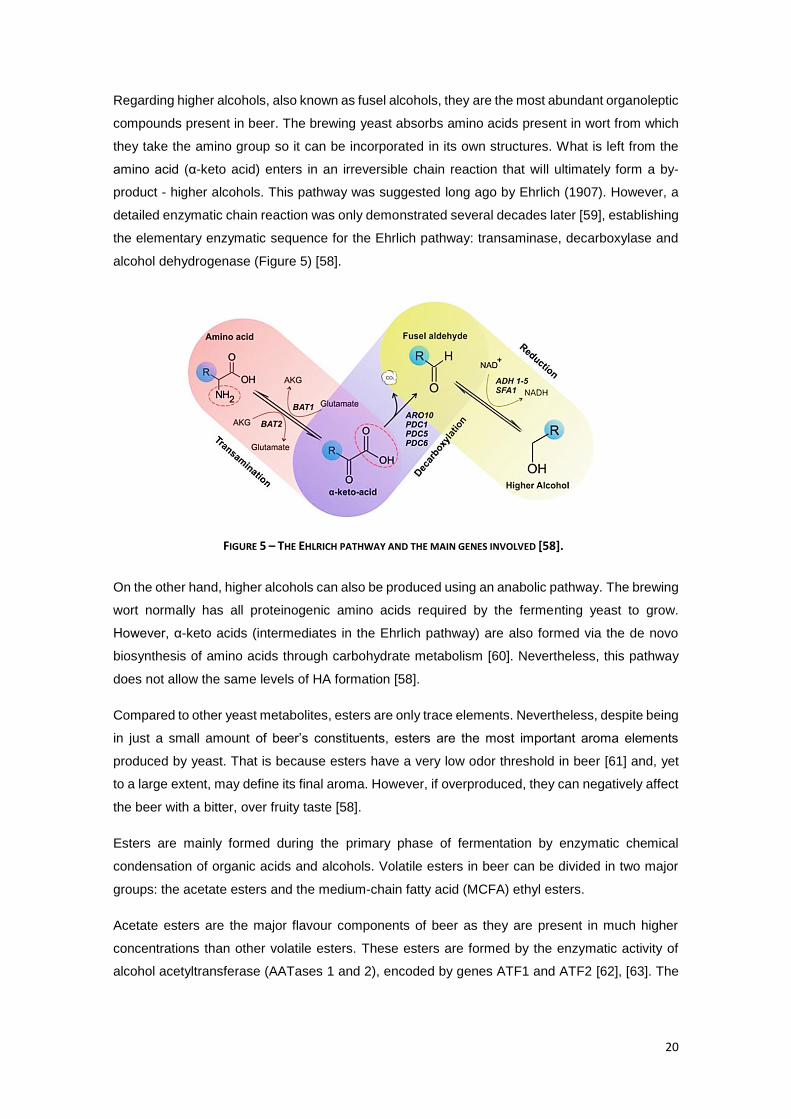
Regarding higher alcohols, also known as fusel alcohols, they are the most abundant organoleptic
compounds present in beer. The brewing yeast absorbs amino acids present in wort from which
they take the amino group so it can be incorporated in its own structures. What is left from the
amino acid (α-keto acid) enters in an irreversible chain reaction that will ultimately form a by-
product - higher alcohols. This pathway was suggested long ago by Ehrlich (1907). However, a
detailed enzymatic chain reaction was only demonstrated several decades later [59], establishing
the elementary enzymatic sequence for the Ehrlich pathway: transaminase, decarboxylase and
alcohol dehydrogenase (Figure 5) [58].
On the other hand, higher alcohols can also be produced using an anabolic pathway. The brewing
wort normally has all proteinogenic amino acids required by the fermenting yeast to grow.
However, α-keto acids (intermediates in the Ehrlich pathway) are also formed via the de novo
biosynthesis of amino acids through carbohydrate metabolism [60]. Nevertheless, this pathway
does not allow the same levels of HA formation [58].
Compared to other yeast metabolites, esters are only trace elements. Nevertheless, despite being
in just a small amount of beer’s constituents, esters are the most important aroma elements
produced by yeast. That is because esters have a very low odor threshold in beer [61] and, yet
to a large extent, may define its final aroma. However, if overproduced, they can negatively affect
the beer with a bitter, over fruity taste [58].
Esters are mainly formed during the primary phase of fermentation by enzymatic chemical
condensation of organic acids and alcohols. Volatile esters in beer can be divided in two major
groups: the acetate esters and the medium-chain fatty acid (MCFA) ethyl esters.
Acetate esters are the major flavour components of beer as they are present in much higher
concentrations than other volatile esters. These esters are formed by the enzymatic activity of
alcohol acetyltransferase (AATases 1 and 2), encoded by genes ATF1 and ATF2 [62], [63]. The
FIGURE 5 – THE EHLRICH PATHWAY AND THE MAIN GENES INVOLVED [58].
21
presence of acetate esters on alcohol-free beers (AFB) is imperative, since the lack of ethanol
itself greatly affects the retention of volatile aroma-active compounds.
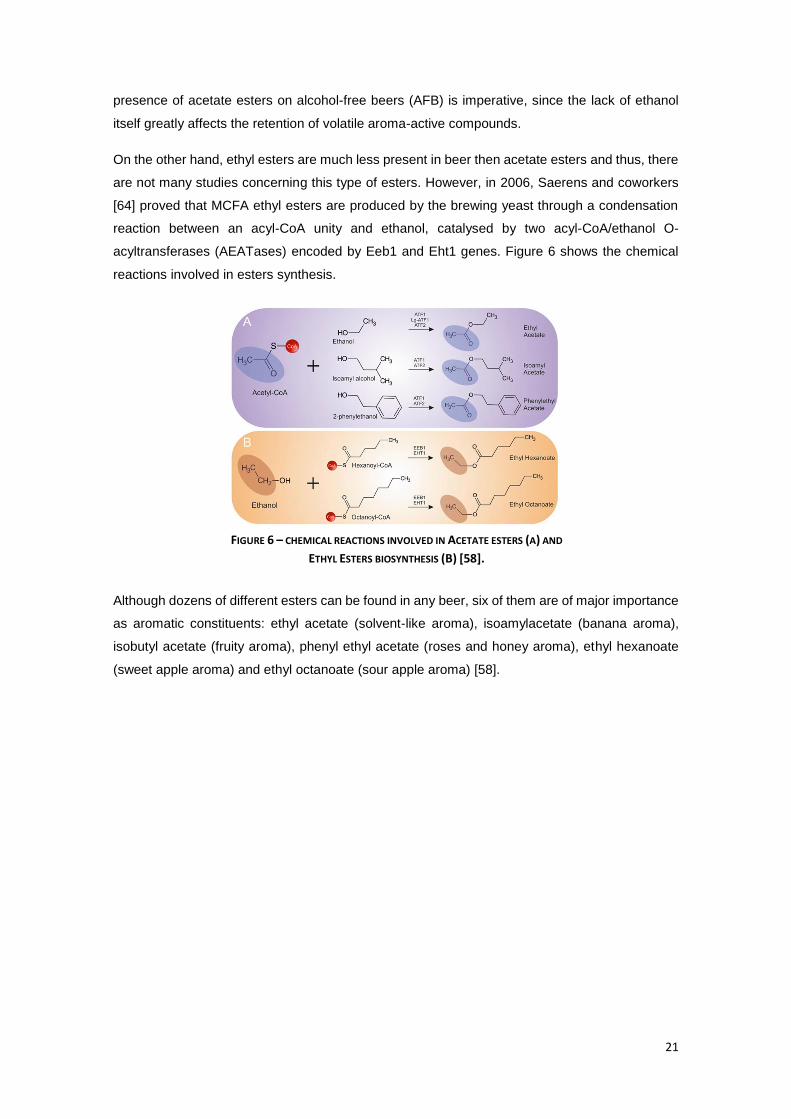
On the other hand, ethyl esters are much less present in beer then acetate esters and thus, there
are not many studies concerning this type of esters. However, in 2006, Saerens and coworkers
[64] proved that MCFA ethyl esters are produced by the brewing yeast through a condensation
reaction between an acyl-CoA unity and ethanol, catalysed by two acyl-CoA/ethanol O-
acyltransferases (AEATases) encoded by Eeb1 and Eht1 genes. Figure 6 shows the chemical
reactions involved in esters synthesis.
Although dozens of different esters can be found in any beer, six of them are of major importance
as aromatic constituents: ethyl acetate (solvent-like aroma), isoamylacetate (banana aroma),
isobutyl acetate (fruity aroma), phenyl ethyl acetate (roses and honey aroma), ethyl hexanoate
(sweet apple aroma) and ethyl octanoate (sour apple aroma) [58].
FIGURE 6 – CHEMICAL REACTIONS INVOLVED IN ACETATE ESTERS (A) AND
ETHYL ESTERS BIOSYNTHESIS (B) [58].

22
3. METHODOLOGY
The experimental campaign was conducted in two distinct parts. The first part was based on the
study of Saccharomyces boulardii growth properties in liquid media with glucose and/or dextrin
as carbon and energy sources in order to determine the growth rate of the strain at different
temperatures. The second part consisted in testing the beer production in fermentation columns
and analyzing the sensory active fermentation products.
3.1. MICROORGANISM
Throughout the whole experimental campaign the yeast strain used was Saccharomyces
cerevisiae RIBM 170. This strain is part of the collection of the Research Institute of Brewing and
Malting, Prague, Czech Republic. Although this is the current designation of the strain, during the
thesis it will be referred as Saccharomyces boulardii since the majority of the previous literature
has being using this description.
3.2. MICROBIAL GROWTH
3.2.1. MEDIA PREPARATION
Two different media were prepared for the first part of the project in order to analyze the growth
of the strain under different conditions. The composition of these media are described in Table 5
and Table 6. These media were prepared in 500 mL Erlenmeyer flasks containing 250 mL of
liquid, the pH of which was adjusted to 5.5 using HCl and sterilized in the autoclave for 20 min at
121 °C. Each medium was prepared in duplicated flasks and after sterilization each one was
cooled and stored until inoculation.
TABLE 5 – YPG MEDIUM WITH GLUCOSE.
Component c [g/L] pH
Yeast extract (Alfa Aeasar, USA) 5
5.5 Peptone (Alfa Aesar, USA) 5
Glucose (PENTA, Czech Republic) 30
23
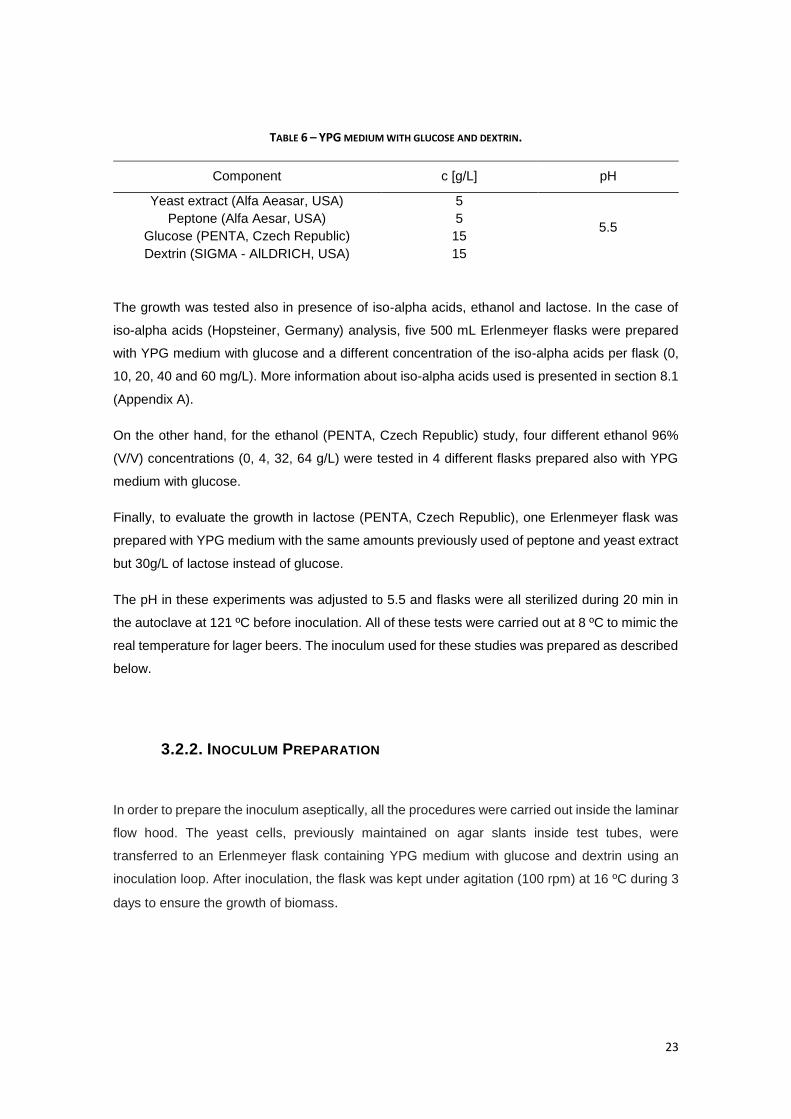
TABLE 6 – YPG MEDIUM WITH GLUCOSE AND DEXTRIN.
Component c [g/L] pH
Yeast extract (Alfa Aeasar, USA) 5
5.5 Peptone (Alfa Aesar, USA) 5
Glucose (PENTA, Czech Republic) 15
Dextrin (SIGMA - AlLDRICH, USA) 15
The growth was tested also in presence of iso-alpha acids, ethanol and lactose. In the case of
iso-alpha acids (Hopsteiner, Germany) analysis, five 500 mL Erlenmeyer flasks were prepared
with YPG medium with glucose and a different concentration of the iso-alpha acids per flask (0,
10, 20, 40 and 60 mg/L). More information about iso-alpha acids used is presented in section 8.1
(Appendix A).
On the other hand, for the ethanol (PENTA, Czech Republic) study, four different ethanol 96%
(V/V) concentrations (0, 4, 32, 64 g/L) were tested in 4 different flasks prepared also with YPG
medium with glucose.
Finally, to evaluate the growth in lactose (PENTA, Czech Republic), one Erlenmeyer flask was
prepared with YPG medium with the same amounts previously used of peptone and yeast extract
but 30g/L of lactose instead of glucose.
The pH in these experiments was adjusted to 5.5 and flasks were all sterilized during 20 min in
the autoclave at 121 ºC before inoculation. All of these tests were carried out at 8 ºC to mimic the
real temperature for lager beers. The inoculum used for these studies was prepared as described
below.
3.2.2. INOCULUM PREPARATION
In order to prepare the inoculum aseptically, all the procedures were carried out inside the laminar
flow hood. The yeast cells, previously maintained on agar slants inside test tubes, were
transferred to an Erlenmeyer flask containing YPG medium with glucose and dextrin using an
inoculation loop. After inoculation, the flask was kept under agitation (100 rpm) at 16 ºC during 3
days to ensure the growth of biomass.
24
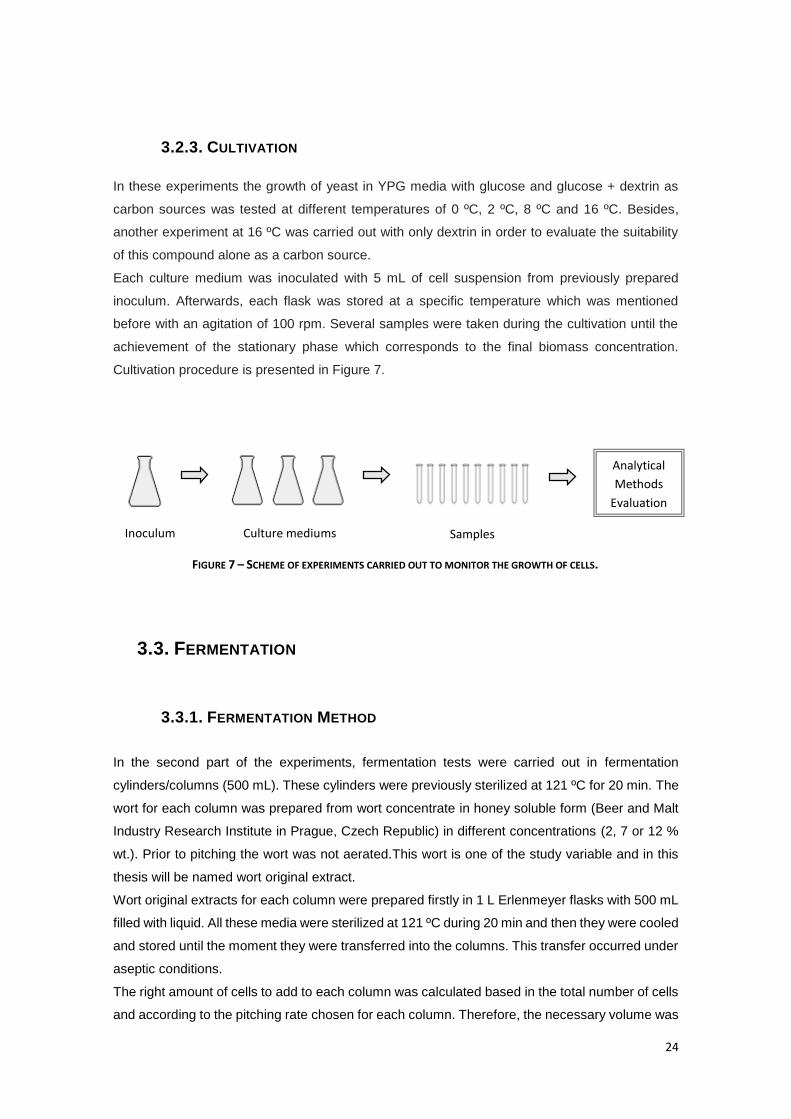
3.2.3. CULTIVATION
In these experiments the growth of yeast in YPG media with glucose and glucose + dextrin as
carbon sources was tested at different temperatures of 0 ºC, 2 ºC, 8 ºC and 16 ºC. Besides,
another experiment at 16 ºC was carried out with only dextrin in order to evaluate the suitability
of this compound alone as a carbon source.
Each culture medium was inoculated with 5 mL of cell suspension from previously prepared
inoculum. Afterwards, each flask was stored at a specific temperature which was mentioned
before with an agitation of 100 rpm. Several samples were taken during the cultivation until the
achievement of the stationary phase which corresponds to the final biomass concentration.
Cultivation procedure is presented in Figure 7.
3.3. FERMENTATION
3.3.1. FERMENTATION METHOD
In the second part of the experiments, fermentation tests were carried out in fermentation
cylinders/columns (500 mL). These cylinders were previously sterilized at 121 ºC for 20 min. The
wort for each column was prepared from wort concentrate in honey soluble form (Beer and Malt
Industry Research Institute in Prague, Czech Republic) in different concentrations (2, 7 or 12 %
wt.). Prior to pitching the wort was not aerated.This wort is one of the study variable and in this
thesis will be named wort original extract.
Wort original extracts for each column were prepared firstly in 1 L Erlenmeyer flasks with 500 mL
filled with liquid. All these media were sterilized at 121 ºC during 20 min and then they were cooled
and stored until the moment they were transferred into the columns. This transfer occurred under
aseptic conditions.
The right amount of cells to add to each column was calculated based in the total number of cells
and according to the pitching rate chosen for each column. Therefore, the necessary volume was
Inoculum Culture mediums Samples
Analytical
Methods
Evaluation
FIGURE 7 – SCHEME OF EXPERIMENTS CARRIED OUT TO MONITOR THE GROWTH OF CELLS.
25
transferred from the inoculum directly to the column near the flame. Afterwards, each column was
stored at a predefined temperature.
The progress of the fermentation was monitored (hydrometer) until the moment of taking samples.
In this thesis the limited fermentation strategy was used since a possible new brewer strain was
being studied and this is the most used technique. The objective was to limit the fermentation,
and so the formation of ethanol, which happened when the value in the hydrometer decreased by
1 % (w/w) from the initial wort original extract (Calculations in section 8.2 - Appendix B). From
each column two samples of 10 and 35 mL were taken, centrifuged and stored in the freezer for
further HPLC and GC analysis, respectively.
Alcohol-free beer was stored in plastic bottles in the cold room (2 ºC) for 30 days to mimic the
lagering conditions. Finally, after these 30 days, sensory analysis was done.
3.3.2. INOCULUM PREPARATION
In this case the inoculum was prepared from wort concentrate in a 2 L Erlenmeyer flask with 1 L
of liquid (10% wt.). All the procedures were carried out inside the laminar flow hood as well. The
yeast cells were maintained and inoculated in the same way as mentioned before. After the
inoculation the flask was stored with agitation (200 rpm) at 8 ºC during 6 days to ensure the growth
of biomass.
After these 6 days the total number of cells in the inoculum was calculated by total yeast cell
counting from a 4 mL sample, using a Burker chamber. This permitted to calculate the amount of
cells needed to be added to each fermentation column, according to each pitching rate.
3.3.3. EXPERIMENTAL DESIGN AND RESPONSE SURFACE METHODOLOGY
(RSM)
During the fermentation tests the process variables were selected taking into consideration
previous studies [65] and altered to perform an experimental design as showed in Table 7. The
code level presented in the same table was used to identify which conditions were being tested
in each column, what can be observed in Table 8. Thirteen different columns were tested with
different combinations of variables to be analyzed. These values were based on the same
previous studies.
26
Response surface methodology (RSM) was used to understand the effect of process variables,
the interaction among them and their contribution to AFB quality. Three independent process
variables (factors), such as wort original extract (E), temperature (T) and pitching rate (P), were
varied at three levels (Table 7).
Since AFB prepared by fermentation have original extract E of ca. 5-7% wt., a central point of 7
% wt. was selected. Some companies use this strategy to ferment wort with higher E to obtain 1%
vol. ethanol and then dilute the AFB with water to obtain 0.5 % vol. ethanol. This is why 12% wt.
was used. The lowest concentration of E (2 % wt.) was selected because S. boulardii ferments
also dextrins and thus 2 % wt. should be enough to produce AFB with 0.5 % vol. ethanol.
Regarding T, 8°C is the typical fermentation temperature of lager beers and was set as the central
point. 2°C is the typical maturation temperature of lager beers and 14°C is the typical fermentation
temperature of ale beers. Thus, a wide range of temperatures can be reached. Finally, P was set
based on the rule often used by breweries: 1 x 10⁶ cells/mL for each 1% wt. of wort concentration
[54], [66].
TABLE 7 – VARIABLES OF THE PROCESS.
Symbol Independent variable (units) Code Level
-1 0 +1
E Original extract (% by weight) 2 7 12
T Temperature (°C) 2 8 14
P Pitching rate ( x 106 cells/mL) 2 7 12
TABLE 8 – CONDITIONS OF EACH COLUMN.
Columns Factors
E T P
Column 1 0 0 +1
Column 2 -1 -1 -1
Column 3 0 0 -1
Column 4 -1 0 0
Column 5 +1 0 0
Column 6 0 -1 0
Column 7 -1 +1 +1
Column 8 +1 -1 +1
Column 9 0 +1 0
Column 10 +1 +1 0
Column 11 0 0 0
Column 12 0 0 0
Column 13 0 0 0
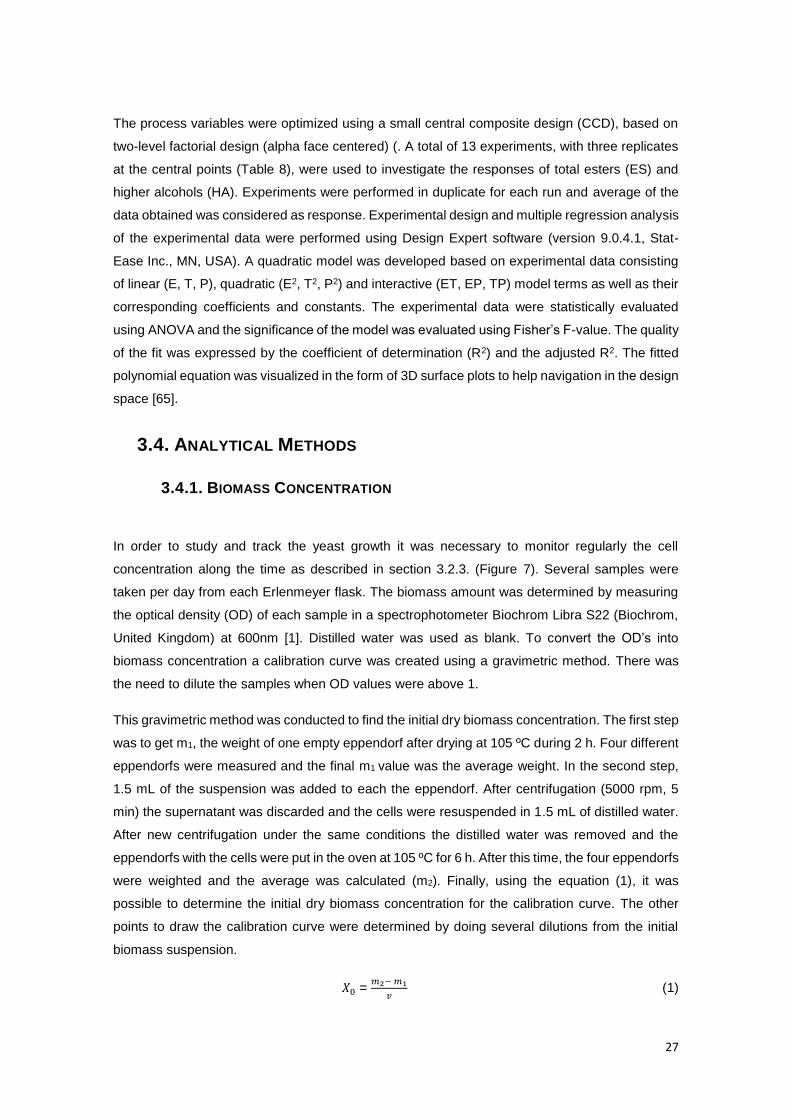
27
The process variables were optimized using a small central composite design (CCD), based on
two-level factorial design (alpha face centered) (. A total of 13 experiments, with three replicates
at the central points (Table 8), were used to investigate the responses of total esters (ES) and
higher alcohols (HA). Experiments were performed in duplicate for each run and average of the
data obtained was considered as response. Experimental design and multiple regression analysis
of the experimental data were performed using Design Expert software (version 9.0.4.1, Stat-
Ease Inc., MN, USA). A quadratic model was developed based on experimental data consisting
of linear (E, T, P), quadratic (E2, T2, P2) and interactive (ET, EP, TP) model terms as well as their
corresponding coefficients and constants. The experimental data were statistically evaluated
using ANOVA and the significance of the model was evaluated using Fisher’s F-value. The quality
of the fit was expressed by the coefficient of determination (R2) and the adjusted R2. The fitted
polynomial equation was visualized in the form of 3D surface plots to help navigation in the design
space [65].
3.4. ANALYTICAL METHODS
3.4.1. BIOMASS CONCENTRATION
In order to study and track the yeast growth it was necessary to monitor regularly the cell
concentration along the time as described in section 3.2.3. (Figure 7). Several samples were
taken per day from each Erlenmeyer flask. The biomass amount was determined by measuring
the optical density (OD) of each sample in a spectrophotometer Biochrom Libra S22 (Biochrom,
United Kingdom) at 600nm [1]. Distilled water was used as blank. To convert the OD’s into
biomass concentration a calibration curve was created using a gravimetric method. There was
the need to dilute the samples when OD values were above 1.
This gravimetric method was conducted to find the initial dry biomass concentration. The first step
was to get m1, the weight of one empty eppendorf after drying at 105 ºC during 2 h. Four different
eppendorfs were measured and the final m1 value was the average weight. In the second step,
1.5 mL of the suspension was added to each the eppendorf. After centrifugation (5000 rpm, 5
min) the supernatant was discarded and the cells were resuspended in 1.5 mL of distilled water.
After new centrifugation under the same conditions the distilled water was removed and the
eppendorfs with the cells were put in the oven at 105 ºC for 6 h. After this time, the four eppendorfs
were weighted and the average was calculated (m2). Finally, using the equation (1), it was
possible to determine the initial dry biomass concentration for the calibration curve. The other
points to draw the calibration curve were determined by doing several dilutions from the initial
biomass suspension.
𝑋0 = 𝑚2− 𝑚1
𝑣 (1)
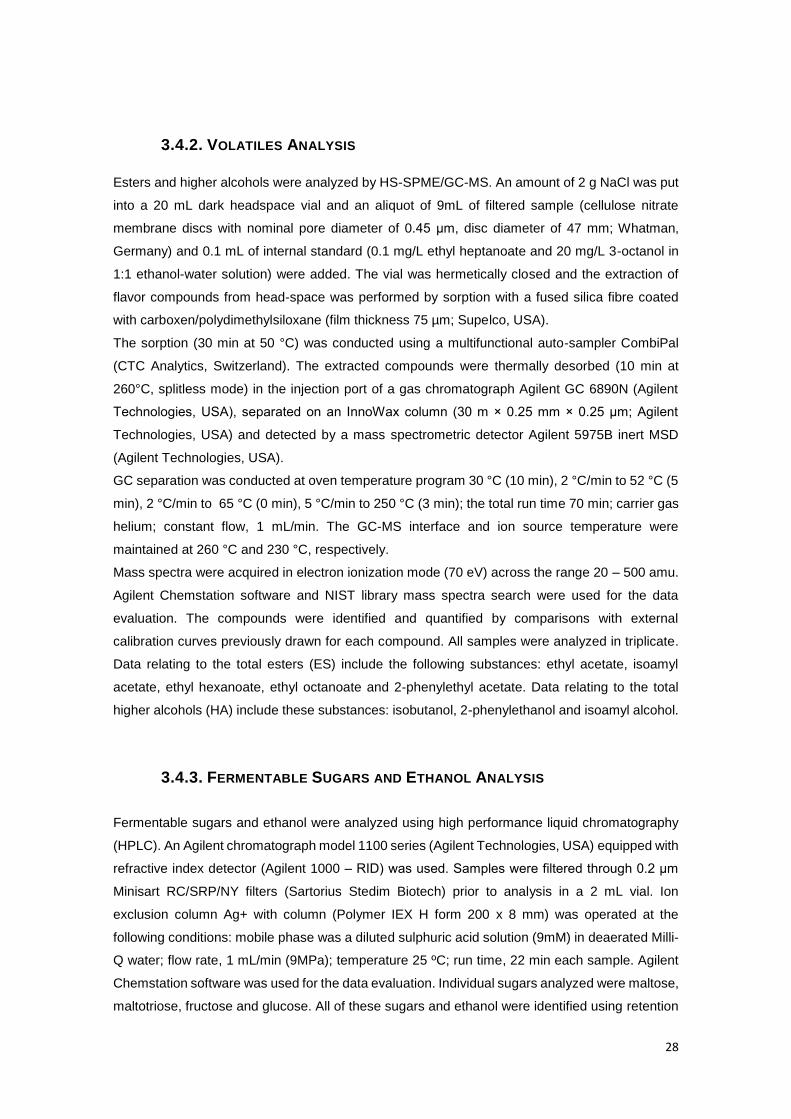
28
3.4.2. VOLATILES ANALYSIS
Esters and higher alcohols were analyzed by HS-SPME/GC-MS. An amount of 2 g NaCl was put
into a 20 mL dark headspace vial and an aliquot of 9mL of filtered sample (cellulose nitrate
membrane discs with nominal pore diameter of 0.45 μm, disc diameter of 47 mm; Whatman,
Germany) and 0.1 mL of internal standard (0.1 mg/L ethyl heptanoate and 20 mg/L 3-octanol in
1:1 ethanol-water solution) were added. The vial was hermetically closed and the extraction of
flavor compounds from head-space was performed by sorption with a fused silica fibre coated
with carboxen/polydimethylsiloxane (film thickness 75 µm; Supelco, USA).
The sorption (30 min at 50 °C) was conducted using a multifunctional auto-sampler CombiPal
(CTC Analytics, Switzerland). The extracted compounds were thermally desorbed (10 min at
260°C, splitless mode) in the injection port of a gas chromatograph Agilent GC 6890N (Agilent
Technologies, USA), separated on an InnoWax column (30 m × 0.25 mm × 0.25 μm; Agilent
Technologies, USA) and detected by a mass spectrometric detector Agilent 5975B inert MSD
(Agilent Technologies, USA).
GC separation was conducted at oven temperature program 30 °C (10 min), 2 °C/min to 52 °C (5
min), 2 °C/min to 65 °C (0 min), 5 °C/min to 250 °C (3 min); the total run time 70 min; carrier gas
helium; constant flow, 1 mL/min. The GC-MS interface and ion source temperature were
maintained at 260 °C and 230 °C, respectively.
Mass spectra were acquired in electron ionization mode (70 eV) across the range 20 – 500 amu.
Agilent Chemstation software and NIST library mass spectra search were used for the data
evaluation. The compounds were identified and quantified by comparisons with external
calibration curves previously drawn for each compound. All samples were analyzed in triplicate.
Data relating to the total esters (ES) include the following substances: ethyl acetate, isoamyl
acetate, ethyl hexanoate, ethyl octanoate and 2-phenylethyl acetate. Data relating to the total
higher alcohols (HA) include these substances: isobutanol, 2-phenylethanol and isoamyl alcohol.
3.4.3. FERMENTABLE SUGARS AND ETHANOL ANALYSIS
Fermentable sugars and ethanol were analyzed using high performance liquid chromatography
(HPLC). An Agilent chromatograph model 1100 series (Agilent Technologies, USA) equipped with
refractive index detector (Agilent 1000 – RID) was used. Samples were filtered through 0.2 μm
Minisart RC/SRP/NY filters (Sartorius Stedim Biotech) prior to analysis in a 2 mL vial. Ion
exclusion column Ag+ with column (Polymer IEX H form 200 x 8 mm) was operated at the
following conditions: mobile phase was a diluted sulphuric acid solution (9mM) in deaerated Milli-
Q water; flow rate, 1 mL/min (9MPa); temperature 25 ºC; run time, 22 min each sample. Agilent
Chemstation software was used for the data evaluation. Individual sugars analyzed were maltose,
maltotriose, fructose and glucose. All of these sugars and ethanol were identified using retention
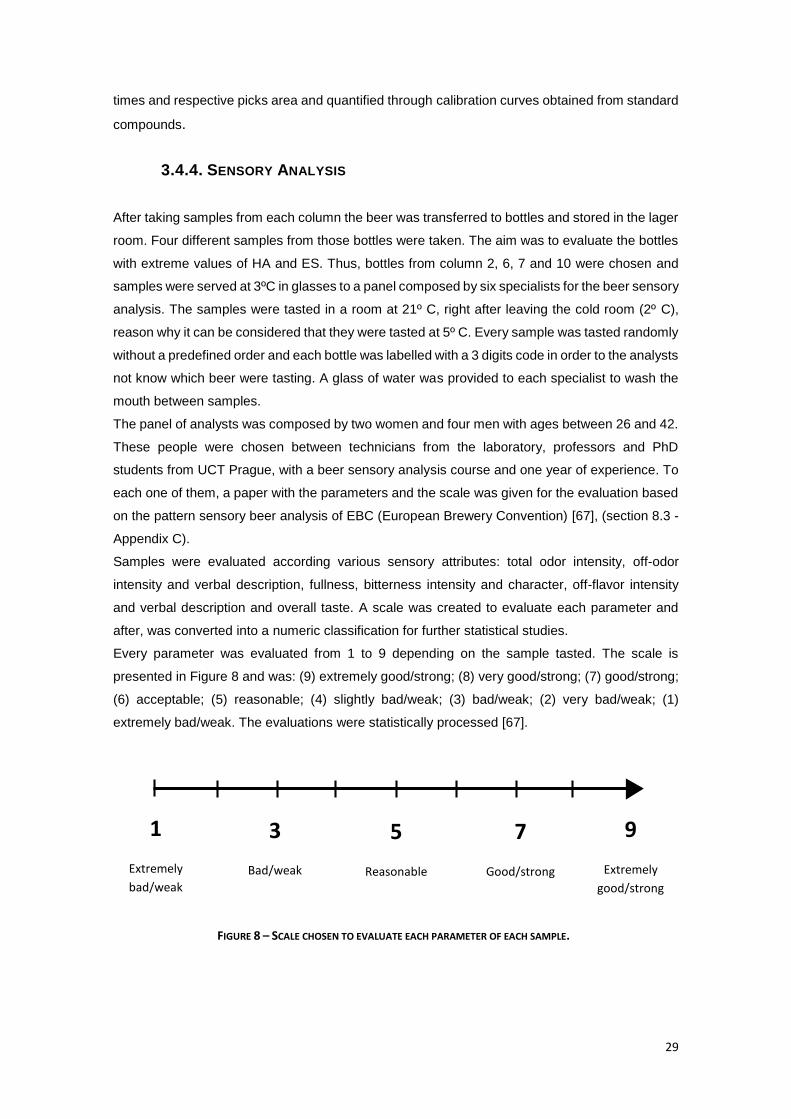
29
times and respective picks area and quantified through calibration curves obtained from standard
compounds.
3.4.4. SENSORY ANALYSIS
After taking samples from each column the beer was transferred to bottles and stored in the lager
room. Four different samples from those bottles were taken. The aim was to evaluate the bottles
with extreme values of HA and ES. Thus, bottles from column 2, 6, 7 and 10 were chosen and
samples were served at 3ºC in glasses to a panel composed by six specialists for the beer sensory
analysis. The samples were tasted in a room at 21º C, right after leaving the cold room (2º C),
reason why it can be considered that they were tasted at 5º C. Every sample was tasted randomly
without a predefined order and each bottle was labelled with a 3 digits code in order to the analysts
not know which beer were tasting. A glass of water was provided to each specialist to wash the
mouth between samples.
The panel of analysts was composed by two women and four men with ages between 26 and 42.
These people were chosen between technicians from the laboratory, professors and PhD
students from UCT Prague, with a beer sensory analysis course and one year of experience. To
each one of them, a paper with the parameters and the scale was given for the evaluation based
on the pattern sensory beer analysis of EBC (European Brewery Convention) [67], (section 8.3 -
Appendix C).
Samples were evaluated according various sensory attributes: total odor intensity, off-odor
intensity and verbal description, fullness, bitterness intensity and character, off-flavor intensity
and verbal description and overall taste. A scale was created to evaluate each parameter and
after, was converted into a numeric classification for further statistical studies.
Every parameter was evaluated from 1 to 9 depending on the sample tasted. The scale is
presented in Figure 8 and was: (9) extremely good/strong; (8) very good/strong; (7) good/strong;
(6) acceptable; (5) reasonable; (4) slightly bad/weak; (3) bad/weak; (2) very bad/weak; (1)
extremely bad/weak. The evaluations were statistically processed [67].
1
Extremely
bad/weak
9
Extremely
good/strong
5
Reasonable
7
Good/strong
3
Bad/weak
FIGURE 8 – SCALE CHOSEN TO EVALUATE EACH PARAMETER OF EACH SAMPLE.

30
4. RESULTS AND DISCUSSION
4.1. BIOMASS GROWTH IN SIMULATED WORT
The biomass growth was monitored to understand how the yeast strain Saccharomyces boulardii
responds to different temperatures, expressed by specific growth rates. The cultivation results
are presented below.
4.1.1. EFFECT OF GROWTH TEMPERATURE
GROWTH AT 0ºC
The growth at 0ºC was expected to be insignificant and extremely slow. In fact, according to the
Figure 9, a minimal growth was observed, which means that the yeast was able to use sugars at
this temperature. In this case it is not correct to calculate the growth rate because the exponential
phase was not well-defined. However, the values are between 0,003 > µ > 0,002 (h-1).
GROWTH AT 2ºC
In Figure 10 and 11 is represented the biomass growth at 2ºC. As it was mentioned before, at
each temperature the experiment was conducted in duplicated to verify the reproducibility of the
results. Thus, X1 and X2 represent the biomass growth in the Erlenmeyer flasks number 1 and
number 2, respectively.
FIGURE 9 - GROWTH CURVE OF SACCHAROMYCES BOULARDII AT 0°C IN YPG MEDIUM WITH GLUCOSE AND
DEXTRIN (TABLE 6, SECTION 3.2.1.)
0
0,1
0,2
0,3
0,4
0,5
0,6
0,7
0,8
0 200 400 600 800 1000 1200
X (
g/L)
t (h)
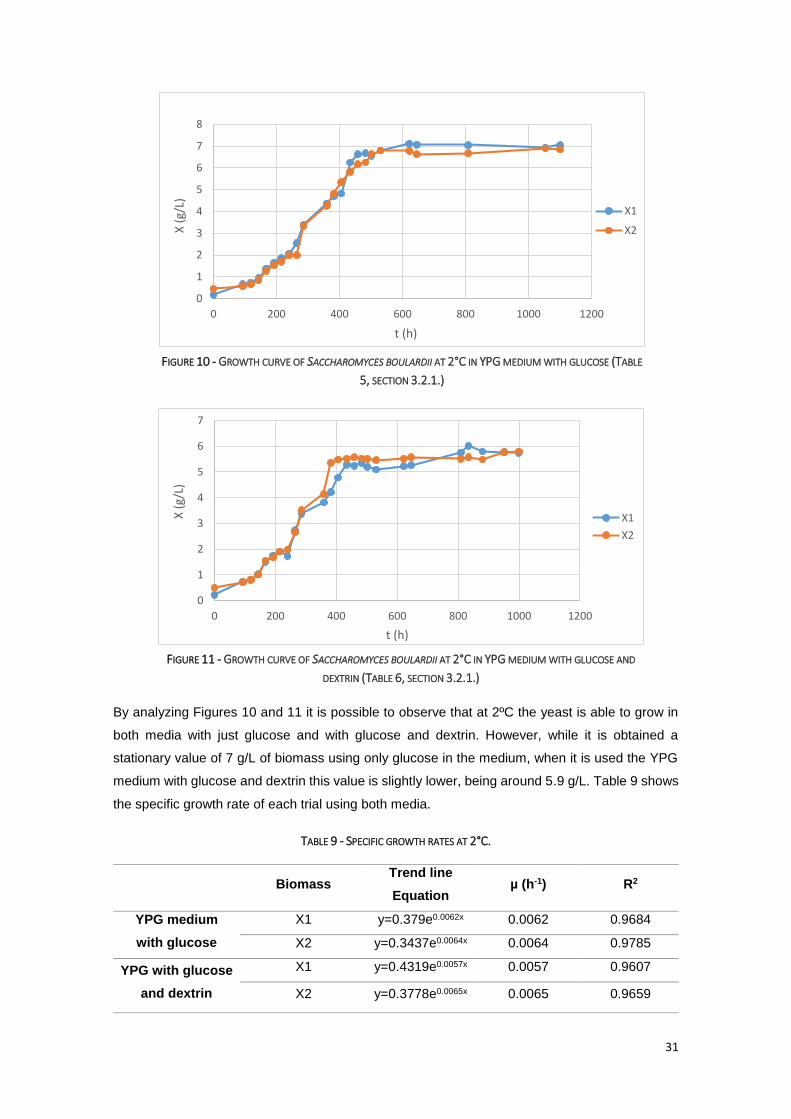
31
By analyzing Figures 10 and 11 it is possible to observe that at 2ºC the yeast is able to grow in
both media with just glucose and with glucose and dextrin. However, while it is obtained a
stationary value of 7 g/L of biomass using only glucose in the medium, when it is used the YPG
medium with glucose and dextrin this value is slightly lower, being around 5.9 g/L. Table 9 shows
the specific growth rate of each trial using both media.
TABLE 9 - SPECIFIC GROWTH RATES AT 2°C.
Biomass Trend line
Equation µ (h-1) R2
YPG medium
with glucose
X1 y=0.379e0.0062x 0.0062 0.9684
X2 y=0.3437e0.0064x 0.0064 0.9785
YPG with glucose
and dextrin
X1 y=0.4319e0.0057x 0.0057 0.9607
X2 y=0.3778e0.0065x 0.0065 0.9659
0
1
2
3
4
5
6
7
8
0 200 400 600 800 1000 1200
X (
g/L)
t (h)
X1
X2
0
1
2
3
4
5
6
7
0 200 400 600 800 1000 1200
X (
g/L)
t (h)
X1
X2
FIGURE 10 - GROWTH CURVE OF SACCHAROMYCES BOULARDII AT 2°C IN YPG MEDIUM WITH GLUCOSE (TABLE
5, SECTION 3.2.1.)
FIGURE 11 - GROWTH CURVE OF SACCHAROMYCES BOULARDII AT 2°C IN YPG MEDIUM WITH GLUCOSE AND
DEXTRIN (TABLE 6, SECTION 3.2.1.)
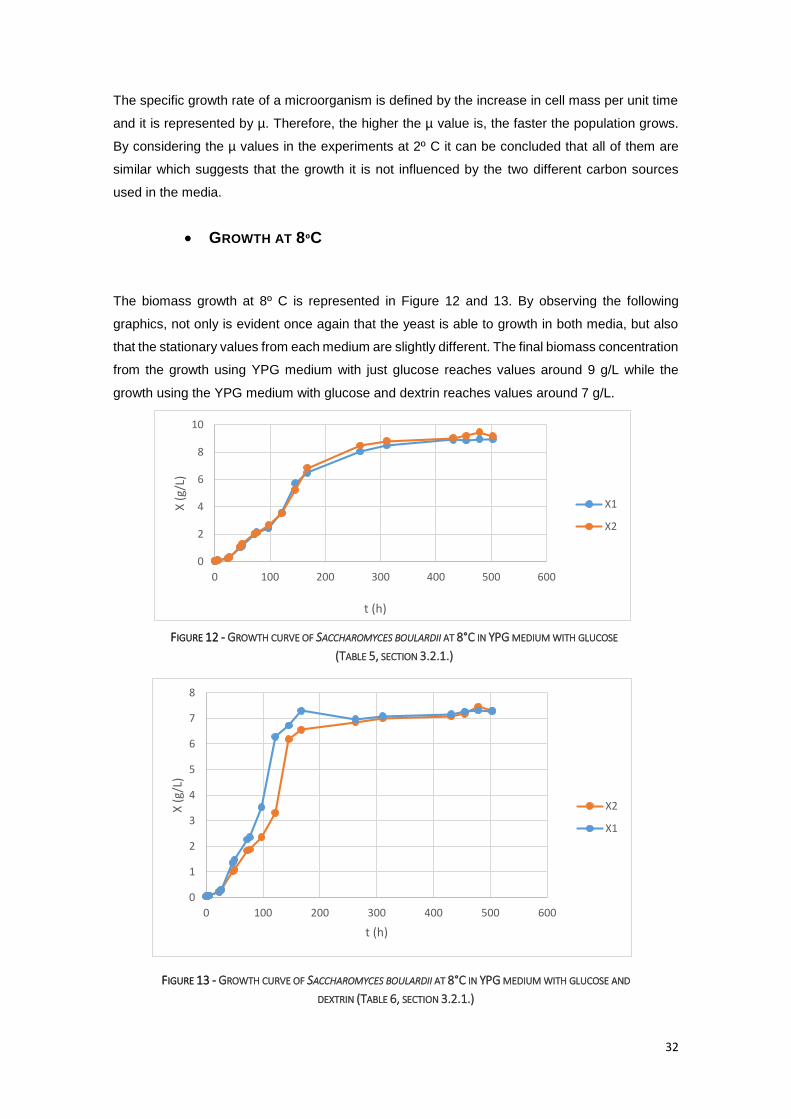
32
The specific growth rate of a microorganism is defined by the increase in cell mass per unit time
and it is represented by µ. Therefore, the higher the µ value is, the faster the population grows.
By considering the µ values in the experiments at 2º C it can be concluded that all of them are
similar which suggests that the growth it is not influenced by the two different carbon sources
used in the media.
GROWTH AT 8ºC
The biomass growth at 8º C is represented in Figure 12 and 13. By observing the following
graphics, not only is evident once again that the yeast is able to growth in both media, but also
that the stationary values from each medium are slightly different. The final biomass concentration
from the growth using YPG medium with just glucose reaches values around 9 g/L while the
growth using the YPG medium with glucose and dextrin reaches values around 7 g/L.
FIGURE 12 - GROWTH CURVE OF SACCHAROMYCES BOULARDII AT 8°C IN YPG MEDIUM WITH GLUCOSE
(TABLE 5, SECTION 3.2.1.)
FIGURE 13 - GROWTH CURVE OF SACCHAROMYCES BOULARDII AT 8°C IN YPG MEDIUM WITH GLUCOSE AND
DEXTRIN (TABLE 6, SECTION 3.2.1.)
0
2
4
6
8
10
0 100 200 300 400 500 600
X (
g/L)
t (h)
X1
X2
0
1
2
3
4
5
6
7
8
0 100 200 300 400 500 600
X (
g/L)
t (h)
X2
X1
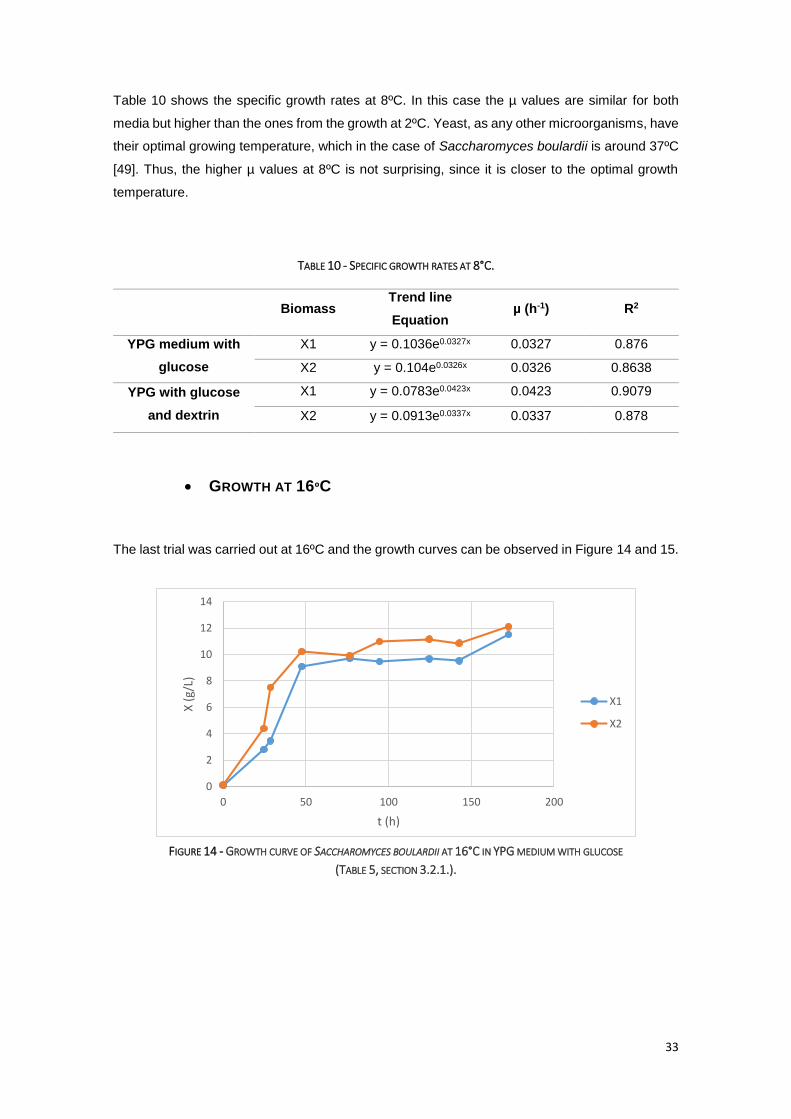
33
Table 10 shows the specific growth rates at 8ºC. In this case the µ values are similar for both
media but higher than the ones from the growth at 2ºC. Yeast, as any other microorganisms, have
their optimal growing temperature, which in the case of Saccharomyces boulardii is around 37ºC
[49]. Thus, the higher µ values at 8ºC is not surprising, since it is closer to the optimal growth
temperature.
TABLE 10 - SPECIFIC GROWTH RATES AT 8°C.
Biomass Trend line
Equation µ (h-1) R2
YPG medium with
glucose
X1 y = 0.1036e0.0327x 0.0327 0.876
X2 y = 0.104e0.0326x 0.0326 0.8638
YPG with glucose
and dextrin
X1 y = 0.0783e0.0423x 0.0423 0.9079
X2 y = 0.0913e0.0337x 0.0337 0.878
GROWTH AT 16ºC
The last trial was carried out at 16ºC and the growth curves can be observed in Figure 14 and 15.
0
2
4
6
8
10
12
14
0 50 100 150 200
X (
g/L)
t (h)
X1
X2
FIGURE 14 - GROWTH CURVE OF SACCHAROMYCES BOULARDII AT 16°C IN YPG MEDIUM WITH GLUCOSE
(TABLE 5, SECTION 3.2.1.).

34
In this case the final biomass concentration is around 12 g/L for the YPG medium with glucose
and 10 g/L for the YPG medium with glucose and dextrin.
The final biomass concentration is increasing with cultivation temperatures in the range from 0 to
16 °C. This can be explained by higher requirements for maintenance energy at extreme
temperatures, far from optimal growth temperature.
Also, in Table 11 are shown the specific growth rate values which, as expected, are higher than
the values at 8ºC.
Biomass Trend line
Equation µ (h-1) R2
YPG medium with
glucose
X1 y=0.1222e0.1027x 0.1027 0.9165
X2 y=0.1837e0.0958x 0.0958 0.9662
YPG with glucose
and dextrin
X1 y=0.1395e0.0939x 0.0939 0.9087
X2 y=0.187e0.0845x 0.0845 0.9007
TABLE 11 - SPECIFIC GROWTH RATES AT 16ºC.
0
2
4
6
8
10
12
0 100 200 300 400 500
X (
g/L)
t (h)
X1
X2
FIGURE 15 - GROWTH CURVE OF SACCHAROMYCES BOULARDII AT 16ᵒC IN YPG MEDIUM WITH GLUCOSE AND
DEXTRIN (TABLE 6, SECTION 3.2.1.)
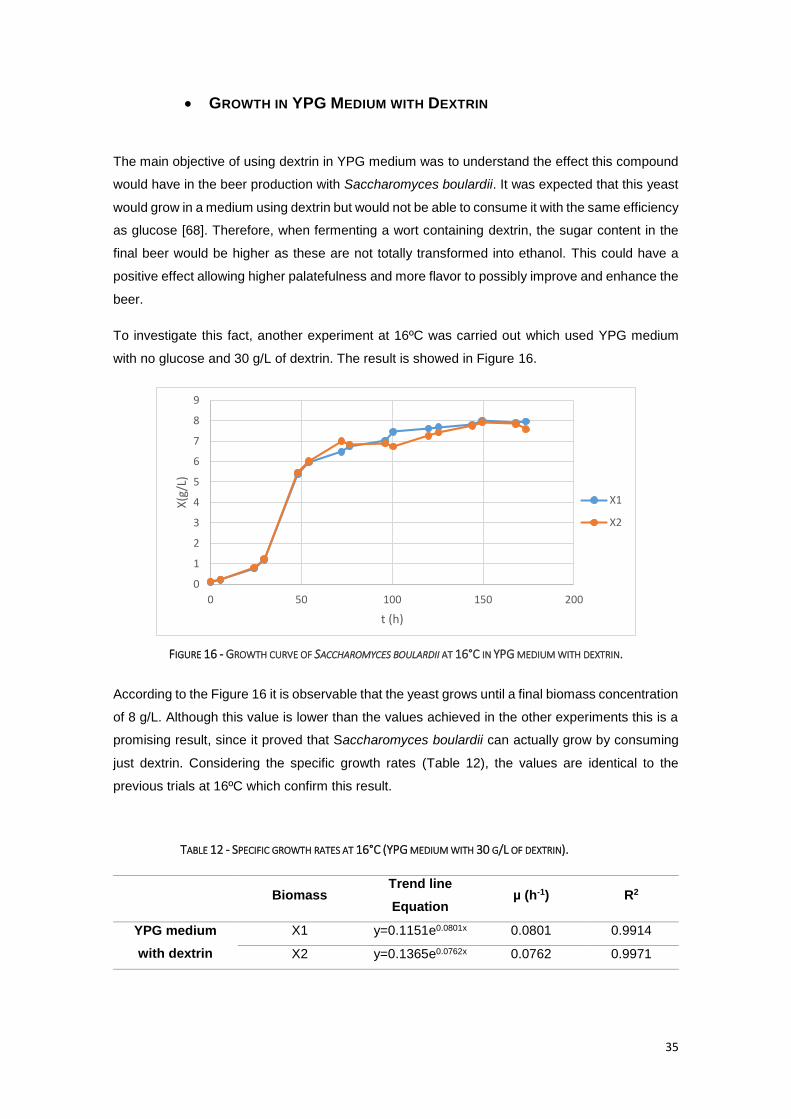
35
GROWTH IN YPG MEDIUM WITH DEXTRIN
The main objective of using dextrin in YPG medium was to understand the effect this compound
would have in the beer production with Saccharomyces boulardii. It was expected that this yeast
would grow in a medium using dextrin but would not be able to consume it with the same efficiency
as glucose [68]. Therefore, when fermenting a wort containing dextrin, the sugar content in the
final beer would be higher as these are not totally transformed into ethanol. This could have a
positive effect allowing higher palatefulness and more flavor to possibly improve and enhance the
beer.
To investigate this fact, another experiment at 16ºC was carried out which used YPG medium
with no glucose and 30 g/L of dextrin. The result is showed in Figure 16.
According to the Figure 16 it is observable that the yeast grows until a final biomass concentration
of 8 g/L. Although this value is lower than the values achieved in the other experiments this is a
promising result, since it proved that Saccharomyces boulardii can actually grow by consuming
just dextrin. Considering the specific growth rates (Table 12), the values are identical to the
previous trials at 16ºC which confirm this result.
Biomass Trend line
Equation µ (h-1) R2
YPG medium
with dextrin
X1 y=0.1151e0.0801x 0.0801 0.9914
X2 y=0.1365e0.0762x 0.0762 0.9971
TABLE 12 - SPECIFIC GROWTH RATES AT 16°C (YPG MEDIUM WITH 30 G/L OF DEXTRIN).
0
1
2
3
4
5
6
7
8
9
0 50 100 150 200
X(g
/L)
t (h)
X1
X2
FIGURE 16 - GROWTH CURVE OF SACCHAROMYCES BOULARDII AT 16°C IN YPG MEDIUM WITH DEXTRIN.

36
FINAL CONSIDERATIONS
Comparing all the results above it can be concluded that the cultivation duration and the biomass
growth are mainly influenced by the temperature. In Figure 17, the growth curves from YPG
medium with glucose and dextrin at different temperatures are presented. Only one medium was
chosen to demonstrate the influence of the temperatures, since the experiment with just glucose
as a carbon and energy source has similar “trends”.
By analyzing the graph from Figure 17, one can observe that Saccharomyces boulardii is able to
grow at the different studied temperatures, although this growth is residual and not significant in
the case of 0 ºC.
Regarding the lag phase of different experiments it is observed that the higher the study
temperature, the shorter the lag phase. At 2ºC, around 100 hours were necessary to initiate the
growth phase, while at 8 ºC the yeast needed 25 hours and at 16 ºC the growth was initiated
immediately after inoculation. Since the inoculum was prepared at 16 ºC, these results are
predictable. There is no lag phase in the experiments at 16 ºC because the yeast was already
adapted to this temperature. In the other cases, the lag phase results in the time that the yeast
needed to adjust to the new growth temperature. It is noticeable also that this lag phase is larger
at lower temperatures. Regarding the growth in dextrin medium at 16 ºC, another observation is
that there is a lag phase of ca. 25 h, while in the other experiments at the same temperature there
is no lag phase visible. This difference comes from the fact that the inoculum was prepared with
glucose and dextrin. Thus, the lag phase results from the time needed by the yeast to adapt to
the new medium.
FIGURE 17 - GROWTH CURVES OF SACCHAROMYCES BOULARDII AT 0°C, 2°C, 8°C AND 16°C IN YPG
MEDIUM WITH GLUCOSE AND DEXTRIN.
0
1
2
3
4
5
6
7
8
9
10
0 200 400 600 800 1000 1200 1400
X (
g/L)
t (h)
16ºC
0ºC
2ºC
8ºC

37
Observing the final biomass concentration values the statement previously made is confirmed.
Considering the experiments at 2 ºC the final concentration reaches values of 6 g/L. In the case
of 8 ºC experiments, these values are slightly higher and around 7 g/L. Finally, at 16 ºC the final
biomass concentration is 10 g/L. This reveals that the yeast is able to develop and grow easily
under higher temperatures, spending less substrate for maintenance purposes.
In this experimental campaign temperatures higher than 16 ºC were not studied, despite being
more suitable for the yeast growth, because strains that grow at low temperatures are used in
bottom-fermentations of beer. In case of Saccharomyces boulardii the optimal growth
temperature is around 37 ºC, thus, it was relevant to analyze if it could grow at lower temperatures
typical for beer fermentation. Lower temperatures also allow to control the fermentation more
precisely, in particular in the case of alcohol-free beer production.
Finally, the specific growth rate allows an objective comparison of the growth properties of the
microorganisms. This value is influenced by the microorganism used, medium composition,
temperature and oxygen presence. Temperature is, however, one of the most important factors
affecting the growth of the growth of microorganisms. When the temperature increases towards
the optimal growth temperature, the specific growth rate of yeasts follows the same trend. It was
stated that a linear relationship exists between the square root of the specific growth rate of yeasts
and the growth temperature in the suboptimal temperature range [69]. The only variables in these
experiments were the temperature and media composition. Comparing the specific growth rate
values from the different conditions it can be concluded that the µ values are higher at 16 ºC
which was expected.
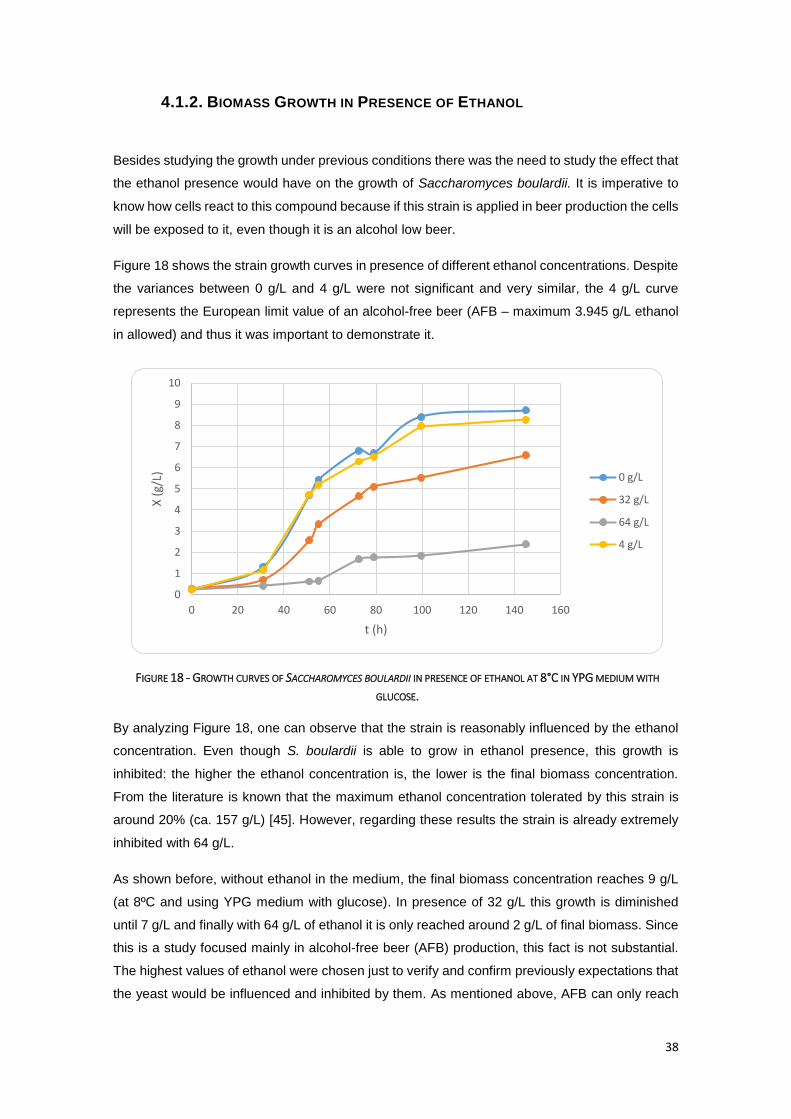
38
4.1.2. BIOMASS GROWTH IN PRESENCE OF ETHANOL
Besides studying the growth under previous conditions there was the need to study the effect that
the ethanol presence would have on the growth of Saccharomyces boulardii. It is imperative to
know how cells react to this compound because if this strain is applied in beer production the cells
will be exposed to it, even though it is an alcohol low beer.
Figure 18 shows the strain growth curves in presence of different ethanol concentrations. Despite
the variances between 0 g/L and 4 g/L were not significant and very similar, the 4 g/L curve
represents the European limit value of an alcohol-free beer (AFB – maximum 3.945 g/L ethanol
in allowed) and thus it was important to demonstrate it.
By analyzing Figure 18, one can observe that the strain is reasonably influenced by the ethanol
concentration. Even though S. boulardii is able to grow in ethanol presence, this growth is
inhibited: the higher the ethanol concentration is, the lower is the final biomass concentration.
From the literature is known that the maximum ethanol concentration tolerated by this strain is
around 20% (ca. 157 g/L) [45]. However, regarding these results the strain is already extremely
inhibited with 64 g/L.
As shown before, without ethanol in the medium, the final biomass concentration reaches 9 g/L
(at 8ºC and using YPG medium with glucose). In presence of 32 g/L this growth is diminished
until 7 g/L and finally with 64 g/L of ethanol it is only reached around 2 g/L of final biomass. Since
this is a study focused mainly in alcohol-free beer (AFB) production, this fact is not substantial.
The highest values of ethanol were chosen just to verify and confirm previously expectations that
the yeast would be influenced and inhibited by them. As mentioned above, AFB can only reach
FIGURE 18 - GROWTH CURVES OF SACCHAROMYCES BOULARDII IN PRESENCE OF ETHANOL AT 8°C IN YPG MEDIUM WITH
GLUCOSE.
0
1
2
3
4
5
6
7
8
9
10
0 20 40 60 80 100 120 140 160
X (
g/L)
t (h)
0 g/L
32 g/L
64 g/L
4 g/L
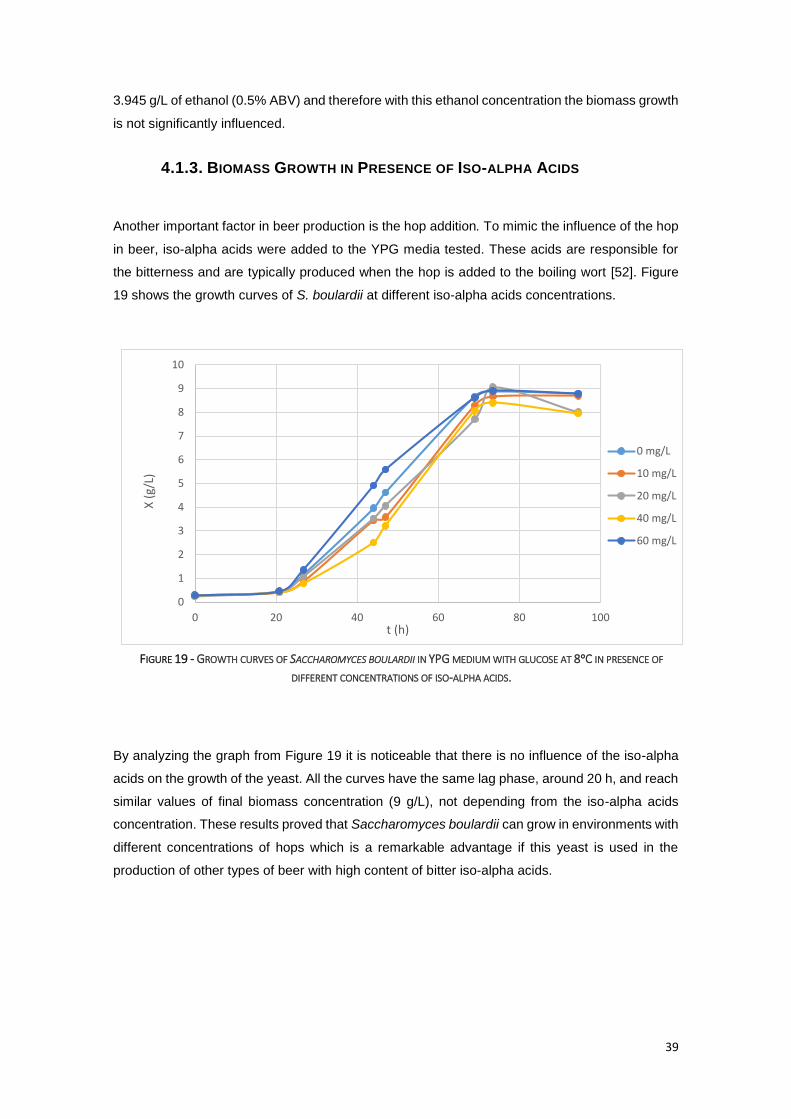
39
3.945 g/L of ethanol (0.5% ABV) and therefore with this ethanol concentration the biomass growth
is not significantly influenced.
4.1.3. BIOMASS GROWTH IN PRESENCE OF ISO-ALPHA ACIDS
Another important factor in beer production is the hop addition. To mimic the influence of the hop
in beer, iso-alpha acids were added to the YPG media tested. These acids are responsible for
the bitterness and are typically produced when the hop is added to the boiling wort [52]. Figure
19 shows the growth curves of S. boulardii at different iso-alpha acids concentrations.
By analyzing the graph from Figure 19 it is noticeable that there is no influence of the iso-alpha
acids on the growth of the yeast. All the curves have the same lag phase, around 20 h, and reach
similar values of final biomass concentration (9 g/L), not depending from the iso-alpha acids
concentration. These results proved that Saccharomyces boulardii can grow in environments with
different concentrations of hops which is a remarkable advantage if this yeast is used in the
production of other types of beer with high content of bitter iso-alpha acids.
FIGURE 19 - GROWTH CURVES OF SACCHAROMYCES BOULARDII IN YPG MEDIUM WITH GLUCOSE AT 8ᵒC IN PRESENCE OF
DIFFERENT CONCENTRATIONS OF ISO-ALPHA ACIDS.
0
1
2
3
4
5
6
7
8
9
10
0 20 40 60 80 100
X (
g/L)
t (h)
0 mg/L
10 mg/L
20 mg/L
40 mg/L
60 mg/L
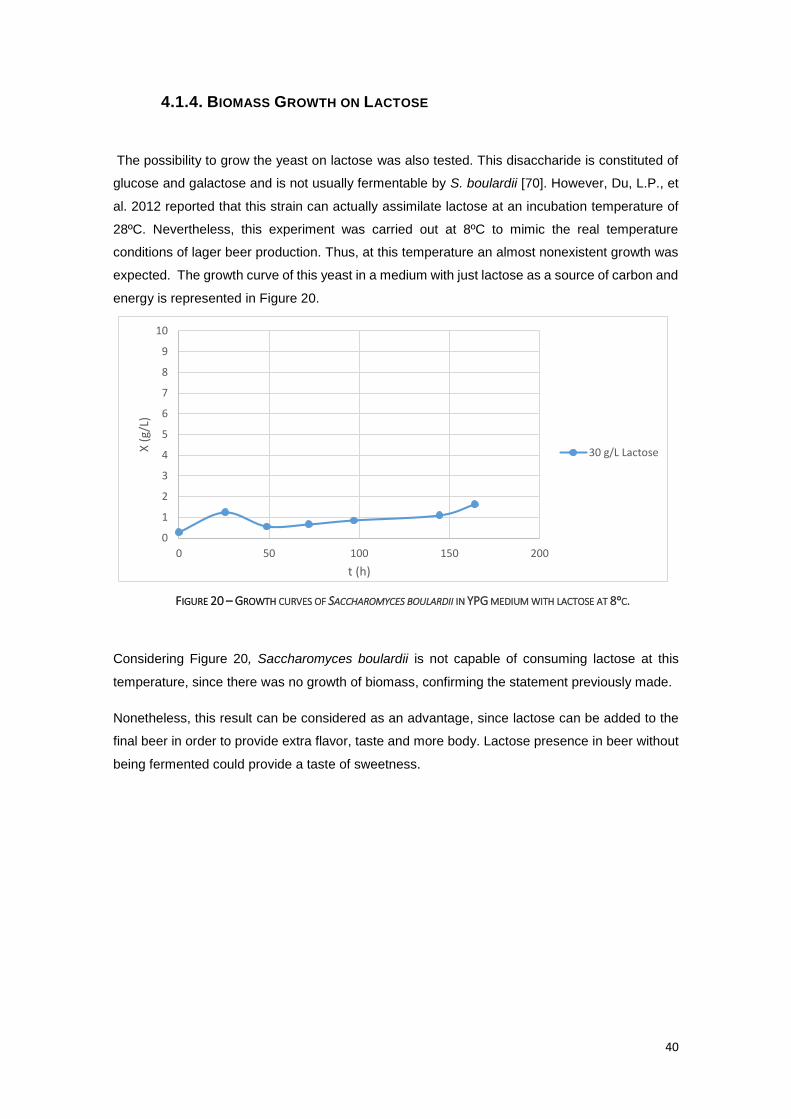
40
4.1.4. BIOMASS GROWTH ON LACTOSE
The possibility to grow the yeast on lactose was also tested. This disaccharide is constituted of
glucose and galactose and is not usually fermentable by S. boulardii [70]. However, Du, L.P., et
al. 2012 reported that this strain can actually assimilate lactose at an incubation temperature of
28ºC. Nevertheless, this experiment was carried out at 8ºC to mimic the real temperature
conditions of lager beer production. Thus, at this temperature an almost nonexistent growth was
expected. The growth curve of this yeast in a medium with just lactose as a source of carbon and
energy is represented in Figure 20.
Considering Figure 20, Saccharomyces boulardii is not capable of consuming lactose at this
temperature, since there was no growth of biomass, confirming the statement previously made.
Nonetheless, this result can be considered as an advantage, since lactose can be added to the
final beer in order to provide extra flavor, taste and more body. Lactose presence in beer without
being fermented could provide a taste of sweetness.
0
1
2
3
4
5
6
7
8
9
10
0 50 100 150 200
X (
g/L)
t (h)
30 g/L Lactose
FIGURE 20 – GROWTH CURVES OF SACCHAROMYCES BOULARDII IN YPG MEDIUM WITH LACTOSE AT 8ᵒC.
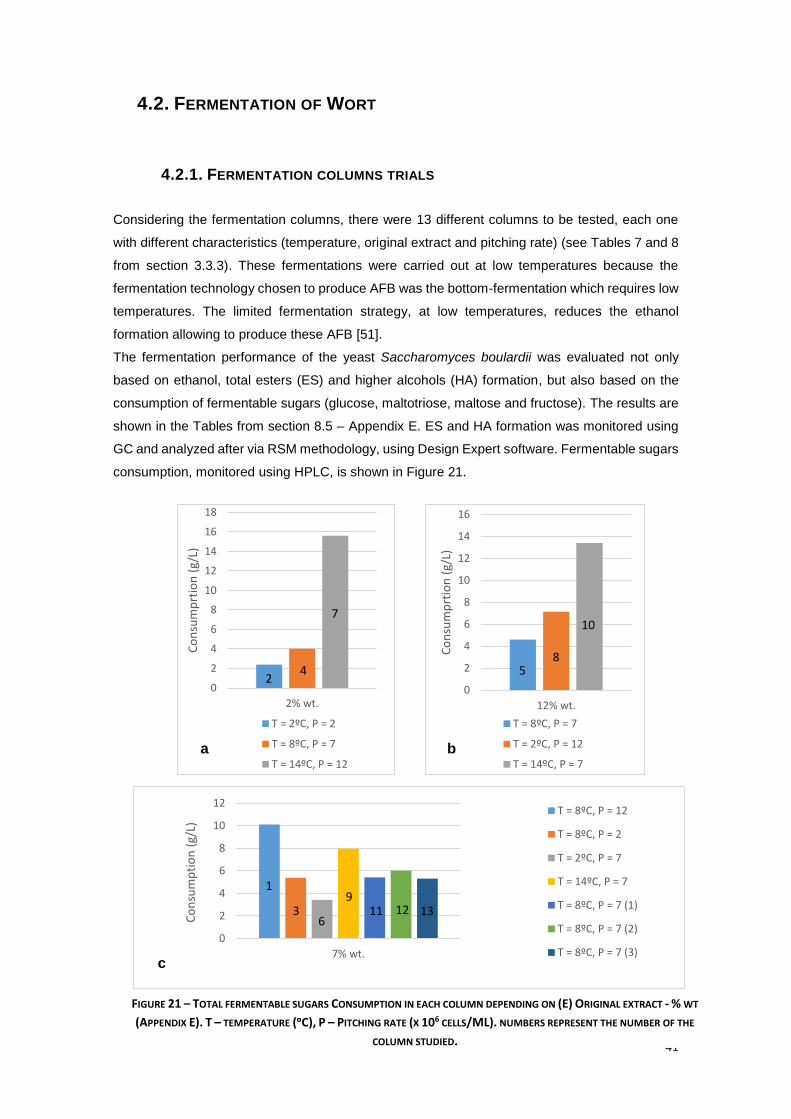
41
4.2. FERMENTATION OF WORT
4.2.1. FERMENTATION COLUMNS TRIALS
Considering the fermentation columns, there were 13 different columns to be tested, each one
with different characteristics (temperature, original extract and pitching rate) (see Tables 7 and 8
from section 3.3.3). These fermentations were carried out at low temperatures because the
fermentation technology chosen to produce AFB was the bottom-fermentation which requires low
temperatures. The limited fermentation strategy, at low temperatures, reduces the ethanol
formation allowing to produce these AFB [51].
The fermentation performance of the yeast Saccharomyces boulardii was evaluated not only
based on ethanol, total esters (ES) and higher alcohols (HA) formation, but also based on the
consumption of fermentable sugars (glucose, maltotriose, maltose and fructose). The results are
shown in the Tables from section 8.5 – Appendix E. ES and HA formation was monitored using
GC and analyzed after via RSM methodology, using Design Expert software. Fermentable sugars
consumption, monitored using HPLC, is shown in Figure 21.
0
2
4
6
8
10
12
14
16
18
2% wt.
Co
nsu
mp
rtio
n (
g/L)
T = 2ºC, P = 2
T = 8ºC, P = 7
T = 14ºC, P = 12
0
2
4
6
8
10
12
14
16
12% wt.
Co
nsu
mp
rtio
n (
g/L)
T = 8ºC, P = 7
T = 2ºC, P = 12
T = 14ºC, P = 7
0
2
4
6
8
10
12
7% wt.
Co
nsu
mp
tio
n (
g/L)
T = 8ºC, P = 12
T = 8ºC, P = 2
T = 2ºC, P = 7
T = 14ºC, P = 7
T = 8ºC, P = 7 (1)
T = 8ºC, P = 7 (2)
T = 8ºC, P = 7 (3)
a b
c
FIGURE 21 – TOTAL FERMENTABLE SUGARS CONSUMPTION IN EACH COLUMN DEPENDING ON (E) ORIGINAL EXTRACT - % WT
(APPENDIX E). T – TEMPERATURE (ᵒC), P – PITCHING RATE (X 106 CELLS/ML). NUMBERS REPRESENT THE NUMBER OF THE
COLUMN STUDIED.
1
2
3
4 5
6
7
8
9
10
11 12 13
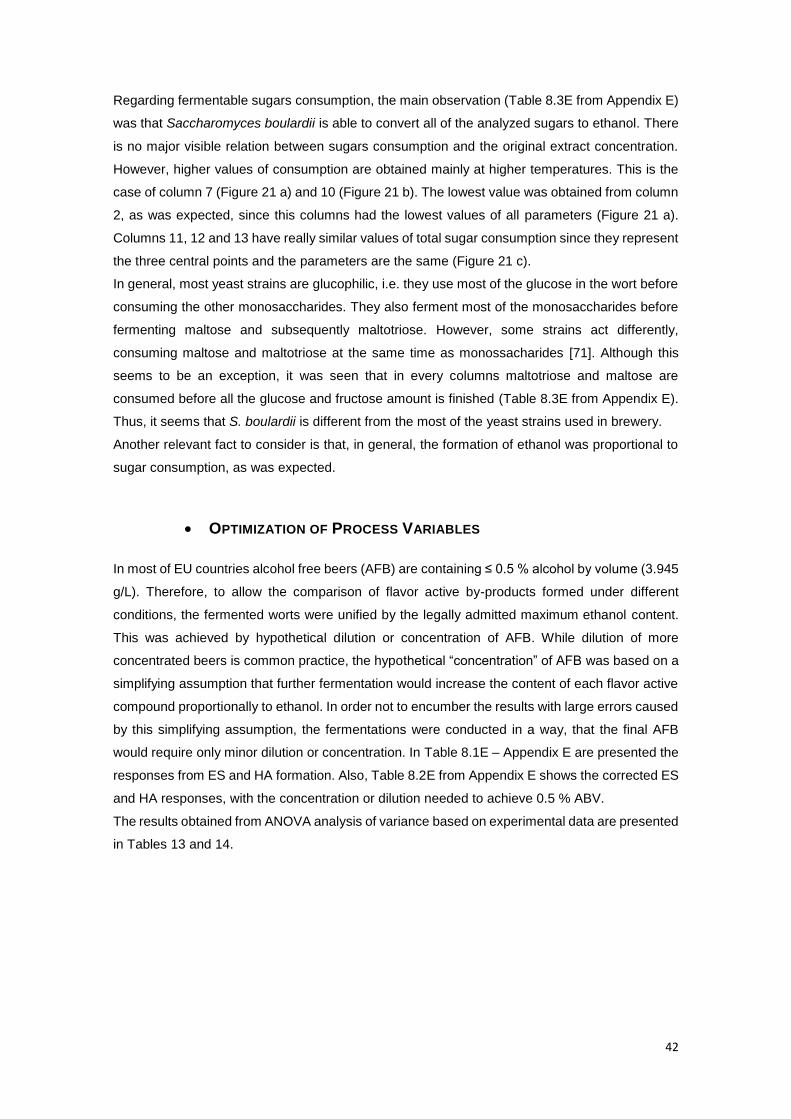
42
Regarding fermentable sugars consumption, the main observation (Table 8.3E from Appendix E)
was that Saccharomyces boulardii is able to convert all of the analyzed sugars to ethanol. There
is no major visible relation between sugars consumption and the original extract concentration.
However, higher values of consumption are obtained mainly at higher temperatures. This is the
case of column 7 (Figure 21 a) and 10 (Figure 21 b). The lowest value was obtained from column
2, as was expected, since this columns had the lowest values of all parameters (Figure 21 a).
Columns 11, 12 and 13 have really similar values of total sugar consumption since they represent
the three central points and the parameters are the same (Figure 21 c).
In general, most yeast strains are glucophilic, i.e. they use most of the glucose in the wort before
consuming the other monosaccharides. They also ferment most of the monosaccharides before
fermenting maltose and subsequently maltotriose. However, some strains act differently,
consuming maltose and maltotriose at the same time as monossacharides [71]. Although this
seems to be an exception, it was seen that in every columns maltotriose and maltose are
consumed before all the glucose and fructose amount is finished (Table 8.3E from Appendix E).
Thus, it seems that S. boulardii is different from the most of the yeast strains used in brewery.
Another relevant fact to consider is that, in general, the formation of ethanol was proportional to
sugar consumption, as was expected.
OPTIMIZATION OF PROCESS VARIABLES
In most of EU countries alcohol free beers (AFB) are containing ≤ 0.5 % alcohol by volume (3.945
g/L). Therefore, to allow the comparison of flavor active by-products formed under different
conditions, the fermented worts were unified by the legally admitted maximum ethanol content.
This was achieved by hypothetical dilution or concentration of AFB. While dilution of more
concentrated beers is common practice, the hypothetical “concentration” of AFB was based on a
simplifying assumption that further fermentation would increase the content of each flavor active
compound proportionally to ethanol. In order not to encumber the results with large errors caused
by this simplifying assumption, the fermentations were conducted in a way, that the final AFB
would require only minor dilution or concentration. In Table 8.1E – Appendix E are presented the
responses from ES and HA formation. Also, Table 8.2E from Appendix E shows the corrected ES
and HA responses, with the concentration or dilution needed to achieve 0.5 % ABV.
The results obtained from ANOVA analysis of variance based on experimental data are presented
in Tables 13 and 14.

43
TABLE 13 - ANOVA FOR RESPONSE SURFACE QUADRATIC MODEL OF ES FORMATION BY SACCHAROMYCES BOULARDII.
Source SSQ d.f MSQ F-value p-value
(probability>F)
Model 0.50 9 0.056 218.79 0.0005
E NS 1 NS NS 0.9427
T 0.13 1 0.13 522.46 0.0002
P 0.019 1 0.019 75.78 0.0032
ET NS 1 NS 3.13 0.1749
EP 0.012 1 0.012 47.56 0.0062
TP NS 1 NS 37.50 0.0088
E2 NS 1 NS 21.10 0.0194
T2 NS 1 NS 29.82 0.0121
P2 0.069 1 0.069 267.78 0.0005
Residual NS 3 NS
Lack of Fit NS 1 NS 0.038 0.8627
Pure Error NS 2 NS
Cor Total 0.51 12
R2 0.9985
Adjusted R2 0.9939
SSQ, Sum of squares; d.f., degree of freedom; MSQ, mean square; NS, not significant.
TABLE 14 - ANOVA FOR RESPONSE SURFACE QUADRATIC MODEL OF HA FORMATION BY SACCHAROMYCES BOULARDII.
Source SSQ d.f MSQ
F-value p-value
(probability>F)
Model 128.59 7 18.37 30.27 0.0008
E NS 1 NS NS 0.9593
T 53.62 1 53.62 88.36 0.0002
P 3.13 1 3.13 5.15 0.0724
ET 0.45 1 0.45 0.74 0.4288
EP - - - - -
TP 3.50 1 3.50 5.76 0.0615
E2 - - - - -
T2 2.74 1 2.74 4.51 0.0871
P2 5.90 1 5.90 9.72 0.0263
Residual 3.03 5 0.61
Lack of Fit 2.52 3 0.84 3.26 0.2435
Pure Error 0.51 2 0.26
Cor Total 131.62 12
R2 0.9770
Adjusted R2 0.9447 SSQ, Sum of squares; d.f., degree of freedom; MSQ, mean square; NS, not significant.
The multifactorial model analysis for volatile compound formation (ES and HA) by this strain had
considerable high F-values (218.79 and 30.27 for ES and HA, respectively) and low p-values
(0.0005 and 0.0008), which indicated that the models were significant and are correct method to
express the data. The good correlation between the experimental and predicted values was
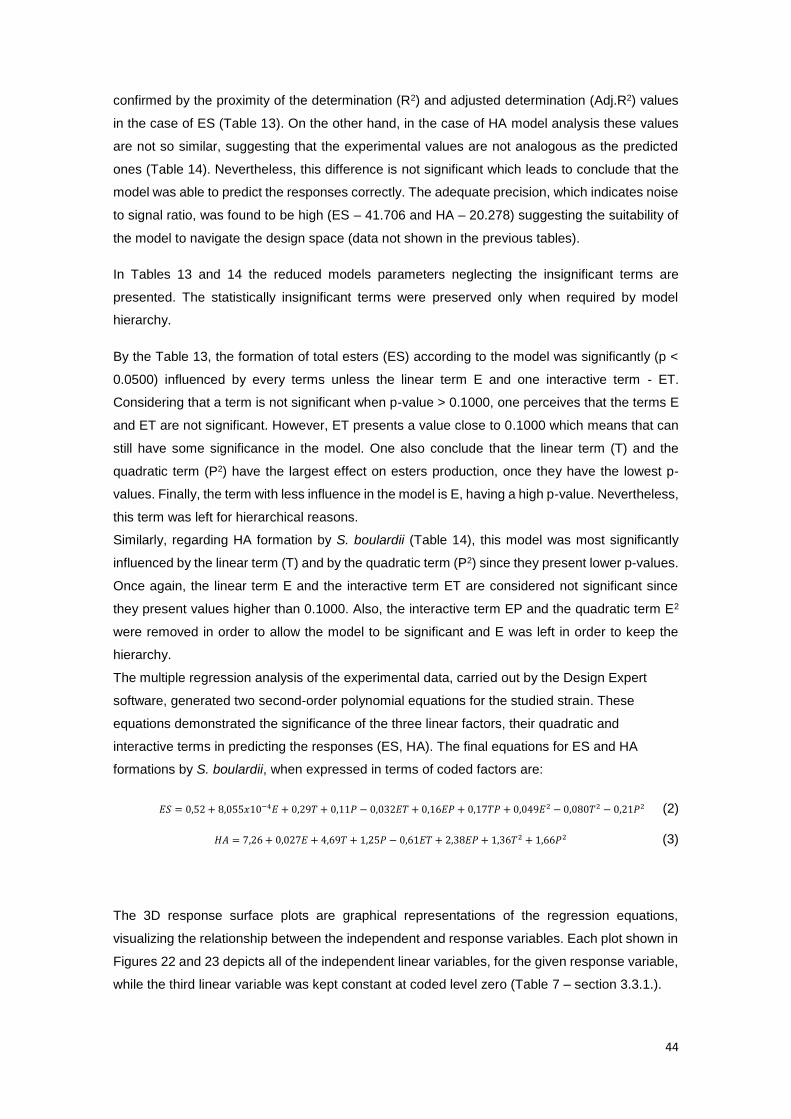
44
confirmed by the proximity of the determination (R2) and adjusted determination (Adj.R2) values
in the case of ES (Table 13). On the other hand, in the case of HA model analysis these values
are not so similar, suggesting that the experimental values are not analogous as the predicted
ones (Table 14). Nevertheless, this difference is not significant which leads to conclude that the
model was able to predict the responses correctly. The adequate precision, which indicates noise
to signal ratio, was found to be high (ES – 41.706 and HA – 20.278) suggesting the suitability of
the model to navigate the design space (data not shown in the previous tables).
In Tables 13 and 14 the reduced models parameters neglecting the insignificant terms are
presented. The statistically insignificant terms were preserved only when required by model
hierarchy.
By the Table 13, the formation of total esters (ES) according to the model was significantly (p <
0.0500) influenced by every terms unless the linear term E and one interactive term - ET.
Considering that a term is not significant when p-value > 0.1000, one perceives that the terms E
and ET are not significant. However, ET presents a value close to 0.1000 which means that can
still have some significance in the model. One also conclude that the linear term (T) and the
quadratic term (P2) have the largest effect on esters production, once they have the lowest p-
values. Finally, the term with less influence in the model is E, having a high p-value. Nevertheless,
this term was left for hierarchical reasons.
Similarly, regarding HA formation by S. boulardii (Table 14), this model was most significantly
influenced by the linear term (T) and by the quadratic term (P2) since they present lower p-values.
Once again, the linear term E and the interactive term ET are considered not significant since
they present values higher than 0.1000. Also, the interactive term EP and the quadratic term E2
were removed in order to allow the model to be significant and E was left in order to keep the
hierarchy.
The multiple regression analysis of the experimental data, carried out by the Design Expert
software, generated two second-order polynomial equations for the studied strain. These
equations demonstrated the significance of the three linear factors, their quadratic and
interactive terms in predicting the responses (ES, HA). The final equations for ES and HA
formations by S. boulardii, when expressed in terms of coded factors are:
𝐸𝑆 = 0,52 + 8,055𝑥10−4𝐸 + 0,29𝑇 + 0,11𝑃 − 0,032𝐸𝑇 + 0,16𝐸𝑃 + 0,17𝑇𝑃 + 0,049𝐸2 − 0,080𝑇2 − 0,21𝑃2 (2)
𝐻𝐴 = 7,26 + 0,027𝐸 + 4,69𝑇 + 1,25𝑃 − 0,61𝐸𝑇 + 2,38𝐸𝑃 + 1,36𝑇2 + 1,66𝑃2 (3)
The 3D response surface plots are graphical representations of the regression equations,
visualizing the relationship between the independent and response variables. Each plot shown in
Figures 22 and 23 depicts all of the independent linear variables, for the given response variable,
while the third linear variable was kept constant at coded level zero (Table 7 – section 3.3.1.).
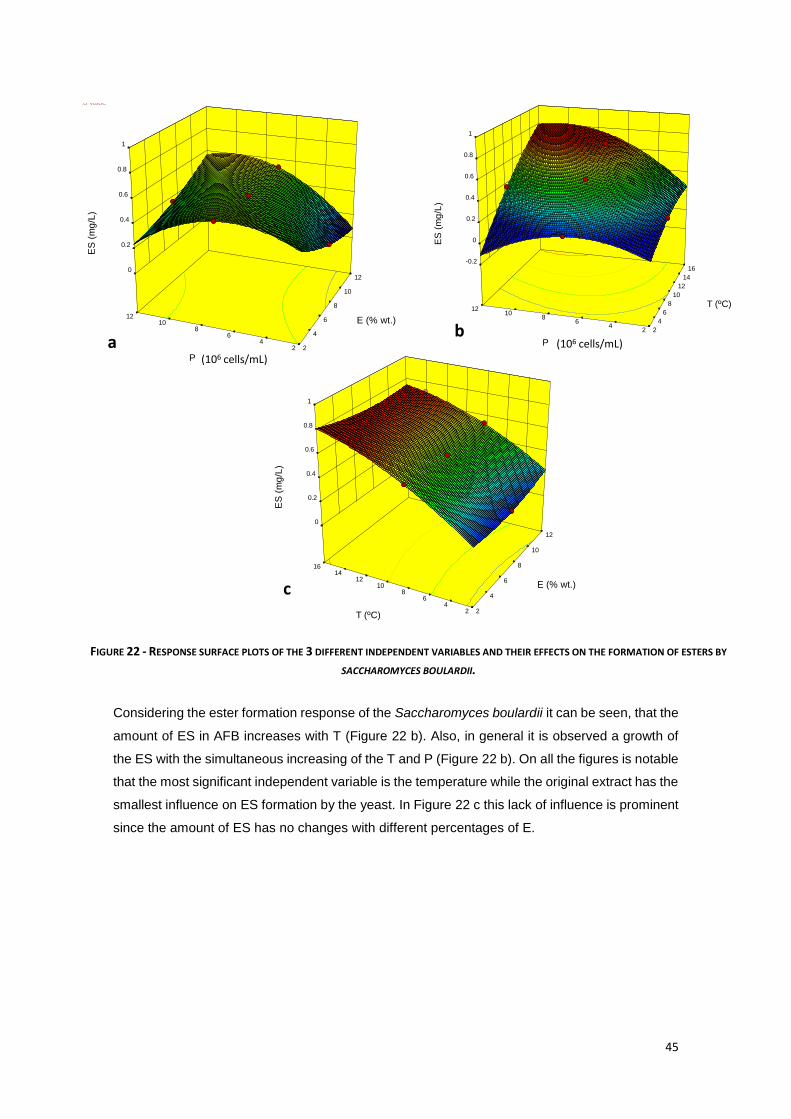
45
Considering the ester formation response of the Saccharomyces boulardii it can be seen, that the
amount of ES in AFB increases with T (Figure 22 b). Also, in general it is observed a growth of
the ES with the simultaneous increasing of the T and P (Figure 22 b). On all the figures is notable
that the most significant independent variable is the temperature while the original extract has the
smallest influence on ES formation by the yeast. In Figure 22 c this lack of influence is prominent
since the amount of ES has no changes with different percentages of E.
c
Design-Expert® Software
Factor Coding: Actual
ES (mg/L)
Design points above predicted value
Design points below predicted value
0.715962
0.130906
X1 = A: Original Extract
X2 = B: Temperature
Actual Factor
C: Pitching rate = 7
2 4
6 8
10 12
14 16
2
4
6
8
10
12
0
0.2
0.4
0.6
0.8
1
ES
(m
g/L
)
E (% wt.)
T (ºC)
(106 cells/mL)
Design-Expert® Software
Factor Coding: Actual
ES (mg/L)
Design points above predicted value
Design points below predicted value
0.715962
0.130906
X1 = A: Original Extract
X2 = C: Pitching rate
Actual Factor
B: Temperature = 8
2 4
6 8
10 12
2
4
6
8
10
120
0.2
0.4
0.6
0.8
1
ES
(m
g/L
)
E (% wt.)
P
a (106 cells/mL)
Design-Expert® Software
Factor Coding: Actual
ES (mg/L)
Design points above predicted value
Design points below predicted value
0.715962
0.130906
X1 = B: Temperature
X2 = C: Pitching rate
Actual Factor
A: Original Extract = 7
2 4
6 8
10 12
2
4
6
8
10
12
14
16-0.2
0
0.2
0.4
0.6
0.8
1
ES
(m
g/L
)
T (ºC)
Pb
FIGURE 22 - RESPONSE SURFACE PLOTS OF THE 3 DIFFERENT INDEPENDENT VARIABLES AND THEIR EFFECTS ON THE FORMATION OF ESTERS BY
SACCHAROMYCES BOULARDII.
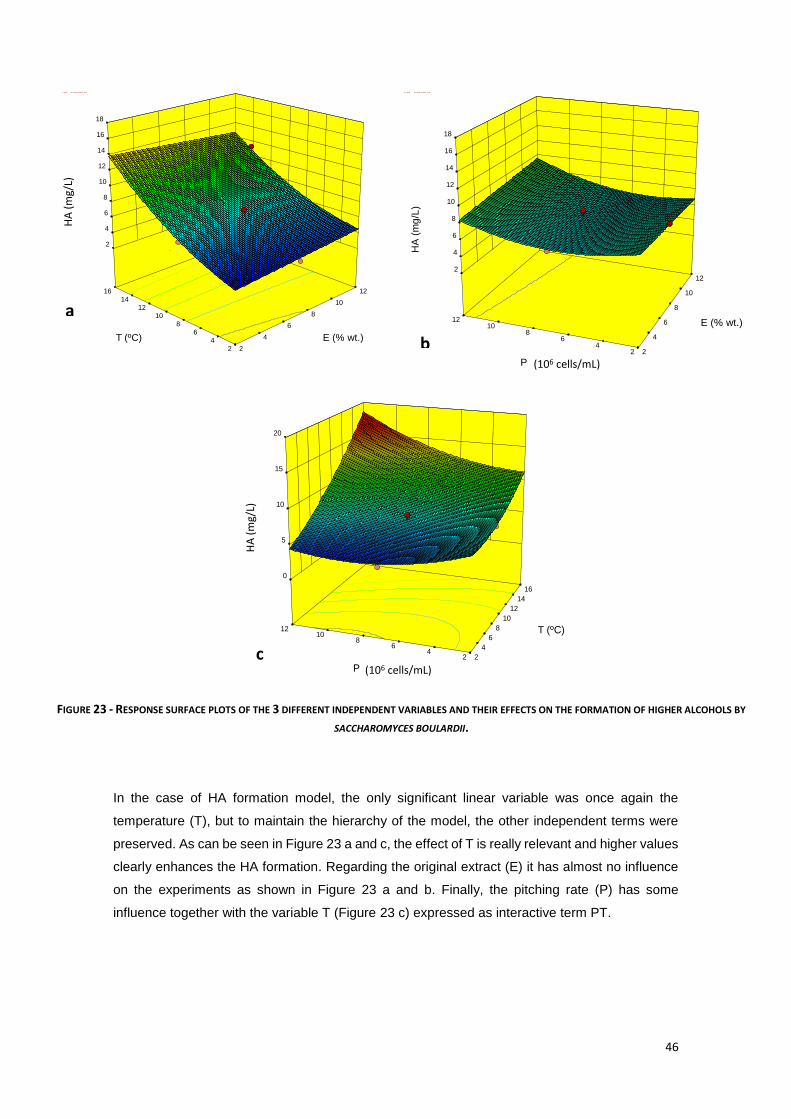
46
In the case of HA formation model, the only significant linear variable was once again the
temperature (T), but to maintain the hierarchy of the model, the other independent terms were
preserved. As can be seen in Figure 23 a and c, the effect of T is really relevant and higher values
clearly enhances the HA formation. Regarding the original extract (E) it has almost no influence
on the experiments as shown in Figure 23 a and b. Finally, the pitching rate (P) has some
influence together with the variable T (Figure 23 c) expressed as interactive term PT.
(106 cells/mL)
Design-Expert® Software
Factor Coding: Actual
HA (mg/l)
Design points above predicted value
Design points below predicted value
16.518
3.45061
X1 = A: Original Extract
X2 = C: Pitching rate
Actual Factor
B: Temperature = 8
2 4
6 8
10 12
2
4
6
8
10
12
2
4
6
8
10
12
14
16
18
HA
(m
g/L
)
E (% wt.)
P
b
a
Design-Expert® Software
Factor Coding: Actual
HA (mg/l)
Design points above predicted value
Design points below predicted value
16.518
3.45061
X1 = A: Original Extract
X2 = B: Temperature
Actual Factor
C: Pitching rate = 7
2
4
6
8
10
12
14
16
2
4
6
8
10
12
2
4
6
8
10
12
14
16
18
HA
(m
g/l)
E (% wt.)T (ºC)
HA
(m
g/L)
(106 cells/mL)
Design-Expert® Software
Factor Coding: Actual
HA (mg/l)
Design points above predicted value
Design points below predicted value
16.518
3.45061
X1 = B: Temperature
X2 = C: Pitching rate
Actual Factor
A: Original Extract = 7
2 4
6 8
10 12
2
4
6
8
10
12
14
16
0
5
10
15
20
HA
(m
g/l)
T (ºC)
Pc
HA
(m
g/L)
FIGURE 23 - RESPONSE SURFACE PLOTS OF THE 3 DIFFERENT INDEPENDENT VARIABLES AND THEIR EFFECTS ON THE FORMATION OF HIGHER ALCOHOLS BY
SACCHAROMYCES BOULARDII.
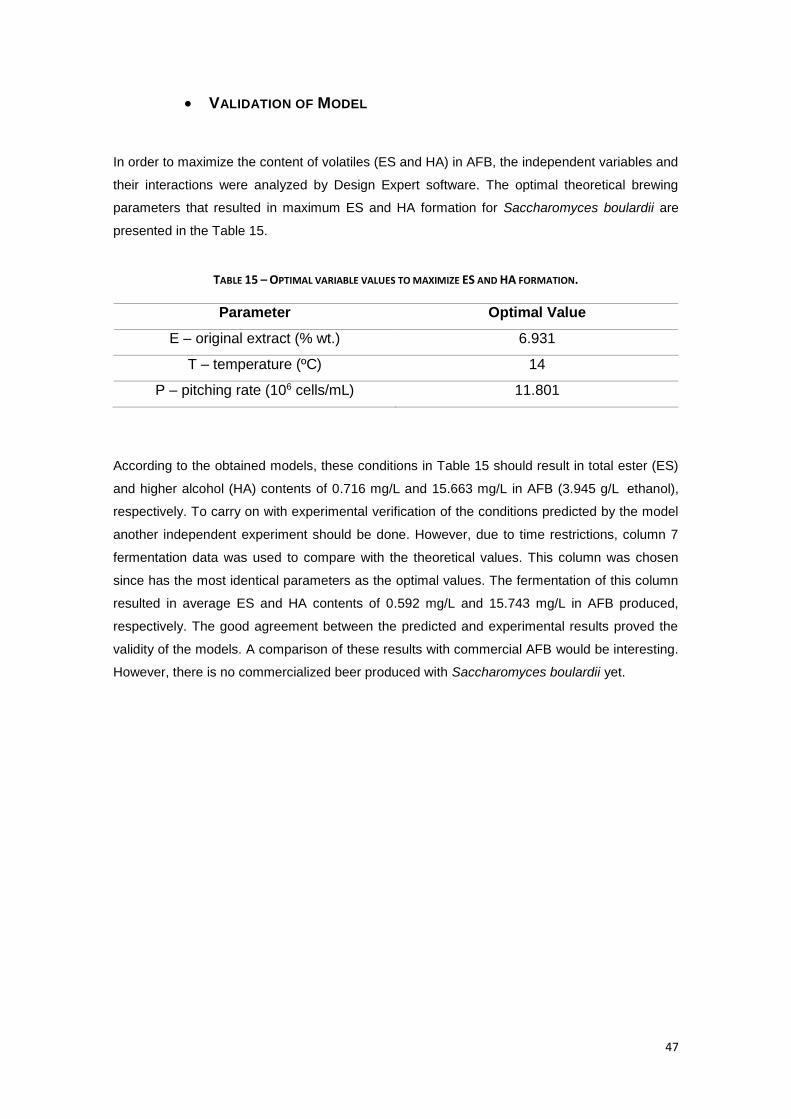
47
VALIDATION OF MODEL
In order to maximize the content of volatiles (ES and HA) in AFB, the independent variables and
their interactions were analyzed by Design Expert software. The optimal theoretical brewing
parameters that resulted in maximum ES and HA formation for Saccharomyces boulardii are
presented in the Table 15.
TABLE 15 – OPTIMAL VARIABLE VALUES TO MAXIMIZE ES AND HA FORMATION.
Parameter Optimal Value
E – original extract (% wt.) 6.931
T – temperature (ºC) 14
P – pitching rate (106 cells/mL) 11.801
According to the obtained models, these conditions in Table 15 should result in total ester (ES)
and higher alcohol (HA) contents of 0.716 mg/L and 15.663 mg/L in AFB (3.945 g/L ethanol),
respectively. To carry on with experimental verification of the conditions predicted by the model
another independent experiment should be done. However, due to time restrictions, column 7
fermentation data was used to compare with the theoretical values. This column was chosen
since has the most identical parameters as the optimal values. The fermentation of this column
resulted in average ES and HA contents of 0.592 mg/L and 15.743 mg/L in AFB produced,
respectively. The good agreement between the predicted and experimental results proved the
validity of the models. A comparison of these results with commercial AFB would be interesting.
However, there is no commercialized beer produced with Saccharomyces boulardii yet.

48
FINAL CONSIDERATIONS
The first aspect to have into account is that, evidently, the cylinders where the fermentations were
carried out do not mimic the real conditions of beer production. In beer production these
fermentations are carried out in large fermentation tanks where the mass transfer is probably
different from that in lab columns. Thus, it is expected a lack of homogeneity in the lab columns,
especially in terms of oxygen, ethanol and fermentation by-products. These assumptions would
have clear implications to the fermentations outcome and the final products that were analyzed,
not allowing the exact accuracy of the results. Another significant point refers to hydrostatic
pressure in the columns, what is really difficult to simulate. This may adversely influence, when
at high pressure levels, the physiological state of cells and thus, the formation of aroma
compounds [57].
Nonetheless, regarding the results, a proportional ES and HA formation to the ethanol formation
was observed. The formation of ES is residual though (values lower than 1 mg/L) while the HA
reached values of 15 mg/L.
Concerning the real low volatiles values, a strategy of grouping all the esters and all the higher
alcohols was adopted. Thus, during this thesis ES was the total amount of esters obtained and
HA was the total amount of higher alcohols. Still, comparing the results obtained with Table 4
(section 2.3.4), it can be confirmed that the values are really low. However, these small amounts
of ES and HA are actually predictable, since the aim was to obtain an AFB using the limited
fermentation method.
Although the obtained values of ES and HA are low, their trend are in accordance with literature.
A higher amount of higher alcohols comparing to lower values of esters was expected, since HA
are the most abundant organoleptic compounds present in beer [58]. Indeed, this fact can be
confirmed by this work, although a minimal amount of esters was detected.
Also, the higher the total sugars consumption was, the larger was the amount of ethanol
produced, as expected.
Temperature is an important parameter to control and manage in beer fermentation. Increased
fermentation temperatures usually stimulate the formation of volatile metabolic by-products
through increased cellular growth. It was reported that increasing fermentation temperatures
stimulate the expression of permeases that promote the transport of valine, leucine and isoleucine
into the yeast cell leading to increased metabolic flux through Ehrlich pathway, and consequently
enhancing higher alcohol formation [72], [73]. Thus, there is an increase of propanol, isobutanol,
isoamyl alcohol and 2-phenylethanol levels caused by rising the fermentation temperature [74].
Consequently, a temperature increase leads also to an increase of esters, since higher alcohols
(also called fusel alcohols) are required to ester formation [75]. In addition, the genes encrypting
alcohol acetyltransferase (ATF1, ATF2) are upregulated with increasing temperatures and the

49
expression of these genes are correlated with the final concentration of important esters [74].
Thus, the increase in fermentation temperature increase also the acetate esters and total ethyl
ester concentration in beer [75], [64]. All of these assumptions are in agreement with the finding
of this study. Temperature, as a variable process parameter, had a significant and positive impact
on ES and HA formation by Saccharomyces boulardii. It is important to refer that all the references
quoted above are referring to studies with brewer yeasts and not with Saccharomyces boulardii,
since there are no studies with this strain as fermenting yeast.
According to the literature, the amount and composition of carbon sources has also effect on the
accumulation of volatile compounds in beer. By increasing wort concentration, all acetate esters
are overproduced by brewer yeasts [74]. Indeed, in the present work the results lead to the
conclusion that this statement is correct. However, the increasing amount of ES is not truly
significant and the values are similar from column to column. Thus, the original extract does not
have a major influence in the fermentation with S. boulardii. On the other hand, not only the
amount, but also the type of sugars may influence the volatile profile of beer. Worts rich in
monosaccharides (glucose, fructose) typically result in beers with higher ES contents than those
rich in maltose [76], [77]. As an explanation it was suggested that glucose increases acetyl-CoA
formation, which is the primary substrate for acetate esters synthesis [78]. Simultaneously it was
found that glucose increases ester synthase activity in carbon-starved cells [79]. Considering the
results obtained in this work in terms of these findings, the positive and significant effect of E
(increasing glucose availability) on ES formation is not in totally accordance with the literature.
Similarly to ES, the final concentration of HA in beer is determined by the uptake efficiency of
amino acids and sugar utilization rate [58]. Comparing the results from two columns with the same
conditions and differing only in the original extract concentration (Table 16), it can be seen that
this parameter does not have a major influence in the ES and HA formation with S. boulardii.
TABLE 16 – COMPARISON OF COLUMNS 4 AND 5 RESULTS.
E (% wt.) T (ºC) P
(106 cells/mL)
Ethanol
formation
(g/L)
ES
formation
(mg/L)
HA
formation
(mg/L)
Column 4 2 8 7 2.12 0.28 3.37
Column 5 12 8 7 2.24 0.30 3.45
By analyzing the values in Table 16 the amount of ES is residual and not significant with truly low
values. In this case, once again, the changes in E did not influence the formation of HA
significantly. The HA formation in these two columns has similar values independently of the
original extract (E) concentration (3.37 and 3.45 mg/L). It was supposed that the increasing of E
(increasing proportion of glucose converted to ethanol) may influence the formation of HA by S.
boulardii. However the difference between columns 4 and 5 is negligible. One has to keep in mind

50
that the AFB compared in this work were unified by ethanol content (3.945 g/L), and therefore at
increasing E, this ethanol is produced from increasing portion of glucose. In general, observing
the results (Figure 22 and 23) the original extract (E) is the parameter that has the least significant
impact on the ES and HA formation during the AFB production, which is contradictory with the
literature.
In traditional alcoholic beer fermentation the increasing pitching rate (P) increased significantly
the fermentation rate, without affecting significantly the production of volatile compounds [80]. In
this case, it was observable by comparing the different fermentation columns (Table 17) that the
ES and HA formation increased with the increase of P. An interesting curiosity of the yeast is
related with the extent of growth at different cell densities. At low P the net yeast growth is larger,
before producing the legally admitted amount of ethanol, which can result in enhanced production
of higher alcohols by brewer yeasts [81]. However, S. boulardii counteracted this statement.
TABLE 17 - COMPARISON OF COLUMNS 1 AND 3 RESULTS.
E (% wt.) T (ºC) P
(106 cells/mL)
Ethanol
formation
(g/L)
ES
formation
(mg/L)
HA
formation
(mg/L)
Column 1 7 8 12 3.39 0.31 7.44
Column 3 7 8 2 2.38 0.11 4.37
Regarding the optimal conditions generated by RSM, the combination of optimized process
variables used for maximum volatile formation is an interesting suggestion how to improve the
volatile content in commercial AFB. The results from RSM provided an AFB with optimal
conditions of E – 6.931% wt; T - 14ᵒC; P – 11.801 x 10⁶ cells/mL.
The original wort extract (E) required to produce a typical AFB is around 4 to 7.5 % wt.,
considering the limited fermentation production [51]. Therefore, the AFB produced from 6.931 %
wt. would not need the dilution or concentration of the wort since the value is in the range.
However, a challenge related to optimized process variables would be the control process of
limited fermentation carried out at 14°C. Thus, a possible alternative to approach this problem is
to ferment at lower temperatures (2ºC). However, under these conditions the AFB produced is
extremely poor in ES and HA contents as shown before. To overcome this aroma problem, the
addition of lactose could increase the palatefulness. Also, another solution to increase the flavor
could be the use of higher levels of original extract (> 7.5% wt.). Afterwards, the beer would be
diluted until obtain 0.5% ABV, in case of need.
Also, in these analyzes, the monitorization of the levels of carbon dioxide was not possible for
lack of resources which is a deviation from the real beer production technologies. In industrial
production the beer ferments in lagering tanks under controlled CO2 pressure, what permits to
reach the desired CO2 amount dissolved in beer. This fact has influence in the final sensory
perception.
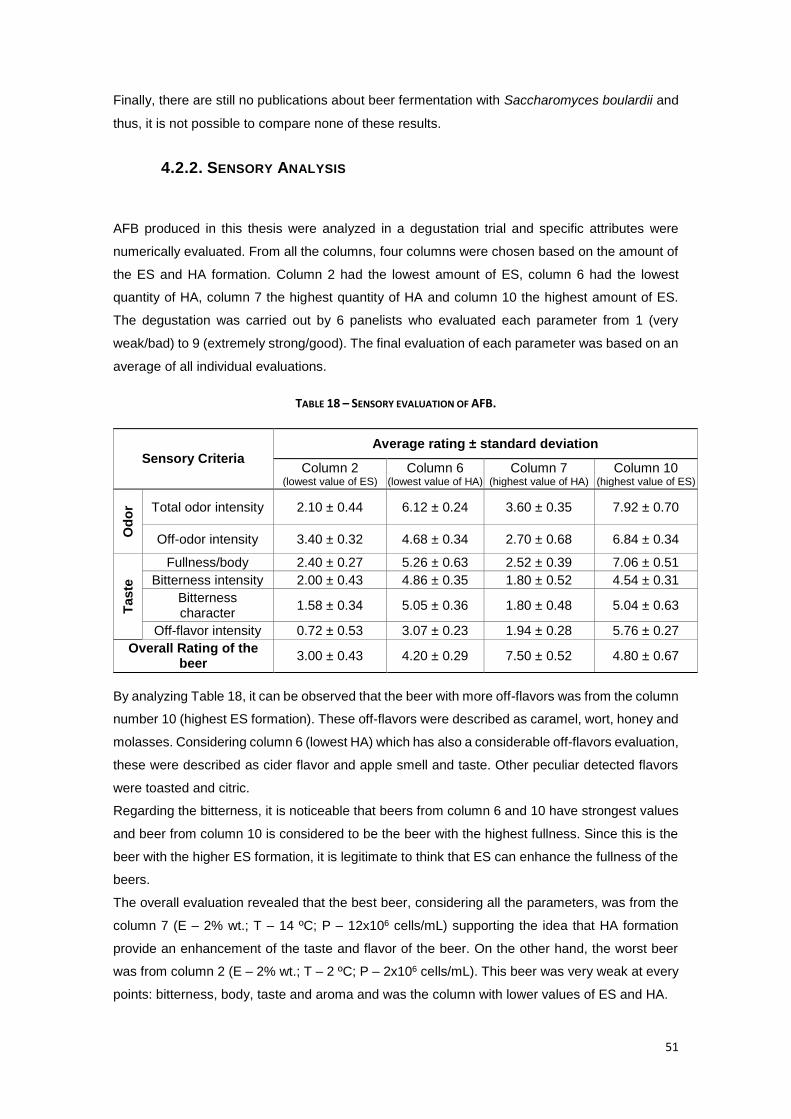
51
Finally, there are still no publications about beer fermentation with Saccharomyces boulardii and
thus, it is not possible to compare none of these results.
4.2.2. SENSORY ANALYSIS
AFB produced in this thesis were analyzed in a degustation trial and specific attributes were
numerically evaluated. From all the columns, four columns were chosen based on the amount of
the ES and HA formation. Column 2 had the lowest amount of ES, column 6 had the lowest
quantity of HA, column 7 the highest quantity of HA and column 10 the highest amount of ES.
The degustation was carried out by 6 panelists who evaluated each parameter from 1 (very
weak/bad) to 9 (extremely strong/good). The final evaluation of each parameter was based on an
average of all individual evaluations.
TABLE 18 – SENSORY EVALUATION OF AFB.
By analyzing Table 18, it can be observed that the beer with more off-flavors was from the column
number 10 (highest ES formation). These off-flavors were described as caramel, wort, honey and
molasses. Considering column 6 (lowest HA) which has also a considerable off-flavors evaluation,
these were described as cider flavor and apple smell and taste. Other peculiar detected flavors
were toasted and citric.
Regarding the bitterness, it is noticeable that beers from column 6 and 10 have strongest values
and beer from column 10 is considered to be the beer with the highest fullness. Since this is the
beer with the higher ES formation, it is legitimate to think that ES can enhance the fullness of the
beers.
The overall evaluation revealed that the best beer, considering all the parameters, was from the
column 7 (E – 2% wt.; T – 14 ºC; P – 12x106 cells/mL) supporting the idea that HA formation
provide an enhancement of the taste and flavor of the beer. On the other hand, the worst beer
was from column 2 (E – 2% wt.; T – 2 ºC; P – 2x10⁶ cells/mL). This beer was very weak at every
points: bitterness, body, taste and aroma and was the column with lower values of ES and HA.
Sensory Criteria Average rating ± standard deviation
Column 2 (lowest value of ES)
Column 6 (lowest value of HA)
Column 7 (highest value of HA)
Column 10 (highest value of ES)
Od
or Total odor intensity 2.10 ± 0.44 6.12 ± 0.24 3.60 ± 0.35 7.92 ± 0.70
Off-odor intensity 3.40 ± 0.32 4.68 ± 0.34 2.70 ± 0.68 6.84 ± 0.34
Taste
Fullness/body 2.40 ± 0.27 5.26 ± 0.63 2.52 ± 0.39 7.06 ± 0.51
Bitterness intensity 2.00 ± 0.43 4.86 ± 0.35 1.80 ± 0.52 4.54 ± 0.31
Bitterness character
1.58 ± 0.34 5.05 ± 0.36 1.80 ± 0.48 5.04 ± 0.63
Off-flavor intensity 0.72 ± 0.53 3.07 ± 0.23 1.94 ± 0.28 5.76 ± 0.27
Overall Rating of the beer
3.00 ± 0.43 4.20 ± 0.29 7.50 ± 0.52 4.80 ± 0.67

52
5. CONCLUSIONS
From previous studies it was known that the yeast Saccharomyces boulardii has a positive effect
on the intestinal microflora. In fact, this yeast has already been commercialized as a medicine to
help the digestion and improve the immunity system. Therefore, it would be a visionary idea to
combine these probiotic benefits from the strain to produce a non-alcoholic beer. However, so far
little is known about this yeast and its features, growth and ability to ferment and produce beer.
Thus, this was the aim of this thesis.
Firstly, it was concluded that S. boulardii is capable of fermenting glucose and other carbon
sources as dextrin which is a good indicator that it is able to produce beer [45]. Among the studied
temperatures (2 ºC, 8 ºC and 16 ºC), the most suitable temperature for growth was 16ºC, as
expected. At 16 ºC there were higher final biomass concentrations and these values were reached
faster than at the other temperatures. At 16ºC were reached values of 12 g/L using YPG medium
with just glucose and 10 g/L using YPG medium with glucose and dextrin. On the other hand, at
8ºC were reached values of 9g/L and 7g/L and at 2ºC, values of 7 g/L and 6 g/L, respectively.
However, since the objective was to study the use of this non-brewing yeast in production of non-
alcoholic beer using the limited fermentation strategy, there was no reason to test the growth at
temperatures above 16 °C.
Also, it was tested the growth of S. boulardii in lactose medium and presence of iso-alpha acids
and ethanol to mimic the environment of real beer. From these trials can be concluded that the
yeast does not metabolize lactose, so it can be added to the beer without being fermented,
improving the flavor and taste. Regarding iso-alpha acids, S. boulardii can grow in their presence
and does not show any change in growth rates when the concentration of the acids is changed.
This means that this yeast can ferment bitter brewery wort. Finally, the specific growth rate of
Saccharomyces boulardii decreases with increasing ethanol concentration, but significant effect
is observed only at ca. 16 % vol. ethanol concentration, not affecting alcohol-free beers.
The experiment focused on wort fermentation revealed, that the statistically most significant effect
on volatile formation (HA and ES) was the fermentation temperature. The impact of original wort
extract was negligible, while the effect of the pitching rate was on the edge of statistical
significance. The only interactive term with moderate effect on volatile formation was the
interaction between temperature and pitching rate (PT). Among quadratic terms, only the pitching
rate (P2) was significant and revealed a local extreme. Overall, the statistical model proved to be
a useful tool in predicting the volatile formation by this non-brewery yeast and can be used in
designing the production procedure for probiotic alcohol-free beer.
Regarding the sensory analysis, the beer with a higher rating from the columns evaluated was
from the column 7. This column had the highest values of HA (15.7 mg/L) and reasonable high
53
ES value (0.59 mg/L), supporting the idea that volatile compounds enhance the taste and flavor
of the beer.
In conclusion, AFB production has gained more and more attention and has recently experienced
a boom. This fact contributes to the discovery of new products and to the improvement of the
existing ones in the highly competitive beer market. Considering the study made with
Saccharomyces boulardii, this yeast strain has a considerable potential in low alcoholic and
alcohol-free beer production. This result is a remarkable outcome since the beer fermented with
this strain could have an added value of the probiotic positive effect in the intestinal microflora as
compared to the normal beer. It could act as a “medicinal beer”, being a source of probiotics.
6. FUTURE PERSPECTIVES
Despite the promising results previously obtained, several further studies should be carried out
to confirm the probiotic relevance of Saccharomyces boulardii in beer. Testing this beer as a
nutraceutical supplement in several groups of people with intestinal diseases would be necessary
in order to understand the efficiency and to verify if they would get better.
Another aspect to have into account would be to test the long term viability of S. boulardii in stored
beer. In other words, how long the yeast persists and “survives” in beer. Low temperatures of
storage would be needed to allow the preservation and conservation of original sensory
characteristics of the beer. Actually, there are already commercialized beers that do not go
through pasteurization processes of conservation, for example.
Additionally, another relevant study would be to monitor ES and HA during further beer
maturation. The sensory analysis made in this thesis was conducted after 30 days of laggering in
the cold room (2ºC). Considering the low values of ES comparing with HA previously obtained for
the fermented products, some conversion of HA into ES can be expected during longer maturation
of “young beer” (0º - 2ºC), a modification that would have a positive impact in the aroma of the
final beer.
Finally, it would be also interesting to investigate if this strain could be applied in alcoholic beers
as well. From this experiment it was concluded that the growth of S. boulardii is influenced and
inhibited by high ethanol concentrations. However, further studies regarding the genomic field
could be carried out to understand which genes are responsible for the tolerance towards ethanol.
Having this into account, the yeast could be genetically modified and improved in order to tolerate
higher concentrations of ethanol in the medium. This would be a major outcome to compete with
diverse and different beer markets that already exist.
54
7. REFERENCES
1. Yeo, H.Q. and S.Q. Liu, An overview of selected specialty beers: developments, challenges and prospects. International Journal of Food Science & Technology, 2014. 49(7): p. 1607-1618.
2. Plessas, S., et al., Potential effects of probiotics in cheese and yogurt production: A review. Engineering in Life Sciences, 2012. 12(4): p. 433-440.
3. McFarland, L.V. and P. Bernasconi, Saccharomyces boulardii'. A Review of an Innovative Biotherapeutic Agent. Microbial ecology in health and disease, 1993. 6(4): p. 157-171.
4. Edwards-Ingram, L., et al., Genotypic and physiological characterization of Saccharomyces boulardii, the probiotic strain of Saccharomyces cerevisiae. Applied and environmental microbiology, 2007. 73(8): p. 2458-2467.
5. Lilly, D.M. and R.H. Stillwell, Probiotics: growth-promoting factors produced by microorganisms. Science, 1965. 147(3659): p. 747-748.
6. Vandenplas, Y., G. Huys, and G. Daube, Probiotics: an update. Jornal de Pediatria (Versão em Português), 2015. 91(1): p. 6-21.
7. Sanders, M.E., Probiotics: considerations for human health. Nutrition Reviews, 2003. 61(3): p. 91-99.
8. Holzapfel, W.H., et al., Taxonomy and important features of probiotic microorganisms in food and nutrition. The American journal of clinical nutrition, 2001. 73(2): p. 365s-373s.
9. Stamatova, I. and J.H. Meurman, Probiotics: health benefits in the mouth. Am J Dent, 2009. 22(6): p. 329-38.
10. Meurman, J.H., Probiotics: do they have a role in oral medicine and dentistry? European journal of oral sciences, 2005. 113(3): p. 188-196.
11. Hoesl, C. and J. Altwein, The probiotic approach: an alternative treatment option in urology. European urology, 2005. 47(3): p. 288-296.
12. Barrons, R. and D. Tassone, Use of Lactobacillus probiotics for bacterial genitourinary infections in women: a review. Clinical therapeutics, 2008. 30(3): p. 453-468.
13. Falagas, M.E., et al., Probiotics for prevention of recurrent urinary tract infections in women. Drugs, 2006. 66(9): p. 1253-1261.
14. Reid, G. and A. Bocking, The potential for probiotics to prevent bacterial vaginosis and preterm labor. American journal of obstetrics and gynecology, 2003. 189(4): p. 1202-1208.
15. Hacini-Rachinel, F., et al., Oral probiotic control skin inflammation by acting on both effector and regulatory T cells. PLoS One, 2009. 4(3): p. e4903.
16. Caramia, G., A. Atzei, and V. Fanos, Probiotics and the skin. Clinics in dermatology, 2008. 26(1): p. 4-11.
17. Hojsak, I., et al., Lactobacillus GG in the prevention of nosocomial gastrointestinal and respiratory tract infections. Pediatrics, 2010. 125(5): p. e1171-e1177.
18. Cook, M.T., et al., Microencapsulation of probiotics for gastrointestinal delivery. Journal of Controlled Release, 2012. 162(1): p. 56-67.
19. Kumar, M., et al., Cholesterol-lowering probiotics as potential biotherapeutics for metabolic diseases. Experimental diabetes research, 2012. 2012.
20. Van den Abbeele, P., et al., In vitro model to study the modulation of the mucin-adhered bacterial community. Applied microbiology and biotechnology, 2009. 83(2): p. 349-359.
21. Pereg, D., et al., The effect of fermented yogurt on the prevention of diarrhea in a healthy adult population. American journal of infection control, 2005. 33(2): p. 122-125.
22. Magalhães, K.T., et al., Production of fermented cheese whey-based beverage using kefir grains as starter culture: Evaluation of morphological and microbial variations. Bioresource Technology, 2010. 101(22): p. 8843-8850.
55
23. Huseini, H.F., et al., Evaluation of wound healing activities of kefir products. Burns, 2012. 38(5): p. 719-723.
24. Possemiers, S., et al., Bacteria and chocolate: a successful combination for probiotic delivery. International journal of food microbiology, 2010. 141(1): p. 97-103.
25. Nagao, F., et al., Effects of a fermented milk drink containing Lactobacillus casei strain Shirota on the immune system in healthy human subjects. Bioscience, biotechnology, and biochemistry, 2000. 64(12): p. 2706-2708.
26. Hatakka, K., et al., Effect of long term consumption of probiotic milk on infections in children attending day care centres: double blind, randomised trial. Bmj, 2001. 322(7298): p. 1327.
27. Makino, S., et al., Reducing the risk of infection in the elderly by dietary intake of yoghurt fermented with Lactobacillus delbrueckii ssp. bulgaricus OLL1073R-1. British journal of nutrition, 2010. 104(07): p. 998-1006.
28. Näse, L., et al., Effect of long–term consumption of a probiotic bacterium, Lactobacillus rhamnosus GG, in milk on dental caries and caries risk in children. Caries research, 2001. 35(6): p. 412-420.
29. Weber, T.K. and I. Polanco, Gastrointestinal microbiota and some children diseases: a review. Gastroenterology research and practice, 2012. 2012.
30. Santos, F., et al., The complete coenzyme B12 biosynthesis gene cluster of Lactobacillus reuteri CRL1098. Microbiology, 2008. 154(1): p. 81-93.
31. Fabian, E., et al., Influence of probiotic and conventional yoghurt on the status of vitamins B1, B2 and B6 in young healthy women. Annals of Nutrition and Metabolism, 2008. 52(1): p. 29-36.
32. de Vrese, M., et al., Probiotics—compensation for lactase insufficiency. The American journal of clinical nutrition, 2001. 73(2): p. 421s-429s.
33. Gorissen, L., et al., Production of conjugated linoleic acid and conjugated linolenic acid isomers by Bifidobacterium species. Applied microbiology and biotechnology, 2010. 87(6): p. 2257-2266.
34. Ando, A., et al., CLA production from ricinoleic acid by lactic acid bacteria. Journal of the American Oil Chemists' Society, 2003. 80(9): p. 889-894.
35. Decroos, K., et al., Isolation and characterisation of an equol-producing mixed microbial culture from a human faecal sample and its activity under gastrointestinal conditions. Archives of microbiology, 2005. 183(1): p. 45-55.
36. Borthakur, A., et al., The probiotic Lactobacillus acidophilus stimulates chloride/hydroxyl exchange activity in human intestinal epithelial cells. The Journal of nutrition, 2008. 138(7): p. 1355-1359.
37. De Boever, P., et al., Protective effect of the bile salt hydrolase-active Lactobacillus reuteri against bile salt cytotoxicity. Applied microbiology and biotechnology, 2000. 53(6): p. 709-714.
38. De Smet, I., P. De Boever, and W. Verstraete, Cholesterol lowering in pigs through enhanced bacterial bile salt hydrolase activity. British Journal of Nutrition, 1998. 79(02): p. 185-194.
39. Kabeerdoss, J., et al., Effect of yoghurt containing Bifidobacterium lactis Bb12® on faecal excretion of secretory immunoglobulin A and human beta-defensin 2 in healthy adult volunteers. Nutrition journal, 2011. 10(1): p. 1.
40. Ghadimi, D., et al., Effects of probiotic bacteria and their genomic DNA on T H 1/T H 2-cytokine production by peripheral blood mononuclear cells (PBMCs) of healthy and allergic subjects. Immunobiology, 2008. 213(8): p. 677-692.
41. Gratz, S., et al., Intestinal mucus alters the ability of probiotic bacteria to bind aflatoxin B1 in vitro. Applied and environmental microbiology, 2004. 70(10): p. 6306-6308.
42. Šenkárčinová, B., Application of yeast Saccharomyces boulardii in the production of low alcohol beers. UCT Prague, 2015.
56
43. Zanello, G., et al., Saccharomyces boulardii effects on gastrointestinal diseases. Current issues in molecular biology, 2009. 11(1): p. 47.
44. van der Aa Kühle, A. and L. Jespersen, The taxonomic position of Saccharomyces boulardii as evaluated by sequence analysis of the D1/D2 domain of 26S rDNA, the ITS1-5.8 S rDNA-ITS2 region and the mitochondrial cytochrome-c oxidase II gene. Systematic and Applied Microbiology, 2003. 26(4): p. 564-571.
45. Du, L.P., et al. Research on the Characteristics and Culture Conditions of Saccharomyces boulardii. in Advanced Materials Research. 2012. Trans Tech Publ.
46. Czerucka, D., et al., Saccharomyces boulardii preserves the barrier function and modulates the signal transduction pathway induced in enteropathogenic Escherichia coli-infected T84 cells. Infection and immunity, 2000. 68(10): p. 5998-6004.
47. Surawicz, C.M., et al., Treatment of recurrent Clostridium difficile colitis with vancomycin and Saccharomyces boulardii. Am J Gastroenterol, 1989. 84(10): p. 1285-1287.
48. Buts, J.-P., Twenty-five years of research on Saccharomyces boulardii trophic effects: updates and perspectives. Digestive diseases and sciences, 2009. 54(1): p. 15-18.
49. Biesbrock, A., M. Reddy, and M. Levine, Interaction of a salivary mucin-secretory immunoglobulin A complex with mucosal pathogens. Infection and immunity, 1991. 59(10): p. 3492-3497.
50. Choi, Y.J., et al., TRIF mediates Toll-like receptor 5-induced signaling in intestinal epithelial cells. Journal of Biological Chemistry, 2010. 285(48): p. 37570-37578.
51. Brányik, T., et al., A review of methods of low alcohol and alcohol-free beer production. Journal of Food Engineering, 2012. 108(4): p. 493-506.
52. De Keukeleire, D., Fundamentals of beer and hop chemistry. Quimica nova, 2000. 23(1): p. 108-112.
53. Agu, R. and G. Palmer, A reassessment of sorghum for lager-beer brewing. Bioresource Technology, 1998. 66(3): p. 253-261.
54. Lea, A.G. and J. Piggott, Fermented beverage production. 2012: Springer Science & Business Media.
55. Caul, J.F., The profile method of flavor analysis. Advances in food research, 1957. 7: p. 1-40.
56. Clapperton, J., Derivation of a profile method for sensory analysis of beer flavour. Journal of the Institute of Brewing, 1973. 79(6): p. 495-508.
57. Jackson, J.F. and H.F. Linskens, Analysis of taste and aroma. Vol. 21. 2002: Springer Science & Business Media.
58. Pires, E.J., et al., Yeast: the soul of beer’s aroma—a review of flavour-active esters and higher alcohols produced by the brewing yeast. Applied microbiology and biotechnology, 2014. 98(5): p. 1937-1949.
59. Sentheshanmuganathan, S. and S. Elsden, The mechanism of the formation of tyrosol by Saccharomyces cerevisiae. Biochemical Journal, 1958. 69(2): p. 210.
60. Chen, E.C.-H., The relative contribution of Ehrlich and biosynthetic pathways to the formation of fusel alcohols [Yeast fermentations]. Journal of the American Society of Brewing Chemists (USA), 1978.
61. Saison, D., et al., Contribution of staling compounds to the aged flavour of lager beer by studying their flavour thresholds. Food Chemistry, 2009. 114(4): p. 1206-1215.
62. Molina, A.M., et al., Influence of wine fermentation temperature on the synthesis of yeast-derived volatile aroma compounds. Applied Microbiology and Biotechnology, 2007. 77(3): p. 675-687.
63. Verstrepen, K.J., et al., Expression levels of the yeast alcohol acetyltransferase genes ATF1, Lg-ATF1, and ATF2 control the formation of a broad range of volatile esters. Applied and environmental microbiology, 2003. 69(9): p. 5228-5237.

57
64. Saerens, S., et al., Parameters affecting ethyl ester production by Saccharomyces cerevisiae during fermentation. Applied and environmental microbiology, 2008. 74(2): p. 454-461.
65. Puerari, C., et al., Optimization of alcohol‐free beer production by lager and cachaça yeast strains using response surface methodology. Journal of the Institute of Brewing, 2016. 122(1): p. 69-75.
66. PIGGOIT, J. and A. Paterson, Understanding natural flavors. 1994. 67. Lehnert, R., et al., Optimisation of lab-scale continuous alcohol-free beer production.
2009. 68. Steensels, J., et al., Improving industrial yeast strains: exploiting natural and artificial
diversity. FEMS microbiology reviews, 2014. 38(5): p. 947-995. 69. Deak, T., Handbook of food spoilage yeasts. 2007: CRC press. 70. Lourens-Hattingh, A. and B. Viljoen, Growth and survival of a probiotic yeast in dairy
products. Food Research International, 2001. 34(9): p. 791-796. 71. Palmer, J.J., How to brew. EUA: Brewers Publications, 2006. 72. Didion, T., et al., Amino acids induce expression of BAP2, a branched-chain amino acid
permease gene in Saccharomyces cerevisiae. Journal of bacteriology, 1996. 178(7): p. 2025-2029.
73. Kodama, Y., et al., Control of higher alcohol production by manipulation of the BAP2 gene in brewing yeast. Journal of the American Society of Brewing Chemists, 2001. 59(4): p. 157-162.
74. Saerens, S., et al., Monitoring the influence of high-gravity brewing and fermentation temperature on flavour formation by analysis of gene expression levels in brewing yeast. Applied microbiology and biotechnology, 2008. 80(6): p. 1039-1051.
75. Landaud, S., E. Latrille, and G. Corrieu, Top pressure and temperature control the fusel alcohol/ester ratio through yeast growth in beer fermentation. Journal of the Institute of Brewing, 2001. 107(2): p. 107-117.
76. Piddocke, M.P., et al., Physiological characterization of brewer’s yeast in high-gravity beer fermentations with glucose or maltose syrups as adjuncts. Applied microbiology and biotechnology, 2009. 84(3): p. 453-464.
77. Younis, O.S. and G.G. Stewart, Effect of malt wort, very-high-gravity malt wort, and very-high-gravity adjunct wort on volatile production in Saccharomyces cerevisiae. Journal of the American Society of Brewing Chemists, 1999. 57(2): p. 39-45.
78. Younis, O.S. and G.G. Stewart, Sugar uptake and subsequent ester and higher alcohol production by Saccharomyces cerevisiae. Journal of the Institute of Brewing, 1998. 104(5): p. 255-264.
79. Verstrepen, K.J., et al., The Saccharomyces cerevisiae alcohol acetyl transferase gene ATF1 is a target of the cAMP/PKA and FGM nutrient-signalling pathways. FEMS yeast research, 2003. 4(3): p. 285-296.
80. Verbelen, P., et al., Impact of pitching rate on yeast fermentation performance and beer flavour. Applied microbiology and biotechnology, 2009. 82(1): p. 155-167.
81. Brányik, T., et al., Continuous beer fermentation using immobilized yeast cell bioreactor systems. Biotechnology progress, 2005. 21(3): p. 653-663.
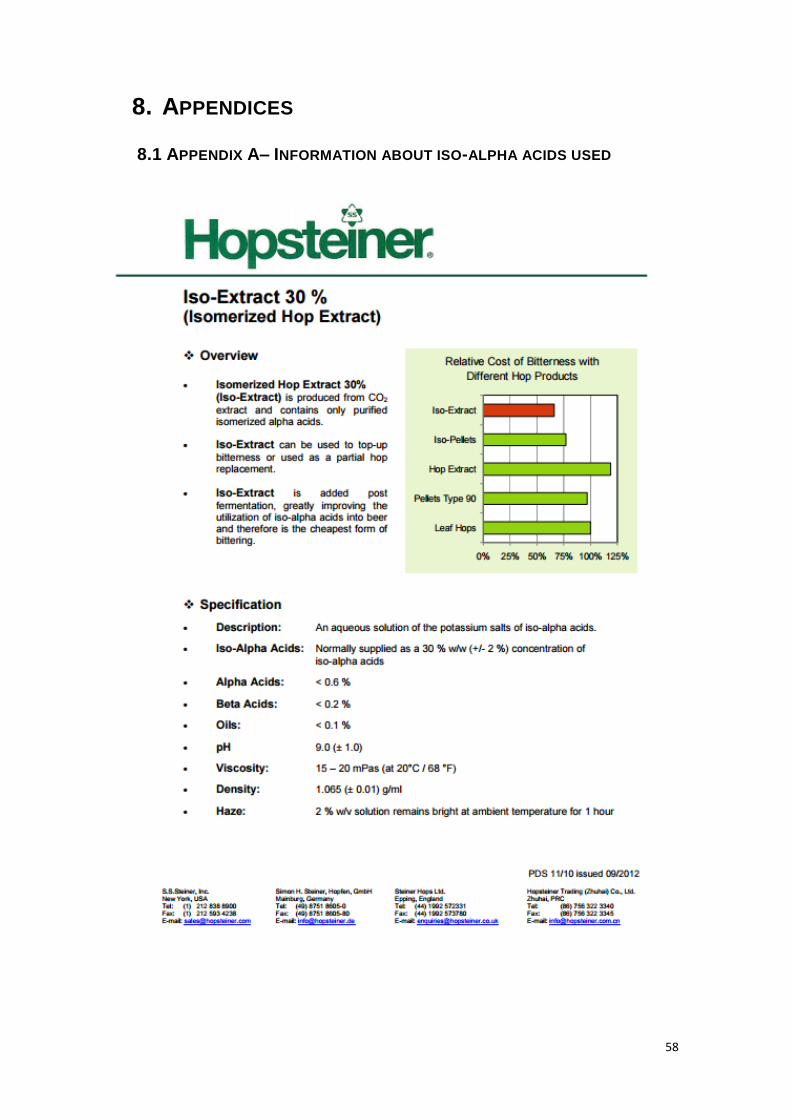
58
8. APPENDICES
8.1 APPENDIX A– INFORMATION ABOUT ISO-ALPHA ACIDS USED
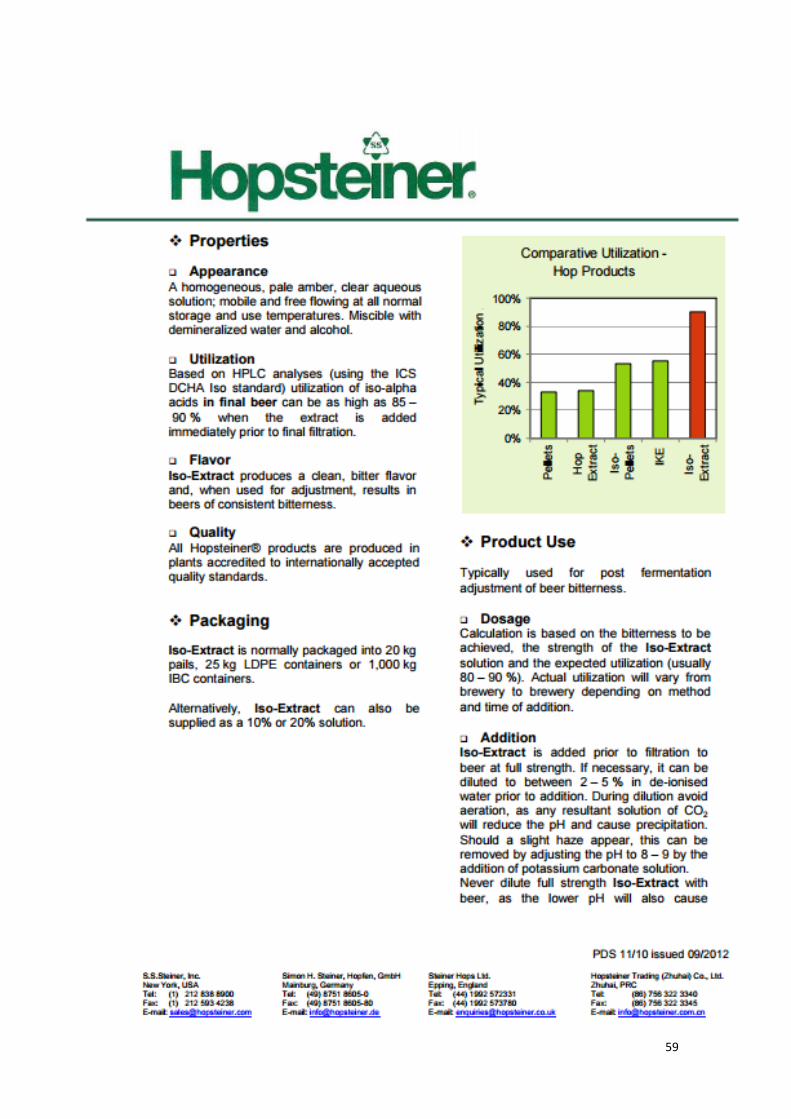
59
60
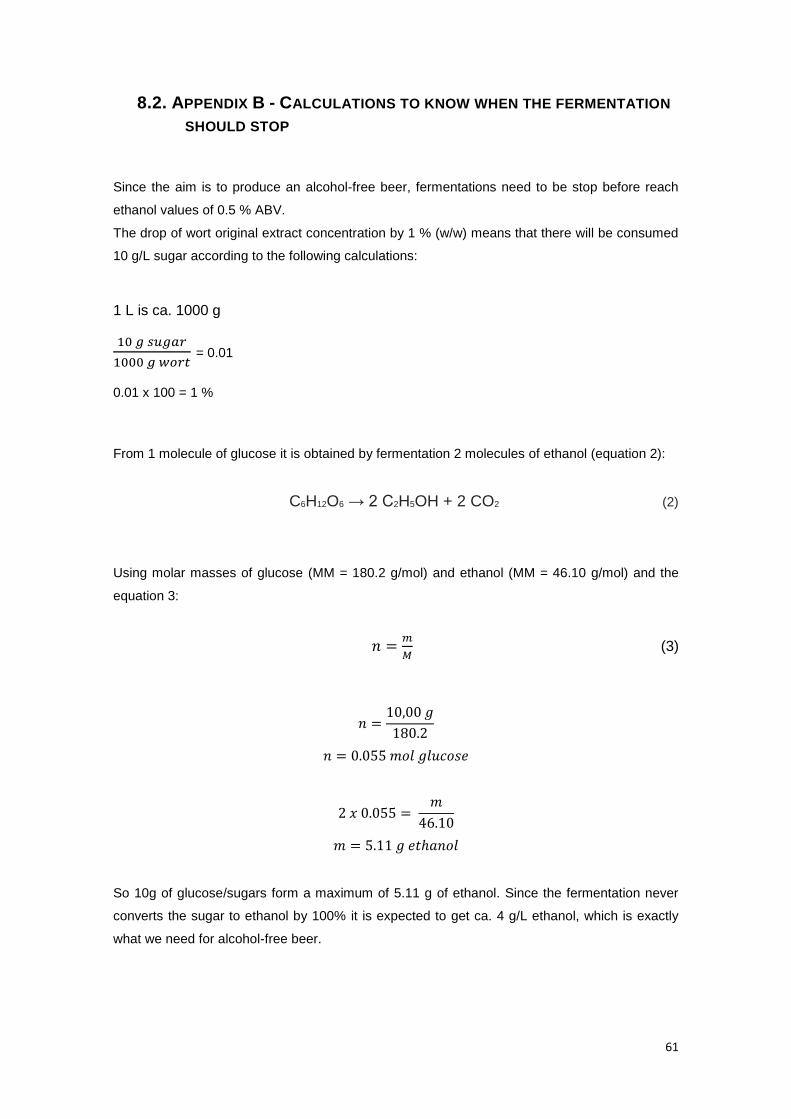
61
8.2. APPENDIX B - CALCULATIONS TO KNOW WHEN THE FERMENTATION
SHOULD STOP
Since the aim is to produce an alcohol-free beer, fermentations need to be stop before reach
ethanol values of 0.5 % ABV.
The drop of wort original extract concentration by 1 % (w/w) means that there will be consumed
10 g/L sugar according to the following calculations:
1 L is ca. 1000 g 10 𝑔 𝑠𝑢𝑔𝑎𝑟
1000 𝑔 𝑤𝑜𝑟𝑡 = 0.01
0.01 x 100 = 1 % From 1 molecule of glucose it is obtained by fermentation 2 molecules of ethanol (equation 2):
C6H12O6 → 2 C2H5OH + 2 CO2 (2)
Using molar masses of glucose (MM = 180.2 g/mol) and ethanol (MM = 46.10 g/mol) and the
equation 3:
𝑛 =𝑚
𝑀 (3)
𝑛 =10,00 𝑔
180.2
𝑛 = 0.055 𝑚𝑜𝑙 𝑔𝑙𝑢𝑐𝑜𝑠𝑒
2 𝑥 0.055 = 𝑚
46.10
𝑚 = 5.11 𝑔 𝑒𝑡ℎ𝑎𝑛𝑜𝑙
So 10g of glucose/sugars form a maximum of 5.11 g of ethanol. Since the fermentation never
converts the sugar to ethanol by 100% it is expected to get ca. 4 g/L ethanol, which is exactly
what we need for alcohol-free beer.
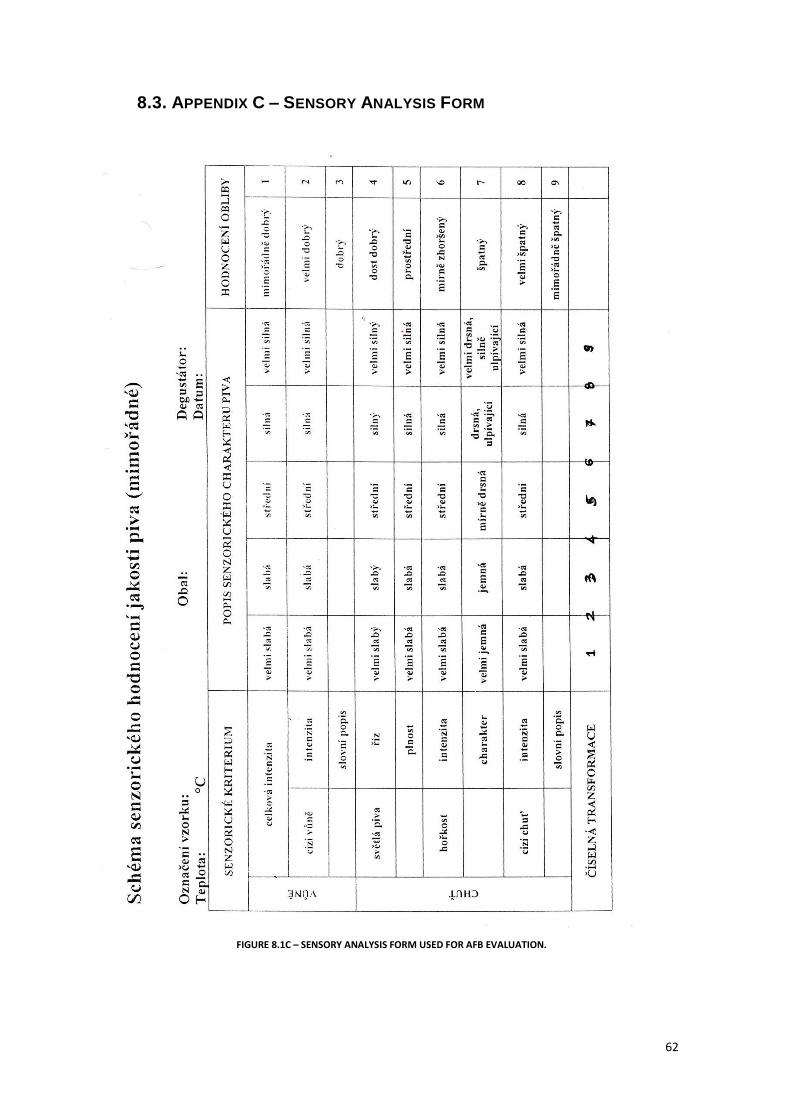
62
8.3. APPENDIX C – SENSORY ANALYSIS FORM
FIGURE 8.1C – SENSORY ANALYSIS FORM USED FOR AFB EVALUATION.
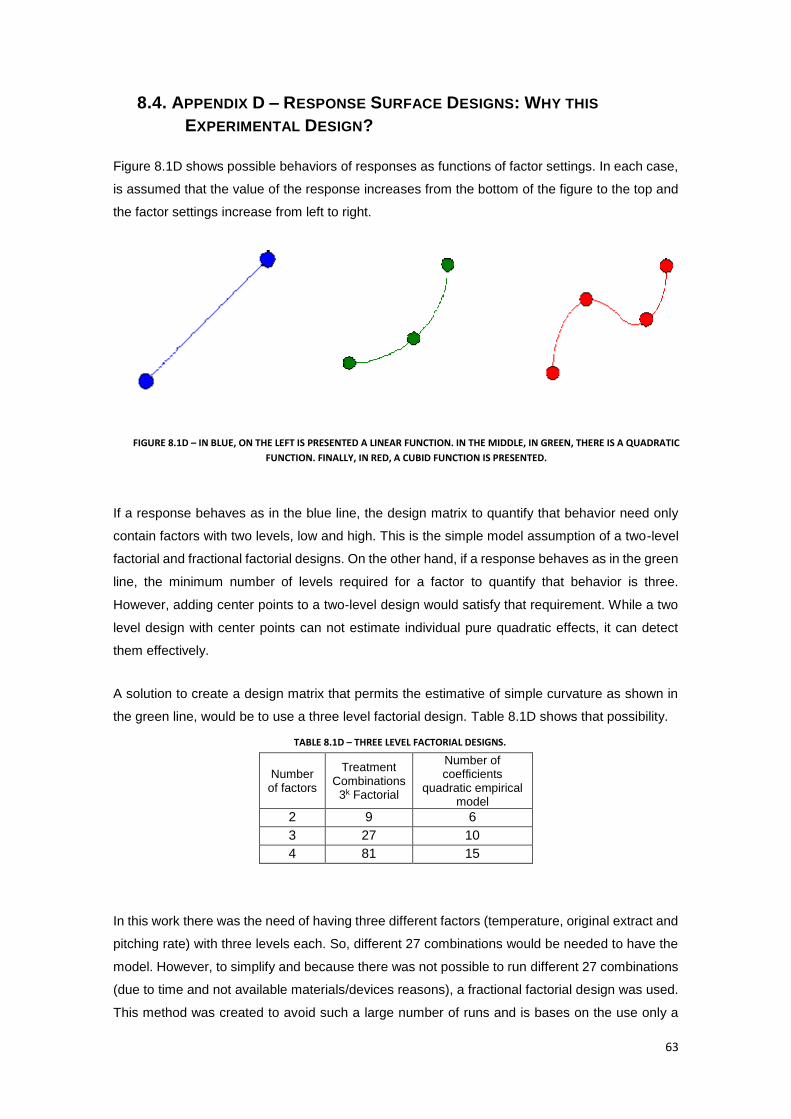
63
8.4. APPENDIX D – RESPONSE SURFACE DESIGNS: WHY THIS
EXPERIMENTAL DESIGN?
Figure 8.1D shows possible behaviors of responses as functions of factor settings. In each case,
is assumed that the value of the response increases from the bottom of the figure to the top and
the factor settings increase from left to right.
If a response behaves as in the blue line, the design matrix to quantify that behavior need only
contain factors with two levels, low and high. This is the simple model assumption of a two-level
factorial and fractional factorial designs. On the other hand, if a response behaves as in the green
line, the minimum number of levels required for a factor to quantify that behavior is three.
However, adding center points to a two-level design would satisfy that requirement. While a two
level design with center points can not estimate individual pure quadratic effects, it can detect
them effectively.
A solution to create a design matrix that permits the estimative of simple curvature as shown in
the green line, would be to use a three level factorial design. Table 8.1D shows that possibility.
In this work there was the need of having three different factors (temperature, original extract and
pitching rate) with three levels each. So, different 27 combinations would be needed to have the
model. However, to simplify and because there was not possible to run different 27 combinations
(due to time and not available materials/devices reasons), a fractional factorial design was used.
This method was created to avoid such a large number of runs and is bases on the use only a
Number of factors
Treatment Combinations
3k Factorial
Number of coefficients
quadratic empirical model
2 9 6
3 27 10
4 81 15
FIGURE 8.1D – IN BLUE, ON THE LEFT IS PRESENTED A LINEAR FUNCTION. IN THE MIDDLE, IN GREEN, THERE IS A QUADRATIC
FUNCTION. FINALLY, IN RED, A CUBID FUNCTION IS PRESENTED.
TABLE 8.1D – THREE LEVEL FACTORIAL DESIGNS.

64
fraction of the runs specified by the full factorial design. Which runs to make and which to leave
out of the experiment is a decision made by the person performing the tests. In general, a fraction
of ½ or ¼ of the runs is chosen. In this case a ca. ½ fraction was chosen ( 𝟐𝟕
𝟐= 𝟏𝟑, 𝟓 ).

65
8.5. APPENDIX E – RESULTS FROM ES AND HA FORMATION AND
SUGARS CONSUMPTION (RSM AND HPLC)
TABLE 8.1D - CENTRAL COMPOSITE DESIGN MATRIX AND RESPONSE VALUES OF TOTAL ESTERS (ES) AND HIGHER ALCOHOLS
(HA) FORMATION BY SACCHAROMYCES BOULARDII, AS A RESULT OF VARIATION IN PROCESS VARIABLES (FACTORS): WORT
ORIGINAL EXTRACT (E), TEMPERATURE (T) AND PITCHING RATE (P).
Column Factors Response
E T P ES HA
1 0 0 +1 0.309791 7.436387
2 -1 -1 -1 0.069345 2.371234
3 0 0 -1 0.114641 4.372989
4 -1 0 0 0.282189 3.373628
5 +1 0 0 0.304704 3.454986
6 0 -1 0 0.071978 1.620262
7 -1 +1 +1 0.592168 15.74264
8 +1 -1 +1 0.074642 3.086255
9 0 +1 0 0.511111 7.889504
10 +1 +1 0 0.680018 10.73679
11 0 0 0 0.316112 4.445118
12 0 0 0 0.306844 4.859724
13 0 0 0 0.302523 4.459791
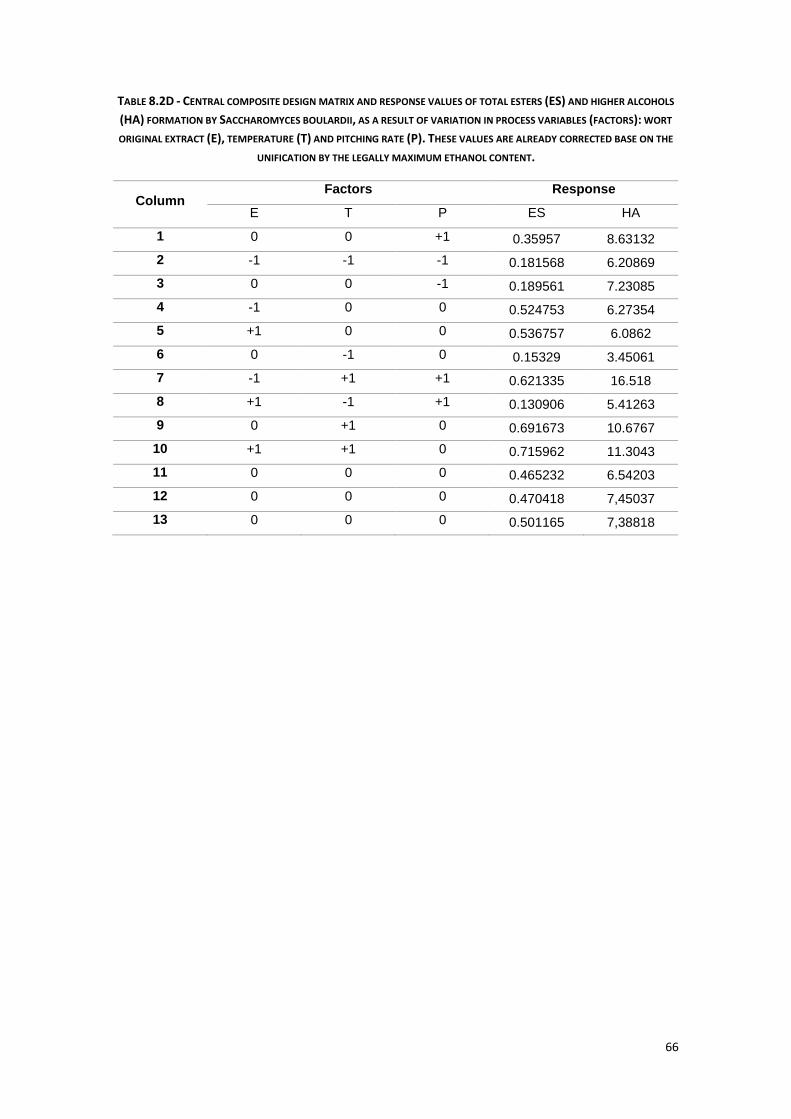
66
TABLE 8.2D - CENTRAL COMPOSITE DESIGN MATRIX AND RESPONSE VALUES OF TOTAL ESTERS (ES) AND HIGHER ALCOHOLS
(HA) FORMATION BY SACCHAROMYCES BOULARDII, AS A RESULT OF VARIATION IN PROCESS VARIABLES (FACTORS): WORT
ORIGINAL EXTRACT (E), TEMPERATURE (T) AND PITCHING RATE (P). THESE VALUES ARE ALREADY CORRECTED BASE ON THE
UNIFICATION BY THE LEGALLY MAXIMUM ETHANOL CONTENT.
Column Factors Response
E T P ES HA
1 0 0 +1 0.35957 8.63132
2 -1 -1 -1 0.181568 6.20869
3 0 0 -1 0.189561 7.23085
4 -1 0 0 0.524753 6.27354
5 +1 0 0 0.536757 6.0862
6 0 -1 0 0.15329 3.45061
7 -1 +1 +1 0.621335 16.518
8 +1 -1 +1 0.130906 5.41263
9 0 +1 0 0.691673 10.6767
10 +1 +1 0 0.715962 11.3043
11 0 0 0 0.465232 6.54203
12 0 0 0 0.470418 7,45037
13 0 0 0 0.501165 7,38818
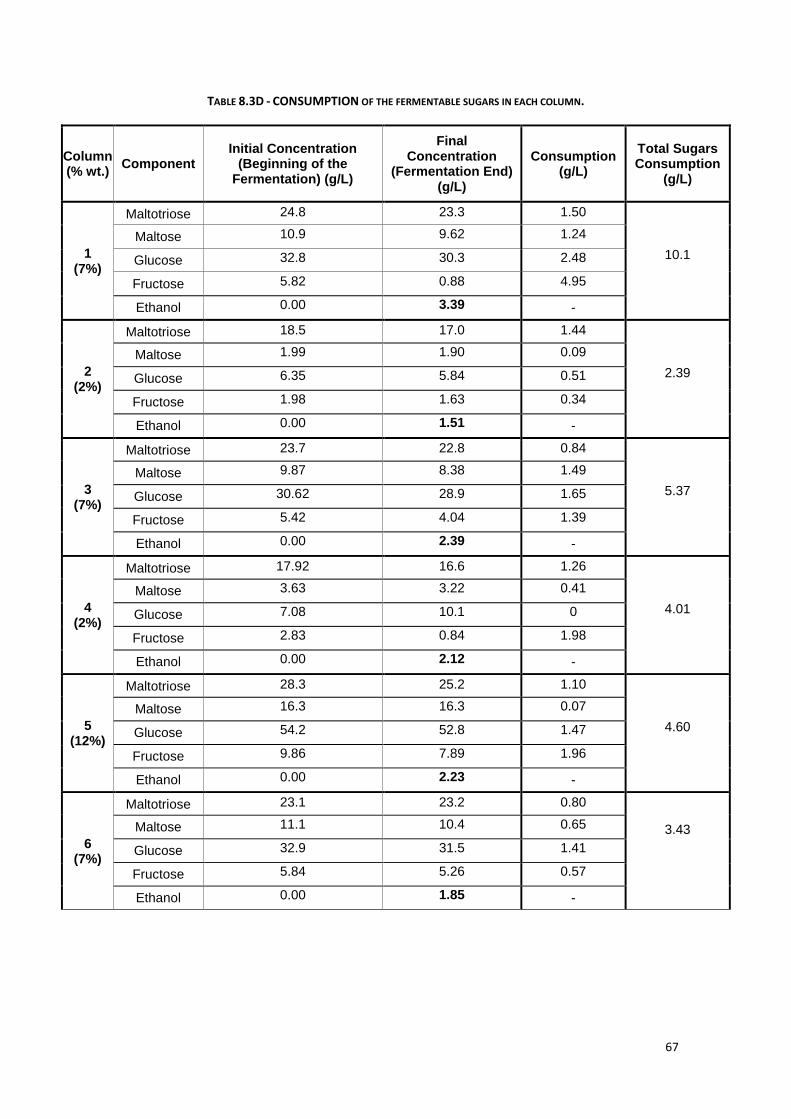
67
TABLE 8.3D - CONSUMPTION OF THE FERMENTABLE SUGARS IN EACH COLUMN.
Column (% wt.)
Component Initial Concentration
(Beginning of the Fermentation) (g/L)
Final Concentration
(Fermentation End) (g/L)
Consumption (g/L)
Total Sugars Consumption
(g/L)
1 (7%)
Maltotriose 24.8 23.3 1.50
10.1
Maltose 10.9 9.62 1.24
Glucose 32.8 30.3 2.48
Fructose 5.82 0.88 4.95
Ethanol 0.00 3.39 -
2 (2%)
Maltotriose 18.5 17.0 1.44
2.39
Maltose 1.99 1.90 0.09
Glucose 6.35 5.84 0.51
Fructose 1.98 1.63 0.34
Ethanol 0.00 1.51 -
3 (7%)
Maltotriose 23.7 22.8 0.84
5.37
Maltose 9.87 8.38 1.49
Glucose 30.62 28.9 1.65
Fructose 5.42 4.04 1.39
Ethanol 0.00 2.39 -
4 (2%)
Maltotriose 17.92 16.6 1.26
4.01
Maltose 3.63 3.22 0.41
Glucose 7.08 10.1 0
Fructose 2.83 0.84 1.98
Ethanol 0.00 2.12 -
5 (12%)
Maltotriose 28.3 25.2 1.10
4.60
Maltose 16.3 16.3 0.07
Glucose 54.2 52.8 1.47
Fructose 9.86 7.89 1.96
Ethanol 0.00 2.23 -
6 (7%)
Maltotriose 23.1 23.2 0.80
3.43
Maltose 11.1 10.4 0.65
Glucose 32.9 31.5 1.41
Fructose 5.84 5.26 0.57
Ethanol 0.00 1.85 -
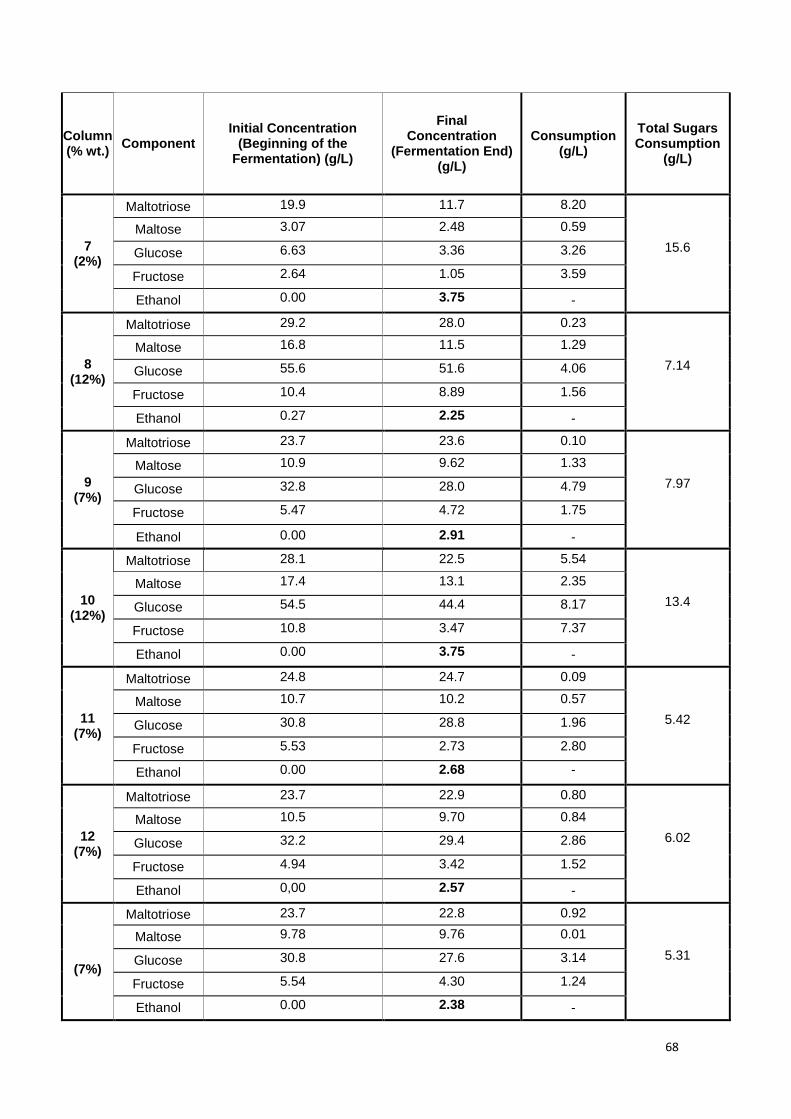
68
Column (% wt.)
Component Initial Concentration
(Beginning of the Fermentation) (g/L)
Final Concentration
(Fermentation End) (g/L)
Consumption (g/L)
Total Sugars Consumption
(g/L)
7 (2%)
Maltotriose 19.9 11.7 8.20
15.6
Maltose 3.07 2.48 0.59
Glucose 6.63 3.36 3.26
Fructose 2.64 1.05 3.59
Ethanol 0.00 3.75 -
8 (12%)
Maltotriose 29.2 28.0 0.23
7.14
Maltose 16.8 11.5 1.29
Glucose 55.6 51.6 4.06
Fructose 10.4 8.89 1.56
Ethanol 0.27 2.25 -
9 (7%)
Maltotriose 23.7 23.6 0.10
7.97
Maltose 10.9 9.62 1.33
Glucose 32.8 28.0 4.79
Fructose 5.47 4.72 1.75
Ethanol 0.00 2.91 -
10 (12%)
Maltotriose 28.1 22.5 5.54
13.4
Maltose 17.4 13.1 2.35
Glucose 54.5 44.4 8.17
Fructose 10.8 3.47 7.37
Ethanol 0.00 3.75 -
11 (7%)
Maltotriose 24.8 24.7 0.09
5.42
Maltose 10.7 10.2 0.57
Glucose 30.8 28.8 1.96
Fructose 5.53 2.73 2.80
Ethanol 0.00 2.68 -
12 (7%)
Maltotriose 23.7 22.9 0.80
6.02
Maltose 10.5 9.70 0.84
Glucose 32.2 29.4 2.86
Fructose 4.94 3.42 1.52
Ethanol 0,00 2.57 -
(7%)
Maltotriose 23.7 22.8 0.92
5.31
Maltose 9.78 9.76 0.01
Glucose 30.8 27.6 3.14
Fructose 5.54 4.30 1.24
Ethanol 0.00 2.38 -

69