use of melt flow rate test in reliability study of thermoplastic
TRANSCRIPT

NREL is a national laboratory of the U.S. Department of Energy, Office of Energy Efficiency & Renewable Energy, operated by the Alliance for Sustainable Energy, LLC.
Contract No. DE-AC36-08GO28308
Use of Melt Flow Rate Test in Reliability Study of Thermoplastic Encapsulation Materials in Photovoltaic Modules John M. Moseley Colorado School of Mines; National Renewable Energy Laboratory
David C. Miller, Michael D. Kempe, and Sarah R. Kurtz National Renewable Energy Laboratory
Qurat-Ul-Ain Syed Jawed Shah and Govindasamy Tamizhmani Arizona State University
Keiichiro Sakurai Colorado School of Mines; National Institute of Advanced Industrial Science and Technology
Technical Report NREL/TP-5200-52586 Revised December 2011

NREL is a national laboratory of the U.S. Department of Energy, Office of Energy Efficiency & Renewable Energy, operated by the Alliance for Sustainable Energy, LLC.
National Renewable Energy Laboratory 1617 Cole Boulevard Golden, Colorado 80401 303-275-3000 • www.nrel.gov
Contract No. DE-AC36-08GO28308
Use of Melt Flow Rate Test in Reliability Study of Thermoplastic Encapsulation Materials in Photovoltaic Modules John M. Moseley Colorado School of Mines; National Renewable Energy Laboratory
David C. Miller, Michael D. Kempe, and Sarah R. Kurtz National Renewable Energy Laboratory
Qurat-Ul-Ain Syed Jawed Shah and Govindasamy Tamizhmani Arizona State University
Keiichiro Sakurai Colorado School of Mines; National Institute of Advanced Industrial Science and Technology Prepared under Task No. SS10.2520
Technical Report NREL/TP-5200-52586 Revised December 2011

NOTICE
This report was prepared as an account of work sponsored by an agency of the United States government. Neither the United States government nor any agency thereof, nor any of their employees, makes any warranty, express or implied, or assumes any legal liability or responsibility for the accuracy, completeness, or usefulness of any information, apparatus, product, or process disclosed, or represents that its use would not infringe privately owned rights. Reference herein to any specific commercial product, process, or service by trade name, trademark, manufacturer, or otherwise does not necessarily constitute or imply its endorsement, recommendation, or favoring by the United States government or any agency thereof. The views and opinions of authors expressed herein do not necessarily state or reflect those of the United States government or any agency thereof.
Available electronically at http://www.osti.gov/bridge
Available for a processing fee to U.S. Department of Energy and its contractors, in paper, from:
U.S. Department of Energy Office of Scientific and Technical Information
P.O. Box 62 Oak Ridge, TN 37831-0062 phone: 865.576.8401 fax: 865.576.5728 email: mailto:[email protected]
Available for sale to the public, in paper, from:
U.S. Department of Commerce National Technical Information Service 5285 Port Royal Road Springfield, VA 22161 phone: 800.553.6847 fax: 703.605.6900 email: [email protected] online ordering: http://www.ntis.gov/help/ordermethods.aspx
Cover Photos: (left to right) PIX 16416, PIX 17423, PIX 16560, PIX 17613, PIX 17436, PIX 17721
Printed on paper containing at least 50% wastepaper, including 10% post consumer waste.

iii
Table of Contents Abstract ........................................................................................................................................................ 1 Introduction ................................................................................................................................................. 1 Materials and Methods ............................................................................................................................... 3 Results ......................................................................................................................................................... 6 Discussion and Conclusion ..................................................................................................................... 15 Acknowledgements .................................................................................................................................. 15 References ................................................................................................................................................. 16
Note: Table 1 of this report has been revised to clarify the material composition.

1
Abstract
Use of thermoplastic materials as encapsulants in photovoltaic (PV) modules presents a potential concern in terms of high temperature creep, which should be evaluated before thermoplastics are qualified for use in the field. Historically, the issue of creep has been avoided by using thermosetting polymers as encapsulants, such as crosslinked ethylene-co-vinyl acetate (EVA). Because they lack crosslinked networks, however, thermoplastics may be subject to phase transitions and visco-elastic flow at the temperatures and mechanical stresses encountered by modules in the field, creating the potential for a number of reliability and safety issues. Thermoplastic materials investigated in this study include PV-grade uncured-EVA (without curing agents and therefore not crosslinked); polyvinyl butyral (PVB); thermoplastic polyurethane (TPU); and three polyolefins (PO), which have been proposed for use as PV encapsulation. Differential scanning calorimetry measurements showed that uncured-EVA and the PO materials would be expected to undergo melt transitions at temperatures encountered in the field (where module temperature may range from −40° to 110°C), whereas the amorphous materials (PVB and TPU) experience a glass transition within the field temperature range. In module-level testing, thin-film, glass/glass “mock” modules using these thermoplastics as encapsulants were deployed in Mesa, Arizona, a worst-case location for creep. Another module with uncured-EVA encapsulant was later deployed in Golden, Colorado. Module temperatures and creep displacements of the glass superstrate relative to the glass substrate were monitored over the course of the summer. Rheological measurements were also made on the encapsulants via the melt flow rate (MFR) test. The MFR test may be used to assess creep observed in the field because MFR is inversely proportional to the zero-shear viscosity. A testing load of 9.91 kg was used to obtain MFR at temperatures comparable to the maximum temperatures expected in field-deployed modules. The activation energy for viscous flow for the thermoplastics was calculated from linear fits to MFR-temperature data based on observed Arrhenius behavior. After two months of exposure in Mesa the uncured-EVA module was the only material with measureable displacement. The measured creep displacement of 2–3 mm in Mesa was more than ten times that in Golden over a similar time period. The large amount of creep measured in Mesa suggests that uncured-EVA is not a suitable encapsulant for that location. By comparing the module level tests with material tests, the appropriate MFR screening test(s) to identify materials requiring module level tests may be developed.
Introduction
For thermoplastics to be used safely and reliably as encapsulation materials in photovoltaic (PV) modules, an analysis of their behavior at the temperatures and mechanical stresses encountered in the field is required. Traditionally, thermosetting polymers such as crosslinked ethylene-co-vinyl acetate (EVA) have been used in this application. Crosslinked networks inhibit the viscous flow of these polymers. Thermoplastics, however, may be subject to phase transitions and visco-elastic flow (i.e., creep) at the temperatures encountered in field-deployed PV modules, creating the potential for a number of reliability and safety issues. Ref. [1] identifies the following possible issues: motion/fracture of the internal active components, reduced electrical insulation/isolation, delamination at interfaces, increased moisture permeation (possibly rendering corrosion), loss of structural integrity, loss of connectivity (open circuits), exposed wires, compromised electronic grounding, electrical arcing, or falling components. Thus, it is

2
imperative that the use of thermoplastics in modules is given careful consideration to ensure safe operation.
Figure 1 is a schematic of the glass/glass module configuration with one of the glass sheets fixed in position (e.g., a rack- or roof-mounted, thin-film module with no frame or edge clips) showing the displacement that can occur if the thermoplastic encapsulation material should creep. Thermoplastics proposed for application as encapsulants include poly(ethylene-co-methacrylic acid metal salt) (ionomer), polyvinyl butyral (PVB), thermoplastic urethane (TPU), and polyolefin (PO). A theoretical analysis in Ref. [1] evaluated the use of these materials as encapsulants in modules as well as a scenario in which the traditional EVA encapsulant is used, but the curing process that converts EVA from a thermoplastic to a thermosetting polymer is omitted. Analysis was performed on modules having different packaging and mounting configurations and located in some of the world’s hottest cities (i.e., Phoenix, Arizona, and Riyadh, Saudi Arabia). The effect of the module design (such as the encapsulation thickness) and the materials (including the weight of the glass) are identified for the two common representative geometries in Ref. [1]. The configuration that produced the worst conditions for creep (i.e., the highest module temperatures and least mechanical resistance to flow) was a glass/glass package (with no frame or edge-clips) that was roof-mounted. Nearly all materials were found to undergo phase transitions (including glass and melt transitions) within the range of temperatures possible in terrestrial field-deployed modules (−40°<T<110°C [1]). For some materials and configurations, creep displacements are expected to be unacceptable over a 30-year module service life.
Figure 1. Cross-sectional schematic of the glass/glass module configuration with the glass
substrate in a fixed position. Displacement of the glass superstrate may occur over time, possibly facilitating an electrical shock hazard, especially if water is present.
The MFR has primarily been used in industry as an empirical parameter in the quality control of extruded or injection-molded thermoplastics. MFR has also been correlated to more fundamental flow characteristics such as the zero-shear viscosity, molecular weight average, and molecular weight distribution [2]–[5]. Shenoy et al. have shown that the MFR of a given thermoplastic resin is inversely proportional to its zero-shear viscosity and have suggested a method for obtaining rheograms (viscosity vs. shear rate profiles) from MFR measurements, knowing the

3
glass transition temperature [2]-[4]. The zero-shear viscosity represents the value of viscosity that is expected when the applied shear rate approaches zero. The zero-shear viscosity is important to the creep test because the shear rates encountered by field-deployed modules approximate to zero. Although more advanced rheological instruments (e.g., cone and plate rheometer) examine the fundamental characteristics directly, the advantages of the MFR test include its broad range of possible test conditions, its quickness of operation, and its prevalence in industry.
The goal of the present study is to complement the previous theoretical analysis with experimental melt flow rate (MFR) data for similar thermoplastics. Two approaches were used to evaluate the performance of these materials as encapsulants: module-level testing and a material-level testing. Module-level testing consisted of thin-film “mock” modules and crystalline Si modules with thermoplastic encapsulants deployed in Mesa, Arizona and a thin film “mock” module deployed in Golden, Colorado. Module temperatures and displacements were monitored over the course of the summer. Material-level testing involved rheological measurements on the thermoplastics using a melt flow index (MFI) or MFR instrument. The MFR test quantifies the mass of thermoplastic resin that is extruded by an extrusion plastometer over a fixed time period (specified as the mass in grams that would be extruded in 10 minutes) under prescribed temperature and mechanical load conditions. The instrument and traditional procedure for MFR determination are defined in the ISO 1133:2005 (E) [6] and ASTM 1238-10 [7] test standards. The test temperatures and weights used in the encapsulant study were non-traditional. Temperatures were lower than those listed in the ISO or ASTM standards, so as to be characteristic of field-deployed PV modules. As the temperatures were lower, greater weights than those identified in the standards were necessary to achieve measurable MFRs. We sought recommended temperature(s) and weight(s) that might be used in screening for creep at the material level. Such a test would identify those materials that would require further module-level testing to achieve qualification for use in the field. Activation energies for viscous flow based on the MFR tests were also calculated for each material, providing insight into their temperature sensitivity.
Materials and Methods
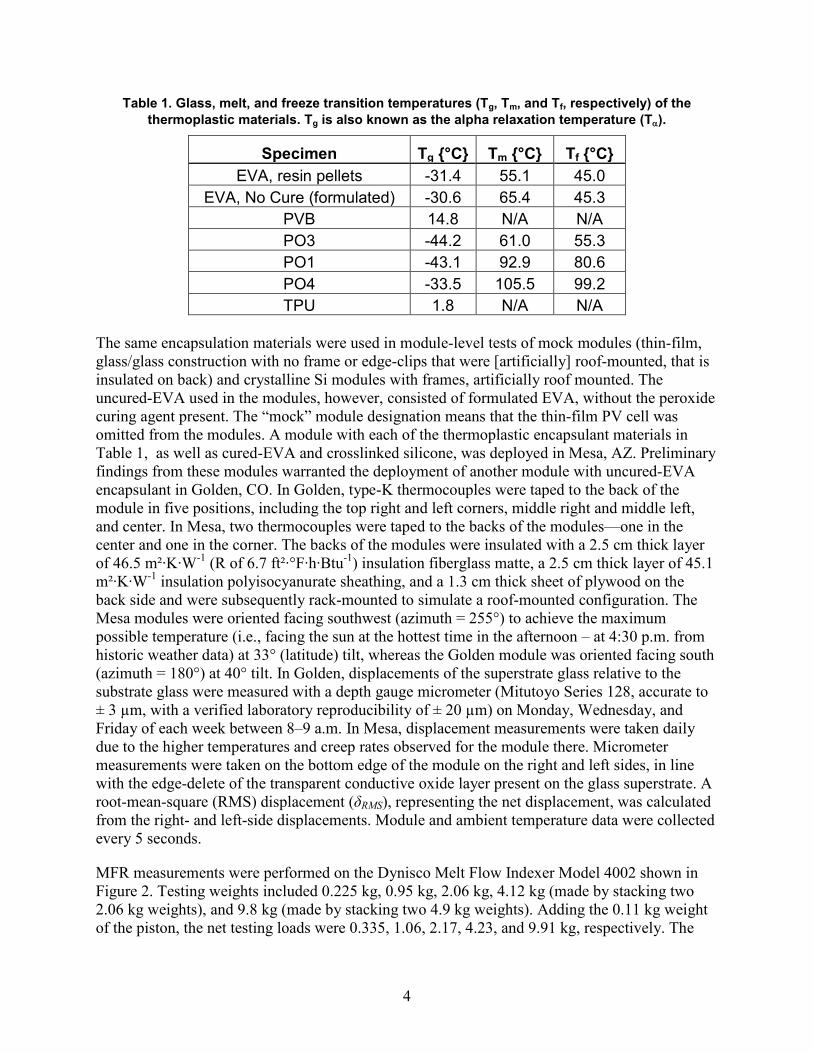
Thermoplastic materials used in this study include ethylene-co-vinyl acetate with no curing agent (uncured-EVA) (33% vinyl acetate content, using PV1400 “Elvax” resin pellets); polyvinyl butyral (PVB); thermoplastic polyurethane (TPU); and three thermoplastic polyolefins, “PO1,” “PO3,” and “PO4.” These materials are similar to the materials used in Ref. [1], but are not the same formulations. The EVA resin was in pellet form; all other materials were formulated sheet. Table 1 presents the glass, melt, and freeze transition temperatures (Tg, Tm, and Tf, respectively) of the materials determined via differential scanning calorimetry measurements (DSC, Q1000, TA Instruments, Inc.). Similar to Ref. [1], 0.5-Hz DSC data were taken from the second of two consecutive cycles (from −100°<T<200°C) at the rate of 10°C/min in an N2 environment. Regarding Table 1, uncured-EVA, PO1, PO3, and PO4 have melt transitions that are expected to be realized in field-deployed modules (−40°<T<110°C); PVB and TPU (which are amorphous and therefore do not melt) are expected to become increasingly susceptible to flow with temperature above their glass transition.
4
Table 1. Glass, melt, and freeze transition temperatures (Tg, Tm, and Tf, respectively) of the thermoplastic materials. Tg is also known as the alpha relaxation temperature (Tα).
Specimen Tg {°C} Tm {°C} Tf {°C} EVA, resin pellets -31.4 55.1 45.0
EVA, No Cure (formulated) -30.6 65.4 45.3 PVB 14.8 N/A N/A PO3 -44.2 61.0 55.3 PO1 -43.1 92.9 80.6 PO4 -33.5 105.5 99.2 TPU 1.8 N/A N/A
The same encapsulation materials were used in module-level tests of mock modules (thin-film, glass/glass construction with no frame or edge-clips that were [artificially] roof-mounted, that is insulated on back) and crystalline Si modules with frames, artificially roof mounted. The uncured-EVA used in the modules, however, consisted of formulated EVA, without the peroxide curing agent present. The “mock” module designation means that the thin-film PV cell was omitted from the modules. A module with each of the thermoplastic encapsulant materials in Table 1, as well as cured-EVA and crosslinked silicone, was deployed in Mesa, AZ. Preliminary findings from these modules warranted the deployment of another module with uncured-EVA encapsulant in Golden, CO. In Golden, type-K thermocouples were taped to the back of the module in five positions, including the top right and left corners, middle right and middle left, and center. In Mesa, two thermocouples were taped to the backs of the modules—one in the center and one in the corner. The backs of the modules were insulated with a 2.5 cm thick layer of 46.5 m²·K·W-1 (R of 6.7 ft²·°F·h·Btu-1) insulation fiberglass matte, a 2.5 cm thick layer of 45.1 m²·K·W-1 insulation polyisocyanurate sheathing, and a 1.3 cm thick sheet of plywood on the back side and were subsequently rack-mounted to simulate a roof-mounted configuration. The Mesa modules were oriented facing southwest (azimuth = 255°) to achieve the maximum possible temperature (i.e., facing the sun at the hottest time in the afternoon – at 4:30 p.m. from historic weather data) at 33° (latitude) tilt, whereas the Golden module was oriented facing south (azimuth = 180°) at 40° tilt. In Golden, displacements of the superstrate glass relative to the substrate glass were measured with a depth gauge micrometer (Mitutoyo Series 128, accurate to ± 3 µm, with a verified laboratory reproducibility of ± 20 µm) on Monday, Wednesday, and Friday of each week between 8–9 a.m. In Mesa, displacement measurements were taken daily due to the higher temperatures and creep rates observed for the module there. Micrometer measurements were taken on the bottom edge of the module on the right and left sides, in line with the edge-delete of the transparent conductive oxide layer present on the glass superstrate. A root-mean-square (RMS) displacement (δRMS), representing the net displacement, was calculated from the right- and left-side displacements. Module and ambient temperature data were collected every 5 seconds.
MFR measurements were performed on the Dynisco Melt Flow Indexer Model 4002 shown in Figure 2. Testing weights included 0.225 kg, 0.95 kg, 2.06 kg, 4.12 kg (made by stacking two 2.06 kg weights), and 9.8 kg (made by stacking two 4.9 kg weights). Adding the 0.11 kg weight of the piston, the net testing loads were 0.335, 1.06, 2.17, 4.23, and 9.91 kg, respectively. The

5
tungsten carbide die had an orifice diameter of 2.095 ± 0.005 mm. The instrument heating element allowed for temperature control to ± 0.1°C.
Figure 2. Photograph and schematic cross-section of the Dynisco 4002 MFR instrument. Automatic cutting, pneumatic lifting, and computer-controlled testing features are not included.
Photo by NREL
The “Procedure A: mass measurement method” from the ISO 1133:2005 (E) standard was used for all tests (ISO standards were given precedence over ASTM standards). A brief description of the procedure is as follows: The instrument was maintained at the test temperature for at least 15 minutes prior to charging. A measured quantity of material (ranging from 3–5 g) was charged to the barrel and packed down (typically completed in two approximately equal mass segments). Specimens of uncured-EVA were charged in pellet form; specimens of the other materials were charged in rolled-up sheets. The piston was inserted into the barrel and the test weight was added on top of the piston after a 5-minute “melt” period, commencing the extrusion. The extrudate cut-off time-interval was adjusted such that the amount of material collected was 10–20 mm in length. Cutting of extrudates was completed (manually) inside the target range (given by ISO 1133 standards) of the piston’s travel down the barrel. Extrudates were discarded if there were visible bubbles. Optimally, three or more extrudates were collected during each test and weighed on an analytical balance (A-200DS analytical balance by the Denver Instrument Co., accurate to ± 0.1 mg) for an average value. Tests were considered valid if the difference between the average and maximum and minimum values was not greater than 15% of the average value. Thorough cleaning of the piston, barrel, and die with cotton cloths and a pipe cleaner for the inside of the die prior to each test was found to be of utmost importance in achieving reproducible results. Often, it was necessary to increase the temperature of the instrument (e.g., from 125°C to 185°C) to facilitate cleaning. A heavier weight (19.46 kg) could also be added to purge the instrument. To minimize the possibility of material cross-contamination, each series of tests was carried out with a single material at various temperatures, instead of the alternative strategy of holding the temperature constant and changing the material.

6
The MFR was calculated using the conversion
where MFR is in g/10 min, T is the test temperature in degrees Celsius, w is the net testing load (including the weight the piston) in kilograms, m is the mass of the extrudate in grams, and t is the cut-off time-interval in seconds. ISO 1133 specifies that the minimum measurable MFR be 0.1 g/10 min, whereas the minimum MFR measured here was 0.072 g/10 min. MFR test durations ranged from roughly 20 s for the highest MFRs to 30 min for the lowest MFRs. Because the instrument lacked automatic cutting functionality, MFR values greater than about 25 g/10 min were difficult to measure. In addition, without automatic cutting, operator reaction times may introduce measurement error.
Common sources of error in MFR measurements include inconsistent packing pressure of the charging operation; a dirty barrel, piston, or die; variation in the height of the piston when cuts are made; delays between charging and packing; extended testing time; wear on the die or piston; and variations in the test temperature or load. Specific to this study, experimental factors contributing to experimental variability included the type and form of material (i.e., pellets [with diameters on the order of 2-4 mm] vs. sheet [cut in rectangles on the order of 5-6 cm]), as well as the magnitude of the MFR. Five MFR tests were completed with uncured-EVA at a test temperature of 125°C and a 2.17 kg test load to quantify variability of the measurements. The range of MFR values obtained was 5.19–5.37 g/10 min with a standard deviation of 0.07 g/10 min. MFR measurements with uncured-EVA were the least variable of the encapsulation materials. This is primarily attributed to the difference in form of the material charged in the MFR tests. Uncured-EVA was charged in pellet form, which was found to facilitate the packing process. The other materials were charged as rolled-up sheets, which resulted in material sticking to the sides of the barrel during packing and may have created a condition of friction between the barrel and piston. Any friction between the barrel and piston would impede sample extrusion, affecting the MFR.
Results
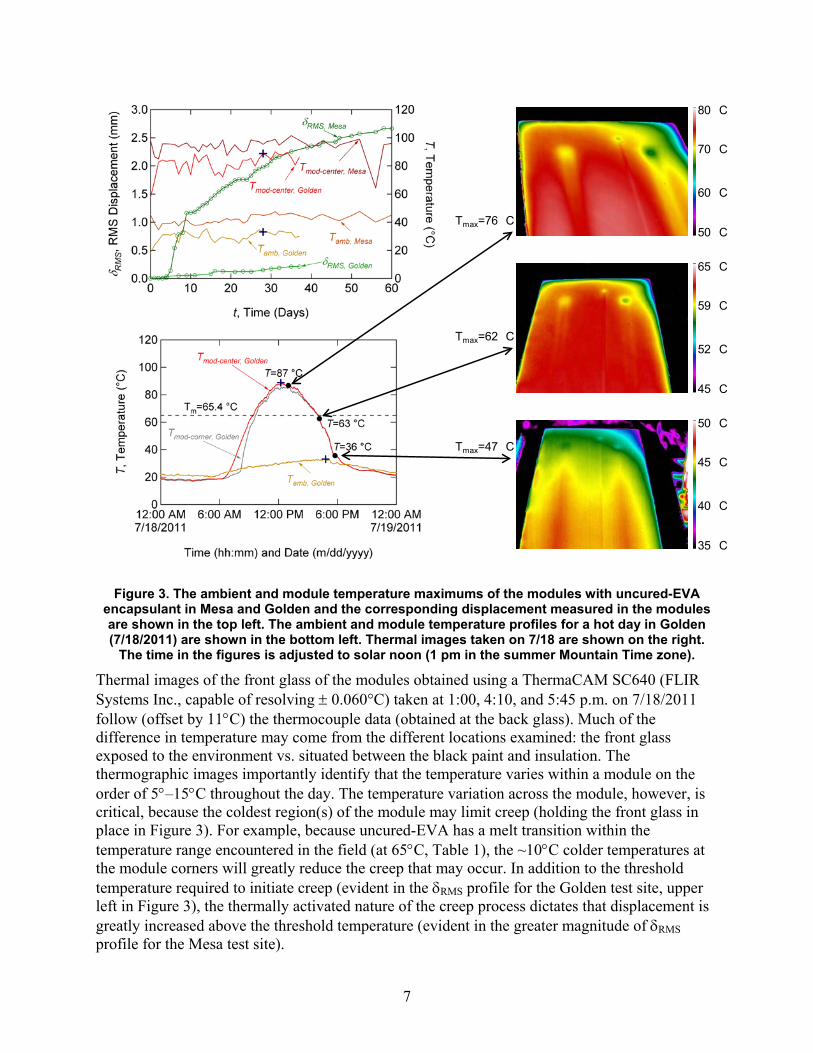
Weeks of displacement measurements on the Mesa modules identified that the module with uncured-EVA encapsulant was the only module to exhibit measurable displacement. A second module with uncured-EVA encapsulant was subsequently deployed (also artificially roof mounted) in the cooler climate of Golden. RMS displacement (δRMS) and temperature (T) from the two modules with uncured-EVA encapsulant are shown as a function of time (t) (in days, following the initial measurement) at the top in Figure 3. The two sets of temperature data in the top plot include the maximum-daily-ambient and module temperatures in each location. Module temperatures in the top plot correspond to the center located thermocouple, which showed the highest temperature. The ambient and module temperature profiles for a hot day (7/18/2011) in Golden are shown in the bottom plot in Figure 3. Blue crosses in the left of Figure 3 indicate the same ambient and module temperature maxima on 7/18/2011 in Golden. Displacements appear to occur when the coldest temperature in the module exceeds the melting point of the uncured-EVA (above the dashed line in the bottom plot).
, 600
7
Figure 3. The ambient and module temperature maximums of the modules with uncured-EVA encapsulant in Mesa and Golden and the corresponding displacement measured in the modules are shown in the top left. The ambient and module temperature profiles for a hot day in Golden (7/18/2011) are shown in the bottom left. Thermal images taken on 7/18 are shown on the right.
The time in the figures is adjusted to solar noon (1 pm in the summer Mountain Time zone).
Thermal images of the front glass of the modules obtained using a ThermaCAM SC640 (FLIR Systems Inc., capable of resolving ± 0.060°C) taken at 1:00, 4:10, and 5:45 p.m. on 7/18/2011 follow (offset by 11°C) the thermocouple data (obtained at the back glass). Much of the difference in temperature may come from the different locations examined: the front glass exposed to the environment vs. situated between the black paint and insulation. The thermographic images importantly identify that the temperature varies within a module on the order of 5°–15°C throughout the day. The temperature variation across the module, however, is critical, because the coldest region(s) of the module may limit creep (holding the front glass in place in Figure 3). For example, because uncured-EVA has a melt transition within the temperature range encountered in the field (at 65°C, Table 1), the ~10°C colder temperatures at the module corners will greatly reduce the creep that may occur. In addition to the threshold temperature required to initiate creep (evident in the δRMS profile for the Golden test site, upper left in Figure 3), the thermally activated nature of the creep process dictates that displacement is greatly increased above the threshold temperature (evident in the greater magnitude of δRMS profile for the Mesa test site).
Tmax=76 C
Tmax=62 C
Tmax=47 C
80 C
50 C
70 C
60 C
65 C
45 C
59 C
52 C
50 C
35 C
45 C
40 C

8
The maximum ambient temperatures in Mesa (Tamb, Mesa) ranged from 35° to 48°C and those in Golden (Tamb, Golden) ranged from 18° to 35°C. The maximum module temperatures in Mesa (Tmod-
center, Mesa) ranged from 64° to 102°C and those in Golden (Tmod-center, Golden) ranged from 58° to 90°C. The resulting creep displacement of the Mesa module (δRMS, Mesa) was 2.66 mm after 60 days and that of the Golden module (δRMS, Golden) was 0.21 mm after 37 days. The bottom plot in Figure 3 and the thermal images confirm that the hottest module temperatures in Golden occurred at about 1 p.m. (solar noon in the summer Mountain Time zone, when the sun is highest in the sky) whereas the hottest ambient temperatures occurred 5 hours later in the afternoon at the Golden test site.
Reproducing the uncured-EVA manufacturer’s MFR value of 43 g/10 min at a 190°C test temperature and 2.16 kg test load was performed first to benchmark the MFR instrument. MFR tests were run with the 2.17 kg load (0.01 kg greater than the ISO 1133 standard load) at 85°, 105°, 125°, 145°, 165°, and 190°C. An Arrhenius-type relationship, ln[MFR-1] vs. T-1, was plotted in Figure 4 using the MFR-T data. Because the MFR is inversely proportional to the zero-shear viscosity [2]-[4], the representation in Figure 4 is similar to a rheological plot, where the natural logarithm of viscosity is typically identified as a function of inverse temperature. The accelerating factor (pressure from the weight) in the MFR test can, however, invoke behavior (viscous flow) that varies from the zero-shear behavior significantly, e.g., underestimating the zero-shear viscosity by an order of magnitude.

9
Figure 4. Reproducing the MFR benchmark (indicated “X”) for uncured-EVA.
It is evident from Figure 4 that the uncured-EVA MFR benchmark was verified. The measured MFR value obtained at 190°C with 2.17 kg was 44 g/10 min, which compares well with the 43 g/10 min reported by the manufacturer. The data points at the lower temperatures confirm that the 44 g/10 min obtained at 190°C follows a monotonic trend; the linear fit to the data gave an R-squared value of 1.00. Thus, if the MFR value obtained at 190°C had been in error, the trend observed in the lower-temperature MFR measurements would have predicted a MFR value very near the manufacturer-reported value. The results for the EVA resin pellets (in Figure 4 and throughout this report) are assumed (but not verified) to be representative of the uncured-EVA formulation used in the module specimens, Figure 3.
Five series of MFR tests were completed with the uncured-EVA at 85°, 95°, 105°, 115°, and 125°C with each of the testing loads 0.335, 1.06, 2.07, 4.23, and 9.91 kg. A plot of the MFR-T data in Figure 5 shows exponential variation with temperature for each load, with greater loads having markedly greater MFRs at each temperature.

10
Figure 5. MFR vs. temperature profiles for uncured-EVA. Profiles show an exponential relationship
between the MFR and temperature, as well as MFR and applied load.
In Figure 6, the MFR of the uncured-EVA is plotted as a function of the test load, w, for each of the test temperatures, using the same dataset as in Figure 5. The slight curvature of the profiles (nonlinearity) consistent with a non-Newtonian behavior (such as shear thinning) occurring with the uncured-EVA during the tests. This indicates that the MFR values for uncured-EVA do not correspond to points in the zero-shear region on a viscosity-shear rate curve. Therefore, the MFR test would be expected to typically underestimate the zero-shear viscosity [4]. Figure 7 is a plot of the same MFR-T data shown in Figure 5, but now fit (using 1/T-1 vs. ln[MFR-1]) to identify the approximate Arrhenius temperature dependence. The slopes of the linear fits are proportional to the activation energy for viscous flow for uncured-EVA. The activation energy, Ea = 58 kJ/mol, was calculated from the average of the linear fits at the five test loads (range of 57–59 kJ/mol). The linear fits in Figure 7 are provided to give some sense of the phenomenological dependence. The non-linear Williams-Landel-Ferry (WLF) fit more correctly applies to polymers in the temperature range: Tg <T< (Tg +100°C) [8],[9]. That is, a non-linear visco-elastic empirical response (slightly different from an Arrhenius behavior) usually occurs for polymers above their glass transition temperature [8],[9].

11
Figure 6. MFR vs. load profiles for uncured-EVA. Profiles show a nonlinear relationship between
the MFR and load, consistent with shear-thinning behavior.

12
Figure 7. Arrhenius-type relationship between MFR and T for the uncured-EVA. The slopes of the
lines are proportional to the activation energy for viscous flow.
The MFR was characterized for all materials using the 4.23 kg test load. Data from these trials are plotted in Figure 8. The test temperature in degrees Celsius (T) is shown on the top axis. Nonlinearity is observed for PO3 and PVB at the highest temperatures in Figure 8. This nonlinearity could result from thermal crosslinking in those materials, which would account for the decreasing rate of change of MFR with increasing T (the upward-concave profile observed). While consistent with crosslinking, other degradation mechanisms (such as oxidation) have not been ruled out. A WLF behavior might contribute to the nonlinearity in Figure 8; however, the inflecting profile for PO3 likely cannot be solely attributed to WLF behavior. The data points at T = 105°C for PO1 and T = 125°C for PO3 were not included in the linear fits of those materials. Given the DSC-measured melt and freeze transition temperatures for PO1 (Tm = 92.9°C, Tf = 80.6°C) and PO3 (Tm = 105.5°C, Tf = 99.2°C), the low MFRs observed at 105°C and 125°C may come from those phase transitions.

13
Figure 8. MFR results (with the linear Arrhenius fits shown) for uncured-EVA, PVB, TPU, PO1,
PO3, and PO4 using the 4.23 kg test load.
A dataset similar to Figure 8 is shown in Figure 9 for the 9.11 kg test load. With the higher load, the MFR for the non-EVA materials could be obtained at lower temperatures, down to 105°C. Importantly, the data in Figure 9 approach the maximum temperatures expected in modules as shown in Figure 3. The MFR of PO4 at 125°C extended the linear fit with the 9.91 kg load in Figure 9, which was not realized for the 4.23 kg load in Figure 8. This suggests that by increasing the shear stress, the MFR could be determined closer to the phase-transition temperatures of that material (Table 1). Also shown in Figure 9 is the extrapolated MFR value for uncured-EVA at 125°C. This value is used to compare the MFR-1 values of all the materials at 125°C in Table 2 (MFR-1 is inversely proportional to the zero-shear viscosity). For example, it follows from Table 2 that PO1 is expected to be roughly 0.14 / 0.02 = 7x more viscous than uncured-EVA at 125°C (provided that MFR-1 is directly proportional to the viscosity). Activation energies are shown in Table 2 for the least-squares fit of the linear region shown in Figure 8 and Figure 9. The polyolefin materials (PO1, PO3, and PO4) have very similar activation energies [38–41 kJ/mol]. The order of the most thermally activated material to the least is PVB, TPU, uncured-EVA, PO3, PO4, and PO1. As in Ref. [1], the activation energy may be used to estimate creep displacement if the encapsulant viscosity and module time-temperature history is known.

14
Figure 9. MFR results (with the linear Arrhenius fits shown) for uncured-EVA, PVB, TPU, PO1,
PO3, and PO4 using the 9.91 kg test load.
Table 2. Activation energies for viscous flow, Ea, and inverse MFR (correlated to the zero-shear viscosity) of the materials at T = 125°C and with w = 9.91 kg
Material Activation Energy,
Ea (kJ/mol)
Activation Energy, Ea (eV)
MFR-1 (10 min/g)
(T=125°C, w=9.91 kg)
uncured-EVA 58 0.60 0.02*
PVB 113 1.17 2.28
PO1 38 0.40 0.14
PO3 41 0.42 1.28
PO4 39 0.41 0.25
TPU 100 1.03 1.7 *based on extrapolated MFR value for uncured-EVA (see Figure 9).

15
Discussion and Conclusion
The module with uncured-EVA encapsulant was the only module with measurable displacement after outdoor exposure in Mesa, AZ. (However, many PV module warranties apply for 25 years—a greater duration than the single summer examined in Figure 3). After 37 days of measurements, creep displacement (~2.3 mm) in the Mesa module was more than ten times greater than that (0.21 mm) in the Golden module. This is a result of the hotter climate in Mesa: ambient temperatures in Mesa were consistently above 40°C, whereas those in Golden were generally in the 30°–35°C range, leading to maximum module temperatures in Mesa in the 95°–100°C range and module temperatures in Golden in the 85°–90°C range. Uncured-EVA is not a suitable encapsulant in a worst-case module scenario (i.e., an insulated rack-mounted, thin-film glass/glass module with no frame or edge clips deployed in a desert location). A MFR test load of 9.91 kg was necessary to achieve a test temperature within the range of the maximum temperatures expected for modules fielded in a desert location. The module with uncured-EVA encapsulant was the only one to show displacement. It had an MFR value of 24 g/10 min at 105°C under the 9.91 kg test load. In comparison, the next-highest MFR value of 1.9 g/10 min occurred for PO1 at 105°C. The critical MFR corresponding to the onset of creep in a similar worst-case module is expected to be intermediate to uncured-EVA (which did creep in the field) and PO1 (which did not creep in the field) data profiles. For the 9.91 kg load, the values defining the region between the profiles for PO1 and uncured-EVA are identified in Figure 9; a more specific set of criteria may be determined from the final results and post-analysis of the module-level tests.
Acknowledgements
The authors wish to thank Ryan Smith (NREL) for help with module instrumentation; John Pern (NREL) for his guidance with experimental methods; and Linda Lung (NREL) for her role in organizing the SULI program. The authors are grateful for help with the formal module-level study (to be described later), which benefitted from numerous people at various institutions—including the National Institute of Advanced Industrial Science and Technology (AIST), Arizona State University (ASU), the Dow Chemical Company, the E. I. du Pont de Nemours and Company, the National Renewable Energy Laboratory (NREL), Underwriters Laboratories Inc. (UL), as well as those that have chosen to remain anonymous. The work was supported by the U.S. Department of Energy under Contract No. DE-AC36-08GO28308 to the National Renewable Energy Laboratory.

16
References
[1] D.C. Miller, M.D. Kempe, S.H. Glick, and S.R. Kurtz, Creep in photovoltaic modules: examining the stability of polymeric materials and components, Proceedings of the IEEE PVSC Conference, June 20-25, 2010.
[2] A.V. Shenoy, S. Chattopadhyay, and V.M. Nadkarni, From melt flow index to rheogram, Rheol. Acta. 22, pp. 90-101, 1983.
[3] A. Dutta, On viscosity—melt flow index relationship, Rheol. Acta. 23, pp. 565-569, 1984.
[4] K.C. Seavey, Y.A. Liu, N.P. Khare, T. Bremner, and C. Chen, Quantifying relationships among the molecular weight distribution, non-newtonian shear viscosity, and melt flow index for linear polymers, Ind. Eng. Chem. Res. 42, pp. 5354-5362, 2003.
[5] D.C. Rohlfing and J. Janzen, What’s happening in the melt-flow plastometer: the role of elongational viscosity, Ann. Tech. Conf.—Soc. Plast. Eng., pp. 1010-1014, 1997.
[6] Technical Committee ISO/TC 61 and Technical Committee CEN/TC 249, Plastics—determination of the melt-mass-flow rate (MFR) and the melt volume-flow rate (MVR) of thermoplastics, BS EN ISO 1133:2005 (E), 2005.
[7] ASTM Subcommittee D20.30. Standard test method for flow rates of thermoplastics by extrusion plastometer. ASTM Standard Method D 1238-10, 2010.
[8] K.C. Rusch, Time-temperature superposition and relaxation behavior in polymeric glasses, J. Macromol. Sci., B2 (1968), 179-204.
[9] P.R. Higgenbotham-bertolucci, H. Gao, J.P. Harmon, Creep and stress relaxation in methacrylate polymers: two mechanisms of relaxation behavior across the glass transition region, Polym. Eng. Sci., 41 (2001), 873-880.