use of fluorescence spectroscopy for monitoring petroleum hydrocarbon contamination in estuarine and...
TRANSCRIPT

Bull. Environ. Contain. Toxicol. 30, 413-419 (1983) O 1983 Springer-Verlag New York Inc.
Use of Fluorescence Spectroscopy for Monitoring Petroleum Hydrocarbon Contamination in Estuarine
and Ocean Waters
W. A. Maher
Department of Physical and Inorganic Chemistry, The University of Adelaide, Adelaide, South Australia
It is recognized that repeated sublethal discharges of petrol-
eum hydrocarbons into the marine environment may have long term ecological effects (CONNELL and MILLER 1981). Therefore a need exists for the rapid and accurate identification of contaminated waters to allow the extent of pollution to be assessed and sources
of petroleum hydrocarbon inputs to be identified.
The presence of aromatic hydrocarbons in water samples
provides a marker of petroleum pollution as all oils contain aromatic hydrocarbons while few if any biogenic aromatic hydro- carbons are produced in the marine environment (YOUNGBLOOD and
BLUMER 1975).
Fluorescence spectroscopy has been used to obtain an estimate
of the aromatic hydrocarbon contamination in extracts of seawater (KEIZER and GORDON 1973; LEVY and WALTON 1973; LAW 1978), sediments (HARDGRAVES and PHILLIPS 1975) and marine organisms (ZITKO 1970). This paper examines the use of fluorescence spectroscopy for the routine monitoring of petroleum hydrocarbon contamination in estuarine and seawaters.
EXPERIMENTAL
Equipment: All fluorescence measurements were made with a Perkin Elmer Model 3000 spectrofluorimeter.
Materials: All chemicals were of analytical reagent grade. Solvents were distilled before use. Crude and refined oils were obtained from commercial sources.
Sampling: A sampler constructed in our laboratory (HAHER et
al. 1982) was used in this study; it consisted of a teflon inlet valve mounted onto a detachable glass bottle. The sampler opens and closes at the sampling depth, minimising the risk of contam- ination from the surface layer.
Extraction: Aromatic hydrocarbons were extracted from water Samples (I i), after adjustment of pH to 4.0-5.0, by partition- ing into 2 x 40 ml of methylene dichloride (KIEZER and GORDON 1973).
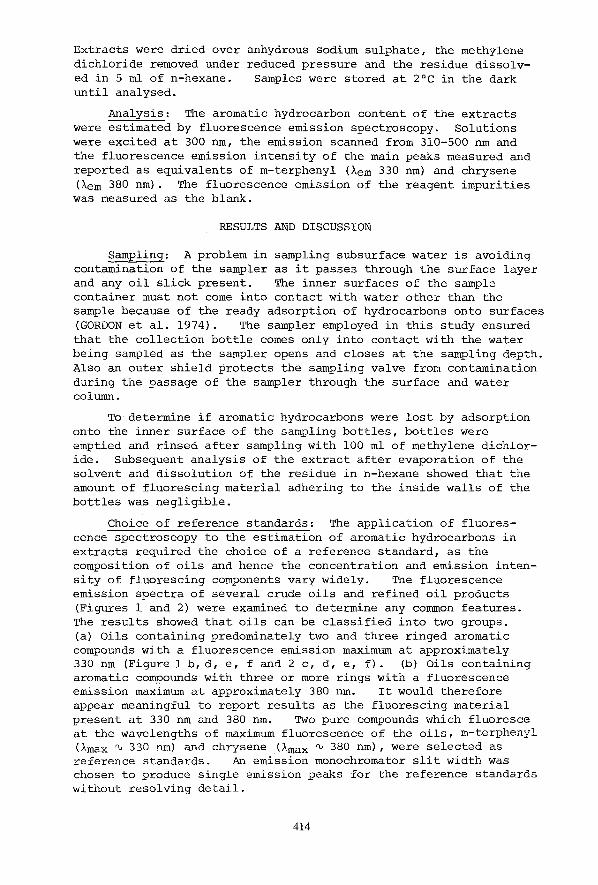
Extracts were dried over anhydrous sodium sulphate, the methylene
dichloride removed under reduced pressure and the residue dissolv- ed in 5 ml of n-hexane. Samples were stored at 2~ in the dark until analysed.
Analysis: The aromatic hydrocarbon content of the extracts
were estimated by fluorescence emission spectroscopy. Solutions were excited at 300 nm, the emission scanned from 310-500 nm and
the fluorescence emission intensity of the main peaks measured and reported as equivalents of m-terphenyl (Xem 330 nm) and chrysene
(lem 380 nm). The fluorescence emission of the reagent impurities was measured as the blank.
RESULTS AND DISCUSSION
Sampling: A problem in sampling subsurface water is avoiding contamination of the sampler as it passes through the surface layer and any oil slick present. The inner surfaces of the sample container must not come into contact with water other than the sample because of the ready adsorption of hydrocarbons onto surfaces (GORDON et al. 1974). The sampler employed in this study ensured
that the collection bottle comes only into contact with the water
being sampled as the sampler opens and closes at the sampling depth. Also an outer shield protects the sampling valve from contamination
during the passage of the sampler through the surface and water column.
To determine if aromatic hydrocarbons were lost by adsorption onto the inner surface of the sampling bottles, bottles were emptied and rinsed after sampling with i00 ml of methylene dichlor- ide. Subsequent analysis of the extract after evaporation of the solvent and dissolution of the residue in n-hexane showed that the amount of fluorescing material adhering to the inside walls of the bottles was negligible.
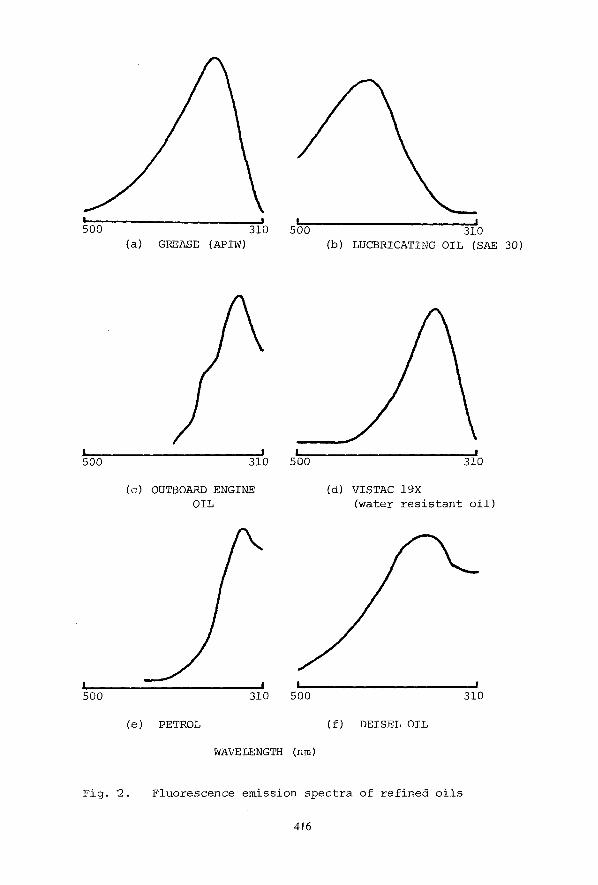
Choice of reference standards: The application of fluores- cence spectroscopy to the estimation of aromatic hydrocarbons in extracts required the choice of a reference standard, as the composition of oils and hence the concentration and emission inten-
sity of fluorescing components vary widely. The fluorescence emission spectra of several crude oils and refined oil products (Figures 1 and 2) were examined to determine any common features. The results showed that oils can be classified into two groups. (a) Oils containing predominately two and three ringed aromatic compounds with a fluorescence emission maximum at approximately 330 nm (Figure i b, d, e, f and 2 c, d, e, f). (b) Oils containing aromatic compounds with three or more rings with a fluorescence emission maximum at approximately 380 nm. It would therefore appear meaningful to report results as the fluorescing material present at 330 nm and 380 nm. Two pure compounds which fluoresce at the wavelengths of maximum fluorescence of the oils, m-terphenyl (%max ~ 330 nm) and chrysene (~max ~ 380 nm), were selected as reference standards. An emission monochromator slit width was chosen to produce single emission peaks for the reference standards without resolving detail.
414

! 310
! 5OO
(a) ARABIAN
L. !
500 310
(b) BARROW ISLAND
500 310
(c) QATAR
L ! 500 310
(d) TAPIS PULAI
I ,,, |
500 310 |,,,
500 '31
(e) GIPPSLAND
WAVELENGTH (nm)
(f) MOONIE
Fig. i. Fluorescence emission spectra of crude oils
415
L ! ! I 500 310 500 310
(a) GREASE (APIW) (b) LUCBRICATING OIL (SAE 30)
I. 500
I 310
I 310
(c) OUTBOARD ENGINE
OIL
i 500
( e ) PETROL
! 310
,I 500
(d) VISTAC 19X
(water resistant oil)
! I 500 310
(f) DEISEL OIL
WAVELENGTH (nm)
Fig. "2. Fluorescence emission spectra of refined oils
416
Evaluation of procedure: One litre samples of seawater were
spiked with 1 ~g of either Tapis Pulai crude, Barrow Island crude or lubricating oil and analysed by extraction and spectrofluori- metry. Recoveries of all oils were greater than 95% and the relative standard deviation ranged from less than 2% for the Barrow Island crude and lubricating oil to 3% for the Tapis Pulai crude.
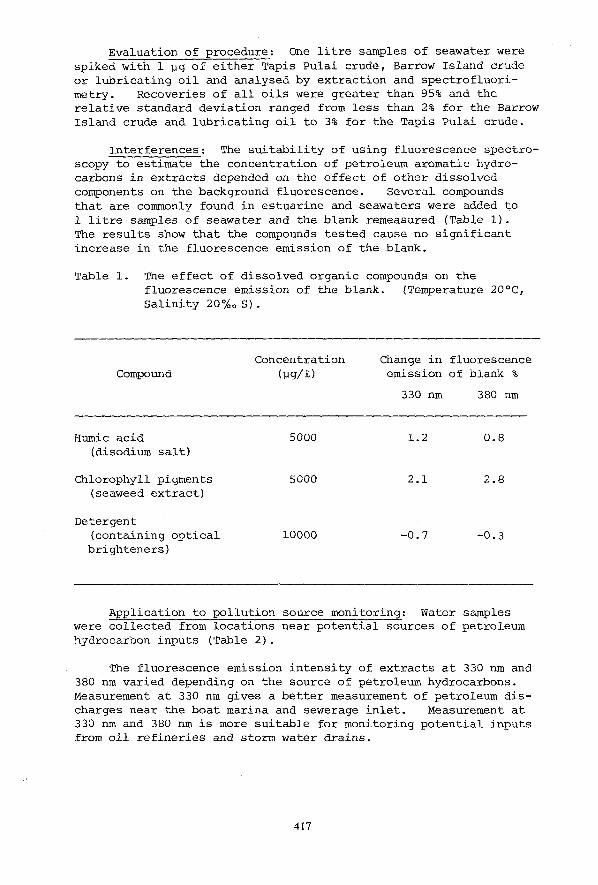
Interferences: The suitability of using fluorescence spectro- scopy to estimate the concentration of petroleum aromatic hydro- carbons in extracts depended on the effect of other dissolved components on the background fluorescence. Several compounds that are commonly found in estuarine and seawaters were added to
1 litre samples of seawater and the blank remeasured (Table i). The results show that the compounds tested cause no significant
increase in the fluorescence emission of the blank.
Table i. The effect of dissolved organic compounds on the fluorescence emission of the blank. (Temperature 20~
Salinity 20~o S) .
Concentration Compound (~g/Z)
Change in fluorescence emission of blank %
330 nm 380 nm
Humic acid 5000 1.2 0.8 (disodium salt)
Chlorophyll pigments (seaweed extract)
Detergent (containing optical brighteners)
5000 2.1 2.8
10000 -0.7 -0.3
Application to pollution source monitoring: Water samples were collected from locations near potential sources of petroleum hydrocarbon inputs (Table 2).
The fluorescence emission intensity of extracts at 330 nm and 380 nm varied depending on the source of petroleum hydrocarbons. Measurement at 330 nm gives a better measurement of petroleum dis- charges near the boat marina and sewerage inlet. Measurement at 330 nm and 380 nm is more suitable for monitoring potential inputs from oil refineries and storm water drains.
417
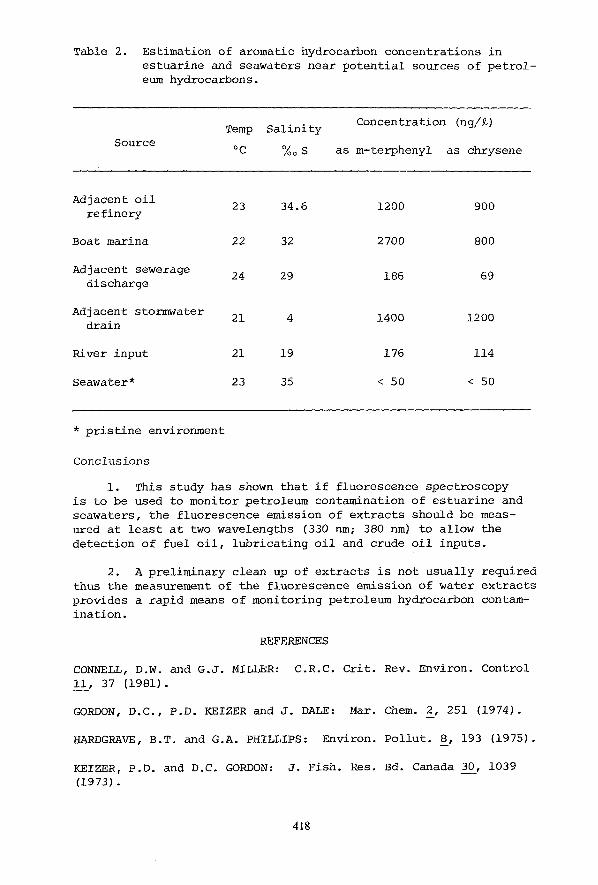
Table 2. Estimation of aromatic hydrocarbon concentrations in estuarine and seawaters near potential sources of petrol- eum hydrocarbons.
Source
Concentration (ng/~) Temp Salinity
~ ~o S as m-terphenyl as chrysene
Adjacent oil 23 34.6 1200 900
refinery
Boat marina 22 32 2700 800
Adjacent sewerage 24 29 186 69 discharge
Adjacent stormwater 21 4 1400 1200
drain
River input 21 19 176 114
Seawater* 23 35 < 50 < 50
* pristine environment
Conclusions
i. This study has shown that if fluorescence spectroscopy is to be used to monitor petroleum contamination of estuarine and
seawaters, the fluorescence emission of extracts should be meas- ured at least at two wavelengths (330 nm; 380 nm) to allow the
detection of fuel oil, lubricating oil and crude oil inputs.
2. A preliminary clean up of extracts is not usually required
thus the measurement of the fluorescence emission of water extracts provides a rapid means of monitoring petroleum hydrocarbon contam-
ination.
REFERENCES
CONNELL, D.W. and G.J. MILLER: C.R.C. Crit. Rev. Environ. Control
I_L, 37 (19sl).
GORDON, D.C., P.D. KEIZER and J. DALE: Mar. Chem. ~, 251 (1974).
HARDGRAVE, B.T. and G.A. PHILLIPS: Environ. Pollut. 8, 193 (1975).
KEIZER, P.D. and D.C. GORDON: J. Fish. Res. Bd. Canada 30, 1039
(1973).
418
LAW, R.J.: Mar. Pollut. Bull. 2, 321 (1978).
LEVY, E.M. and A. WALTON: J. Fish. Res. Bd. Canada 30, 251 (1973).
MAHER, W.A., I. KEENE and J.D. SMITH: (1982) (to be published).
ZITKO, V.: Bull. Environ. Contam. Toxicol. 5, 559 (1970).
YOUNGBLOOD, W.W. and M. BLUMER: Geochim. Cosmochim. Acta 39, 1303 (1975).
Accepted January 12, 1983
419