u.s./canada grain handling and transportation...
TRANSCRIPT

Agribusiness & Applied Economics Report No. 451 May 2001
U.S./Canada Grain Handling andTransportation Systems
Joon J. ParkWon W. Koo
Department of Agribusiness and Applied EconomicsNorthern Plains Trade Research Center
North Dakota State UniversityFargo, ND 58105
Acknowledgments
The authors extend appreciation to Dr. George Flaskerud, Mr. Richard Taylor, Mr. JeremyMattson, and Dr. Roger Johnson for their constructive comments and suggestions. Special thanks go toMs. Carol Jensen, who helped to prepare the manuscript.
The research was conducted under the U.S.-Canada agricultural trade research programfunded by U.S. Department of the Treasury/U.S. Customs Service (Grant No. TC-00-001G,ND1301).
We would be happy to provide a single copy of this publication free of charge. You canaddress your inquiry to: Carol Jensen, Department of Agribusiness and Applied Economics, NorthDakota State University, P.O. Box 5636, Fargo, ND, 58105-5636, Ph. 701-231-7441, Fax 701-231-7400, e-mail [email protected]. This publication is also available electronically at thisweb site: http://agecon.lib.umn.edu/
NOTICE:
The analyses and views reported in this paper are those of the author(s). They are notnecessarily endorsed by the Department of Agribusiness and Applied Economics or by North DakotaState University.
North Dakota State University is committed to the policy that all persons shall have equalaccess to its programs, and employment without regard to race, color, creed, religion, national origin,sex, age, marital status, disability, public assistance status, veteran status, or sexual orientation.
Information on other titles in this series may be obtained from: Department of Agribusiness andApplied Economics, North Dakota State University, P.O. Box 5636, Fargo, ND 58105. Telephone:701-231-7441, Fax: 701-231-7400, or e-mail: [email protected].
Copyright © 2001 by Joon J. Park and Won W. Koo. All rights reserved. Readers maymake verbatim copies of this document for non-commercial purposes by any means, provided that thiscopyright notice appears on all such copies.
Table of Contents
Page
List of Tables . . . . . . . . . . . . . . . . . . . . . . . . . . . . . . . . . . . . . . . . . . . . . . . . . . . . . . . . . . . . . . . . iii
List of Figures . . . . . . . . . . . . . . . . . . . . . . . . . . . . . . . . . . . . . . . . . . . . . . . . . . . . . . . . . . . . . . . . iv
Abstract . . . . . . . . . . . . . . . . . . . . . . . . . . . . . . . . . . . . . . . . . . . . . . . . . . . . . . . . . . . . . . . . . . . . . v
Highlights . . . . . . . . . . . . . . . . . . . . . . . . . . . . . . . . . . . . . . . . . . . . . . . . . . . . . . . . . . . . . . . . . . . vi
1. Introduction . . . . . . . . . . . . . . . . . . . . . . . . . . . . . . . . . . . . . . . . . . . . . . . . . . . . . . . . . . . . . . . . 1
2. Differences in Grain Handling and Transportation Systems . . . . . . . . . . . . . . . . . . . . . . . . . . . . . . 82.1. Regulatory Structures . . . . . . . . . . . . . . . . . . . . . . . . . . . . . . . . . . . . . . . . . . . . . . . . . . 82.2. Geographic Scope of Country Competition . . . . . . . . . . . . . . . . . . . . . . . . . . . . . . . . . 102.3. Grain Handling and Marketing . . . . . . . . . . . . . . . . . . . . . . . . . . . . . . . . . . . . . . . . . . 11
A. Grain Handling and Marketing Structure . . . . . . . . . . . . . . . . . . . . . . . . . . . . . . 11B. Grain Handling, Shipping, and Marketing Practices . . . . . . . . . . . . . . . . . . . . . . 12C. Prices Received by Farmers . . . . . . . . . . . . . . . . . . . . . . . . . . . . . . . . . . . . . . . 14
2.4. Dynamic Changes and Investments in the GHTS . . . . . . . . . . . . . . . . . . . . . . . . . . . . . 142.5. Summary . . . . . . . . . . . . . . . . . . . . . . . . . . . . . . . . . . . . . . . . . . . . . . . . . . . . . . . . . . 16
3. Canadian Transportation Mechanisms and Issues . . . . . . . . . . . . . . . . . . . . . . . . . . . . . . . . . . . . 173.1. Railroad . . . . . . . . . . . . . . . . . . . . . . . . . . . . . . . . . . . . . . . . . . . . . . . . . . . . . . . . . . . 17
A. Rail Rate . . . . . . . . . . . . . . . . . . . . . . . . . . . . . . . . . . . . . . . . . . . . . . . . . . . . . 17B. Railcar Ownership . . . . . . . . . . . . . . . . . . . . . . . . . . . . . . . . . . . . . . . . . . . . . . 19C. Railcar Allocation . . . . . . . . . . . . . . . . . . . . . . . . . . . . . . . . . . . . . . . . . . . . . . . 20
3.2. Grain Trucking . . . . . . . . . . . . . . . . . . . . . . . . . . . . . . . . . . . . . . . . . . . . . . . . . . . . . . 233.3. Grain Handling and Export Logistics . . . . . . . . . . . . . . . . . . . . . . . . . . . . . . . . . . . . . . 26
A. Handling Costs and Cost Pooling . . . . . . . . . . . . . . . . . . . . . . . . . . . . . . . . . . . 27B. Cleaning Regulations and Practices . . . . . . . . . . . . . . . . . . . . . . . . . . . . . . . . . . 27C. Export Logistics . . . . . . . . . . . . . . . . . . . . . . . . . . . . . . . . . . . . . . . . . . . . . . . . 30
4. Rationalization and Current Policy Issues in Canada . . . . . . . . . . . . . . . . . . . . . . . . . . . . . . . . . . 304.1. Reform Package . . . . . . . . . . . . . . . . . . . . . . . . . . . . . . . . . . . . . . . . . . . . . . . . . . . . 31
A. Revenue Cap and Rate Cap . . . . . . . . . . . . . . . . . . . . . . . . . . . . . . . . . . . . . . . 32B. Grain Roads . . . . . . . . . . . . . . . . . . . . . . . . . . . . . . . . . . . . . . . . . . . . . . . . . . . 33C. Grain Handling and Transportation Logistics . . . . . . . . . . . . . . . . . . . . . . . . . . . 33D. Safeguards . . . . . . . . . . . . . . . . . . . . . . . . . . . . . . . . . . . . . . . . . . . . . . . . . . . . 33E. Branch Lines . . . . . . . . . . . . . . . . . . . . . . . . . . . . . . . . . . . . . . . . . . . . . . . . . . . 34F. Monitoring . . . . . . . . . . . . . . . . . . . . . . . . . . . . . . . . . . . . . . . . . . . . . . . . . . . . 34

ii
Table of Contents (Cont.)
Page
4.2. Primary Elevators and Efficiency . . . . . . . . . . . . . . . . . . . . . . . . . . . . . . . . . . . . . . . . . 354.3. Railroad and Trucking . . . . . . . . . . . . . . . . . . . . . . . . . . . . . . . . . . . . . . . . . . . . . . . . 36
A. Abandonment of Rail Branch and Short Lines . . . . . . . . . . . . . . . . . . . . . . . . . . 36B. Rail Deregulation . . . . . . . . . . . . . . . . . . . . . . . . . . . . . . . . . . . . . . . . . . . . . . . 36C. Trucking . . . . . . . . . . . . . . . . . . . . . . . . . . . . . . . . . . . . . . . . . . . . . . . . . . . . . . 37
4.4. Port Buying . . . . . . . . . . . . . . . . . . . . . . . . . . . . . . . . . . . . . . . . . . . . . . . . . . . . . . . . 38
5. Implications for Grain Trade . . . . . . . . . . . . . . . . . . . . . . . . . . . . . . . . . . . . . . . . . . . . . . . . . . . 395.1. Changes in Grain Handling . . . . . . . . . . . . . . . . . . . . . . . . . . . . . . . . . . . . . . . . . . . . . 395.2. Reciprocal Access to Marketing Functions . . . . . . . . . . . . . . . . . . . . . . . . . . . . . . . . . 39
A. U.S. Grains Through Canadian Railroads . . . . . . . . . . . . . . . . . . . . . . . . . . . . . 40B. Cross Border Grain Movement: The Canadian Wheat Access Facilitation Program . . . . . . . . . . . . . . . . . . . . . . . . . . . . . . . . . . . . . . . . . . . . . 43
5.3. Elimination of Rate Caps . . . . . . . . . . . . . . . . . . . . . . . . . . . . . . . . . . . . . . . . . . . . . . 465.4. Reform Package and Likely Future Paths for Canadian Rationalization . . . . . . . . . . . . 47
6. Concluding Remarks . . . . . . . . . . . . . . . . . . . . . . . . . . . . . . . . . . . . . . . . . . . . . . . . . . . . . . . . . 47
References . . . . . . . . . . . . . . . . . . . . . . . . . . . . . . . . . . . . . . . . . . . . . . . . . . . . . . . . . . . . . . . . . . . 50
Appendix . . . . . . . . . . . . . . . . . . . . . . . . . . . . . . . . . . . . . . . . . . . . . . . . . . . . . . . . . . . . . . . . . . . . 531. Manitoba Truck Types . . . . . . . . . . . . . . . . . . . . . . . . . . . . . . . . . . . . . . . . . . . . . . . . . 552. Application Form for the State of Origin Certificate for In-Transit Grain Shipments . . . . . . . . . . . . . . . . . . . . . . . . . . . . . . . . . . . . . . . . . . . . . . . . . . . . . . 563. State of Origin Certificate - In-Transit . . . . . . . . . . . . . . . . . . . . . . . . . . . . . . . . . . . . . . 574. Request for Release Approval . . . . . . . . . . . . . . . . . . . . . . . . . . . . . . . . . . . . . . . . . . . . 585. Cargo Control Document . . . . . . . . . . . . . . . . . . . . . . . . . . . . . . . . . . . . . . . . . . . . . . . 596. Participating Canadian Elevators of the Wheat Access Facilitation Program . . . . . . . . . . 607. Canada Customs Form B3 . . . . . . . . . . . . . . . . . . . . . . . . . . . . . . . . . . . . . . . . . . . . . . 618. Canada Customs Invoice . . . . . . . . . . . . . . . . . . . . . . . . . . . . . . . . . . . . . . . . . . . . . . . . 629. Canadian Grain Commission Importer Declaration . . . . . . . . . . . . . . . . . . . . . . . . . . . . . 6310. Application Form for Phytosanitary Certificate for Export . . . . . . . . . . . . . . . . . . . . . . . 6411. USDA Phytosanitary Certificate . . . . . . . . . . . . . . . . . . . . . . . . . . . . . . . . . . . . . . . . . . 65

iii
List of Tables
Table No. Page
1 Structure of Grain Handling and Transportation in the U.S. GHTS . . . . . . . . . . . . . . . . . . . . . 2
2 Structure of Grain Handling and Transportation in the Canadian GHTS . . . . . . . . . . . . . . . . . 5
3 Regulatory Structure of the Canadian GHTS . . . . . . . . . . . . . . . . . . . . . . . . . . . . . . . . . . . . . 9
4 Structural Comparisons in Grain Handling (Country Elevation) . . . . . . . . . . . . . . . . . . . . . . . 11
5 Comparison Keys of Canadian and U.S. GHTS Performance Statistics . . . . . . . . . . . . . . . . 13
6 Handling Cost Comparisons Between Canada and the United States . . . . . . . . . . . . . . . . . . 13
7 Differences Between Country Prices for All Wheat and Barley,After Adjusting for the U.S. Export Enhancement Program,Saskatchewan, North Dakota, and Montana, 1984-1996 . . . . . . . . . . . . . . . . . . . . . . . . . . 15
8 Estimated Annual Average Marketing Cost Inefficienciesfor Saskatchewan, 1984-1996 and 1995-1996, Compared to North Dakota and Montana . . . . . . . . . . . . . . . . . . . . . . . . . . . . . . . . . . . . . . . . . . . . . . . . 15
9 Estimated Rail Transport Costs for Canadian Western Grain . . . . . . . . . . . . . . . . . . . . . . . . 18
10 Wheat or Barley Cleaning Costs and Returns for Canadian andU.S. Elevators . . . . . . . . . . . . . . . . . . . . . . . . . . . . . . . . . . . . . . . . . . . . . . . . . . . . . . . . . . 29
11 Some Known Inefficiencies in Western Canadian Grain Handlingand Transportation . . . . . . . . . . . . . . . . . . . . . . . . . . . . . . . . . . . . . . . . . . . . . . . . . . . . . . . 35
12 U.S. Grain Through Canada In-transit Program . . . . . . . . . . . . . . . . . . . . . . . . . . . . . . . . . . 41
13 BNSF and CP Rail Rates for Grain Shipments from North Dakota Origins to the U.S. West Coast Under the In-transit Program . . . . . . . . . . . . . . . . . . . . . . . . . . . . . . . 42
14 Rates of Representative Barley Shipments . . . . . . . . . . . . . . . . . . . . . . . . . . . . . . . . . . . . . . 46

iv
List of Figures
Figure No. Page
1 The U.S. Domestic and Export Logistics of Grain . . . . . . . . . . . . . . . . . . . . . . . . . . . . . . . . . 3
2 The Canadian Grain Handling and Transportation and Logistics Chain . . . . . . . . . . . . . . . . . . 6
3 Physical Elements of Canadian Logistics System, Average TimeLoad of Canadian Grain, and Costs . . . . . . . . . . . . . . . . . . . . . . . . . . . . . . . . . . . . . . . . . . . 7
4 Canadian Railcar Allocation Zones by Railways . . . . . . . . . . . . . . . . . . . . . . . . . . . . . . . . . 21
5 Canadian Railcar Allocation Process . . . . . . . . . . . . . . . . . . . . . . . . . . . . . . . . . . . . . . . . . . 22
6 Truck Rates Comparison Between Canada and the United States . . . . . . . . . . . . . . . . . . . . 23
7 The Canadian Rail and Trucking Rate Functions . . . . . . . . . . . . . . . . . . . . . . . . . . . . . . . . . 25

v
Abstract
The United States and Canada have developed very different grain handling and transportationsystems (GHTSs) over the last several decades to compete for global and domestic markets in Canadaand the United States under CUSTA. Because the grain industries in both countries face long distancehauls, GHTSs are critically important to their operations and to producer returns.
There has been considerable pressure for change in Canada’s grain handling and transportationsector. Some industry trends, such as the rationalization of elevators in the Prairies and investments innew high through-put facilities, are being driven by market and competitive forces. Changes in grainhandling, reciprocal access to marketing functions, and elimination of rate caps may have a significantimpact on cross-border grain flows.
Canadian Transport announced reforms to improve the efficiency of its GHTS. Possible multi-level effects, created by the reform package, would affect the grain flow from Canada to the UnitedStates. The most significant reforms include ‘port buying’ by the Canadian Wheat Board, which wouldremove the Board’s control over internal logistics and shipping, and replacement of the currentmaximum railway rate scale with a cap on annual railway revenues for grain shipments.
Key Words : Canadian Wheat Board (CWB), Grain Trade, Grain Transportation and HandlingSystem (GHTS), Rail Rate, Railcar Allocation, Rationalization, Rate Cap, ReciprocalAccess, Regulation, Reform Package.

vi
Highlights
Grain handling and transportation systems (GHTSs) are among the important issues of theagricultural agenda in the Unites States - Canada Free Trade Agreement (CUSTA). The two countrieshave developed very different GHTSs over the last several decades. In the United States, price signalsand service competition throughout the system coordinate the vertical marketing functions and guidemarketing and investment decisions. In Canada, the Canadian Wheat Board (CWB) has controlled theGHTS to regulate a single marketing and transportation system to support the CWB’s export marketingmonopoly. The CWB and other government agents in the industry allocate the key physical systemresources such as grain deliveries, storage capacity, and railway cars. The Canadian GHTS is anadministered system in which market price signals have been less effective and competitive pressuresdo not exist due to regulatory and administrative controls.
Recently the GHTSs in the two countries have rapidly developed to compete for global anddomestic markets in Canada and the United States under CUSTA. It is important to compare thestructure, regulatory practices, reforms, and efficiency of both GHTSs because they directly affect thecompetitive position of grain producers in each country; grain producers are highly dependent on railtransportation to move grains long distances to export ports. Under CUSTA, there is growing pressureto harmonize the GHTS and diversify delivery options.
The U.S. GHTS has experienced extensive deregulation with many marketing andtransportation options and has evolved toward a commercial model within a competitive environmentsince the 1980s. As a result, investment, new technologies, and deregulation have brought substantialincreases in the volume of grains shipped and decreases in railway freight rates. The Canadian GHTS isundergoing substantial changes based on the Estey Report and the Kroeger Report. On May 10, 2000,Canadian Transport announced the government’s intention to introduce measures to increase efficiencyand cut costs in Canada’s GHTS. The reforms began on August 1, 2000.
Because the grain industries in both countries face long distance hauls, GHTSs are criticallyimportant to their operations and to producer returns. The Canadian and U.S. GHTSs are based onvery different regulatory structures. In Canada, reforms have been implemented to increase efficiencyand cut costs in their GHTS. In the United States, farmers and grain handlers are searching for highergrain prices, lower operating costs, and access of U.S. grains to Canadian markets.
The Canadian rail system is dominated by two rail carriers: the Canadian National (CN) andCanadian Pacific (CP). Both carriers have major lines with an east-west configuration, which facilitesshipments of grain from Prairie locations to Pacific ports or the Great Lakes and St. Lawrence Seaway.CP, which has ownership of the former Soo Line, has lines through North Dakota, Minnesota, andWisconsin, giving it direct access to major U.S. consumption points for malting barley and wheat. CN,which owns the former Illinois Central, moves western Canadian and U.S. grain to ports on the Gulf ofMexico and to major U.S. consumption points.
vii
The Canadian agricultural industry is heavily dependent on reliable rail service to compete inworld markets. For grains, the long distances from the Prairies to major export ports and the bulkynature of the products give rail an inherent advantage over trucking. Although the average length of hauland rates for Canadian grain movement have decreased due to abandonment of branch lines during thelast several years, the average length of haul and rate are still significant factors. Based on Canada’scurrent infrastructure, approximately 85 percent of grain delivery points are within 50 miles of acompeting railway. It suggests that trucking premiums and a large scale trucking program could beimplemented to move grain between CN and CP and even to the main east-west Burlington Northernand Santa Fe (BNSF) line, which lies just south of the U.S. border. Large grain companies have theability to truck between competing railways. The North American Free Trade Agreement (NAFTA)allows grain shipments from domestic to a transborder pattern.
The Canadian logistics system strives to operate on a ‘just-in-time’ basis. This system requiresclose cooperation among buyers, suppliers, and transportation providers; reliable rail service; efficientstock management at port terminals; and timely vessel arrivals. The smooth interaction of these factorsis critical, but the current system for moving grain in western Canada is not designed to be efficient orcustomer focused. On May 10, 2000, Canadian Transport announced the government’s intention tointroduce measures to increase efficiency and cut costs in Canada’s GHTS. The reform packagecontains six main components:
1. Replacement of the current maximum railway rate scale with a cap on annual railwayrevenues from grain;
2. Funding for Prairie grain roads;
3. Creation of a more commercial and competitive system for moving grain from countryelevators to ports, which will be achieved through the expansion of tendering for CWBshipments to port;
4. Improvements to the Final Offer Arbitration (FOA) provisions of the CanadaTransportation Act;
5. Improvements to the branch line rationalization process; and
6. Continuous monitoring and reporting by an independent private-sector third party to assessthe impact of these changes.
Reciprocal access is the issue developed recently under the December 1998 Record ofUnderstanding with Canada. The Canadian Food Inspection Agency (CFIA) simplified handlingrequirements for U.S. grain by accepting a certificate of origin instead of a Phytosanitary Certificate(with declarations for freedom from dwarf bunt, flag smut, and Karnal bunt) for grain that meets all ofthe following conditions:

viii
• the grain originates in U.S. approved areas (Minnesota, Montana, and North Dakota);• the grain will transit through Canada only by rail (in sealed hopper car);• the grain will return to the United States; and• the grain will not be unloaded in Canada.
Under the program, U.S. producers and shippers have better transportation access to finalWest Coast destinations in the United States. According to state officials, in-transit certificates havebeen issued for the movement of more than 1,580 million pounds and 1,420 million pounds of grain in1999 and 2000, respectively. However, U.S. producers and exporters would like to have access tograin export facilities in the West Coast, mainly the port of Vancouver, under the same in-transitprogram.
In North Dakota, there are no large differences in rail rates from North Dakota to West Coastdestinations between BNSF and CP (the former Soo Line Railroad). The elevator managers on theBNSF and CP lines use the in-transit program because of availability of railcars. The freight rate isconsistent across the state for west bound shipments on both railroads but differs for east boundshipments. Elevators in the western and northern parts of the state ship more of their grain to WestCoast destination than elevators in the east or southern parts of the state. Most elevators do not haveaccess to both railroads so their choice of railroad is largely determined by their location rather thanfreight rates.
Access to Canadian primary elevators is vital for U.S. producers seeking to enhanceopportunities for grain sales to Canada. The Canadian Wheat Access Facilitation Program (WAFP)improves access for U.S. grain producers and other sellers to Canada. Wheat producers fromapproved areas in Montana and North Dakota or grain handlers of wheat produced in those areascould benefit from WAFP. A producer selling wheat directly to a Canadian elevator needs to obtain aphytosanitary certificate. Prospective U.S. wheat producers or other sellers negotiate sales contractswith Canadian buyers covering price, quantity, quality, delivery, currency of payment, and other terms. Before admitting the wheat into Canada, Canadian Customs officers will verify the following documents:
• Canada Customs Form B3 for the identification of goods being imported;• a Canada Customs or commercial invoice form;• a Cargo Control Document or manifest in a format acceptable to Canada Customs;• the Canadian Grain Commission (CGC) Importer Declaration; and• a copy of a USDA phytosanitary certificate.
In addition to these required documents, there are more complicated and cumbersome requirements inthe “Memorandum to the Canadian Trade Licensed Primary Elevators Handling U.S. Wheat.” Underthe program started in 1999, no wheat has moved from the United States to Canada. To begin wheatexport from the United States to Canada, it seems necessary to remove some of the CGCrequirements.

ix
Canadian Transport announced the reforms based on both the Estey and Kroeger Reports.Possible multi-level effects, created by the reform package, would affect the grain flow from Canada tothe United States. The most significant reform is ‘port buying’ by the CWB. Port buying would removethe Board’s control over internal logistics and shipping, and replace the current maximum railway ratescale with a cap on annual railway revenues for grain shipments. However, it is notable that port buyingis a concept promoted and described strictly with respect to executing off-shore export contracts. Noreference has been made concerning trade within North America. These proposed changes aremotivated by a desire to improve system efficiency through increased competition and accountability.

*Research Associate and Professor and Director, respectively, in the Northern Plains TradeResearch Center, Department of Agribusiness and Applied Economics, North Dakota State University,Fargo.
1The Estey Report is a comprehensive review of the efficiency of the transportation andhandling system for Canadian Prairie grain. The report, submitted in December 1998, identifies 15 issueareas raised by stakeholders.
2Kroeger Report, working with industry stakeholders, has prepared recommendations on thechanges necessary to implement a reform package with release in October 1999.
U.S./Canada Grain Handling and Transportation Systems
Joon J. Park and Won W. Koo*
1. Introduction
Grain handling and transportation systems (GHTSs) are among the important agricultural issuesof the Unites States - Canada Free Trade Agreement (CUSTA). The Canadian GHTS is undergoingsubstantial changes based on the Estey Report1 and Kroeger Report.2 On May 10, 2000, CanadianTransport announced the government’s intention to introduce measures to increase efficiency and cutcosts in Canada’s GHTS. The reforms are being implemented beginning August 1, 2000. It will be ahighly dynamic competitive process with important implications for marketing and commercial policies.
This study provides an overview of the GHTSs in the United States and Canada with particularreference to grain trade between the two countries under CUSTA. Important features of the systemsare identified and described, and issues associated with current grain transportation policies andagricultural commodity marketing are summarized and evaluated. The objectives of this study are toprovide descriptions and policy implications of institutional features and trade practices, as well asbackground on recent and prospective policy changes. The likely impacts of institutional features andpolicies on grains under CUSTA, especially durum, hard red spring wheat, and malting barley areanalyzed.
There are significant differences in the GHTSs between the United States and Canada. The twocountries have developed very different systems over the last several decades. In the United States,price signals and service competition throughout the system coordinate the vertical marketing functionsand guide marketing and investment decisions. In Canada, the federal government through nationaltransportation legislation, the Canada Transportation Act (CTA), and the Canadian Wheat Board(CWB), administrates the system.
The grain handling and transportation industry in the United States has been changeddramatically over the last two decades. There have been technological changes and productivity gains inthe transportation system and substantial investment throughout the system. The system integrates anumber of services and operates in response to market and price incentives to move grain from farm to
2
domestic and foreign markets (Wilson 1998 and USDA 1998). Rail, truck, and barge transportationfacilitate a highly competitive transportation market. The competitive environment in the grain handlingindustry has passed enormous cost savings on to farmers and decision makers throughout the system(Parsons and Wilson 1999). Important key elements of the U.S. GHTS are shown in Table 1 andFigure 1. The U.S. GHTS includes storage and handling functions, car allocation and shipping, andexport handling and logistics management.
Table 1. Structure of Grain Handling and Transportation in the U.S. GHTS
Transport Service Commentary
Farmers Moves 63 million tons of wheat.Short truck delivery distances.Farmer paid at delivery.
Country collection By truck and rail.Growth of short lines.Multiple delivery options.
Grain handling Storage of over 150 million tons.Grain company owns elevators.Competitive with many large farmer-owned companies.Elevator size increased following deregulation.
Long distance 75% by rail and 25% by truck from North Dakota.Mode varies by destination.Shipments to west are 96% by rail, to Great Lakes 68% by rail.
Terminal handling &port service
Several options including West Coast (e.g., Portland, Seattle) and Gulf (e.g., NewOrleans, Galveston), Great Lakes (Duluth).Multiple transportation choices for farmers.
System Multiplicity of pricing options.Sustained investment in capacity and technology.Pricing and value programs drive efficiency.Creates value for all system participants.
Source: Parsons and Wilson 1999.
The GHTS in Canada is currently under reform. The second phase of the review has now beencompleted with release of the final report of the Estey Commission in December 1998. The KroegerReport, released in October 1999, worked with industry stakeholders and prepared recommendationson the changes necessary to implement a reform. On May 10, 2000, the Canadian Transport Minister,the Minister of Natural Resources, the Minister responsible for the CWB, and the Minister ofAgriculture and Agri-Food announced the government’s intention to introduce measures to increaseefficiency and cut costs in Canada’s GHTS (http://www.tc.gc.ca/). The reforms began on August 1,2000.

3
Farm Gates
Elevators Inland RiverTerminals
Terminals
Export Ports
Mills
Foreign Buyers
TT T T
R/B/T
OV
T/R
R/B/T
T/RT/R
Key: T=Truck B=Barge R=Rail OV=Ocean Vessel
.Figure 1. The U.S. Domestic and Export Logistics of Grain

3Between 1994-95 and 1995-96 crop years, weighted average deductions from farmers forfreight increased 146, 118, and 153 percent for wheat, durum, and barley, respectively (CWB,Statistical Tables 1998, 18).
4
Price signals and service competition coordinate the vertical marketing functions and guidemarketing and investment decisions in the United States. This process occurs throughout all elements ofthe U.S. GHTS. Price signals have always played an important role in fundamental storage decisions(i.e., timing of marketing decisions are influenced by intermonth price spreads). Through competitivepressures, price discounts have induced development of larger scale elevators and shipments, and haveprovided incentives for farmers to ship longer distances. These signals and competitive pressuresinfluence storage decisions, the timing of shipping decisions, investment decisions in railcars andinfrastructure, and assure efficiencies (Wilson 1998).
The Canadian GHTS is an integrated system involving primary elevators, railways, terminalelevators, and export ports, in which regulations play an important role in marketing decisions. Figure 2and Table 2 show the Canadian grain handling and transportation logistics chain and its regulatoryframework and structure. The CWB regulates and controls grain movements from farms to exportports and the Canadian Grain Commission regulates quality and country handling tariffs. The Canadiangovernment has progressively moved away from regulation and central controls to provide greaterscope for normal commercial decision making. Recently, major changes are being made to reduce thelevel of regulation and subsidization and to operate in a more commercial and market-orientedenvironment.
The CWB is a single-desk seller for all wheat and barley for human consumption (e.g., malting)and export. All other grains and grain products are marketed competitively by grain companies,cooperatives, and producers. The CWB plays a key role in getting its grain to export ports, but doesnot own or operate any elevators. The CWB relies on grain companies and cooperatives to handlegrain from originations to export destinations. The overall performance of Canada’s GHTS is heavilyinfluenced by the CWB, which handles over 60 percent of all grain shipments. Because grains andoilseeds are transported long distances to export points, producers are highly dependent on railtransportation. Before August 1, 1995, policies were in place to subsidize grain transportation chargesand guarantee protection against railway non-performance. However, the Western GrainTransportation Act (WGTA), which set freight rates along with service and infrastructure levels, wasremoved in 1995, resulting in immediate doubling of freight charges paid by producers in some areas.3 Furthermore, the removal of the WGTA also meant the removal of most restrictions on branch lineabandonment.

5
Table 2. Structure of Grain Handling and Transportation in the Canadian GHTSTransport Service Characteristic Significance
Farmers Widely dispersedacross thePrairies
80% of grain to CWB monopoly buyer with many farmers (100,000+)who must market export wheat and barley through the Canadian WheatBoard (CWB). Deliveries managed by the CWB through contract callsand permit books. CWB export grains account for 84% of total Prairieexports (22.3 million tons) with the balance in non-Board grains (4.2million tons -16%).
Country collection Short distancemovement
Grain moved off farm by truck to country elevators. Further countrymovement is by truck and by railway branch line and short line railwaysto mainline train assembly points. Truck movements have been short(10 - 20 miles) but have increased with branch line closure and graincompany economic incentives to attract grain to inland terminals.
Grain handling Increasingcompetition
Handling tariffs are not regulated but monitored by the Canadian GrainCommission, who also issues elevator operating licenses. Elevators canonly receive CWB grains for movement on the regulated system.Three major Canadian companies that have developed from fourprovincial cooperatives. (UGG, SWP, and Agricore account for 68% ofthe current Prairie handling capacity). Other companies (Pioneer,Paterson, Parrish and Heimbpcker, and other smaller, often farmer-owned) account for the remainder of capacity. In total, there are some1,104 country elevators. U.S. companies have become major players inthe country collection system. Cargill entered decades ago but hasbeen joined more recently by Archer Daniels Midland, ConAgra, andthe French company Louis Dreyfus.
Long distance Government rateand serviceregulation
Mainly by rail at statutory maximum rates based on cost estimates ofmovement set in the Canada Transportation Act. Two major railways -Canadian National Railway and Canadian Pacific Railway. Distancesmoved are often in excess of 1,000 miles. Movements are mainly in theform of mixed trains with a minority of unit trains. Trains are commonlycharacterized by multiple origins in the country, multiple terminaldestinations at port, and multiple grades of grain and othercommodities.
Terminal handling Administeredmarket
High levels of corporate concentration with little competition sinceterminal deliveries reflect company country collection performance andfurther allocation and delivery instructions from the CWB.
Port services Recentlyprivatized
Three major ports are Vancouver and Prince Rupert on the West Coastand Thunder Bay at the Lakehead. Border crossings to the UnitedStates account for 15% of the total movement. There are smallmovements through Churchill. Port movements are highly regulatedthrough port union labor agreements that closely control working hoursand shift changes.
System Efficiency Widely recognized as inefficient. Many bottlenecks and systemconstraints including multiple origins and destinations, car allocation,limited use of most efficient elevators and unit trains, grade mix ups,excess tough and damp storage, impurities in grain, high demurrage.
Information Logistics information and requirements generated through committees.
Source: Parsons and Wilson 1999.

6
Farm Country Collection Country Elevation Long Distance Terminal Port Production by Truck and Rail & Storage Movement Elevation Handling & Storage
Widely Short Distance Widely Dispersed 1,000 miles+ Cleaning Loading Dispersed Movements Small Scale Mainly Rail Grading Vessels
REGULATORY FRAMEWORK
Canada Transportation ActStatutory Freight Rates and Caps - Cost Based Rates - Branch Line Exit Controls
Canadian Wheat BoardPermit Books - Contract Calls - Elevator Collection - Car Allocation - Freight Adjustment Factors - Terminal Delivery
Canadian Grain CommissionLicensing Elevators - Country Grain Grading - Terminal Grain Grading - Licensing Tariffs - Quality Inspection
Provincial GovernmentsRural Road and Highways - Provincial Railway Legislation - Road and Rail Taxation
Figure 2. The Canadian Grain Handling and Transportation and Logistics ChainSource: Parsons and Wilson 1999.
Canadian grain spends an average of 68 days in the logistics pipeline from the farmer’s bin toport position (40 days in storage at the country elevator, 12 days in transit to the port, and 16 days interminal elevator storage) (Figure 3). There is considerable variation in time spent in the logisticspipeline, particularly in the lead time from ordering cars for loading and unloading time at export ports(WESTAC 1998, 9). Uncertainty in lead times makes planning and management difficult for all systemparticipants (farmers, grain companies, railways, CWB, and federal and provincial governments).Logistical uncertainties also affect customer perceptions about the reliability of the Canadian system.Canada’s GHTS has caused a significant disadvantage in offshore markets (McKinsey & Company1998, 13). Logistics costs are the largest input cost for grain and are typically in the range of $60-80per ton (WESTAC 1998) in Canada. Large volumes (around 27 million tons) are exported each year,originating at various production points across the Prairies. The St. Lawrence Seaway route throughThunder Bay was once the main grain export route, but growing Asian markets have currently madeVancouver and Prince Rupert the major export ports (61 percent of bulk grains, 56 percent of bulkbarley, and 37 percent of malting barley) (Park, Johnson, and Wilson 1999).

7
Cost Components % Share
Marketing 3
Truck 7
Primary 17
Rail 56
Terminal 17
Figure 3. Physical Elements of Canadian Logistics System, Average Time Load of Canadian Grain, and CostsSource: WESTAC 1998, 9.

8
Because of the long distances to ports and the export orientation of the grain industry in bothcountries, GHTSs are critically important to their operations and to producer returns. The Canadianand U.S. GHTSs are based on very different regulatory structures. In Canada, grain handling andtransportation reforms have been implemented to increase efficiency and cut costs. In the United States,farmers and grain handlers are searching for higher grain prices, lower operating costs, and access ofU.S. grains to Canadian markets. Recently the GHTSs, on both sides of the border, have changedrapidly to countervail the price fall from the peaks reached in the 1995/96 (U.S.) and 1996/97(Canada) crop years. The two countries are competing with each other for domestic markets inCanada and the United States under CUSTA and for the global market. It is important to compare thestructure, regulatory practices, reforms, and efficiency of both GHTSs because they directly affect thecompetitive position of grain producers in each country. Under CUSTA, there is growing pressure toharmonize the GHTSs and diversify delivery options.
2. Differences in Grain Handling and Transportation Systems
Parsons and Wilson (1999) compared the GHTSs of the two countries and identified salientdifferences by eight categories: regulatory structures, grain handling and marketing competitive system,geographic scope of country competitions, grain handling, shipping and marketing practice, marketingand handling costs, dynamic changes in the GHTS, investment in grain handling and transportation, andprices received by farmers. In this study they are recategorized into four: regulatory structures,geographic scope of country competitions, grain handling and marketing, and dynamic changes andinvestments in the GHTSs.
2.1. Regulatory Structures
The U.S. GHTS has experienced extensive deregulation with many marketing andtransportation options and has been evolving toward a competitive commercial model since the 1980s.The escalation of rail shipping options after deregulation has provided an increase in number ofshipment size and service options. With the passage of the Railway, Regulatory Reform andRehabilitation (4R) legislation in 1976 and the 1981 Staggers Act, the United States moved from themicro management of railway rate through the government intervention to application of marketcompetitive pressures on rates and services. As the result, investment, new technologies, andderegulation have brought substantial increases in volume of grains and decrease of railway freight rates.
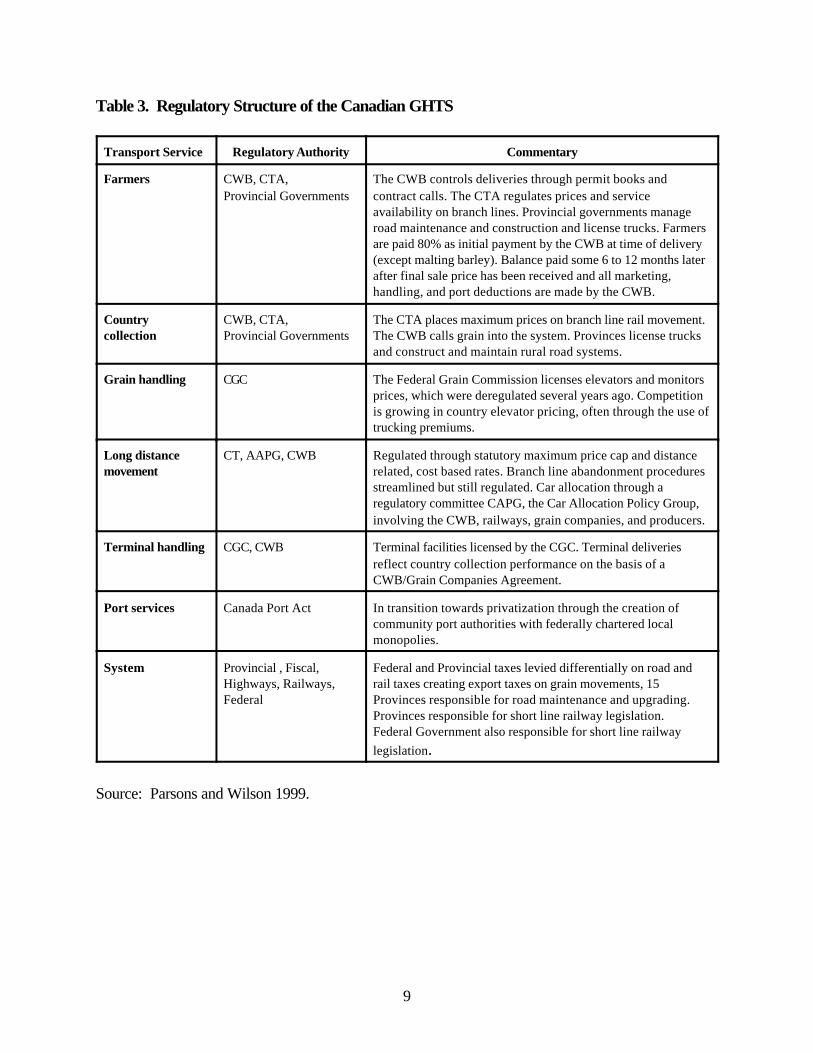
In Canada, the CWB controls the GHTS to support its export marketing monopoly. The CWBand other government agents in the industry allocate the key physical system resources such as graindeliveries, storage capacity, and railway cars (Table 3). All of these regulatory interventions affectprices and performance of the Canadian GHTS. The federal government under the CTA administratesthe shipping costs subject to a price cap. In recent years a large number of operating problems haveoccurred across the Canadian GHTS. To solve the problems and increase efficiency of the system, thespecial grain provisions of the CTA were reviewed in 1999 and the Canadian government announced inMay 2000 its intention to introduce measures to increase efficiency and cut costs.
9
Table 3. Regulatory Structure of the Canadian GHTS
Transport Service Regulatory Authority Commentary
Farmers CWB, CTA,Provincial Governments
The CWB controls deliveries through permit books andcontract calls. The CTA regulates prices and serviceavailability on branch lines. Provincial governments manageroad maintenance and construction and license trucks. Farmersare paid 80% as initial payment by the CWB at time of delivery(except malting barley). Balance paid some 6 to 12 months laterafter final sale price has been received and all marketing,handling, and port deductions are made by the CWB.
Country collection
CWB, CTA,Provincial Governments
The CTA places maximum prices on branch line rail movement.The CWB calls grain into the system. Provinces license trucksand construct and maintain rural road systems.
Grain handling CGC The Federal Grain Commission licenses elevators and monitorsprices, which were deregulated several years ago. Competitionis growing in country elevator pricing, often through the use oftrucking premiums.
Long distancemovement
CT, AAPG, CWB Regulated through statutory maximum price cap and distancerelated, cost based rates. Branch line abandonment proceduresstreamlined but still regulated. Car allocation through aregulatory committee CAPG, the Car Allocation Policy Group,involving the CWB, railways, grain companies, and producers.
Terminal handling CGC, CWB Terminal facilities licensed by the CGC. Terminal deliveriesreflect country collection performance on the basis of aCWB/Grain Companies Agreement.
Port services Canada Port Act In transition towards privatization through the creation ofcommunity port authorities with federally chartered localmonopolies.
System Provincial , Fiscal,Highways, Railways,Federal
Federal and Provincial taxes levied differentially on road andrail taxes creating export taxes on grain movements, 15Provinces responsible for road maintenance and upgrading.Provinces responsible for short line railway legislation.Federal Government also responsible for short line railwaylegislation.
Source: Parsons and Wilson 1999.

10
Regulatory structures for the GHTS that have profound influences on operations,competitiveness, and efficiency of the two systems include:
The CWB and government agents in Canada physically allocate transportation, handling, andmarketing services while the United States allocates the economic resource through the price system.
• The Canadian structure controls the GHTS through cost-based rail price and physicalresource allocation, with the goal of equity (equal access), in contrast to objectives forregulation that aim to create a competitive environment in the United States for a widevariety of marketing, handling, and transportation options.
• Rigidities in the Canadian system from regulations, often entrenching past practices, incontrast to flexibility in the U.S. GHTS to accommodate changes in the industry and newtechnology.
• The CWB, excluded from the Canadian Competition Act, effectively removes theCanadian system from federal competitive controls, in contrast to legally enforceablecommercial contracts, agreements, tariffs, and competition law in the United States.
In summary, the Canadian GHTS is an administered system in which important market price signalshave been removed and competitive pressures reduced through regulatory and administrative controls.In contrast, the U.S. regulatory system has focused on creating a competitive environment in whichprices are used to allocate resources.
2.2. Geographic Scope of Country Competition
A fundamental difference exists in the geographic scope of competition between the CanadianPrairies and the Northern tier of the United States. This difference would have important implicationsfor the relevance of comparisons, as well as the expected post-deregulation competition. Specifically:
• the percent of farming locations within 37 miles, a reasonable trucking distance to the twomajor railways (Canadian Pacific Railway and Canadian National), are 85 percent forManitoba, 74 percent for Saskatchewan, and 52 percent for Alberta in Canada; and
• the average distance from elevators to elevators located on a competitor railway is 116miles in Montana, while the comparable measures in the Prairie provinces are 21 miles forManitoba, 26 miles for Saskatchewan, and 43 miles for Alberta.
Thus, the basic Canadian geography in the Prairies gives more potential competition between tworailways, Canadian Pacific (CP) and Canadian National (CN), and among country elevators for grainsthan in Montana. In recent years, elevator companies in Canada have increasingly offered truckingpremiums due to the competition and in order to increase their grain volume.

4The Herfindahl-Hirschman index is the sum of squares of the market shares of the firms in theindustry: H=s2
1 +s22+s2
3+ @@@ + s2N. The index is a useful indicator of concentration: the larger the
Herfindahl-Hirschman index, the fewer the number of firms dominating the industry (Mansfield 1990).
11
2.3. Grain Handling and Marketing
The U.S. GHTS has more intense competition than the Canadian GHTS. This competition hasled to a large number of efficiency incentives to improve service and realize operating savings. Theseare widely used in the U.S. system and are little used in Canada.
A. Grain Handling and Marketing Structure
One of the more important differences is the structure of the grain handling sector. Both PrairieCanada and North Dakota have cooperatives that handle a large share of grains. In Canada,companies originating as provincial pools dominate grain handling. This is also true in North Dakotawith a large number of farmer-owned cooperatives. In Montana, grain handling cooperatives co-existand compete with large private firms. However, grain handling services are far more concentrated inCanada than in the United States. The largest company accounts for over half of the number ofelevators in each Prairie province compared to 8 percent in North Dakota and 22 percent in Montana.
Canada’s system is substantially more concentrated than that in the Northern tier states. TheHerfindahl-Hirschman index4 indicates that levels of corporate concentration in grain handling arealmost three times as high in the Canadian Prairies as in Montana. Table 4 summarizes these keydifferences in competitive structure. Regulatory and administrative practices to some degree havereinforced the Canadian concentrated corporate structure. Increased trucking and grain companyrestructuring may introduce more competition into the system.
Table 4. Structural Comparisons in Grain Handling (Country Elevation)
Manitoba
Saskatchewan AlbertaNorth
Dakota Montana
Number of Companies 15 26 11 260 73
Corporate ConcentrationMarket share of largest 4 firmsHerfindahl-Hirschman Index
88%3,124
89%2,834
92%3,513
16%159
43%1,088
Source: Parsons and Wilson 1999.

12
B. Grain Handling, Shipping, and Marketing Practices
Differences in handling and marketing practices are partly a result of the structure andregulations affecting the industries in both countries. Handling and shipping practices are(Table 5):
• Average storage capacities of elevators in the Northern tier of the United States are overtwice as large as those in the Canadian Prairies;
• Grain storage in the U.S. system (including on-farm and off-farm, as well as at ports) ismuch higher than in Canada, providing the capacity to meet surge demands;
• In the United States, about 40 percent of spring wheat shipments are shipped by unit train(single origin/single destination), and the destination of more than 70 percent of them is thePacific Northwest ports. This contrasts with less than 25 percent of the shipments fromCanadian Prairie elevators at multiple car rail incentive rates. Only part of these shipmentsare unit train movements. Western Canadian grain shipments are largely from multipleorigins to multiple destinations;
• Waiting times for vessels at the ports in Vancouver are three times larger than those in theUnited States.
Taken together, the U.S. system has greater capacity to ship large volumes in relatively shorter periodsof time, compared to the Canadian system.
Marketing costs in the United States are substantially less than those in Canada, and have beendeclining in real terms since the early 1980s. A comparison of handling costs for various functions ineach country is summarized in Table 6. It is particularly important to note that in the United States,cleaning costs are not charged to farmers, but grain handlers offset the cleaning cost with the transportsavings and by the sale values of screenings. In Canada, grain handling services, including cleaningcosts, are charged on all CWB grains entering the system, irrespective of the extent of cleaning oroffsetting savings in marketing costs.

13
Table 5. Comparison Keys of Canadian and U.S. GHTS Performance Statistics
Item YearCanadianPrairies*
United StatesNorth Dakota (ND)
Montana (MT)
GHTS Storage (millions of tons) 1998 12 163
Farm and GHTS storage capacity as % ofproduction (Prairie farm measured as stocks)
1997 25% 29%-53%
Average size of elevator (thousand of tons) 1998 6.5(Prairies)
15.6 (ND)10.8 (MT)
Share of country locations with multi carloading facilities
1997 17% 44% (ND)
Share of grain shipped at multiple rates 1996 25% 70% (ND)
Average grain car cycle times (days) 1994 18 20 (ND)
Average age of railcars (years) 1998 20(federal
fleet)
11(BNSF)
Ratio of country storage to port storage 1997 2.6:1 13:1
Ratio of port shipment to port storage Average(1995+1996)
13 (B.C.) 29 (Gulf)27 (PNW)
Average vessel waiting time at port (days) 1996 12 (B.C.) 4 (Gulf)
Source: Parsons and Wilson 1999.*Prairies include the Peace River District in British Columbia.
Table 6. Handling Cost Comparisons Between Canada and The United States
Canada U.S. Canada as %Difference from U.S.
C$/mt US$/mt C$/mt US$/mt
Country elevation 10.35 5.51 5.25 2.94 +0.97
Terminal elevation 7.69 4.04 1.84 1.10 +3.18
Cleaning 3.40 1.84 2.29 1.10 +0.48
Total 21.44 11.39 9.38 5.14 +1.29
Source: Parsons and Wilson 1999.

14
C. Prices Received by Farmers
The U.S. GHTS has yielded higher returns to wheat and barley farmers in North Dakota andMontana than Saskatchewan farmers received from the Canadian system. Ultimately, the marketingsystems, inclusive of handling and shipping, serve farmers efficiently in the United States. The cumulativeeffects of these systems affect prices received by farmers. Between 1984 and 1996, the prices receivedby Saskatchewan farmers for CWB wheat and barleywere lower in most years than those received for comparable grains in Montana and North Dakota. In1995 and 1996, farmers in Montana and North Dakota received from C$25/ton to C$45/ton more forwheat and barley than similar grain farmers in Saskatchewan even though Canada allegedly receives aCWB marketing premium relative to U.S. grains and rail rates on grain to export ports from Montanaand North Dakota exceed those from the Prairies.
The net effect of the operating differences in the Canadian and U.S. GHTSs’ performancereflects the respective efficiencies of the two systems. That is, price differences between the twocountries are a reflection of the combined efficiency of their respective country’s collection, handlingand cleaning, long distance rail shipping, port fobbing, marketing, and other related activities. If both thewestern Canadian and U.S. GHTSs were equally efficient, then farm prices would simply reflectdifferences in rail rates that favor the Canadian farmer. However, this is not the case when competitive,regulatory, and efficiency factors are introduced in the system.
Between 1984 and 1996, an efficiency loss in the Canadian GHTS for Saskatchewan farmersreflected the difference in the prices received by farmers. By 1995/96, the price difference grew as highas $36.28 for Saskatchewan wheat relative to North Dakota and $45.31 for Saskatchewan barleycompared to Montana (Table 7). These differences translate to an annual average economicMarketing & GHTS Efficiency Loss of $137 million against North Dakota's GHTS efficiency and$147 million against Montana's GHTS efficiency (Table 8). In 1995, when the U.S. ExportEnhancement Program (EEP) was winding down, and in 1996 when it was not present and there werewidespread reports of inefficiencies and problems in the Canadian grain handling system, thetransportation efficiency loss for Saskatchewan increased to $415 million against Montana and $505million against North Dakota.
2.4. Dynamic Changes and Investments in the GHTS
Dynamic inter-dependent relationships throughout the U.S. system have generated efficiencies,in contrast to a large number of logistical inefficiencies in the Canadian system. Railway regulation,pricing, and dynamic interaction with the rest of the GHTS is found to be central to efficiency gains inthe United States. While deregulation in the United States led to price changes throughout the GHTS,prices of the handling, rail, and port services have moved in different directions in Canada. There havebeen decreases in real rail rates over time in both countries. However, their time paths have differedsubstantially.

15
Table 7. Differences Between Country Prices for All Wheat and Barley, After Adjusting forthe U.S. Export Enhancement Program, Saskatchewan, North Dakota, and Montana, 1984-1996
ComparisonPeriod
Saskatchewan Farm PriceLess North Dakota Farm Price
Saskatchewan Farm PriceLess Montana Farm Price
AnnualAverage
Canadian $/mt Canadian $/mt
Wheat Barley Wheat Barley
1984-1996 -9.27* - 10.29* -7.31 * -28.57*
1992-1996 -21.26* - 15.80* -12.39* -38.10*
1995-1996 -36.28 -25.51 -26.04 -45.31
* Includes adjustment for the U.S. Export Enhancement Program.Source: Parsons and Wilson 1999.
Table 8. Estimated Annual Average Marketing Cost Inefficiencies for Saskatchewan, 1984-1996 and 1995-1996, Compared to North Dakota and Montana (Adjusted for the U.S. ExportEnhancement Program)
Based on North Dakota Montana
1984 - 1996 $137 million $147 million
1995 - 1996 $505 million $415 million
Source: Parsons and Wilson 1999.
• In the Canadian Prairies, rail rates regulated under the WGTA, the National Transport Act(NTA), and the CTA increased through most of the 1980s and then fell after 1993.
• In the United States, rail rates fell sharply in real terms following deregulation in 1980, andcontinued to fall throughout the post deregulation period. The initial effect on rate reductionsranges from 2 percent to 19 percent (varying across grains). By 1995, the cumulativeeffects of deregulation on rail rate reductions ranges from 42 to 55 percent.
The specific process of deregulation in the United States allowed railroads to operate moreefficiently and resulted in more efficient shipping practices, thereby reducing costs and ultimatelyreducing rates. The reduced rail rates were pervasive throughout the system.

16
U.S. pricing structures have allowed for sustained investment in capacity and new technology,while government investment has remained important in Canada. Critical criteria for evaluatingcompetition and regulation include the extent that returns are sufficient enough to induce investments.This is important for farmers since investments in capacity enhance the ability to market grains overshorter time periods in response to market opportunities.
• In the United States, returns to grain shipping have been sufficient to induce investmentsthroughout the system by the private sector. For example, the Burlington Northern Santa Fe(BNSF) railroad averaged $2 billion (US) per year in capital expenditures and investednearly $500 million in their grain business in 1996 and 1997. These investments includeddouble tracking and siding, locomotives, and hopper cars. While other railroads'investments vary, all have invested in expanded rolling stock over the past few years.
• In contrast, many of the investments in grain related businesses in Canada have beenassociated with government interventions of various types. These have includedrehabilitating rural branch lines, port storage and handling, and federal and provincialgovernment hopper car purchases that today account for about 70 percent of the grainhopper car fleet.
• Prices generated in the marketplace have provided for sufficient returns at all stages of thesystem in the United States to encourage investments in response to market conditions.Through the 1980s and 1990s private investment in the U.S. system contrasts with thesubstantial public investment in the Canadian GHTS.
2.5. Summary
This comparison of the Canadian and U.S. GHTSs found that the differences between systemscarry a large economic cost for farmers and governments. These costs were estimated forSaskatchewan to have reached as high as one-half billion Canadian dollars annually in 1995 and 1996.Many of the system differences would seem to contravene the spirit of Canada-U.S. cooperation andfreer continental trade. In the years ahead, there will be growing pressure to harmonize the system andincrease delivery options at lower costs and increased value for all North American farmers.
According to a study, Parsons and Wilson (1999), the Canadian and U.S. GHTSs are basedon very different regulatory structures that understandably have different effects on system efficiency. Inwestern Canada, the closely controlled administered market offers higher costs and lower economicreturns to farmers, but also incorporates long standing equity objectives. In the United States,competitive regulation since the 1980s has delivered large efficiency gains throughout the GHTS thathave been reflected in higher prices for wheat and barley in North Dakota and Montana compared toSaskatchewan. Prairie farmers and the Canadian federal government must consider closely theadvantages and disadvantages of both systems.
17
3. Canadian Transportation Mechanisms and Issues
The Canadian rail system is dominated by two rail carriers: the CN and CP. CN, formerlyowned by the federal government, was privatized in 1995. Both carriers have major lines with an east-west configuration, facilitating shipments of grain from Prairie locations to Pacific ports (Vancouver orPrince Rupert) or the Great Lakes and St. Lawrence Seaway. The main CP lines are generally south ofthe CN lines in the Prairies. Both carriers also have rail lines or hauling rights in the United States. CP,through ownership of the former Soo Line, has lines through North Dakota, Minnesota, and Wisconsin,giving it direct access to major U.S. consumption points for malting barley and wheat. CN, throughownership of the former Illinois Central, moves western Canadian and U.S. grain to ports on the Gulf ofMexico and major U.S. consumption points. CN is also moving grain directly by rail into Mexico withits marketing alliance with KCS (Kansas City Southern) (Canadian National Railroad 2000).
In the 1980s, a number of important grain marketing events were initiated and the federalgovernment changed policy toward privatization and deregulation. The stabilization program affectingproduction and marketing is used for regulation and is involved with expenditure of public funds. TheCTA of 1996 made it possible for new short line railways to be formed (Baylis, Fulton, and Gray1998). However, these are in an early stage of development and do not diminish the relative importanceof CN and CP in grain transportation. Concerns about the market power of the two main carriers havebeen raised in discussions about the removal of rate caps.
3.1. Railroad
A. Rail Rate
While the NTA of 1987 and the CTA of 1996 deregulated most railway movements inCanada, western grains remained an exception. Rate caps apply for grain movements; these caps aregenerally cost-based and related to distance. The Canadian agricultural industry is heavily dependent onefficient rail service to compete in world markets. For grains, the long distances from the Prairies tomajor export ports and the bulky nature of the products give rail an inherent advantage over trucking.Although the average lengths of haul and rates for Canadian grain movement have decreased due toabandonment of branch lines during last several years, the average length of haul and rate are verysignificant factors in Canadian grain movement (Gravelines 1997). The 1998 average length of grainhaul is 958 miles and shipping cost is C$25.79 per ton (Table 9). The logistics environment has beenstrongly influenced by rail rate regulation dating back a century (Crow Rate) and centralized,government-controlled marketing. Canadian grain shippers have been treated differently than othershippers because of long distances to markets, the bulky nature, relatively low value of the product,absence of alternative modes of transportation such as barges in the Mississippi river system, widelydispersed shipping points, and presence of only one serving railway at many locations.

18
Table 9. Estimated Rail Transport Costs for Canadian Western Grain
YearAverage Length of Haul
(miles)Cost
(C$)/tonCost
(C¢)/mile
1992 1,023 31.50 3.079
1993 1,046 31.04 2.967
1994 1,012 29.28 2.893
1995 992 28.24 2.849
1996 971 27.25 2.806
1997 977 26.70 2.733
1998 958 25.79 2.692
Source: Canadian Transportation Agency, A Report on the Movement of Western Grain, 1999.
Changes in the WGTA increased rail shipping costs paid directly by shippers (previously, aportion was paid directly by the government of Canada to the railroads). The rail freight tariff regulation,which had governed the movement of all rail freight for more than a century, was repealed in 1988 andnow all movements in Canada, other than western grain, are based on rates established by contractsbetween the railway and the shipper. Western grain was regulated under the “Crow Rates” and laterthe WGTA. Since the WGTA was repealed in 1995, railway freight rates for western grain have beenregulated by tariff freight rates governed by a rate cap (Estey 1998b, 30).
“The rate cap is the maximum rate which may be recovered by the railway for grain movementsover 25-mile blocks and is used by the railways to develop freight rates for each of the possibleorigin/destination pairs on the western rail system” (Estey 1998b, 30). The rate cap applies to bothnon-Board grain and Board grain on all rail lines west of Armstrong, Ontario, excluding rail lines leadingto export destinations in the United States. The British Columbia Agricultural Council has drawnattention to the fact that while the rate cap applies to the transportation of feed grains to the exportmarket, it does not apply to the transportation of feed grain for Canadian domestic use.
Since the advent of the rate cap, freight rates for western grain have risen 9.3 percent as of the1997-98 crop year. These rates fell back slightly for the 1998-99 crop year (Estey1998b, 30). Freightrates to the western farmer are significant since transportation by rail is the largest single cost in theproduction, handling, and movement of grain to export ports. For example, in recent years railtransportation represented about 40 percent of all the costs of production, handling, and transportationof wheat from the farm to the offshore customers’ locations (Estey 1998b, 30).

19
B. Railcar Ownership
From 1972 to 1986, the Canadian federal government acquired 14,000 hopper cars for thegrain handling fleet in western Canada. During the same period, the CWB acquired, by purchase andlong-term lease, 4,000 hopper cars, and the provinces of Alberta and Saskatchewan acquired another2,000 cars for the same purpose. These cars are provided to the two railways, CN and CP, in aboutequal numbers and are used, with some exceptions, entirely for hauling grain. Since the cars areprovided to the railways without charge, the cost base of the current regulated rate scale does notreflect any allowance for the ownership cost of these cars (Estey 1998b, 27).
When the Canadian federal government announced in February of 1995 that the WGTA wasto be abolished, it was also announced that they intended to sell the fleet of 13,000 hopper cars thatthey had acquired over the previous two decades. Producer groups have indicated that the hopper carsshould be sold to them rather than to the railways. In March 1996, it was announced that the railcarswere available for sale. Any party purchasing the cars must make appropriate operating arrangementsbefore the party’s bid is considered. The purchasing group would be awarded a $0.75 per tonsurcharge on grain shipments by the car fleet for an indefinite time period to help offset the cost ofowning the cars, beginning with the 1998-99 crop year (Vercammen, Fultom, and Gray 1996.).
The sale of 13,000 hopper cars owned by the government of Canada raised ownership issuesin 1998: to whom should these cars be sold in the interest of efficient transportation service? Acoalition, owned and controlled by producers, had expressed an interest in purchasing these cars.Ownership of cars would allow producers to enter into policy discussions concerning the employmentof hopper cars. Other stakeholders have expressed their view that ownership of cars does not havemuch, if any, influence on the actual operations of the car allocation system. The desire to acquire thesecars is strongest among producer groups (Estey, 1998b).
Vercammen, Fultom, and Gray (1996) stated regarding car ownership by producers:
“Producers will benefit from car ownership if, as a result of their ownership, they are able tonegotiate lower freight rates for grain movements. This scenario has important implications if thecurrent freight cap is abolished as a result of the 1999 review of the current legislation. Theextent to which a producer railcar coalition would be effective when bargaining with therailways is highly uncertain.”

5This section is a survey of material contained in CWB (1998) Grain Matters, ZoneAllocation, and Car Allocation 1998-99.
20
C. Railcar Allocation5
Car allocation is important because there is a transportation capacity constraint during everycrop year. Usually in a deregulated system, rates are determined by demand and supply of railcars forgrain shipments. However, in the Canadian grain transportation system, non-price mechanisms allocatethe limited transportation services among those who demand them. Car allocation policies havechanged numerous times during the last few decades roughly as follows:
Pre-1969 Bulk allocation1969 Block shipping1976-77 Train run allocation1993-94 Space carsJune 1997 20% Performance allocationNovember 1997 25% Performance allocationSeptember 1998 Zone allocation
In September 1998, the CWB moved from a train run allocation system, based on handlingpercentage and performance, to a zone allocation system. Under the new system, the CWB allocates toa wider geographic area instead of allocating railcars to the grain companies along train tracks (CWB,October 1998).
In November 1995, the senior executive officers of the grain industry developed a proposal tosuggest that the CWB allocate railcar orders by zone rather than the train run program. In October1998, zone allocation replaced the previous train run allocation system. Under the old system, theCWB allocated its share of the total car supply to grain companies along one piece of train track,known as a train run. Under the zone allocation system, railcars are allocated to zones which are largergeographical areas comprised of 10 to 20 train runs (Figure 4). Within theses areas, the elevatorcompanies, not the CWB, decide which elevators will receive railcars for loading. The CWB retains itscritical role in transportation and still ensures the right grain gets to the right place at the right time tomeet sales requirements. Zone allocation is designed to provide the opportunity for system efficienciesresulting from direct allocations and reduced cycle times to be passed on to farmers through costreduction and incentives (CWB, Zone Allocation, 1998).

21
Figure 4. Canadian Railcar Allocation Zones by RailwaysSource: CWB, Car Allocation 1998-99, 1998.
In Canada, there are currently over 200 train runs. These train runs are grouped into 12 zones,7 on CN and 5 on CP. At the same time that industry moved to zone allocation, the railways assumedresponsibility for train run programming. This function has been traditionally performed by the CWBand involves combining all CWB and non-CWB orders into a finalized loading plan. Under railway trainrun programming, grain companies negotiate weekly rail service directly with the railways for bothCWB and non-CWB grains. With this change, grain companies and the railways have greater controlof their assets and the railways take greater responsibility for directional and other efficiencymovements. Figure 5 shows a graphical representation of the car allocation process.
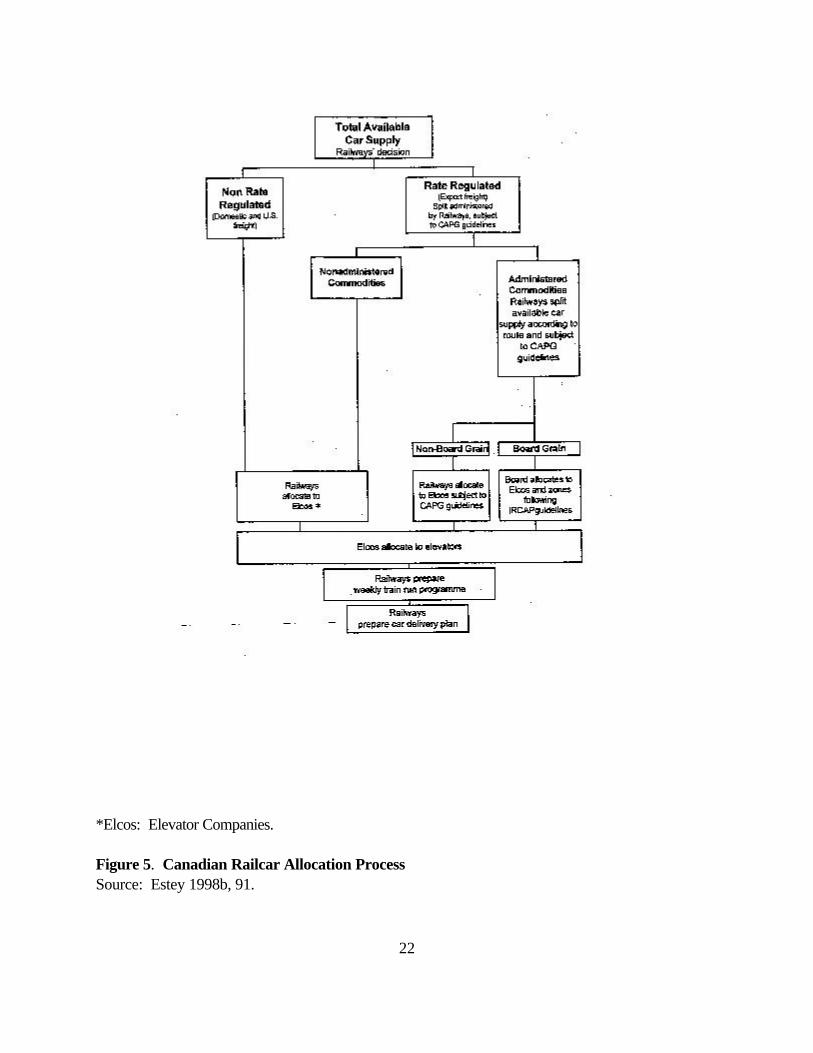
22
*Elcos: Elevator Companies.
Figure 5. Canadian Railcar Allocation ProcessSource: Estey 1998b, 91.

23
Rate(US $/bu)
Canadian Truck Rate
U.S. Truck Rate
Miles
3.2. Grain Trucking
Truck rates differ between Canada and the United States. Rate comparisons are shown inFigure 6. Canadian truck rates are higher than those in the United States for short and long hauls. Inrecent years, elevators have increasingly offered trucking premiums to attract farmers who want tooffset part of the cost of transporting grain by road. Elevators, using trucking premiums, can offerdifferent tariff rates to different farmers for the purpose of increasing their grain volume. This isaccomplished by targeting trucking premiums to farmers in some specific parts of their market area(Vercammen, Fultom, and Gray 1996). Farmers ship their grain by truck to specific locations tomaximize their net return. When grain companies offer competitive financial incentives to farmers todeliver grains to specific locations, companies, local elevators, and/or terminals can change therelationship between road and rail transportation as well as the distance over which trucks arecompetitive with railways. The growth in the Alberta feeding industry creates more demand for feedgrains with truck transportation. These factors affect the competition for grain handling in Canada.
Canadian Truck Rate = 0.096818 + 0.0020613 (Miles) U.S. Truck Rate = 0.0785172 + 0.0007561 (Miles)*In 1998 the average exchange rate between the United States and Canada was US$0.68 to C$1.00. To convert mt into bushels for malting barley, 48 lbs/bushel is used.
Figure 6. Truck Rates Comparison Between Canada and the United States Source: Canadian truck rate: Parsons 1998. U.S. truck rate: derived from industry sources.

6See Parsons (1998, 3-4) for a more detailed discussion and a trucking cost function.
24
Grain hauling farm trucks in Canada are larger than the older two axle, ten-ton farm truck. Thenewer hopper trucks travel further, pull large trailers, have more axles, and carry more grain. Manymajor grain companies offer trucking premiums to attract more grains to their company. The premiumshave ranged from C$2 per ton to as high as C$5 per ton, depending on grade, quality, and location andmarket conditions at specific times of the year. Figure 7 shows trucking has a cost advantage within112 miles against rail (before premium), and the distance can increase to 160 miles, 185 miles, and 235miles with C$2 per ton, C$3 per ton, and C$5 per ton trucking premiums, respectively (Parsons1998).6
Based on Canada’s current infrastructure, approximately 85 percent of grain delivery points arewithin 50 miles of a competing railway. It has been suggested that trucking premiums and a large scaletrucking program could move grain between CN and CP and even to the main east-west BNSF linewhich lies just south of the U.S. border (CGC, Industry Update, August 6, 1997). Large graincompanies have the ability to truck between competing railways. Thus, the grain company may act as acompetitive intermediary between the farmer and the railway.
Trucking between elevators within a single company has become a routine activity in order toaccess the multiple car loading efficiencies railways offer at some locations. Trucking is, therefore, apart of a large number of economic activities that have direct and indirect effects on the competitiveenvironment. Seven forms of competitive activity related to the markets for grain handling andtransportation in the Prairies were identified by Parsons (1998, 22-3):
• grain company trucking premiums;• access to more grain companies at delivery destinations;• access to more railways by farmers and grain companies;• lower railway incentive rates at high throughput locations with multiple car loading facilities;• access to U.S. railways and grain companies by trucking across the border;• grain company trucking between railways; and• delivering by truck to alternative uses for export grain within the Prairies.
Opportunities for cross-border arbitrage will be heavily influenced by changes in transportationrates. Direct cross-border shipping has become more feasible. It is performed by trucks and rail, withloading at handling facilities located near U.S. border points. This includes joint ventures betweenAlberta Pool and General Mills at Sweetgrass, Montana and the venture between SaskatchewanWheat Pool and General Mills at Northgate, North Dakota. In addition, the North American FreeTrade Agreement (NAFTA) is shifting grain trade from domestic to a transborder pattern. From 1992to 1994, Manitoba’s southbound truck movements have increased from 390 to 543 trucks daily. Thecommercial trucking sector is focusing on heavy and long haul movements almost exclusively

7Tandem trailers are the largest single type of truck configuration. These vehicles are usedpredominately for cross-border moves and for farm to elevator shipments. Respondents of the study byPrentice, Kosior, and McLeod (1996) indicated that they will increase the size of this fleet by 14 unitsin the next five years. The second largest group of truck configurations is the Super B Combo. Thesevehicles are used for long haul (greater than 200 kilometers) and often for elevator to elevatormovements. For configurations, see Appendix 1.
25
Price per Ton (C$)
Miles112 235
Truck Rate
Truck Rate with C$5 Trucking Premium
Rail Rate
T = 3.1 + 0.066XR = 7.5 + 0.062X
whereT = transportation cost of trucking in C$ per tonR = transportation cost of railway in C$ per tonX = distance of transportation in miles
Figure 7. The Canadian Rail and Trucking Rate FunctionsSource: Parsons 1998, 3-5.
by Super B and tri-axle combinations.7 Industry structure is shifting in favor of the larger intra and extraprovincial carriers that have an adequate fleet and backhaul to incorporate grain trucking in theiroperations. The commercial sector, which currently dominates the heavy and long haul market,anticipates a drop in all distance categories under 124 miles (200 kilometers) in favor of trips over 124miles. Commercial truckers foresee that an increasing proportion of agricultural hauls will originate atthe farmgate (Prentice, Kosior, and McLeod 1996, 38).

26
3.3. Grain Handling and Export Logistics
Canada’s GHTS was developed over the years as an administered system closely controlledby the federal government through national transportation legislation (currently the CTA and the CWBAct). The system consists of five main services that together move grain to export position. Theseservices are country collection, country elevation, long distance transport, terminal elevation, and porthandling. Table 2 and Figure 2, in section 1, describe the relevant regulations and structuralcharacteristics of the industry.
Government intervention has important effects on rates and quantities in the GHTS (Table 3).Before the early 1990s, the Canadian grain handling industry was largely dominated by Canadian pools,a few Canadian private firms, and Cargill which is the only major U.S. firm with Canadian handlingassets. Numerous pressures have emerged for structural change. As a result, Canadian firms and poolsare in a process of rationalization and confronting new competitors. Two major U.S. firms, ConAgraand ADM, have entered the industry, in addition to Louis Dreyfus, a major international grain firm.These changes will lead to greater handling capacity and efficiency, lower marginal costs, and moreintense competition for origination.
In addition to these changes, there have been notable structural changes in the Canadian grainprocessing sector. First, due to growth in the Alberta feeding industry, that province has gone frombeing a large feed surplus region to potentially and periodically a feed deficit region. Barley and lowquality wheat have been shipped from Saskatchewan to Alberta to meet demand for feed in theprovince. Feeds are also periodically shipped from the United States. In addition, ConAgra Grain hasannounced a proposed bio-fuel additive plant to be located in Alberta. The second important change isthat several of the major grain processing firms have been acquired by U.S. firms. Canada Malt (thelargest malting company in Canada, which also owns malt plants in the United States and elsewhere)was acquired by ConAgra Grain. In addition, several other Canadian malt plants have taken variousforms of U.S. firm ownership. Similar changes have occurred in the Canadian flour sector where ADMMilling Company (through acquisitions of Canadian-owned plants and, subsequently, a majoracquisition of plants owned by a joint venture between MapleLeaf Foods and ConAgra Grain) hasestablished the domineering position (Wilson 1998).
One of the more important differences between the United States and Canada is the structureof the grain handling sector. In general, Canada’s system is substantially more concentrated than that inthe Northern tier states. Table 4 summarizes these key differences in competitive structure. Even thoughthere have been some new entrants and expansions in capacity in recent years, the control ofincumbents will in fact increase in the future relative to past capacity shares. To some degree, theCanadian concentrated corporate structure is reinforced by the regulatory and administrative practicesin the Canadian GHTS.

8In 1998 the average exchange rate between the United States and Canada was US$0.68 toC$1.00. To convert mt into bushels for barley, 48 lbs/bushel is used.
27
A. Handling Costs and Cost Pooling
Marketing costs in Canada are substantially higher than those in the United States. Forcomparison, costs for various functions in each country are summarized in Table 6 (Parsons and Wilson1999).8 In the United States the cleaning costs are not charged directly to farmers. In Canada, cleaningcosts are charged on all Board grains, irrespective of whether it is cleaned or the level of dockage.
In Canada, costs of marketing Board grains are aggregated and deducted from total salerevenue. Practically, the pooling of costs is inseparable from the pooling of sale prices. Unlike in theUnited States, where values of grain adjust instantaneously to changes in sale prices and shipping costs,the pooling mechanism masks the values (costs and prospective returns) for individual transactions.Consequently, any costs associated with ‘inefficient’ grain movements are absorbed by Canadianproducers who sell through the CWB.
Historically, the Canadian GHTS has been shaped on the basis of the following criteria (CWB,August 1995):
• all farmers should have equal access to the market and the transportation system;• all farmers should receive the same price for the same type and grade of grain; and• all farmers should pay equal per mile rail costs regardless of where they are located or the
type of grain they ship.
This is clearly viewed as a problem in Canada–concerns about systemic inefficiencies underlie thecontroversy about whether the CWB should retain its single seller status. With losses on individualtransactions obscured through cost-averaging, it is harder to gauge the ‘fairness’ of Canadian saleprices. (For that matter, it is hard for Canadian producers to know the value of their grain in terms ofcurrent sale opportunities.) If marketing costs for Board grains are inflated, the effect may be toaccentuate the gap between U.S. and Canadian producer prices, creating greater incentive for cross-border arbitrage (Johnson 1998).
B. Cleaning Regulations and Practices
Commercial movements and cleaning of Prairie grains may be subject to three sets of CGCquality standards–commercially clean, export grade determinants, and primary grade determinants.When producers deliver grain into a primary elevator and when shippers deliver grain to terminals, theprimary grade determinants are applied to determine payment. When grain is exported (except to theUnited States, where apparently primary grade standards or buyer specifications may apply),commercially clean and export grades apply (Parsons and Wilson 1999).

9Cleaning Prairie grain is an expensive proposition. For example, in the new inland facilities thatare being constructed, the capital cost for all of the associated cleaning operation equipment can rangebetween $1.5 and $2.0 million. In contrast, a U.S. country elevator of comparable size, which does notneed to clean to the same export standard and does not recapture grains initially cleaned out asdockage, invests under $0.5 million in its cleaning equipment [Grain Cleaning Study Consortium(GCSC) 1998)].
10Much of this material is summarized from a recently completed study on Canadian graincleaning (GCSC 1998).
11Weighted average deductions from farmers for barley freight increased more than 100percent for all CWB grains between 1994-95 and 1995-96 crop years. For wheat, durum, and barley,weighted average deductions from farmers for freight increased from C$12.74, C$13.32, and C$12.60to C$31.38, C$29.10, and C$31.86, respectively (CWB, Statistical Tables, 1998).
28
Cleaning grain to the tight export standard requires very sophisticated and expensive cleaningequipment, as well as care in handling and loading clean grain. The export standards, and the level ofcleaning required to achieve them, are unique to Canada. Two major commercial competitors ofCanada, the United States and Australia, do not clean grain as intensively. The cleaning standard forexport in Canada is intended to provide an advantage for Canadian grain in world markets.9 Graincleaning at port terminal elevators can be characterized as having economies of size and scope due totheir extensive investment in grain cleaning and their ability to clean all grains and oilseeds delivered.Blending and producing more consistent composition of screenings are port advantages. As well, theseinvestments can be considered sunk costs. Since country cleaning operations are not designed to cleanevery ton to be exported, grain cleaning capacity will continue to be required at port terminallocations.10
Grain is cleaned for a variety of reasons, but principally to remove dockage to meet the exportstandards established by the CGC. Low dockage is a major selling point of the CWB export program.However, some non-CWB grains and some CWB shipments to the United States are not cleaned atthe export standard. One reason for cleaning at ports instead of inland is the economies of scale neededto efficiently operate grain cleaning and reclaiming equipment. The second reason is that the freight costof the dockage was not significant when rail freight subsidies were in place (Kraft 1997). However,there has been an increase in grain cleaning on the Prairies relative to cleaning grain at export terminalswhere, traditionally, most grain was cleaned for export. Freight rates on moving grain to ports are nolonger subsidized and the shipper cost of moving all grain to ports has increased significantly since thebeginning of the 1995 crop year.11 Freight savings on dockage movement are an incentive to clean on

12The GCSC study estimated that 66 HTPEs clean grain on the Prairies. Those 66 elevatorsclean around 4.2 million tons, or 13 percent of grain delivered into the transportation system. Another54 locations are planned to have grain cleaning equipment, which could result in an estimated 9.0 milliontons of grain cleaned inland, or 27 percent of current deliveries (GCSC 1998, 54-55).
29
the Prairies. In addition, grain companies have begun to construct new high throughput Prairie elevators(HTPE) which provide the scale of economies to clean grain down to export standards.12
Cleaning grain on the Prairies provides a greater margin than cleaning at port terminal locations.Table 10 shows wheat cleaning costs and returns for Canadian and U.S. elevators. There are twofundamental reasons for greater margins on the Prairies–the freight savings to inland locations byremoving dockage and the lower cost of labor at inland locations relative to the port terminal elevatorslocated in Vancouver and Thunder Bay. These cost savings outweigh the economies of scale advantagethat exists with port terminal elevators’ cleaning operations (GCSC 1998).
Table 10. Wheat or Barley Cleaning Costs and Returns for Canadian and U.S. Elevators
Costs Country Elevator Export Elevator
Canada U.S. Canada U.S.
--------------------------------US¢/bu-------------------------------
Fixed Costs 0.5 0.42 0.5 1.0
Variable CostsVariable costs of operationWheat lossTotal variable costs
1.03.64.6
1.31.42.7
2.14.36.4
1.62.33.9
Variable RevenueReclaimed wheat and feedScreeningsProducer paid cleaning feeWheat transportation savingsTotal additional revenue
2.92.46.71.5
13.5
0.02.60.02.45.0
4.63.46.70.0
14.7
0.02.30.00.02.3
Net Cleaning Margin 8.3 -1.9 7.8 -2.5
Source: GSSC 1998 and Scherping et al. 1992 for the United States.

30
C. Export Logistics
Canadian grains are shipped from farms to country elevators by farmer-owned trucks, with anaverage cost of $5 per ton. Grains are stored in country elevators, cleaned, weighed, graded, andeventually put into hopper cars on branch lines which are then hauled to main lines, where cars areassembled as a unit train which is sent to an export port. The CWB, as single-desk seller of westernCanadian wheat and barley, ships over 60 percent of grain but does not own elevator facilities. It relieson the grain companies and pools to fill orders and shares the same facilities with non-administered andnon-Board grains, such as rye, flax, oats, canola, feed wheat, and feed barley. Most storage is locatedon farms and is not part of the commercial supply channel. Commercial storage at primary elevatorsand export terminals is limited compared to other competitors in international grain markets (Parsonsand Wilson 1999).
The Canadian logistics system strives to operate on a ‘just-in-time’ basis. This system requiresclose cooperation among buyers, suppliers, and transportation providers; reliable rail service; efficientstock management at port terminals; and timely vessel arrivals. The smooth interaction of these factorsis critical (Denham 1997). The sale starts with chartering a vessel, usually specifying a 30-day arrivalwindow. For most CWB sales, the buyer (or its agent) arranges the ocean transportation (i.e., the saleis FOB port). For non-Board shipments, the seller (grain company) usually charters the vessel anddeals directly with the customer to tailor transportation to final destination. For both Board and non-Board sales, the logistics process is geared toward meeting the vessel’s scheduled arrival date(WESTAC 1998).
Problems at ports include congestion of the system. It is important to bring the right grain intoand through the system when it is needed. Clogging the system with “unneeded” grains can quicklyreduce the efficiency of port operation (Transport Canada 1999 and Wilson, Dahl, and Carlson 1998).In the grain industry, the Canadian philosophy has been to get the grain to the ocean terminals when theship comes in. In many cases it is not the right grain, so a ship may have to be re-berthed an average of3 times before it gets the 40,000 tons of grain. The current system for moving grain in western Canadais not designed to be efficient or customer focused. After hopper cars are hauled to Vancouver, theyare often switched several times to get to the right company’s terminal. After switching, it may be foundthat they still do not have the right blend of grain in the terminal for the ships that are arriving. Theaverage ship re-berths 3 times at a cost of $10,000 per berth, or $0.75 per ton (Denham 1997). In1996, the average vessel waiting time at port in Vancouver was 12 days, while it was 4 days in theU.S. Gulf (Table 5).
4. Rationalization and Current Policy Issues in Canada
Substantial volumes of grains are produced each year across the Canadian Prairies andtransported to numerous domestic and foreign destinations. In this environment, the GHTS is importantto maximize system efficiency, competitiveness, satisfaction, and capacity utilization for grain producers,shippers, and carriers. To improve efficiency, rationalization of the system is underway in the CanadianGHTS. The rationalization of primary elevators and abandonment of railroad branch lines are closely

13Western Canadian grain producers need an efficient and reliable GHTS because each yearthey export an average of 30 million tons of grain, valued at C$6 billion.
31
related. Many high throughput elevators have been built and the number of inefficient elevators hasdecreased. Rail branch lines and short lines have been abandoned as a consequence of the decreasingnumber of elevators. Abandonment of rail branch lines and short lines leads to increased trucking.
Recently, Canada has moved towards deregulating its grain transportation system. OnDecember 21, 1998, after a one-year intensive review, the final Estey Report to the Canadian Ministerof Transport was released to the public. The final report asks one central question: What alterations,additions, reductions, or other organic changes are required (if any) in the present administrative andcommercial regulations of the grain industry, in order to strengthen and enhance the position of Canadain the global grain market? In the final report, every single issue is comprehensively discussed and 15important policy implementations are recommended.
Ending grain transportation subsidies and deregulating railways have been forcing the CanadianGHTS to improve efficiency and to raise policy issues such as rail deregulation, trucking, and portbuying. Recommendations from the Estey Report range from policies to potential efficiency gains. Notall are discussed here. However, there are three of particular importance to the North American graintrade. These include the prospective effects of rail rate deregulation, trucking, and port buying.
4.1. Reform Package (http://www.tc.gc.ca/releases/nat/00_h034e.htm)
The GHTS in Canada is currently under reform. On May 10, 2000, Canadian Transportannounced the government’s intention to introduce measures to increase efficiency and cut costs inCanada’s GHTS. The reforms were implemented on August 1, 2000, and include:
• the establishment of a revenue cap that provides for an annual estimated $178 millionreduction in railway revenues, which represents an estimated 18 percent reduction in grainfreight rates from 2000/2001 levels;
• the phasing in of CWB tendering for logistical services for grain shipments through the portsof Vancouver, Prince Rupert, Thunder Bay, and Churchill, from at least 25 percent of theirvolume in 2000/2001 to a minimum of 50 percent in 2002/2003; and
• amendments to the CTA to facilitate the transfer of branch lines to community-based shortlines and to simplify the Final Offer Arbitration process (http://www.tc.gc.ca/).
The government of Canada is trying to create a more efficient, accountable, and competitiveGHTS that will cut costs for western Canadian grain producers.13 The decision is based on both theEstey and Kroeger Reports confirming that changes are required in the GHTS. These changes aredesigned after balancing the interests of various stakeholders and ensure that producers can deliver theirproducts at a reasonable cost and efficiently to port (http://www.tc.gc.ca/).

32
The reform package contains six main components:
1. Replacement of the current maximum railway rate scale with a cap on annual railwayrevenues from grain;
2. Funding for Prairie grain roads;
3. Creation of a more commercial and competitive system for moving grain from countryelevators to ports, which will be achieved through the expansion of tendering for CWBshipments to port;
4. Improvements to the Final Offer Arbitration (FOA) provisions of the CTA;
5. Improvements to the branch line rationalization process; and
6. Continuous monitoring and reporting by an independent private-sector third party to assessthe impact of these changes.
A. Revenue Cap and Rate Cap
Effective August 1, 2000, an annual cap on the revenues that can be earned by CN and CPrailways from grain traffic have replaced the old rate cap. The revenue cap will allow the railways moreflexibility in negotiating freight rates and service packages. The revenue cap for crop year 2000/2001 isset at $27.00 per ton for the two railways combined. This cap represents a reduction of $5.92 per ton,or 18 percent from the estimated effective rate of $32.92 per ton for 2000/2001, which results in anestimated $178 million reduction in railway revenues for a typical 30-million ton annual movement.
Under the revenue cap, railways will have flexibility to vary individual rates to reflect efficiencyand offer more innovative service. Compliance will be monitored by the Canadian TransportationAgency, based on actual grain movements and distance hauled. Any railway earnings in excess of thecap will be repaid with a penalty. The revenue cap will be adjusted annually to reflect inflation starting in2001/2002. Additionally, tariff rates for single car movements originating on branch lines will not beallowed to exceed main line tariff rates for similar movements by more than 3 percent.

33
B. Grain Roads
The Government of Canada recognizes that grain handling and transportation reforms willincrease pressures on rural roads and, in consequence, is prepared to make a contribution of $175million over five years to help address this problem.
C. Grain Handling and Transportation Logistics
The CWB role in the GHTS will be modified. The CWB will operate through contractualarrangements with the railways, grain companies, and farmers. The CWB will also have the ability tonegotiate overall car supply requirements with the railways to move the entire volume of its business toport. However, for the portion of its business that is tendered, the CWB will contract with the graincompanies, who will in turn contract with other parties for transportation and other services.
The CWB will tender the logistics of at least 25 percent of its wheat and barley shipments to theports of Vancouver, Prince Rupert, Thunder Bay, and Churchill in crop years 2000/2001 and2001/2002, and at least 50 percent of its shipments to the four ports in crop year 2002/2003.
For non-tendered grain shipments, the industry and the CWB will determine how railcar supplywill be allocated among shippers. Should circumstances arise where the CWB feels compelled to useits regulatory car allocation powers to fulfill its mandate, it will provide prior public notice and makepublic an impact analysis of its use of the power.
The details for implementing these new elements will be confirmed in a Memorandum ofUnderstanding between the Minister responsible for the CWB and the CWB prior to enforcement ofthe legislative amendments.
D. Safeguards
The government will modify existing Final Offer Arbitration (FOA) provisions contained in theCTA as follows:
The FOA provisions will be modified to address a long-standing complaint from the shippercommunity that the process is too long and expensive. FOA will have a simultaneous offerstructure with a summary process for disputes under $750,000.
Amendments to the Act will permit a shipper to exclude references to the proposed rates wheninitially submitting a matter for FOA. After ten days, the shipper and the railway will exchangetheir final offers, including rates.
Parties involved in arbitration for freight charges which will total less than $750,000 can elect touse a simplified FOA mechanism. In this faster process, the time between the shipper filing the

34
initial submission and the final decision will not exceed 30 days. At the request of the shipper —or for arbitration of disputes above $750,000 — the existing 60-day process will be followed.
The establishment of a three-person panel — only if both parties agree — will provide anopportunity for a larger panel to hear more complex disputes.
The issue of more open access to rail lines is being referred to the upcoming review of theCTA. Effective ways to enhance competition in the railway sector, including enhanced running rights,regional railways, and other access concepts, will be given priority consideration. An interim report onthis issue will be given within the first six months of work.
E. Branch Lines
Provisions for branch lines will be enhanced to further facilitate transfer of grain dependentbranch lines to community-based short lines. Measures will be put in place for railways to providetransitional compensation of $10,000 per mile annually for three years, to affectedmunicipalities/counties/communities when a grain line is closed.
When a railway transfers a grain line segment, the railway will be required to operate theremaining part of the branch line for three years. To discourage "de-marketing" of grain lines (i.e.,purposefully deferring maintenance or lowering service levels to make the line uneconomical) the agencywill be able to:
• order the company to improve services on the grain line; • grant running rights to another party; and • require the railway to identify the grain line for discontinuance in their three-year plan.
F. Monitoring
As part of its policy decision on grain handling and transportation, the government of Canadawill establish a mechanism of continuous monitoring, measurement, and reporting to provide informationto the Minister of Transport, the Minister of Agriculture and Agri-Food, the Minister responsible for theCWB, and other interested parties on the impact of these reforms and the overall performance of thereformed GHTS. Should any problems or opportunities for improvement be identified, the governmentwill be in a position to act.
This mechanism will be put in place by an independent, private sector third party who willassess the following factors:
• the benefits to farmers;• whether the CWB marketing mandate is adversely affected;• the effect on grain handling efficiency;• the effect on railway efficiency;• the effect on port efficiency for grain; and• the overall performance of the GHTS.
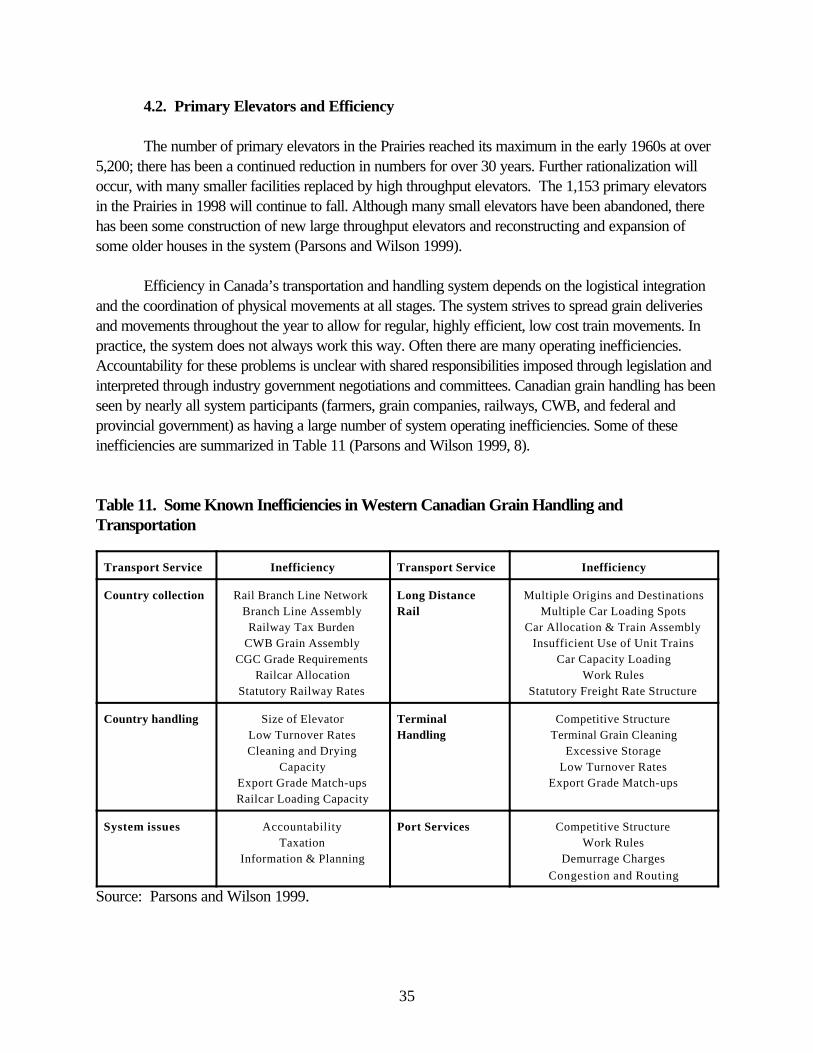
35
4.2. Primary Elevators and Efficiency
The number of primary elevators in the Prairies reached its maximum in the early 1960s at over5,200; there has been a continued reduction in numbers for over 30 years. Further rationalization willoccur, with many smaller facilities replaced by high throughput elevators. The 1,153 primary elevatorsin the Prairies in 1998 will continue to fall. Although many small elevators have been abandoned, therehas been some construction of new large throughput elevators and reconstructing and expansion ofsome older houses in the system (Parsons and Wilson 1999).
Efficiency in Canada’s transportation and handling system depends on the logistical integrationand the coordination of physical movements at all stages. The system strives to spread grain deliveriesand movements throughout the year to allow for regular, highly efficient, low cost train movements. Inpractice, the system does not always work this way. Often there are many operating inefficiencies.Accountability for these problems is unclear with shared responsibilities imposed through legislation andinterpreted through industry government negotiations and committees. Canadian grain handling has beenseen by nearly all system participants (farmers, grain companies, railways, CWB, and federal andprovincial government) as having a large number of system operating inefficiencies. Some of theseinefficiencies are summarized in Table 11 (Parsons and Wilson 1999, 8).
Table 11. Some Known Inefficiencies in Western Canadian Grain Handling andTransportation
Transport Service Inefficiency Transport Service Inefficiency
Country collection Rail Branch Line Network Branch Line AssemblyRailway Tax Burden
CWB Grain AssemblyCGC Grade Requirements
Railcar AllocationStatutory Railway Rates
Long DistanceRail
Multiple Origins and DestinationsMultiple Car Loading Spots
Car Allocation & Train AssemblyInsufficient Use of Unit Trains
Car Capacity LoadingWork Rules
Statutory Freight Rate Structure
Country handling Size of ElevatorLow Turnover RatesCleaning and Drying
CapacityExport Grade Match-upsRailcar Loading Capacity
TerminalHandling
Competitive StructureTerminal Grain Cleaning
Excessive StorageLow Turnover Rates
Export Grade Match-ups
System issues AccountabilityTaxation
Information & Planning
Port Services Competitive StructureWork Rules
Demurrage ChargesCongestion and Routing
Source: Parsons and Wilson 1999.

36
4.3. Railroad and Trucking
A. Abandonment of Rail Branch and Short Lines
As the grain collection system moves toward a network of high throughput elevators, thenumber of small country elevators decreases and branch lines and short lines that once served them areabandoned. Closing small country elevators and abandoning branch lines and short lines cause heavytraffic of grain trucks on highways and country road systems. Canadian railway legislation hasprovisions for the abandonment of rail branch lines, as described by the Estey Report 1998a, 10:
“The railways have, in various ways, described the future rail system as consisting of highquality mainline and secondary mainline service. The producers and other interested partiestake the view that in order to dispose of a branch line, the railway should be required to offer itto potential buyers as a complete branch line unit rather than breaking it up and offering theassets on a piecemeal basis. The issue is whether the expressed desires and plans for therailway lines that are said to be uneconomic are consistent with present legislation and thegreater national interest in establishing and maintaining a comprehensive and healthy railnetwork. It is further questioned whether the interests of the producer and the community whichare served by these lines are adequately protected in the event of closure under presentlegislation.”
“Some producer associations state that the entire question of closure of rail lines which serve acaptive community should be fully examined by an appropriate authority as a forerunner ofestablishing standards and procedures. Some stakeholders state that a modern moratoriumshould be established by Parliament pending a comprehensive study of railway lines exposed tothe disposal program of railways. Some farmers and other interested parties advocate acontribution from the railways recognizing that the community, through its government, hasrelieved the railroads of their admitted financial burden in taking over the branch line.”
When a line does not make enough profit, it is identified as a candidate for closure or transfer.To minimize rail line abandonment or closure, which generates a negative impact on the communitiesserved, the CTA requires an obligation advertising the line for sale and negotiating with potential buyers.The CTA anticipates that such negotiations are successful and the lines are transferred to short lineoperators. It is recommended that the community be given the opportunity to acquire the branch linesas a complete unit and permit the buyer to operate the line as a short line railway (Estey 1998b).
B. Rail Deregulation
The WGTA was ended in 1995. The federal government of Canada had investigated a reviewof grain transportation and handling in 1998, which may result in further changes to the CanadianGHTS. In 1995, the Canadian government ended the WGTA subsidy because of budgetconsiderations and the need to comply with the GATT/WTO agreement. The WGTA and NTA weremerged to create the CTA. The CTA marks the end of special regulatory treatment of grain and moves
37
toward the deregulated environment faced by other bulk commodities. Since the CTA still contains anumber of regulations pertaining to grain movement, it is an attempt to adopt market mechanisms fordetermining freight rates, while allowing some government interventions over interswitching competitiveline rates (CLRs) and FOA.
The CTA establishes a maximum rate scale annually from which the railways develop tariff ratesfor the movement of western grain. The railways advocate the removal of the rate cap, leaving theestablishment of appropriate rates to the market place as is the case now in all other classes of freight.However, there is not universal support for this view among the other stakeholders. Farmers and graincompanies are concerned that without genuine competition between railways, freight rates will becomeexorbitant, thereby threatening the existence of the grain industry in the Prairies. Those who favor therate cap believe that it should remain in effect at least until an appropriate substitute has beenestablished by legislation. Under the CTA, increases in grain freight rates are still limited, but the futureof this cap is uncertain. If removal of the freight rate cap occurs, it is expected that the railways’ marketpower will increase the freight rates for grain.
In Canada, farmers have little bargaining power with the railroads, as described by Estey1998a, 13:
“Another important issue concerning rail rates is the total absence of the farmer from the rate-setting process. The farmer has no input in the freight rate negotiations between the railwaysand the CWB, or between the railways and grain companies, for the movement of his/her grain.Yet, those costs are borne by the farmer through deductions from his/her grain ticket. Under thecurrent system the farmer has no status to challenge those rates. The issue, therefore, is whatprocess should be established in order to protect the interests of the farmer in ensuring thatfreight rate reductions and savings are passed on to him/her.”
However, to counter this and provide an inducement, the CP proposed a repeal of the rate capin exchange for a guaranteed freight revenue reduction. “The effect of this proposal was modifiedsomewhat to assure the reduction of freight costs, en bloc, by C$6.66 million per annum for six years.The guarantee is for annual savings to the shipper amounting to C$40 million in six years or by 2005 ifthe rate cap is removed in 1999 ” (Estey 1998b, 32). Discussions with respect to the proposal tookplace a few days before the final report was submitted.
C. Trucking
Some stakeholders are concerned that branch line closures and elevator consolidations areaffecting farmers and governments. This raises the question as to whether the use of larger trucks tohaul grain greater distances from the farmer to the elevator (a) has raised the cost of trucking to thefarmer, and (b) has had a significant impact on the burden of road repair, particularly in the case of thegrid roads in western Canada. The issue also arises in paved highways installed and maintained by theprovinces which are not up to structural highway specifications (Estey 1998b).
38
Major railway rationalization will occur and the number of elevators is likely to drop over thenext few years. Grain will be transferred from rail to an already overburdened road system becausethousands of kilometers of Canadian branch lines will be lost. For certain regions, it is less expensive forproducers to truck grain more than a hundred kilometers than by rail (Harrison 2000). Much of this isdue to the long winding routes to get back to the main line. Producers moving grain ever further bytruck do not face the direct cost of road maintenance and upgrading. For this reason trucks lookinexpensive compared to rail. Economic incentives for using trucks are good news for producers, butthey also have negative impacts on the road.
4.4. Port Buying
The recent McKinsey report claims that the Canadian logistics system for Board grains iscurrently under-performing relative to requirements of customers and the needs of farmers. The reportsuggested that the Board could withdraw and allow grain handlers to manage the logistics system fromfarm to port as agents. The coordinating role of the CWB is seen as inefficient (McKinsey 1998 andCarter, Loyns, and Berwald 1998) and the role has been drawn into question in the recent EsteyReport with suggestions that the CWB become a port buyer.
At the present time, the CWB has virtual control over Board grains and has some influence onthe non-Board grain system because of car allocation and other functions. A proposal has beenadvanced by some stakeholders which would remove the CWB from any and all activities fromfarmgate to the port of export. This would leave grain companies and railways responsible for alloperational issues; some grain companies support this proposed solution. The Western provincesidentified the role of the CWB in transportation planning as an important issue and suggested that thefuture role of the CWB be driven by a goal of maximizing producer benefits (Estey 1998b).
However, the CWB has indicated the Board could not effectively function as a single-deskmarketer and provide its core service to farmers if the Board were buying at port. They have suggestedthat confining the CWB to port would cost farmers more by increasing costs, increasing risk, andreducing their ability to react to customer requirements (CWB, Efficiencies Resulting from theCWB’s Role in Transportation, 1998, 2). As expected, there are numerous details yet to be workedout if/when a port buying system is adopted. An important implication for U.S. grain is that all of thefocus of these deliberations has been on mechanisms to guide port buying for off-shore sales. Yet to bedefined is how such a mechanism would operate for trade within North America, including both saleswithin Canada and those made to the United States.
14For example, they may expect to realize large cost savings for unit train shipments after railrates are deregulated. At present, the rate differentials for multiple car shipments are much smaller inCanada than in the United States.
39
5. Implications for Grain Trade
There has been considerable pressure for changes in Canada’s GHTS. Some industry trends,such as the rationalization of elevators in the Prairies and investments in new high throughput facilities,are being driven by market and competitive forces and, to some extent, by anticipated changes in theregulatory environment. These changes may have a significant impact on cross-border grain flows.There are also a number of proposed policy changes, including elimination of the caps on rail rates,deregulation of car allocation, and port buying by the CWB, which may or may not take effect. In thissection, we highlight some of the important issues and indicate how they may affect grain trade andcross-border competition.
5.1. Changes in Grain Handling
Perhaps the biggest story in western Canadian grain handling is the rapid adoption of highthroughput interior elevators in the Prairies. The new facilities are positioned to take advantage ofanticipated deregulated rail rates.14 The rapid adoption of high throughput interior elevators reflects anacceleration of ongoing pressures for industry rationalization. Rationalization will result in fewer butlarger elevators—similar to what has occurred in the United States. Near term, there is likely to beexcess handling capacity in the Prairies, particularly relative to export capacity on the West Coast.Excess capacity will tend to reduce handling costs and charges, while the limited export capacity andhigh throughput facilities (e.g., in cleaning and segregation) will cause more direct shipments frominterior locations to U.S. destinations.
The new high throughput elevators will be able to assemble large volumes of grain for shipmentby unit train. Combined with procurement advantages of the Board system, this system will providedirect grain movements from a single point of origin to various end users. Note that this is in contrast tothe past practices of shipping grain from multiple origins via single cars to Thunder Bay for cleaning,segregation, and reshipment to the United States. Reduced handling costs could make it somewhatmore attractive for grain to enter the Board marketing system instead of shipping to export ports. Thatwould be consistent with simulation results reported in Johnson (1999). In an earlier study, Johnson andWilson (1994) also showed that reductions in Canadian handling costs would induce larger flows ofCanadian barley into the Canadian commercial handling system and shipments to U.S. markets.
5.2. Reciprocal Access to Marketing Functions
Several Canadian grain marketing functions are discriminatory with respect to country of origin.These include: 1) access to the lower regulated rail rates; 2) access to railcars, in terms of bothownership and control (through allocation procedures); 3) CGC regulations governing inbound grain(i.e., testing and segregation); and 4) access to the CWB marketing mechanism. In contrast, functions

15These issues and legislative/regulation authority are described in Wilson and Dahl (1998).
16Appendix 2 is the application form for the State of Origin Certificate for In-Transit GrainShipments.
17“Karnal bunt is a fungal disease of wheat first found in the United States in March 1996, whenit was discovered in Arizona. Since then, the U.S. Department of Agriculture has also regulated limitedareas of California, New Mexico, and Texas. Although Karnal bunt does not pose a significant croploss threat to U.S. wheat producers, it is a disease of significance when grain moves in internationalmarkets” (http://www.aphis.usda.gov).
40
performed in the U.S. marketing system are non-discriminatory with respect to the origin of grain. In theUnited States, railroads are common carriers and licensed elevators are public warehouses; as such,they must offer the same services to all customers.15
Reciprocal access is the issue developed recently under the December 1998 Record ofUnderstanding with Canada. In the near term it will be dominated by issues related to end usecertification and the cross-border trials. However, longer term, it will likely center on rail transportation.If the rate cap is retained and U.S. growers are denied access, Canadian grain will continue to enjoy ashipping advantage to ports. Not having the ability to ship through Canada also prevents U.S. growersfrom developing countervailing market power against northern tier railroads.
The CWB and Canadian trade authorities are sure to argue for retention of the policies andunique regulations favoring their farmers and industries. Issues connected with grain quality mayprovide a pretext for discriminatory treatment, but the rail issue is probably much more significant. IfCanadian authorities were to allow U.S. grains to be shipped through their system at non-discriminatoryrates, they would have to: 1) eliminate the rate cap legislation; and 2) dispose of railcars and end thefavorable treatment given Canadian shippers.
A. U.S. Grains Through Canadian Railroads
In August 1998, U.S. officials and representatives of CP requested that the Canadian FoodInspection Agency (CFIA) review their requirements regarding in-transit rail movement of grain throughwestern Canada. After consultation with concerned parties, the CFIA simplified handling requirementsfor U.S. grain by accepting a certificate of origin16 (Appendix 3) instead of a Phytosanitary Certificate(with declarations for freedom from dwarf bunt, flag smut, and Karnal bunt17) for grain that meets all ofthe following conditions (http://www.cfia-acia.agr.ca/):

41
• the grain originates in U.S. approved areas (Minnesota, Montana, and North Dakota);• the grain will transit through Canada only by rail (in sealed hopper car);• the grain will return to the United States; and• the grain will not be unloaded in Canada.
On December 3, 1998, the United States and Canada entered into an agreement to resolvelongstanding agricultural trade issues including grain trade and animal trade. In-transit movement of U.S.grain through Canadian rail, the U.S. wheat access to Canadian facilitation, Karnal bunt, and exchangeof grain trade information are major items that benefit U.S. producers in grain trade. Effective January1, 1999, Canada has implemented the program that gives U.S. shippers and producers of U.S. wheat,barley, oats, and rye a new option. Under the program, U.S. producers and shippers have bettertransportation access to final West Coast destinations in the United States, which could result in morecompetitive rail rates for grain shipments from the Northern Plains to the West Coast ports.
Under the Record of Understanding with Canada, U.S. wheat and barley may be shippedin-transit through Canada with a certificate of origin. Table 12 shows the amount of wheat and barleyflow through the in-transit program. The in-transit rail program reduces the need for phytosanitarytesting of the grain and permits a more timely and cost efficient shipping schedule. This program allowsU.S. shippers to ship the selected agricultural commodities to final West Coast destinations in theUnited States through the Canadian rail system. According to state officials, in-transit certificates hadbeen issued for the movement of more than 1,580 million and 1,420 million pounds of grain in 1999and 2000, respectively. However, U.S. exporters and Canadian railroads would like to expand thisprogram to the port of Vancouver (USDA/FAS, http://www.fas.usda.gov/itp/us-canada.html).
Table 12. U.S. Grain Through Canada In-transit Program
1999 2000
--------------- lbs --------------
North DakotaBarleyWheat
447,204,583777,557,442
As of October300,694,611664,710,847
MinnesotaBarleyWheat
212,689,487 27,730,749
As of August 58,934,922172,983,880
MontanaBarleyWheat
2,912,102113,503,600
As of November 1,060,000221,792,813
Total 1,581,597,963 1,420,177,073
* For comparison purposes, in calendar 1998 in-transit from North Dakota was: wheat 82,749,000 lbs, barley 315,000,000 lbs, for a total of 397,745,000 lbs (180,415 tons).Source: Departments of Agriculture in North Dakota, Minnesota, and Montana.
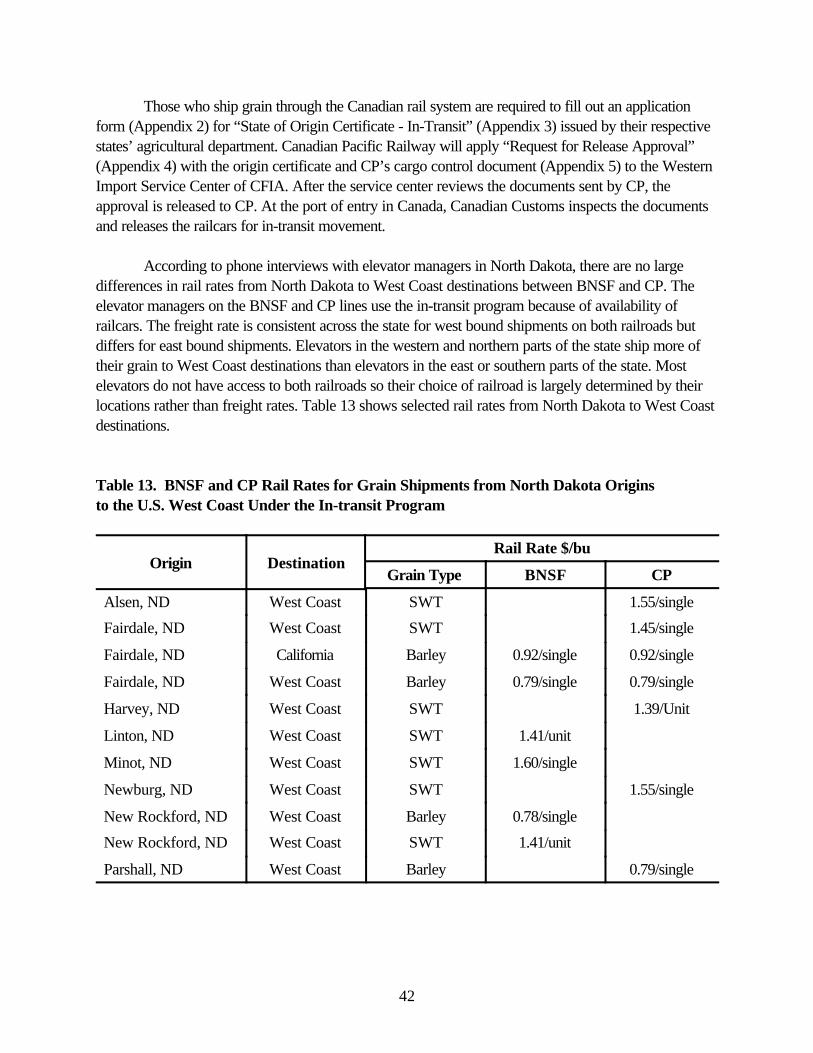
42
Those who ship grain through the Canadian rail system are required to fill out an applicationform (Appendix 2) for “State of Origin Certificate - In-Transit” (Appendix 3) issued by their respectivestates’ agricultural department. Canadian Pacific Railway will apply “Request for Release Approval”(Appendix 4) with the origin certificate and CP’s cargo control document (Appendix 5) to the WesternImport Service Center of CFIA. After the service center reviews the documents sent by CP, theapproval is released to CP. At the port of entry in Canada, Canadian Customs inspects the documentsand releases the railcars for in-transit movement.
According to phone interviews with elevator managers in North Dakota, there are no largedifferences in rail rates from North Dakota to West Coast destinations between BNSF and CP. Theelevator managers on the BNSF and CP lines use the in-transit program because of availability ofrailcars. The freight rate is consistent across the state for west bound shipments on both railroads butdiffers for east bound shipments. Elevators in the western and northern parts of the state ship more oftheir grain to West Coast destinations than elevators in the east or southern parts of the state. Mostelevators do not have access to both railroads so their choice of railroad is largely determined by theirlocations rather than freight rates. Table 13 shows selected rail rates from North Dakota to West Coastdestinations.
Table 13. BNSF and CP Rail Rates for Grain Shipments from North Dakota Originsto the U.S. West Coast Under the In-transit Program
Origin DestinationRail Rate $/bu
Grain Type BNSF CP
Alsen, ND West Coast SWT 1.55/single
Fairdale, ND West Coast SWT 1.45/single
Fairdale, ND California Barley 0.92/single 0.92/single
Fairdale, ND West Coast Barley 0.79/single 0.79/single
Harvey, ND West Coast SWT 1.39/Unit
Linton, ND West Coast SWT 1.41/unit
Minot, ND West Coast SWT 1.60/single
Newburg, ND West Coast SWT 1.55/single
New Rockford, ND West Coast Barley 0.78/single
New Rockford, ND West Coast SWT 1.41/unit
Parshall, ND West Coast Barley 0.79/single

18Montana and North Dakota growers must ensure that the wheat originates from an area thathas been officially surveyed for karnal bunt and where flag smut and dwarf bunt are not known tooccur. Information on these areas and other information may be obtained from the state departments ofagriculture in North Dakota and Montana.
19The cargo control document for WAFP will be prepared by the trucking companytransporting U.S. grain to Canada; it will be similar to Appendix 5 in style and contents.
43
B. Cross Border Grain Movement: The Canadian Wheat Access Facilitation Program
Access to Canadian primary elevators is vital for U.S. producers to enhance opportunities forgrain sales to Canada. The Canadian Wheat Access Facilitation Program (WAFP 1998) is to improveaccess for U.S. grain producers and other sellers to the grain handling and consumption system inCanada. WAFP establishes rules for producers and sellers of wheat produced in eligible states in theUnited States (currently Montana and North Dakota) who want to move wheat by truck directly towestern Canadian country elevators for resale or transhipment. Under the program, a seller must obtaina phytosanitary certificate18 for his/her wheat, arrange for its sale to a participating Canadian countryelevator, and ship wheat to the Canadian border. Following completion of the normal Customsrequirements, wheat is delivered to the elevator in Canada (http://www.fas.usda.gov/info/factsheets/).
Wheat producers from approved areas in Montana and North Dakota or grain handlers ofwheat produced in those areas could benefit from WAFP. The producers and handlers can sell anddeliver wheat directly to participating Canadian country elevators (Appendix 6) by truck for storageand forwarding to the Canadian domestic market or export location. A producer selling his/her wheatdirectly to a Canadian elevator needs to obtain a phytosanitary certificate which includes the following:“The grain originated in an area free from TILLITIA INDICA (karnal bunt) on the basis of officialsurveys, The grain is free from spores of TILLICIA INDICA (karnal bunt) on the basis of officiallaboratory testing,” and “The grain originated in an area free from TILLETIA CONTROVERSA(dwarf bunt) and UROCYSTIS AGROPYRI (flag smut).”
The Canadian Grain Commission (CGC) has issued licenses to primary elevator facilities tohandle U.S. wheat, subject to WAFP participation and adherence to the requirements. Currently, 5grain companies have proposed a total of 27 facilities, most of which are located within 60 miles of theU.S.-Canada border, for the program. Prospective U.S. wheat producers or other sellers negotiatesales contracts with Canadian buyers covering price, quantity, quality, delivery, currency of payment,and other terms. Before admitting the wheat into Canada, Canadian Customs officers will verify thefollowing documents:
• Canada Customs Form B3 (Appendix 7) for the identification of goods being imported;• a Canada Customs or commercial invoice form (Appendix 8);• a Cargo Control Document or manifest19 in a format acceptable to Canadian Customs;

20The CGC requires maintaining the integrity of Canada’s grain quality control system, (i.e.,prevent commingling of U.S. and Canadian wheat) for Canadian licensed primary elevators handlingwheat from the United States.
21Appendix 10 is the application form for Phytosanitary Certificate for Export.
44
• the CGC Importer Declaration20 (Appendix 9); and• a copy of a USDA phytosanitary certificate21 (Appendix 11).
In addition to these required documents, there are more complicated and cumbersomerequirements that can be trade barriers in the Canadian regulation of the program, “Memorandum to theCanadian Trade Licensed Primary Elevators Handling U.S. Wheat.” The CGC requires the importingcompanies in Canada to arrange for a CGC representative to be at the elevator at the time of deliveryto monitor the unloading of the grain, to take a sample for information purposes, and to ensure that theelevator follows the procedures and that U.S. and Canadian wheat are not commingled. The followingare CGC requirements to import U.S. wheat:
• “Primary elevator facilities are required to notify the CGC’s Prairie Region Office of theupcoming arrival of U.S. wheat at least 24 hours in advance to ensure that a CGCemployee/designate is on site when the wheat is unloaded. Upon unload, the CGC will takea sample for information purposes and will monitor the flow of the U.S. wheat into thebin(s). The CGC employee/designate will seal the bin(s) to ensure that the U.S. wheat isidentity preserved..” (http://www.cgc.ca/views/tradenotices/uswheat99-e.htm)
• “When facilities are ready to discharge U.S. wheat, they must contact the CGC’s PrairieRegion Office, at least 24 hours in advance, to ensure that a CGC employee/designate is onsite upon discharge. When the wheat is discharged, the CGC employee/designate mustunseal the bin(s), and collect a sample for information purposes. The CGCemployee/designate will monitor the outward flow of grain to the truck or railcar.”(http://www.cgc.ca/views/tradenotices/uswheat99-e.htm)
• “Upon discharge to railcars, facilities must provide the CGC s Prairie Region Office with alist of car numbers that U.S. wheat is loaded to and indicate the destination(s). If U.S.wheat is loaded to trucks, the CGC s Prairie Region Office must be provided with thevehicle license number(s) of the truck and trailer, as well as the destination(s). If wheat isshipped to another primary elevator facility, monitoring its movement into and out of thefacility as outlined above is required. If U.S. wheat is shipped to a feedlot, the wheat mustbe denatured. Additional requirements apply to U.S. wheat shipped to a processing facilityor a terminal elevator.” (http://www.cgc.ca/views/tradenotices/uswheat99-e.htm)
• “Primary elevators must issue cash purchase tickets to U.S. producers upon receipt of U.S.wheat. Cash purchase tickets must indicate U.S. wheat. U.S. producers will be eligible for

45
security. The rules are the same as those for Canadian grain.”(http://www.cgc.ca/views/tradenotices/uswheat99-e.htm)
• “If the CGC is advised of a shipment of U.S. wheat into Canada and the shipment ismisdirected and does not arrive at the designated primary elevator facility, the CGC willcontact the proper authorities and will take legal action. Any CGC expenses incurred as aresult of a "no-show" or a delayed shipment of U.S. wheat will be charged to the primaryelevator facility.” (http://www.cgc.ca/views/tradenotices/uswheat99-e.htm)
• “Mixing of Canadian and U.S. wheat at a primary elevator facility is prohibited, including atthe time of discharge. If U.S. wheat is cleaned at a primary elevator, U.S. screenings mustbe kept separate from Canadian screenings unless destined to pellet mills or feedlots.”(http://www.cgc.ca/views/tradenotices/uswheat99-e.htm)
• “Facilities are required to report receipts and shipments of U.S. wheat in the WeeklyReport of Grains at Primary Elevators which is submitted weekly to the CGC sStatistics Unit (pursuant to Section 27 of the Canada Grain Regulations).”(http://www.cgc.ca/views/tradenotices/uswheat99-e.htm)
• “Facilities will be responsible for all fumigation costs if an infestation occurs. In the event ofkarnal bunt contamination, facilities will also be responsible for all cleaning and shutdowncosts.” (http://www.cgc.ca/views/tradenotices/uswheat99-e.htm)
• “Failure to Comply: Failure to comply with the requirements in this Memorandum couldresult in revocation of license, prosecution, or the CGC refusing to give further permissionto facilities to receive U.S. wheat.”(http://www.cgc.ca/views/tradenotices/uswheat99-e.htm)
The CGC costs of monitoring U.S. wheat will be covered by Agriculture and Agri-FoodCanada (AAFC) and the Canadian Department of Foreign Affairs and International Trade (DFAIT)during the initial stages of the Wheat Access Facilitation Program. Under this program, U.S. wheatreleased by Canadian Customs at the border is considered to be "entering for consumption in Canada."If it is later re-exported, the exporter will be required to obtain a CWB export license.
However, the program has not enhanced wheat export to Canada because of troublesome andparticular requirements. The requirements could be regarded as trade barriers. Under the programstarted in 1999, no wheat has been moved from the United States to Canada. It is necessary to removeor revise the CGC requirements to allow grain shipments from the United States to Canada.
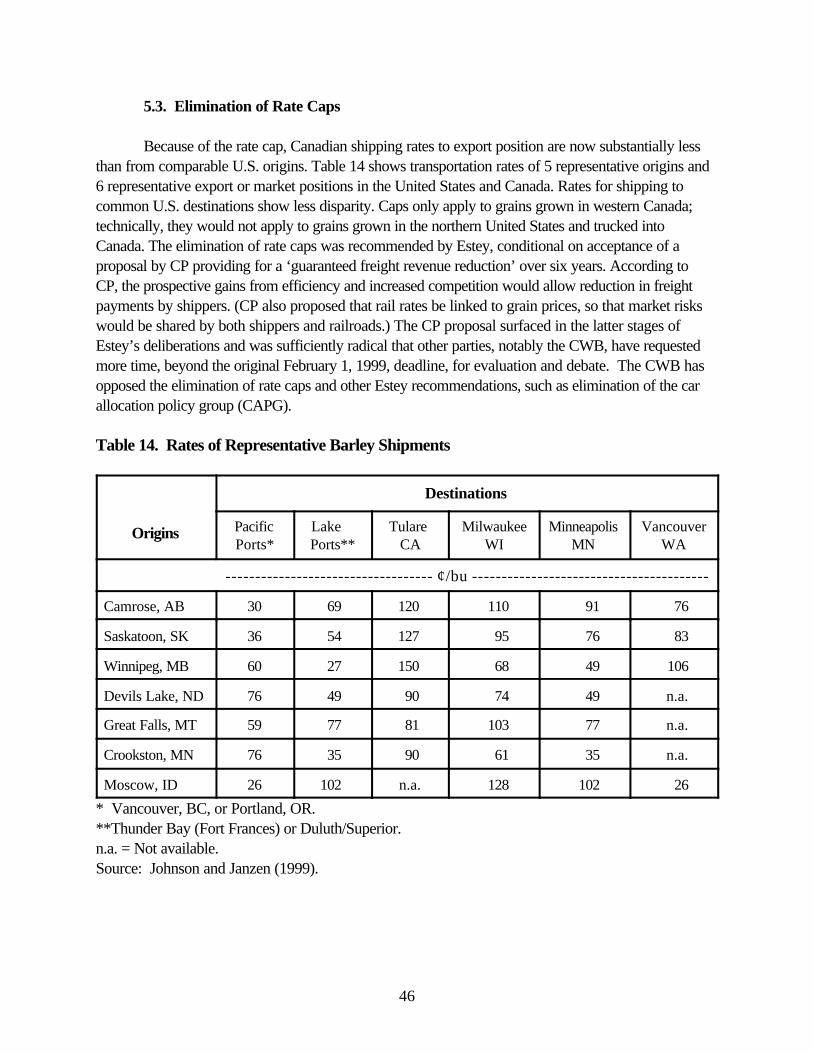
46
5.3. Elimination of Rate Caps
Because of the rate cap, Canadian shipping rates to export position are now substantially lessthan from comparable U.S. origins. Table 14 shows transportation rates of 5 representative origins and6 representative export or market positions in the United States and Canada. Rates for shipping tocommon U.S. destinations show less disparity. Caps only apply to grains grown in western Canada;technically, they would not apply to grains grown in the northern United States and trucked intoCanada. The elimination of rate caps was recommended by Estey, conditional on acceptance of aproposal by CP providing for a ‘guaranteed freight revenue reduction’ over six years. According toCP, the prospective gains from efficiency and increased competition would allow reduction in freightpayments by shippers. (CP also proposed that rail rates be linked to grain prices, so that market riskswould be shared by both shippers and railroads.) The CP proposal surfaced in the latter stages ofEstey’s deliberations and was sufficiently radical that other parties, notably the CWB, have requestedmore time, beyond the original February 1, 1999, deadline, for evaluation and debate. The CWB hasopposed the elimination of rate caps and other Estey recommendations, such as elimination of the carallocation policy group (CAPG).
Table 14. Rates of Representative Barley Shipments
Origins
Destinations
PacificPorts*
Lake Ports**
Tulare CA
MilwaukeeWI
MinneapolisMN
VancouverWA
----------------------------------- ¢/bu ----------------------------------------
Camrose, AB 30 69 120 110 91 76
Saskatoon, SK 36 54 127 95 76 83
Winnipeg, MB 60 27 150 68 49 106
Devils Lake, ND 76 49 90 74 49 n.a.
Great Falls, MT 59 77 81 103 77 n.a.
Crookston, MN 76 35 90 61 35 n.a.
Moscow, ID 26 102 n.a. 128 102 26
* Vancouver, BC, or Portland, OR.**Thunder Bay (Fort Frances) or Duluth/Superior.n.a. = Not available.Source: Johnson and Janzen (1999).

47
Effects of eliminating rate caps are the subject of much controversy in Canada. While the CPoffers assurances about lower average rates, the study by Fulton et al. (1998) projected substantialincreases in freight rates for grain, particularly in regions where only one railroad is operating. Exportsfrom the West Coast would fall substantially, according to their analysis. Cross-border movements toU.S. destinations might become even more attractive, as they did after the Crow benefit was eliminated.However, it is far from clear how deregulation would affect rates to U.S. destinations, as these partlydepend on distributions with terminating carriers. Thus, estimating the net impact on cross-border tradewould be quite speculative.
5.4. Reform Package and Likely Future Paths for Canadian Rationalization
As mentioned before, the government of Canada is trying to create a more efficient,accountable, and competitive GHTS that will cut costs for western Canadian grain producers. Afterextensive consultations with both the Estey and Kroeger Reports, Canadian Transport announced thereforms. Possible multi-level effects, created by the reform package, would enforce the grain flow fromCanada to the United States. Likely paths for modernizing the Canadian GHTS are largely based onrecommendations by both the Estey and Kroeger Reports. The recommendations would representmajor changes in the Canadian system. Among these changes, ‘port buying’ by the CWB, which wouldremove the Board’s control over internal logistics and shipping, and replacement of the currentmaximum railway rate scale with a cap on annual railway revenues for grain shipments will have greateffects. However, it is notable that port buying is a concept promoted and described strictly withrespect to executing off-shore export contracts. No reference has been made yet as to how this wouldbe implemented for trade within North America. These proposed changes are motivated by a desire toimprove system efficiency through increased competition and accountability.
6. Concluding Remarks
Grain handling and transportation systems (GHTSs) are some of the important issues of theagricultural agenda in the Unites States - Canada Free Trade Agreement (CUSTA). There aresignificant differences in the GHTSs between the United States and Canada. The two countries havedeveloped very different systems over the last several decades. Recently the GHTSs in the twocountries have rapidly developed to compete for domestic markets in Canada and the United Statesunder CUSTA and also for global markets. It is important to compare the structure, regulatorypractices, reforms, and efficiency of both GHTSs because they directly affect the competitive positionof grain producers in each country; grain producers are highly dependent on rail transportation to movegrains long distances to export ports. Under CUSTA, there is growing pressure to harmonize theGHTSs and diversify delivery options.
The U.S. GHTS has experienced extensive deregulation with many marketing andtransportation options and has evolved toward a commercial model within a competitive environmentframework since the 1980s. As a result, investment, new technologies, and deregulation have broughtsubstantial increases in the volume of grains shipped and decreases in railway freight rates. The
48
Canadian GHTS is undergoing substantial changes based on the Estey Report and the Kroeger Report.On May 10, 2000, Canadian Transport announced the government’s intention to introduce measures toincrease efficiency and cut costs in Canada’s GHTS. The reforms have been implemented beginningAugust 1, 2000.
Because the grain industries in both countries face long distance hauls for both domestic andexport shipments, GHTSs are critically important to their operations and to producer returns. TheCanadian and U.S. GHTSs are based on very different regulatory structures. In Canada, grain handlingand transportation issues are very important in the agricultural industry, and the reforms have beenimplemented to increase efficiency and cut costs in Canada’s GHTS. In the United States, farmers andgrain handlers are searching for higher grain prices, lower operating costs, and access of U.S. grains toCanadian markets.
The Canadian agricultural industry is heavily dependent on reliable rail service to compete inworld markets. For grains, the long distances from the Prairies to major export ports and the bulkynature of the products give rail an inherent advantage over trucking. Although the average length of hauland rates for Canadian grain movement have decreased due to abandonment of branch lines during thelast several years, the average length of haul and rate are still significant factors in Canadian grainmovement. Based on Canada’s current infrastructure, approximately 85 percent of grain delivery pointsare within 50 miles of a competing railway. It suggests that trucking premiums and a large scaletrucking program could be implemented to move grain between CN and CP and even to the main east-west BNSF line, which lies just south of the U.S. border. Large grain companies have the ability totruck between competing railways. The North American Free Trade Agreement (NAFTA) allows grainshipments from domestic to a transborder pattern.
Reciprocal access is the issue developed recently under the December 1998 Record ofUnderstanding with Canada. The Canadian Food Inspection Agency (CFIA) simplified handlingrequirements for U.S. grain by accepting a certificate of origin instead of a Phytosanitary Certificate(with declarations for freedom from dwarf bunt, flag smut, and Karnal bunt) for grain that meets allconditions agreed between two countries. Under the program, U.S. producers and shippers have bettertransportation access to final West Coast destinations in the United States.
In North Dakota, there are no large differences in rail rates from North Dakota to West Coastdestinations between BNSF and CP (the former Soo Line Railroad). The elevator managers on theBNSF and CP lines use the in-transit program because of availability of railcars. The freight rate isconsistent across the state for west bound shipments on both railroads but differs for east boundshipments.
Access to Canadian primary elevators is a vital element for U.S. producers to enhanceopportunities for grain sales to Canada. The Canadian Wheat Access Facilitation Program (WAFP) isto improve access for U.S. grain producers and other sellers to the grain handling and consumptionsystem in Canada. Wheat producers from approved areas in Montana and North Dakota or grainhandlers of wheat produced in those areas could benefit from WAFP. Before admitting the wheat into

49
Canada, Canadian Customs officers will verify the required documents. In addition to these requireddocuments, there are more complicated and cumbersome requirements by CGC that can beconsidered as a trade barrier. The program has restricted wheat export to Canada. Under the programstarted in 1999, no wheat has moved from the United States to Canada. To enhance wheat export fromthe United States to Canada, it is necessary to remove some of the CGC requirements.
Canadian Transport announced the reforms based on both the Estey and Kroeger Reports.Possible multi-level effects, created by the reform package, would affect the grain flow from Canada tothe United States. The most significant reforms include ‘port buying’ by the CWB, which would removethe Board’s control over internal logistics and shipping, and replacement of the current maximumrailway rate scale with a cap on annual railway revenues for grain shipments. However, it is notable thatport buying is a concept promoted and described strictly with respect to executing off-shore exportcontracts. No reference has been made yet as to how this would be implemented for trade within NorthAmerica. These proposed changes are motivated by a desire to improve system efficiency throughincreased competition and accountability.

50
References
Baylis, Kathy, H. Brooks, M. Fulton, and R. Gray, 1998. The Public Policy Problem of Grain Transportation.
Canadian Grain Commission (CGC), Industry Update, August 6, 1997.
Canadian National Railroad, Canadian National - Illinois Cental Merger: One Year Later. July2000.
Canadian Transportation Agency, A Report on the Movement of Western Grain, July, 1999.
Canadian Wheat Board (CWB), A Look at Canada’s Grain Industry by The Canadian WheatBoard, August 1995.
———, Car Allocation 1998-99, 1998.
———, Efficiencies Resulting from the CWB’s Role in Transportation, 1998.
———, Grain Matters, July-August 1998.
———, Grain Matters, September-October 1998.
———, Industry Railcar Allocation Policy: 1998-99 Crop Year, October 1998.
———, Statistical Tables, 1998.
———, Zone Allocation, July 1998.
Carter, Colin A., R.M.A. Loyns, and D. Berwald, “Domestic Costs of Statutory Marketing Authorities: The Case of The Canadian Wheat Board,” American Journal of AgriculturalEconomics, Vol. 80(2):313-324, 1998.
Denham, Ron, “Improving The System Efficiency,” CGC Conference: Investing in Our Future: Planning & Position of Tomorrow, 1997.
Estey, Willard Z., Phase One Report: Grain Handling and Transportation System Review, May 1998a.
Estey, Willard Z., Grain Handling and Transportation Review: Final Report, December 1998b.
Fulton, Murray, K. Baylis, H. Brooks, and R. Gray, The Impact of Deregulation in the Export Basisin the Canadian Grain Handling and Transportation System, University of Saskatchewan,December 1998.

51
Grain Cleaning Study Consortium (GCSC), The Economics of Cleaning Grain on the Prairies, Prairie Horizons Ltd, and JRG Consulting Group, September 1998.
Gravelines, Rony, Rail Freight Rates and Grain Shippers: The Dilemma Facing Policy Makers,CGC, August 1997.
Harrison, Rob, Harmonizing Truck Transportation, Proceedings of the Fifth Agricultural and FoodPolicy Systems Information Workshop, Friesen Printers, Winnipeg, Manitoba, 2000.
Johnson, D. Demcey, Grain Quality in the Canadian Barley Sector: A Review of Regulations,Industry Practices, and Policy Issues, Ag. Econ. Rpt. No. 424, Dept. of AgriculturalEconomics, North Dakota State University, Fargo, July 1999.
Johnson, D. Demcey, Single-Desk Selling of Canadian Barley: Price Pooling, Price Discrimination, and Systemic Costs, Ag. Econ. Rpt. No. 411, Dept. of AgriculturalEconomics, North Dakota State University, Fargo, January 1999.
Johnson, D. Demcey, U.S. Perspectives on the Canadian Problem: A Critical Appraisal, Ag.Econ. Misc. Rpt. No. 182, Dept of Agricultural Economics, North Dakota State University,Fargo, March 1998.
Johnson, D. Demcey, and Ed Janzen, Barley Production Costs: A Cross-Border Comparison, Ag.Econ. Rpt. No. 425, Dept. of Agricultural Economics, North Dakota State University, Fargo,August 1999.
Johnson, D. Demcey, and William W. Wilson, North American Barley Trade and Competition, Ag.Econ. Rpt. No. 314, Dept. of Agricultural Economics, North Dakota State University, Fargo,August 1994.
Kraft, Darly, “Evolution of Prairie Handling System,” CGC Conference: Investing in Our Future: Planning & Position of Tomorrow, 1997.
Mansfield, Edwin, Managerial Economics: Theory, Applications, and Cases, W.W. Norton &Company, Inc. New York, New York, 1990.
McKinsey & Company, Improving the Western Grain Logistics System: Western Canadian Provinces, July 1998.
Park, Joon J., D. Demcey Johnson, and William W. Wilson, Canadian Transportation and GrainHandling: Issues Affecting The North American Barley Sector, Agricultural EconomicsReport No. 427, Dept. of Agricultural Economics, North Dakota State University, Fargo,February 1999.

52
Parsons, Graham F. Have Truck Will Travel: Some Effects of Trucking on Grain Company and Railway Competition, Organization for Western Economic Cooperation (OWEC), November 1998.
Parsons, Graham, and William W. Wilson, Grain Handling and Transportation Systems: ACanada - United States Comparison, Organization for Western Economic Cooperation,Regina, Saskatchewan, 1999.
Prentice, Barry E., Jake Kosior, and Bob McLeod, Agriculture Trucking in Manitoba,Transportation Institute, University of Manitoba, September 1996.
Scherping, Daniel J., David W. Cobia, D. Demcey Johnson, and William W. Wilson, Wheat CleaningCosts and Grain Merchandising, Ag. Econ. Rpt. No. 282, Dept. of Agricultural Economics,North Dakota State University, Fargo.
Transport Canada, Grain Handling and Transportation System Review: Ports Task ForceReport, November 1999.
USDA, Agricultural Transportation Challenges for the 21st Century: A Framework forDiscussion, 1998.
USDA/FAS, http://www.fas.usda.gov/itp/us-canada.html.
Vercammen, Jim, M. Fultom, and R. Gray, The Economics of Western Grain Transportation and Handling, Department of Agricultural Economics, University of Saskatchewan, 1996.
Western Transportation Advisory Council (WESTAC), Grain Handling and Transportation System, May 1998.
Wilson, William W. U.S. Grain Handling and Transportation System: Factors Contributing toThe Dynamic Changes in The 1980s and 1990s, Staff Paper No. AE98004, Dept. ofAgricultural Economics, NDSU, Fargo, November 1998.
Wilson, William W., and B. Dahl, Reciprocal Access in U.S./Canadian Grain Trade BackgroundIssues for the U.S. Grain Trade, Staff Paper No. AE98001, Dept. of Agricultural Economics,North Dakota State University, Fargo, January 1998.
Wilson, William W,. B. L. Dahl, and D. C. E. Carlson, Logistical Strategies and Risks in CanadianGrain Marketing, Ag. Econ. Rpt. No. 408, Dept. of Agricultural Economics, North DakotaState University, Fargo, 1998.

APPENDIX

54
Blank page for duplicating.

55
Appendix 1. Manitoba Truck Types
Manitoba Truck Types
Configuration Truck Type Axles
Single Axle 2
Tandem Axle 3
Tractor-Trailer (Tandem) 5
Tractor-Trailer (Tridem) 6
Tractor-Trailer (A Train) 7
Tractor-Trailer (Super B) 8
Source: Prentice, Kosior, and McLeod 1996, 54.

56
Appendix 2. Application Form for the State of Origin Certificate for In-Transit Grain Shipments
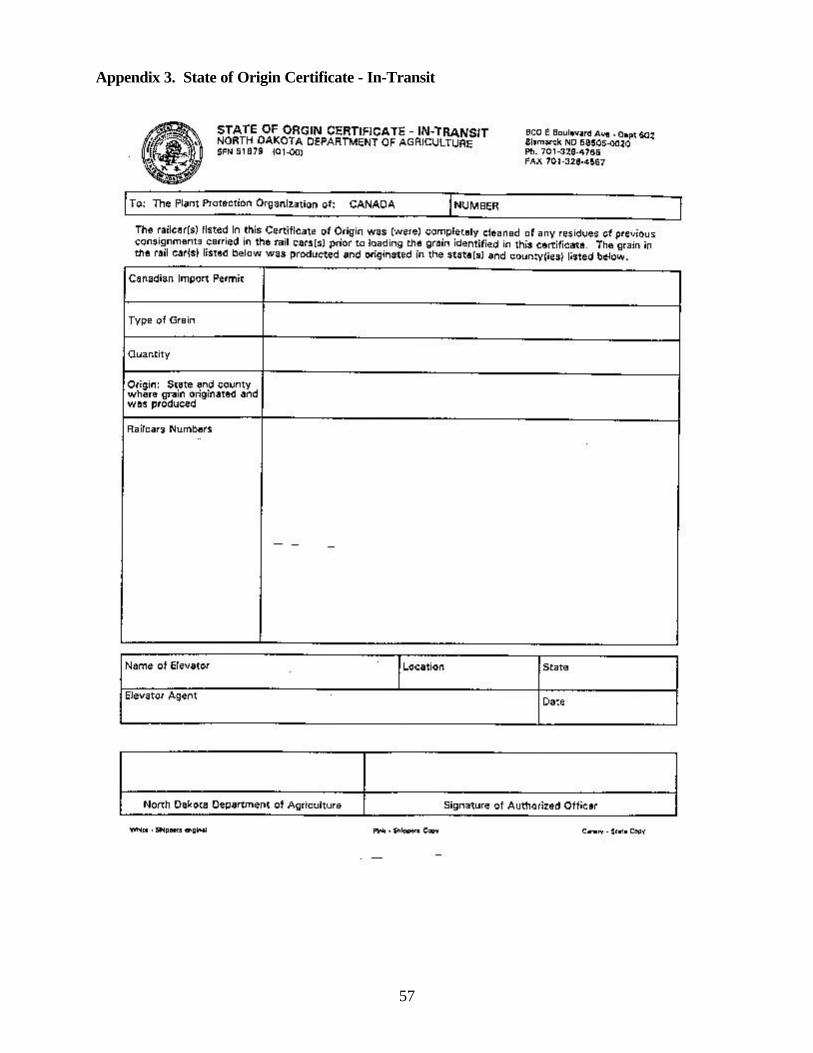
57
Appendix 3. State of Origin Certificate - In-Transit
58
Appendix 4. Request for Release Approval
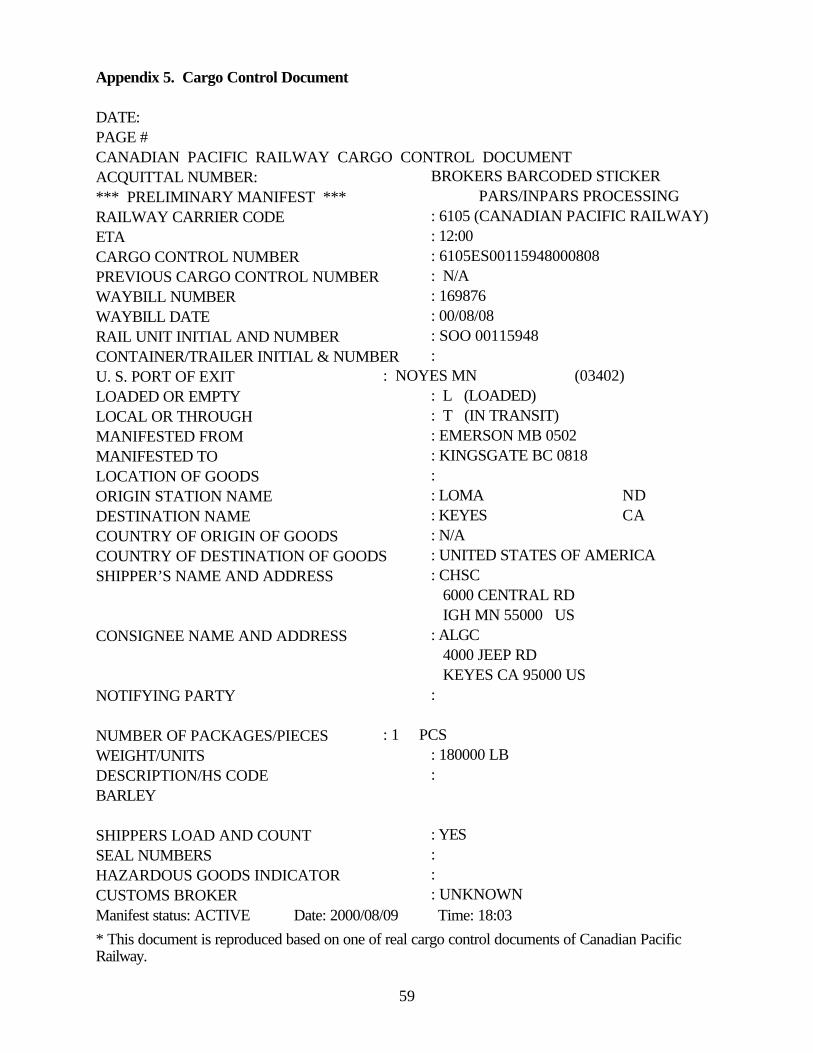
59
Appendix 5. Cargo Control Document
DATE:PAGE #CANADIAN PACIFIC RAILWAY CARGO CONTROL DOCUMENTACQUITTAL NUMBER: BROKERS BARCODED STICKER*** PRELIMINARY MANIFEST *** PARS/INPARS PROCESSINGRAILWAY CARRIER CODE : 6105 (CANADIAN PACIFIC RAILWAY)ETA : 12:00CARGO CONTROL NUMBER : 6105ES00115948000808PREVIOUS CARGO CONTROL NUMBER : N/AWAYBILL NUMBER : 169876WAYBILL DATE : 00/08/08RAIL UNIT INITIAL AND NUMBER : SOO 00115948CONTAINER/TRAILER INITIAL & NUMBER :U. S. PORT OF EXIT : NOYES MN (03402)LOADED OR EMPTY : L (LOADED)LOCAL OR THROUGH : T (IN TRANSIT)MANIFESTED FROM : EMERSON MB 0502MANIFESTED TO : KINGSGATE BC 0818LOCATION OF GOODS : ORIGIN STATION NAME : LOMA NDDESTINATION NAME : KEYES CACOUNTRY OF ORIGIN OF GOODS : N/ACOUNTRY OF DESTINATION OF GOODS : UNITED STATES OF AMERICASHIPPER’S NAME AND ADDRESS : CHSC
6000 CENTRAL RD IGH MN 55000 US
CONSIGNEE NAME AND ADDRESS : ALGC 4000 JEEP RD KEYES CA 95000 US
NOTIFYING PARTY :
NUMBER OF PACKAGES/PIECES : 1 PCSWEIGHT/UNITS : 180000 LBDESCRIPTION/HS CODE :BARLEY
SHIPPERS LOAD AND COUNT : YESSEAL NUMBERS :HAZARDOUS GOODS INDICATOR :CUSTOMS BROKER : UNKNOWNManifest status: ACTIVE Date: 2000/08/09 Time: 18:03
* This document is reproduced based on one of real cargo control documents of Canadian PacificRailway.

60
Appendix 6. Participating Canadian Elevators of the Wheat Access Facilitation Program
Company ElevatorDistance from
Border(Miles)Nearest Border Crossing
AgricoreAgricorePioneerCargill Ltd.Pioneer
PioneerPioneerLouis Dreyfus CDA LtdLouis Dreyfus CDA LtdSaskatchewan Wheat Pool
Pioneer
Cargill Ltd.Saskatchewan Wheat PoolCargill Ltd.
Saskatchewan Wheat PoolSaskatchewan Wheat Pool
Pioneer
Saskatchewan Wheat Pool
Pioneer
PioneerSaskatchewan Wheat Pool
Saskatchewan Wheat PoolSaskatchewan Wheat PoolPioneer
AgricorePioneerCargill Ltd.PioneerPioneer
Letellier, MBSt. Jean, MBMollard, MBElm Creek, MBBrandon, MB
Carnduff, SKNorthgate, SKRathwell, MBVirden, MBEstevan, SK
Estevan, SK
Rowatt, SKCoronach, SKMoose Jaw, SK
Moose Jaw, SKAssiniboia, SK
Fife Lake, SK
Rock Glen, SK
Kincaid, SK
Swift Current, SKBracken, SK
Climax, SKFrontier, SKEastend, SK
Warner, ABTaber, ABLethbridge, ABLomond, ABVulcan, AB
1016606060120200
7090231035129712150
110535550120343075839222281423501202560609898
Emerson, MBEmerson, MBEmerson, MBEmerson, MBBoissevain, MBEmerson, MBCarievale, SKNorthgate, SKEmerson MBBoissevain, MBNorth Portal, SK Estevan Hwy., SKNorth Portal, SK Estevan Hwy., SKRegway, SKCoronach, SKNorth Portal, Oungre,Regway(all in SK)Coronach, SKWest Poplar River, SKCoronach, SKRegway, SKNorth Portal, SKCoronach, SKWest Poplar River, SKWest Poplar River, SKMonchy, SKMonchy, SKMonchy, SKClimax, SKClimax, SKClimax, SKClimax, SKCoutts, ABCoutts, ABCoutts, ABCoutts, ABCoutts, ABCoutts, AB
Source: http://www.fas.usda.gov/info/factsheets/canwheat.html

61
Appendix 7. Canada Customs Form B3

62
Appendix 8. Canada Customs Invoice
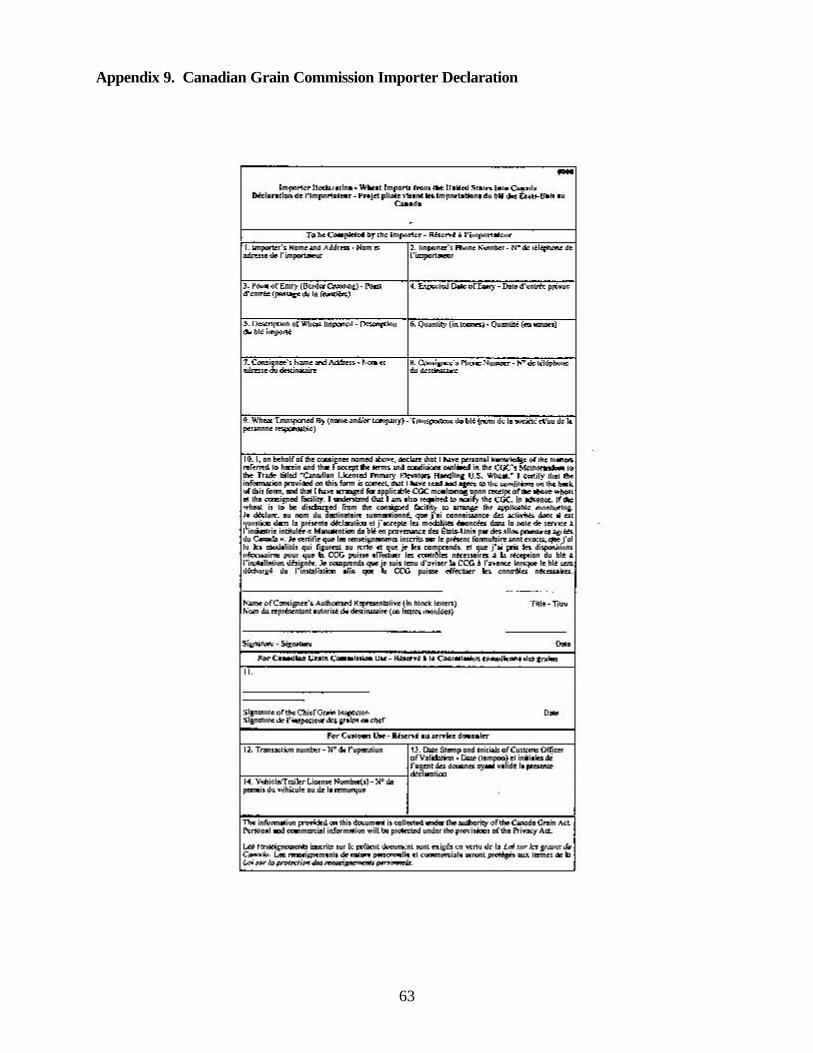
63
Appendix 9. Canadian Grain Commission Importer Declaration

64
Appendix 10. Application Form for Phytosanitary Certificate for Export

65
Appendix 11. USDA Phytosanitary Certificate