usa pv o&m trends and market outlook - …€¦ · by the end of 2015 the usa is pv’s largest...
TRANSCRIPT
USA PV O&M trends and market outlook
With 18.3 GW of generation capacity to be installed by the end of 2015 the USA is PV’s largest market worldwide, despite adopting the technology later than some of the leading European countries.
The increasing installed capacity is putting an ever-greater pressure on operations and maintenance to protect the value of these assets by preventing failures and ensuring high performance. Industry players across the supply chain – from plant owners to solution providers – are focussed on implementing high standards of O&M that maximize return on investment.
This guide to trends and outlook in the PV O&M market has been produced in conjunction with the PV O&M USA 2015 forum, where the key O&M challenges being faced will be tackled by the leading companies and individuals in the industry.
At PV O&M USA 2015 (20-21 October, San Francisco) all the big names in solar PV, from utilities to IPPs to EPCs to service providers, will come together to establish first-class O&M practices that will optimise performance, improve reliability, and maximize overall return on investment.
PV Operations & Maintenance USA Forum 2015
For more information visit www.pv-insider.com/usa
www.pv-insider.com/usa
www.pv-insider.com/usa • 2
USA PV O&M trends and market outlook
Introduction
cOntentS
An overview of the PV O&M market in the USA.................................................3
Market evolution since 2000 .............3
Market makeup: main segments and players ..............................................4
Market challenges .................................5
Geographical distribution ..................7
Data and materials ................................7
Current trends ........................................7
Conclusion ...............................................9
While 2014 was a record year for PV installations in the USA perhaps the real action for the industry was in operations and maintenance (O&M). The 6.2 GW1 added to the system only means more plants to look after. And every kilowatt added is under ever-greater pressure to meet stringent performance targets.
The market has responded to the need for enhanced O&M with a range of strategies that are partly driven by ownership models and supplier relationships.
This report draws on interviews with a number of major actors from different parts of the PV ecosystem to provide an overview of current trends and market challenges. Specifically, the areas that this report addresses are:
n How has the USA PV O&M market evolved since inception? n Who are the current actors in the market?n What are the current challenges for US PV O&M?n What trends are emerging to deal with these challenges?n How can we expect these trends to affect the market in
the future?1 GTM Research and the Solar Energy Industries Association, 2015. U.S. Solar Market Insight, 10 Mar.
Available through www.seia.org/sites/default/files/HOlFT6ym3i.pdf [Accessed 4 June 2015].

www.pv-insider.com/usa • 3
USA PV O&M trends and market outlook
An overview of the PV O&M market in the USAAfter a decade of steady but modest growth since 2000, the market for PV installations has risen dramatically in the last few years (see Figure 1). The upshot is that 18.3 GW of solar capacity is expected to be on American soil by the end of 2015.2
As well as delighting engineering, procurement, and construction (EPC) firms, this boom has led to a significant requirement for O&M. This is particularly the case for utility-scale plants, defined as having a capacity of 1 MW or above.
Joe Brotherton, president of MaxGen Energy Services, a specialist PV O&M supplier serving 20 MW-plus plants, says the utility-scale segment is generally considered to be in the region of 7 GW to 8 GW in size.
However, the amount available to market is “much smaller”, potentially in the order of 3 GW to 3.5 GW, because of EPCs that keep the work in house.
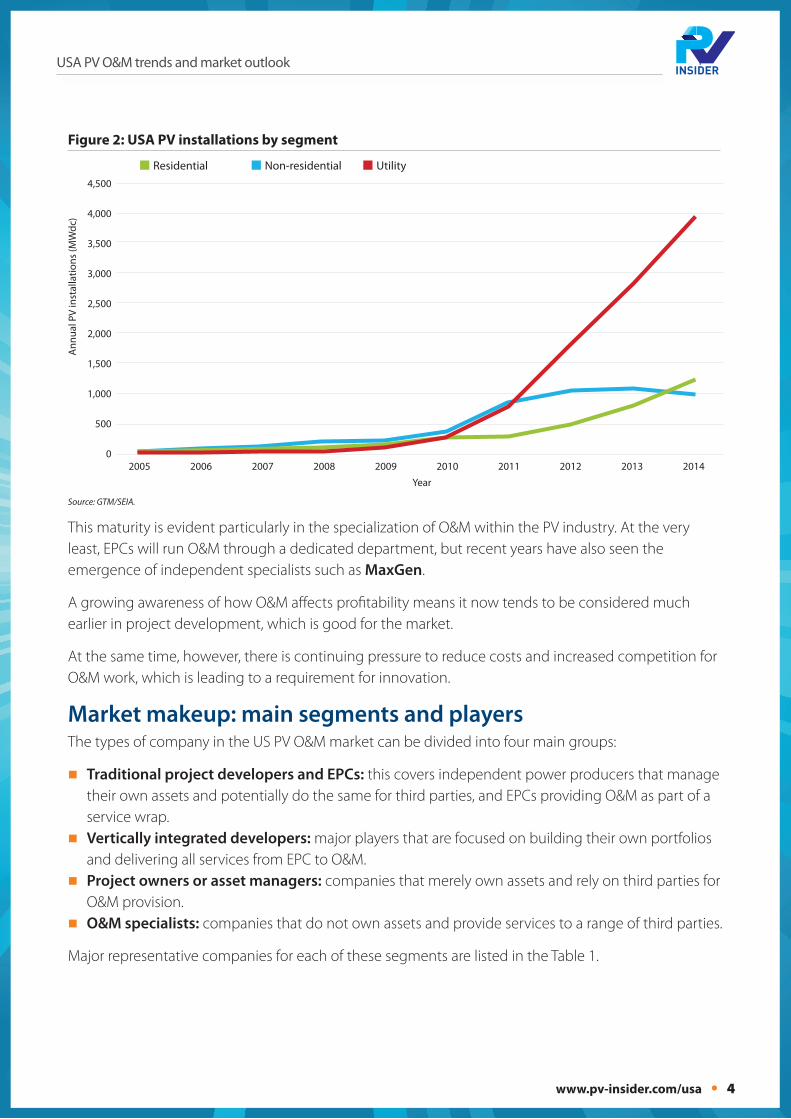
Market evolution since 2000As Figure 1 shows, the installed base of PV in the US has grown 1,550 times over 2000 levels. But what is really significant from an O&M perspective is that most of this growth, particularly in the last five years, has been in utility plants (see Figure 2).
These are plants that represent heavy investments and are run according to strict targets for production and efficiency. Plant owners require high standards of O&M from both in-house and third-party providers, in order to maximize the return on investment, reduce payback times, and improve shareholder value.
As a result, “O&M has matured rapidly in the last several years,” says Larry Freeman, business development manager for asset administration at EDF Renewable Services.
2 Ibid.
Figure 1: Annual USA PV installations.
7,000
6,000
5,000
4,000
3,000
2,000
1,000
0
Ann
ual P
V in
stal
latio
ns (M
Wdc
)
Year
2000
4
2004
58
2008
298
2012
3,369
2002
23
2006
105
2010
852
2014
6,201
2001
11
2005
79
2009
382
2013
4,776
2003
45
2007
160
2011
1,922
n Residential n Non-residential n Utility
Source: GTM/SEIA.
www.pv-insider.com/usa • 4
USA PV O&M trends and market outlook
This maturity is evident particularly in the specialization of O&M within the PV industry. At the very least, EPCs will run O&M through a dedicated department, but recent years have also seen the emergence of independent specialists such as MaxGen.
A growing awareness of how O&M affects profitability means it now tends to be considered much earlier in project development, which is good for the market.
At the same time, however, there is continuing pressure to reduce costs and increased competition for O&M work, which is leading to a requirement for innovation.
Market makeup: main segments and playersThe types of company in the US PV O&M market can be divided into four main groups:
�n Traditional project developers and EPCs: this covers independent power producers that manage their own assets and potentially do the same for third parties, and EPCs providing O&M as part of a service wrap. �n Vertically integrated developers: major players that are focused on building their own portfolios
and delivering all services from EPC to O&M. �n Project owners or asset managers: companies that merely own assets and rely on third parties for
O&M provision. �n O&M specialists: companies that do not own assets and provide services to a range of third parties.
Major representative companies for each of these segments are listed in the Table 1.
Figure 2: USA PV installations by segment
4,500
4,000
3,500
3,000
2,500
2,000
1,500
1,000
500
0
Ann
ual P
V in
stal
latio
ns (M
Wdc
)
Year
2008 20122006 2010 20142005 2009 20132007 2011
n Residential n Non-residential n Utility
Source: GTM/SEIA.

USA PV O&M trends and market outlook
www.pv-insider.com • 5
Given the availability of specialist third-party providers, there is an active debate in the industry over whether it makes more sense to keep O&M in house or sub-contract it out. There seems to be little consensus on this, with in-house and third party O&M providers each claiming superiority for their own models.
Some of the main pros and cons of each approach are summarized in Table 2.
Market challengesExperts consulted by PV Insider identified a number of current challenges facing US PV O&M.
Cost pressureFigure 3 shows the decrease in PV module costs project until 2030. While it is clear that the price per
table 1: USA PV O&M ecosystem players, by company type.
table 2: Pros and cons of in-house versus third-party O&M provision.
company type examples
Traditional project developers and EPCs EDF Renewable Energy, Recurrent Energy, Mortenson
Vertically integrated developers Belectric, First Solar, SunPower, SunEdison, SolarCity, Urban Green Energy
Project owners and asset managers E.ON Climate and Renewables, BHF Renewables, NRG Yield, TerraForm, Capital Dynamics
O&M specialists ESA Renewables, Ingeteam, MaxGen Energy Services, True South, SMA
Pros cons
In-house Full control of process, visibility of project design, ability to influence new project development
Lack of objectivity, potential susceptibility to influence from internal pressures, experience restricted to own portfolio, potential lack of O&M focus
Third party Independence, ability to draw on experience of multiple customer portfolios, specialist focus
Inability to influence project development, potential lack of financial flexibility
Source: Bloomberg New Energy Finance).
Figure 3: Average USA price per watt for a new solar system
$7
$6
$5
$4
$3
$2
$1
$0
Cos
t
Year
20302024 202520192014 2029202320182013 2028202220172012 2027202120162011 2026202020152010
n Soft costs n Engineering, equipment, other n Modules
Soft cost estimate to fall by more than 85%
www.pv-insider.com/usa • 6
USA PV O&M trends and market outlook
watt will continue to fall, it is also evident that the drop will decrease in size year on year, and is unlikely to ever emulate the dramatic cuts seen in 2010 or 2011.
Indeed, the bottoming out of the module cost curve indicates there is little flexibility left to reduce prices in project development and installation. This means attention is increasingly being focused on O&M cost reductions.
Thus providers that may previously have complained about a lack of awareness around funding O&M are now facing customers that fully understand the value of operations and maintenance but still demand highly competitive budgets.
Some of the sources contacted by PV Insider spoke of O&M contracts being offered at rates so low it was difficult to imagine how they could be serviced. “O&M is typically a low-margin business and many players active today may not build sufficient volume to maintain a profitable business,” says Freeman of EDF.
Unionization of laborConnected to cost, “union labor or prevailing wage is becoming a requirement for O&M,” says Brotherton at MaxGen.
In states such as California, owners are increasingly signing union agreements even before EPCs are engaged, he says. The wages agreed under such circumstances, often with unions involved in construction, can make it uneconomical for third parties to provide O&M.
Brotherton believes an increase in union labor provision could prevent O&M providers from achieving the cost reductions that owners demand. There are some strategies that can be employed to deal with this situation, however.
At one site, for example, MaxGen has handed all the high-voltage work to union members and carries out other work with non-union personnel.
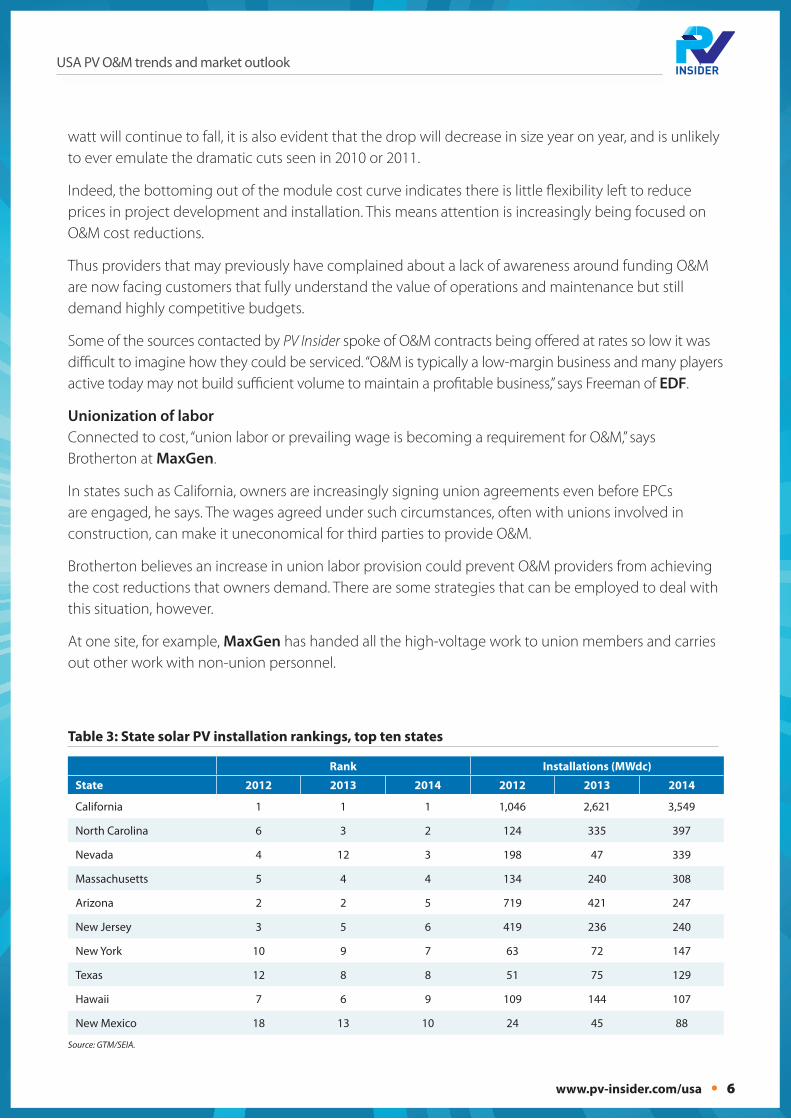
table 3: State solar PV installation rankings, top ten states
Rank Installations (MWdc)
State 2012 2013 2014 2012 2013 2014
California 1 1 1 1,046 2,621 3,549
North Carolina 6 3 2 124 335 397
Nevada 4 12 3 198 47 339
Massachusetts 5 4 4 134 240 308
Arizona 2 2 5 719 421 247
New Jersey 3 5 6 419 236 240
New York 10 9 7 63 72 147
Texas 12 8 8 51 75 129
Hawaii 7 6 9 109 144 107
New Mexico 18 13 10 24 45 88
Source: GTM/SEIA.

USA PV O&M trends and market outlook
www.pv-insider.com • 7
Geographical distributionAs Table 3 shows, the California independent system operator (CAISO) catchment area remains by far the biggest solar market in the US. The volume of installations drops off relatively quickly outside a small core of other states such as North Carolina, Nevada, or Massachusetts.
However, by the end of 2014 20 states had crossed the 100 MW mark for cumulative installations3. The need to manage assets spread over ever-larger territories poses a challenge for O&M.
“You have lots of sites and they are very spread out,” says Javier Latre Gorbe, vice president of technical operations at ESA Renewables. “The problem we face is organizing our O&M crews to be able to respond efficiently and do the correct preventive maintenance in a timely manner.”
Data and materialsThe ability to improve O&M efficiency is largely dependent on having better data about plant operations. But “higher quality and reliable data off the sites is a weak point,” observes Mitch Samuelian, vice president of maintenance and operations at NRG Renew.
On a large site, it can take a long time to isolate the cause of a fault. This situation could be resolved with the introduction of monitoring systems at the inverter string level, but few plants have such capability currently.
There is also concern over the materials used in recent projects. While solar panels have generally become cheaper and more reliable, price pressures have contributed to the use of low-quality components and workmanship on the balance of plant.
Current trendsFive major trends appear to be shaping O&M provision in the US.
Consolidation and partnershipsA number of sources believe the downward trend on O&M pricing will lead to consolidation. “I expect to see several mergers and acquisitions,” says Freeman at EDF.
In addition, the geographical challenges cited above could favor the emergence of regional partnerships, where one provider relies on another for coverage in areas where its assets are widely distributed.
“As our scope starts to spread out across the country we have to partner with other companies to do emergency response-type work, so we’re not having to be out there all the time,” says Tony Padgett, director of O&M at First Solar. “Then we go out for a week or two to do the preventive maintenance.”
Software and systemsMost experts agree on the need to improve the use of software and systems as a way of helping to reduce solar O&M costs. “What the sector is lacking is a good program that can be tied into monitoring and can track all the activity on site,” says Latre of ESA.
MaxGen has partnered with a software company that can pull data from all of the sites in the
3 Ibid.
www.pv-insider.com/usa • 8
USA PV O&M trends and market outlook
provider’s portfolio and feed it into a central operations center. This means MaxGen employees do not need to be trained on individual client monitoring systems.
At the same time, MaxGen can provide a uniform level of service and reporting to its clients, independently of their project size. This move towards more detailed, standardized, consolidated analytics and reporting could help improve O&M economics, says NRG’s Samuelian.
“One of the largest changes is the movement from time-based preventative maintenance to condition-based maintenance,” he says. “The days of looking at equipment that is working on a periodic basis have been replaced by looking at equipment that is not operating as expected.”
Service level agreementsService level agreements (SLAs) and performance guarantees are already a common feature of O&M contracts. It is expected that this will become even more commonplace as project owners require greater accountability from providers.
“Investors want to see a return so there are things now that were not there years ago, for example production and availability guarantees,” says Lindsay Herold, chief operating officer at ESA Renewables. “Five years ago no-one was talking about these kinds of guarantees. Now no investor is going to sign up without one.”

www.pv-insider.com/usa • 9
USA PV O&M trends and market outlook
ConclusionFrom a simple arrangement to keep solar plants running, O&M is now evolving into a sophisticated set of processes, technologies, and specialists dedicated to maximizing the
value of PV within the energy system.
Developments such as buyer dispatch down and storage promise to increase the flexibility and dispatchability of plants, while trends such as remote monitoring and O&M partnerships will lead to further improvements in cost and reliability. This can only improve the acceptance of solar by utilities.
In the meantime, O&M operators will need to find new ways of facing up to cost challenges without compromising on quality. Technology may seem to be the way forward, but who has the money to invest in it?
Finally, it remains to be seen whether the O&M advances being seen in utility-scale solar can be extended to incorporate commercial and industrial or even residential plants, thereby adding even further to the momentum of PV in the US.
The ability to meet such commitments is closely tied to the analysis and monitoring capabilities described above. MaxGen’s software system, for example, is viewed be the company as providing a competitive advantage because it allows for 24-hour monitoring of all sites.
Energy storage integrationMany experts note that future PV plants will increasingly be tied to energy (particularly battery) storage. Currently it remains to be seen how the O&M work for these facilities will be shared out.
Most PV O&M providers are willing to take on the responsibility but there is an acceptance that, initially at least, battery providers will want to take care of the assets themselves. Ultimately it seems likely that O&M partnerships might emerge along the lines of the geographical tie-ups described above.
Improved plant controlPerhaps the most exciting O&M trend to emerge in recent years is the proactive management of PV assets to meet utility and grid demands. First Solar has been implementing bar and inverter-level control to fine-tune solar plant output in line with grid requirements.
“There’s several benefits,” says Padgett. “It’s more likely we would be able to stay online if something needs to be adjusted because we can help balance the grid. And CAISO might start to compensate owners for that reactive control. It’s just going to be a by-product of having the capability.”
For around two years First Solar has also had an automatic dispatch system that allows utility customers to dial down plant output and thus balance the grid.
The customer sends signals to First Solar through an application program interface and output from the plants is adjusted in response, within a buyer dispatch down agreement. This is now emerging as a standard feature of power-purchase agreements.