u.s. transportation research trends
TRANSCRIPT

U.S. Transportation Research TrendsAlternate Fuels Vehicle Electrification andAlternate Fuels, Vehicle Electrification and Searching for the Silver Bulleth fThe Greening of Transportation 2:
Sustainability via Alternative Fuels
The Transportation Center
Northwestern University
Don Hillebrand, Ph.D.
Di t C t f T t ti R hDirector – Center for Transportation Research
Argonne National Laboratory
05 October, 2010

We have Probably Picked all the Low Hanging Fruit(and it doesn’t grow back)(and it doesn t grow back)
2

International Energy Agency’s World Energy Outlook 2008
World primary energy demand in the Reference Scenario:World primary energy demand in the Reference Scenario:
16 000
18 000Mtoe
Other renewables
World primary energy demand in the Reference Scenario: World primary energy demand in the Reference Scenario:
10 000
12 000
14 000Hydro
Nuclear
Biomass
4 000
6 000
8 000
10 000
Gas
Coal
Oil
0
2 000
4 000
1980 1990 2000 2010 2020 2030
Oil
1980 1990 2000 2010 2020 2030
World energy demand expands by 45% between now and 2030 – an average rate of increase of 1.6% per year – with coal accounting for more than a third of the overall rise f p y g f f

February 8, 2010- Transportation Petroleum Gap
4

Worldwide Motor Vehicle Stocks Projected in International Energy Agency’s World Energy Outlook 2008

Oil Prices are Rising AgainDrops in price are “research killers”Drops in price are research killers
And Natural Gas appears to be heading downbe heading down
6
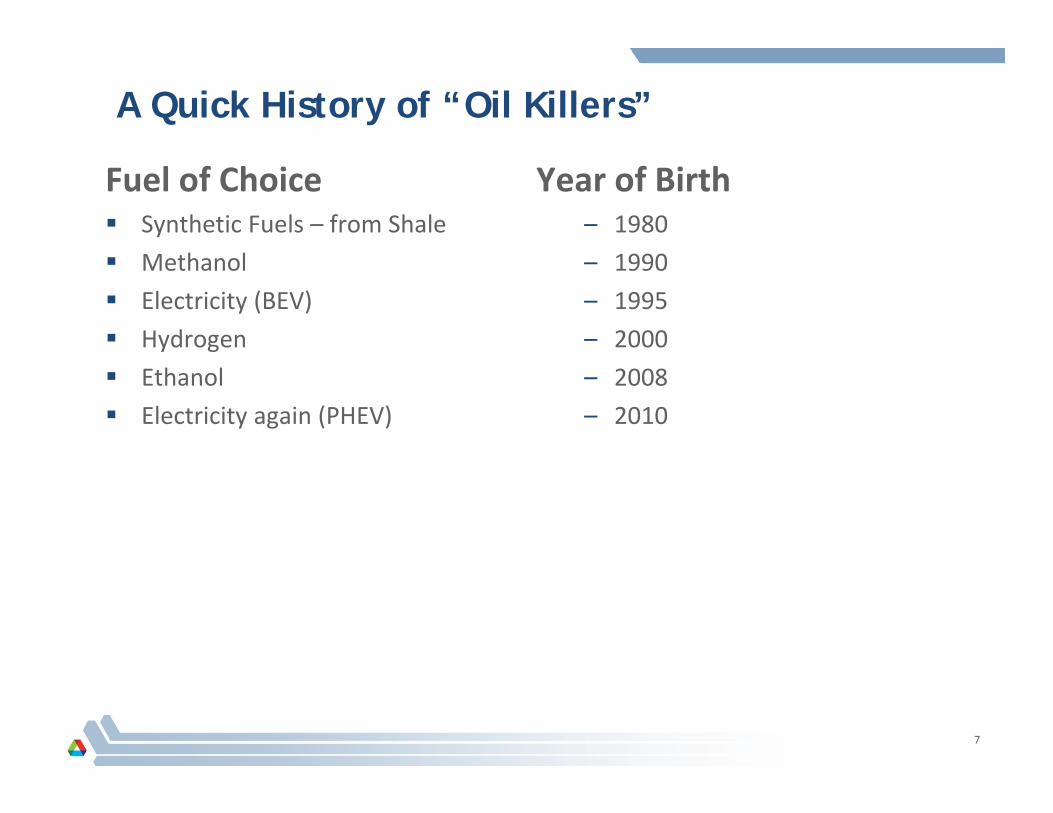
A Quick History of “Oil Killers”
Fuel of ChoiceSynthetic Fuels – from Shale
h l
Year of Birth– 1980
Methanol
Electricity (BEV)
Hydrogen
– 1990
– 1995
– 2000
Ethanol
Electricity again (PHEV)
– 2008
– 2010
7

Argonne Is One of U.S. Department of Energy’s Largest National Laboratories
• Basic science, applied technology and , pp gyengineering research and development
• System Assessment Section, Energy System Division
• Assessment of transportation fuels and advanced vehicle technologies
Argonne National Laboratory

Among the National Labs, Argonne Has the Lead R&D Role in Several Automotive FieldsHybrid vehicle systems, incl PHEVs
– Modeling– Benchmarking and evaluation 4-wheel drive dynamometer
for hybrid vehicle evaluation
– Component integrationEngine emissions control
– In-cylinder combustionBi f l– Bio-fuels
– Laser-ignition for natural gas enginesBatteriesFuel cellsFuel cellsVehicle recyclingApplied materials research
– Tribology– Nanofluids
High-performance computingAnalysis and System Assessments
Hydrogen Engine Test Stand
9
MATT HILMobile Automotive Technology Testbed Hardware-In-the-Loop

Argonne’s Systems Assessment Group
Life‐cycle analysis with the GREET model
Economics of fuel production and distribution infrastructure
E l ti f lt ti f l hi l d t ti f DOE’ Cl CitiEvaluation of alternative‐fuel vehicle demonstration for DOE’s Clean Cities Program
Marketability and commercialization of advanced vehicle technologies
Present key projectsNon‐petroleum fuels
Biofuels
Hydrogen
Hybrid electric vehicles and plug‐in hybrid electric vehicles
Battery‐powered electric vehicles
Fuel‐cell vehicles

Examples of Argonne Vehicle Testing in FY10
2010 Toyota Prius (Gen III)*
2010 Ford Fusion Hybrid
M d B S400hMercedes Benz S400h
2010 Honda Insight
Mini‐E (BEV)Mini E (BEV)
Tesla Roadster (BEV)
NDA Protected Testingg
* Also In‐depth component research

Prime Areas of Research
Electric SystemsElectric Systems
Advanced Combustion
Alternate Fuels
12

Electric Systems
Petroleum Displacement through Fuel Substitution and Improved EfficiencyAdministration Goal: 1 Million PHEVs by 2015
Types of Vehicles and BenefitsTypes of Vehicles and Benefits
HEV Toyota Prius50 MPG• 1 kWh battery
• Power Rating: 80kW
PHEV Chevy Volt100 MPGe
• System Cost: $3000
• 16 kWh battery• Power Rating: 170kW• System Cost: est $16 000
2009 Status T t
EVNissan Leaf All Electric
• System Cost: est. $16,000
• ≥ 40 kWh battery• Power Rating: ≥ 110kW• System Cost: est.$36,0002009 Status Targets
2014 PHEV: Battery that has a 40-mile all-electric range and cost $3,400
Status: $8000-$12,000 for a PHEV 40-mile range batteryStatus: Current cost of
Status and Targets 2015 PEEM: Cost for electric traction system no greater than $12/kW peak by 2015
Status: Current cost of the electric traction system is $40/kW

Projections for 2020 Market Shares indicate th t El t i V hi l h ill Gthat Electric Vehicle share will GrowRoland Berger: Powertrain 2020
U.S. Europe Japan ChinaHEV 13% 7% 9% 6%HEV 13% 7% 9% 6%
PHEV 9% 15% 11% 9%
EV 4% 5% 4% 6%
14http://www.rolandberger.com/media/pdf/Roland_Berger_Li-Ion_batteries_20100222.pdf

Electric Vehicles have limited RangeRange Anxiety is addressed via Several ApproachesRange Anxiety is addressed via Several Approaches
Battery SwapsBattery Swaps
Fast Charging
R ll Bi B tt iReally Big Batteries
Research on better Batteries
In Perspective:•A major electric vehicle company•A major electric vehicle company produced 700 vehicles last year.
•In 1985 - Sterling Height Assembly
15
Plant made 700 vehicles in half a day.

Battery Swaps – Back of the Envelope
Need standardized or interchangeable batteries
Need sufficient vehicles to justify the infrastructureNeed sufficient vehicles to justify the infrastructure
Need a cost model that can work
Current EV Battery Pack is listed as costing $12,000 for replacement
(Which we all believe to be wildly optimistic)
$12000 5% ann al ret rn on in estment $600$12000 x 5% annual return on investment = $600
3 year battery life means amortizing cost is $4000
Annual Return for each pack must surpass $4600 per year
For battery swapping profit, must drive 1300 miles per day per battery pack!
Conclusion: The EV Battery is twenty times too expensive forConclusion: The EV Battery is twenty times too expensive for the swap model.
16

Fast Charging – Back of the EnvelopeTo make the economics work will require SubsidiesTo make the economics work will require Subsidies
Need to handle Thermal Loads and power distributionNeed to handle Thermal Loads and power distribution
Massive investment in infrastructure required – similar to hydrogen
Fast Charging will not be the first resort because there will beFast Charging will not be the first resort, because there will be other options, so the gasoline forecourt model will not hold.
Cost of level three charger is $15K $60KCost of level three charger is $15K – $60K
Value of electricity is about $5 per car
EDF estimate: $15,000 charger is estimated to return a profit of $60 per year
Scottish power estimates that a break even cost for electricity is 60 cents/ kW‐h (making fast charge electric vehicles more expensive per mile than gasoline.)
17

Advanced Combustion Engine R&D
Increasing engine efficiency is one of the most cost-effective approaches to increasing fuel economy
Benefits All Vehicle ClassesCars Targets
Light-Duty
Cars
Trucks• Power Rating: 100-300hp
• Power Rating: 200-400hp
Targets
2015 Passenger Vehicle: Improve gasoline vehicle fuel economy by 25% and diesel vehicle
25-40% Improvement
Heavy-Duty Class 2b-8• Power Rating: 250-600hp
vehicle fuel economy by 25% and diesel vehicle fuel economy by 40%; compared to 2009 baseline2015 Commercial Engine: Improve commercial engine efficiency by more than 20%; compared to 2009 baseline
Up to 50%Improvement
2015 HEV & PHEV Improvements:2015 HEV & PHEV Improvements:Could provide >70 MPG HEV
“Support improved mileage performance of internal combustion engines…” – Secretary of Energy Steven Chu -5-

Advanced & Alternative Fuels
i-blends:
Direct Displacement of Petroleum and Enabling Advanced Engine TechnologyEthanol “Blend Wall” is approximately 11-15 billion gallons per year with E10Technologies and Benefits R&D Focus
overcome blend wall, displace oil & meet RFS mandates
• 7B gallons displaced in 2008• Renewable and synthetic fuels, such as E85 and F-T• Little consumer sacrifice and currently available• Opportunity for greater optimization with some blends
gLD Fuels
•Emissions results looks similar to E0. Catalyst temperature increase seen.
•$38M project includes emissions, durability, driveability, and materials compatibility for vehicles,
• 250M gallons displaced in 2008• Biodiesel & 3rd Generation Renewable Fuels• Easier deployment with larger fleets`
HD Fuels
E85 Optimized FFV Engines – Increase use of E85 by decreasing the fuel economy penalty of ethanol
d eab ty, a d ate a s co pat b ty o e c es,small engines, and infrastructure
Targets and Status2009 Status Targets
•Eliminate half of energy content penalty by taking advantage of higher octane
•Utilizing turbo-charging, variable valve timing, direct injection, and compression ratio increase to achieve 15% increase in fuel efficiency with E85
2011 Target: Have definitive answer on viability of E15 and B20 2022 Target: Attainment
2009: Intermediate blends testing in support of E15 waiver on-track to finish 2010.2009 A i t l
Biodiesel - Increase acceptance for legacy equipment.•Determining effect of B20 on emissions and after-treatment systems → 12% / 48% reduction -in PM for B20/B100.
of RFS II mandate – 36 B gallons/year including expanded E85 use
2009: Approximately 10.5 billion gallons of renewables used

Background & Motivation
18
21ear) Ethanol
Advanced Biofuels
9
12
15
n (B Gal./ye Advanced Biofuels
3
6
9
Prod
uction
Adapted from: Renewable Fuels Standard (Federal
0
2000
2002
2004
2006
2008
2010
2012
2014
2016
2018
2020
2022
Standard (Federal Register, 75(58))
U.S. Renewable Fuel Standard requires and increase of ethanol and advanced biofuels to 36 billion gallons
Iso-Butanol
Impact of ethanol and butanol as oxygenates on SIDI engine efficiency and emissions using steady‐state and transient test procedures 20
gby 2022.

More Than 100 Fuel Production Pathways from Various Energy Feedstocks
Gasoline Hydrogen
PetroleumConventionalOil Sands
Coal
GasolineDieselLiquefied Petroleum GasNaphthaResidual OilJet Fuel
HydrogenMethanolDimethyl EtherFischer-Tropsch DieselFischer-Tropsch Jet Fuel
Compressed Natural GasLiquefied Natural GasLiquefied Petroleum GasHydrogen M th l
Natural GasN th A i
Compressed Natural GasLiquefied Natural GasHydrogen MethanolDimethyl Ether
Renewable Natural Gas
Landfill GasMethanolDimethyl EtherFischer-Tropsch DieselFischer-Tropsch NaphthaFischer-Tropsch Jet Fuel
North AmericanNon-North American
Cellulosic Biomass EthanolH d
Fischer-Tropsch DieselFischer-Tropsch NaphthaFischer-Tropsch Jet Fuel
Landfill Gas
Sugarcane
Corn
Cellulosic BiomassSwitchgrassFast Growing TreesCrop ResiduesForest Residues
EthanolButanol
Ethanol
HydrogenMethanolDimethyl EtherFischer-Tropsch DieselFischer-Tropsch Jet Fuel
SoybeansBiodieselRenewable DieselRenewable Jet Fuel
Coke Oven GasPetroleum CokeN l E
Residual OilCoalNatural GasBiomassOther Renewables
Electricity
Hydrogen
The yellow boxes contain the names of the feedstocks and the red boxes contain the names of the fuels that can be produced from each of those feedstocks.
Nuclear Energy

2Use
Coal-Based Fuels Pose a Trade-Off Between Energy Security and GHG Emissions
2Petroleum U
1 Gasoline ICE
Diesel ICE
Gasoline HEV
Coal‐based fuelsNo CCS
LPG
Diesel HEV
Biomass‐based fuelsCoal‐based fuels, CCS
0
0 1 2 3GHG i i
DME MeOHFTD
Switchgrass‐EtOHCoal‐H2, CCS
EV: CAmix
Sugarcane‐EtOH
BD NG‐H2
EV: US mix
Corn‐EtOH
MeOH
NG‐MeOH
FTDH2
DME
EV: China
CNG
NG‐FTD
NG‐DMECNG
GHG emissionsSwitchgrass‐Switchgrass‐EtOH
Switchgrass‐H2
G
From Wang and Huo: Frontiers of Energy and Power Engineering in China, 3(2): 212-225

Oils for Biodiesel/RenewableSugar Crops for EtOH
Many Potential Biofuel Production Pathways
Oils for Biodiesel/Renewable Diesel/Renewable Jet Fuel
Soybeans
Rapeseed
Sugar Crops for EtOH
Sugar cane
Sugar beet
Sweet sorghum
Landfill Gas
CNG/LNG p
Palm oil
Jatropha
Waste cooking oil
Sweet sorghum
Starch Crops for EtOH
Corn
CNG/LNG
Fischer‐Tropsch diesel
Hydrogen
Methanol Waste cooking oil
Animal fatWheat
Cassava
Sweet potato
Methanol
DME
Fischer‐Tropsch jet fuel
Cellulosic Biomass via GasificationCellulosic Biomass for EtOH
Corn stover, rice straw, wheat straw
Forest residues
Cellulosic Biomass via Gasification
Fischer‐Tropsch diesel
Hydrogen
Methanol
Butanol
Corn
S bMunicipal solid waste
Dedicated energy crops
Black liquor
Algae
Biodiesel
Methanol
DME
Fischer‐Tropsch jet fuel
Sugar beet
qRenewable diesel

GHG Emissions of Corn Ethanol Vary Considerably Among Process Fuels in Plants; Cellulosic Ethanol C i t tl A hi L R d tiConsistently Achieve Large Reductions
GHG Emission Reductions By Ethanol Relative to Gasoline
GHG effects of potential land use changes are not fully included in these results.

1400lResource Management Must Be Addressed at Regional Level
600
800
1000
1200
1400
533
765
1370
ter p
er g
al. e
than
ol
Water quality impact associated with biofuel production
0
200
400
600
R1 R2 R3 R4 R5 R6 R7 R8 R9 R10 US
12 7 57136
10 17
324
98Gal
. wat
Competing water use from multiple sectors and projects
production
•Regional environmental loading to waterways•Nutrient accumulation in surface and ground water
R1 R2 R3 R4 R5 R6 R7 R8 R9 R10 US p j•Power •Biofuel•Agricultural•Urban development•Others
Compounding effect on water body could be
• Significant regional variations in irrigation water consumption for corn
devastating
•Hypoxic zone expansion•Aquatic ecosystem degradation
• Water consumption factor for non-irrigated cellulosic biofuel is comparable to that of petroleum gasoline.
• Published in Journal of Environmental• Published in Journal of Environmental Management
• Results provided key references for GAO’s biofuel report to Congress (Sept. 2009) and Congressional testimony by
2525
2009) and Congressional testimony by GAO on Energy and Water (July 2009)

How Much Water Is Consumed To Drive A Passenger Car For A Mile?
Corn Ethanol Cellulosic Ethanol Petroleum Gasoline
Regions USDA 5 USDA 6 USDA 7 Native habitat PADD II, III, V
Production process Dry milling Thermochemical Biochemical Vary
Share of fuel production 52% 14% 30% 81%production
Share of feedstock production 52% 16% 20% 90%
gal water/gal gas. 15 26 492 3 9* 15 3 - 7eq.
gal water/mile travelled 0.6 1.1 21.0 0.1 0.4 0.6 0.1 – 0.3
* Advanced biochemical process

Natural Gas?
Natural gas reserves are growing at unprecedented levels
Projections are for natural gas prices to stay low
On the flip side, natural gas is valuable for just about everything
And st dies indicate that nat ral gas is more efficientl spentAnd studies indicate that natural gas is more efficiently spent making electricity for plug‐in hybrids.
How long will Fracking be legal?g g g
27

Conclusion: There are no silver bullets, but many bronze bulletsbut many bronze bullets
Economics rule! – It better make cost sense
No single fuel/system will replace oil– Ethanol
Iso Butanol– Iso Butanol
– PHEVs
– Diesel‐cycle Engines
STUDY FINDS SILVER BULLETS LARGELY
Long Term– Lithium air batteries
l b d f l INEFFECTIVE AGAINST WEREWOLVESJuly 28 2009Berlin, Germany – A new study though has indicated that the silver bullet theory may be nothing more than a myth and that Werewolves may in fact be much harder to dispose of than previously thought.
Mankind has long held onto a connection with the animal. From the Anubis of Egypt to the dragons of China to the American Bald Eagle, the animal world has long held a great fascination for human beings. Because of that connection animals quite often
– Algae‐based fuel
Eagle, the animal world has long held a great fascination for human beings. Because of that connection animals quite often integrate themselves into popular culture and become personified. There is perhaps no better of example of that than the Werewolf, a fusion of the human and one of the most vicious of animals istale that has been told throughout human culture across the world.

Integrated Development of Transportation Fuels and EnginesApproach: a system-level, iterative feedback loop – new feedstocks, processing, combustion science, modeling, real-world testing, optimization, and life-cycle , g, g, p , f y
analysis.
b d d kFirst‐Principles
FeedstockOptimization
Bio-Processes
Bio‐based FeedstockSelection
Combustion Chemistry
Modeling and Fundamental Testing
Production
Processing andSeparations
Modeling, Testing, Design, and
Solar/Bio Feedstocks
in situ Engine Studies
g ,Optimization
Catalyst Designand Synthesis
ChemicalProcesses Production
Vehicle IntegrationFeedstock to WheelsLifecycle Analysis
in situ Testing andCharacterization