u.s. solar market insight: q1 2013 - seia | solar energy
TRANSCRIPT

Register now!
•September 18, 2013 •© 2013 Solar Energy Industries Association® •1
Register today! SEIA members receive discounts on all registration categories.
www.solarpowerinternational.com
Solar Power International 2013 October 21-24, 2013 McCormick Place | Chicago, IL, USA
With nearly 700 exhibiting companies, 15,000+ attendees, education sessions and workshops galore, and daily networking events, you can’t beat the return on investment delivered by attending SPI.

Will Lent, Policy & Research Analyst, SEIA Cory Honeyman, Solar Analyst, GTM Research

Antitrust Reminder As a trade association of competitors, SEIA must comply with and be mindful of antitrust laws. It is important that competitively sensitive matters are not discussed on this call, including product prices or costs; sales terms or conditions; production levels; sales territories; marketing plans; industry forecasts; or bid terms. If any such topic is raised, I will stop the conversation and, if necessary, end the call. For more information, SEIA’s antitrust guidelines are available on our website.
September 18, 2013 © 2013 Solar Energy Industries Association® 3

About SEIA • Founded in 1974
• U.S. National Trade Association for Solar Energy • 1,000 member companies from around the world • Members from across 50 states • Largest companies in the world as well as small
installers • Our Mission: Build a strong solar industry to power
America
• Our Goal: 10 gigawatts (GW) of annual installed solar capacity in the U.S. by 2015
September 18, 2013 © 2013 Solar Energy Industries Association® 4

Solar in America: Strong and Getting Stronger • 119,000 American workers in solar – more than double the
number in 2009 – at 5,600 companies across the country
• One of the fastest growing sectors of the U.S. economy – 2012 installations grew 76% over 2011
• Q2 2013 was the second largest first quarter on record. PV market installed 832 MW, growing 15% over last quarter
• 9,370 MW of cumulative installed solar electric capacity, enough to power 1.5 million average American homes
September 18, 2013 © 2013 Solar Energy Industries Association® 5

Solar Is an Economic Engine • The value of U.S. solar installations was $11.5 billion in
2012, up from just $810 million in 2006. • There are now over 119,000 solar workers in the U.S.,
a 13.2% increase over 2011 employment totals*
0
20000
40000
60000
80000
100000
120000
140000
2007 2008 2009 2010 2011 2012
U.S. Solar Workforce
SEIA Estimate The Solar Foundation
*(The Solar Foundation 2012 National Solar Jobs Census)
September 18, 2013 © 2013 Solar Energy Industries Association® 6
$-
$2
$4
$6
$8
$10
$12
$14
2006 2007 2008 2009 2010 2011 2012
Bill
ions
($)
Value of U.S. PV Installations
SEIA Estimate SEIA/GTM Research

U.S. Solar Business Locations
September 18, 2013 © 2013 Solar Energy Industries Association® 7

Solar Market Insight: Q2 2013 • Detailed data on markets in
top 28 states plus DC available in full report.
• Free executive summary provides national aggregate data on installations, pricing, manufacturing and demand forecasts.
• Full report for sale (50% discount to SEIA members) includes quarterly forecasts as well as detailed market segment and state data.
September 18, 2013 © 2013 Solar Energy Industries Association® 8

SEIA/GTM Research Partnership • Industry need for up-to-date and reliable market data
– Market reports issued every quarter
• Member discount: benefit for SEIA members – Reliable market intelligence
– Member discount makes SMI the most affordable market research available
• Data to support SEIA’s advocacy mission • SEIA-GTM conferences • Email questions to [email protected] or
September 18, 2013 © 2013 Solar Energy Industries Association® 9
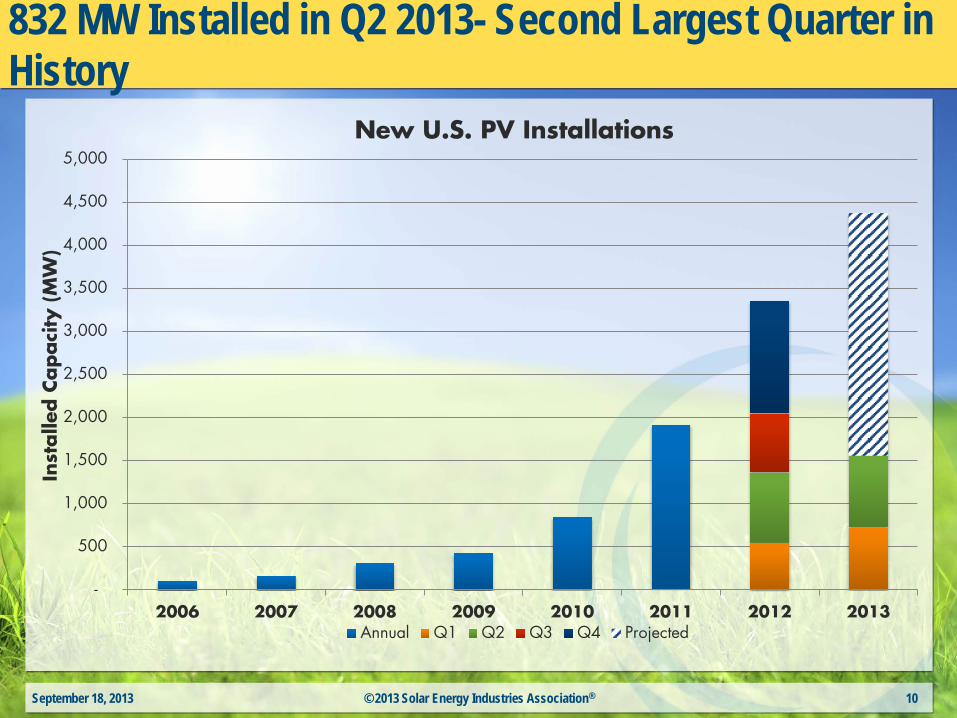
832 MW Installed in Q2 2013- Second Largest Quarter in History
September 18, 2013 © 2013 Solar Energy Industries Association® 10
-
500
1,000
1,500
2,000
2,500
3,000
3,500
4,000
4,500
5,000
2006 2007 2008 2009 2010 2011 2012 2013
Inst
alle
d C
apaci
ty (M
W)
New U.S. PV Installations
Annual Q1 Q2 Q3 Q4 Projected

Q2 2013 Comparison
September 18, 2013 © 2013 Solar Energy Industries Association® 11
Q1 2013 Q2 2013Utility 318 452Commercial 242 216Residential 164 164
0
100
200
300
400
500
600
700
800
900
Inst
alle
d C
apaci
ty (M
W)
U.S. PV Market- Q1 2013 & Q2 2013
0%

Over 362,000 PV Systems operating in the U.S.
September 18, 2013 © 2013 Solar Energy Industries Association® 12
13,747 14,676
17,795
22,031 19,997
23,658
26,278
29,289 29,779
-
5,000
10,000
15,000
20,000
25,000
30,000
35,000
Q2 2011 Q3 2011 Q4 2011 Q1 2012 Q2 2012 Q3 2012 Q4 2012 Q1 2013 Q2 2013
Num
ber
of
Inst
alla
tions
Res Commercial Utility

System Prices Continue to Fall • Average system prices have dropped by over 40% since the beginning of 2011
September 18, 2013 © 2013 Solar Energy Industries Association® 13
$-
$2
$4
$6
$8
$10
$12
2001 2002 2003 2004 2005 2006 2007 2008 2009 2010 2011 2012 1H2013
Ave
rage
Syst
em P
rice
($/W
)
Average PV System Prices
LBNL "Tracking the Sun IV" SEIA/GTM Research

Pieces Declining Across All Market Segments
September 18, 2013 © 2013 Solar Energy Industries Association® 14
$1
$2
$3
$4
$5
$6
$7
$8
Q1 2010Q2 2010Q3 2010Q4 2010Q1 2011Q2 2011Q3 2011Q4 2011Q1 2012Q2 2012Q3 2012Q4 2012Q1 2013Q2 2013
Ave
rage
Syst
em P
rice
($/W
)
Average System Price by Market Segment
Residential Commercial Utility

Price Declines Driving Growth
September 18, 2013 © 2013 Solar Energy Industries Association® 15
$-
$2
$4
$6
$8
$10
$12
-
500
1,000
1,500
2,000
2,500
3,000
3,500
4,000
4,500
5,000
2001 2002 2003 2004 2005 2006 2007 2008 2009 2010 2011 2012 2013
Ave
rage
Syst
em P
rice
($
/W)
Inst
alle
d C
apaci
ty (M
W)
Installations Projected Average System Price

Q2 2013 State Performance
• 14 states reported growth over last year
• The California market nearly doubled compared to Q2 2012 deployment levels
• North Carolina’s installation totals increased by 65% over Q1 2013
September 18, 2013 © 2013 Solar Energy Industries Association® 16
75 MW
90 MW
438 MW
10. Maryland
9. Pennsylvania
8. New York
7. Colorado
6. Hawaii
5. Massachusetts
4. North Carolina
3. New Jersey
2. Arizona
1. California
State Rankings – Q2 2013 Installations
Residential Commercial Utility

What to Expect For the 2nd Half of 2013
• 4,400 MW of PV will come online in 2013
• Residential market to show the most significant growth
• 2013 will be a record year for CSP as over 900 MW are expected to be commissioned
• Together, new solar electric capacity added in 2013 will generate enough clean energy to power over 860,000 homes
September 18, 2013 © 2013 Solar Energy Industries Association® 17
0
500
1000
1500
2000
2500
3000
3500
4000
4500
5000
2012 2013E
Inst
alle
d C
apaci
ty (
MW
)
2012 vs. 2013E PV Installations
Residential Non-Residential Utility

U.S. Solar Market Forecast- PV Market to Grow by 30% in 2013
September 18, 2013 © 2013 Solar Energy Industries Association® 18
0
2000
4000
6000
8000
10000
12000
2010 2011 2012 2013E 2014E 2015E 2016E
Inst
alle
d C
apaci
ty (
MW
)
U.S. Solar Electric Installation Forecast

WWW.GTMRESEARCH.COM
U.S. PV Installations by Market Segment
19

WWW.GTMRESEARCH.COM
Market Segment Trends, Q2 2012 – Q2 2013
20
• The residential market plateaued after seven straight quarters of growth
• Commercial installations dropped
11% quarter-over-quarter; California was the only major state market to see quarterly growth
• The utility market added 452 MW, driving over 50% of new capacity installed across all sectors

WWW.GTMRESEARCH.COM
Residential Market: Why Zero Growth?
21
• The residential market is now seeing the impact of late 2012 and early 2013 reductions or revisions to state level incentives
• Hawaii: Capped 35% in-state tax credit and new permitting rules
• Arizona: Upfront rebates reduced to
$0.10/W for residential projects in APS and TEP territory
• California: Continues to account for the lion’s share of installations, nearly 50% of the residential market
WWW.GTMRESEARCH.COM
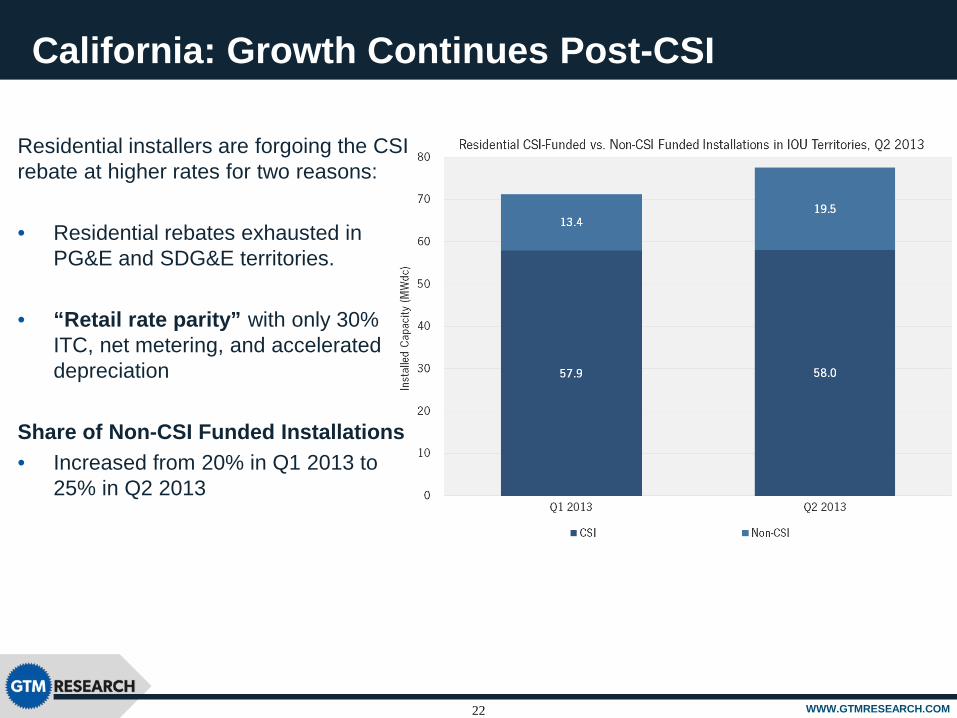
California: Growth Continues Post-CSI
22
Residential installers are forgoing the CSI rebate at higher rates for two reasons:
• Residential rebates exhausted in
PG&E and SDG&E territories.
• “Retail rate parity” with only 30% ITC, net metering, and accelerated depreciation
Share of Non-CSI Funded Installations • Increased from 20% in Q1 2013 to
25% in Q2 2013

WWW.GTMRESEARCH.COM
Third-Party Financing Continues to Drive Installs
23
• Third-party owned (TPO) systems continue to drive new residential installations
• CO: Ranked #1 in TPO market share for the second straight quarter at 89%
Top TPO Trends to Watch • Utilities’ evolving role and
investment in the DG market
• Slight reversal of TPO market share due to increasing popularity of alternative debt products (i.e. PACE financing and residential solar loans)
WWW.GTMRESEARCH.COM
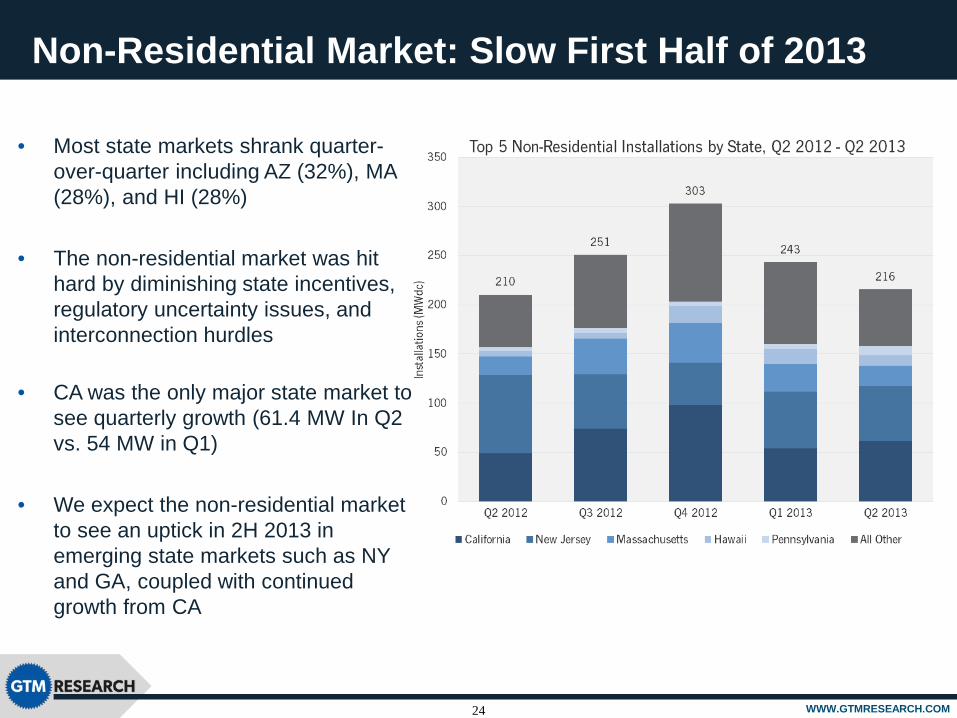
Non-Residential Market: Slow First Half of 2013
24
• Most state markets shrank quarter-over-quarter including AZ (32%), MA (28%), and HI (28%)
• The non-residential market was hit hard by diminishing state incentives, regulatory uncertainty issues, and interconnection hurdles
• CA was the only major state market to see quarterly growth (61.4 MW In Q2 vs. 54 MW in Q1)
• We expect the non-residential market to see an uptick in 2H 2013 in emerging state markets such as NY and GA, coupled with continued growth from CA

WWW.GTMRESEARCH.COM
U.S. Utility Market: Top 10 Q2 Projects Completed
25
Project Name Developer Capacity (MWdc) State Power Offtaker EPC Firm
Imperial Solar Energy Center South, Phase I
Tenaska Solar Ventures 138 CA San Diego Gas &
Electric First Solar
Topaz Solar Farm, Phase I First Solar 40 CA Pacific Gas & Electric First Solar
Agua Caliente Solar Project, Phase V First Solar 32 AZ Pacific Gas & Electric First Solar
Cupertino Electric PG&E 500 MW PG&E Program, Project I Cupertino Electric 23 CA Pacific Gas & Electric Cupertino Electric
Kansas South Project Recurrent Energy 23 CA Pacific Gas & Electric -
PG&E UOG Program, Gates 1 Solar Pacific Gas & Electric 23 CA Pacific Gas & Electric -
Arlington Valley Solar Energy II, Phase I LS Power 22 AZ San Diego Gas &
Electric Fluor Corp.
Highlander Solar I (SEPV8 - SCE RAM1) SolarWorld 14 CA Southern California
Edison SolarWorld
Valencia Solar Project E.ON Climate & Renewables 13 AZ Tucson Electric Power E.ON Climate &
Renewables
Cupertino Electric PG&E 500 MW PG&E Program, Project II Cupertino Electric 12 CA Pacific Gas & Electric Cupertino Electric

WWW.GTMRESEARCH.COM
U.S. Utility Market Pipeline
26
• 452 MW of utility scale solar installed in Q2 2013
• 38 projects became operational, ranging from 600 kW to 138 MW
• All ten of the largest projects that came online were installed in either California or Arizona
• PG&E’s 500 MW Solar PV Program drove 20% of utility scale installations in Q2 2013

WWW.GTMRESEARCH.COM
Net Metering and Rate Design Updates • CA: Passage of AB 327 has provided near and long term certainty to the future of net metering, but also
authorized the CPUC to flatten the tiered rate structure • NY: Tripled its net metering cap from 1% to 3% of 2005 peak demand • AZ and CO: APS and Xcel Energy submitted proposals to lower or replace net metering
Emerging Legislative Landscape for Solar
27
Key Solar Incentive and Procurement Updates

WWW.GTMRESEARCH.COM
Four Year PV Market Outlook
28

WWW.GTMRESEARCH.COM
Four Year PV Market Outlook by Market Segment
29

WWW.GTMRESEARCH.COM
Average Installed Prices Continue to Decline
30

WWW.GTMRESEARCH.COM
U.S. Component Prices Buck the Downward Trend
31

WWW.GTMRESEARCH.COM
U.S. Concentrating Solar Update
32

WWW.GTMRESEARCH.COM
Thank You and Contact Info
33
Thank You & Contact Info
Justin Baca, Director of Research Will Lent, Research and Policy Analyst
Contact: [email protected]
Cory Honeyman, Solar Analyst Contact: [email protected]
For more information about purchasing the full SEIA/GTM Research U.S. Solar Market Insight Q1 2013™ report, please visit www.gtmresearch.com/ussmi or email Justin Freedman ([email protected])

September 18, 2013 © 2013 Solar Energy Industries Association® 34
Questions?
Thank You for Joining Today’s Webinar.