q1 q2 q3 q4 q4 q3 q2 q1 q1 q2 q3 q4 q3 q2 q1 q1 q2 q3 …u.s. solar market insight about the report...
TRANSCRIPT
A Greentech Media Company
U.S. SOLAR MARKET INSIGHTREPORT | 2014 YEAR IN REVIEW | EXECUTIVE SUMMARY
Q1 Q2 Q3 Q4 Q4 Q3 Q2 Q1 Q1 Q2 Q3 Q4
Q4 Q3 Q2 Q1 Q1 Q2 Q3 Q4 Q4 Q3 Q2 Q1
Q3 Q2 Q1 Q1 Q2 Q3 Q4 Q4 Q3 Q2 Q1
Q2 Q3 Q4 Q4 Q3 Q2 Q1 Q1 Q2 Q3 Q4
U.S. Solar Market Insight About the Report
© 2015, Greentech Media, Inc. and Solar Energy Industries Association. All Rights Reserved 2014 Year in Review │ 2
About the Report
U.S. Solar Market Insight® is a quarterly publication of GTM Research and the Solar EnergyIndustries Association (SEIA)®. Each quarter, we collect granular data on the U.S. solar market from nearly200 utilities, state agencies, installers and manufacturers. This data provides the backbone of this U.S. SolarMarket Insight® report, in which we identify and analyze trends in U.S. solar demand, manufacturing andpricing by state and market segment. We also use this analysis to look forward and forecast demand over thenext five years. All forecasts are from GTM Research; SEIA does not predict future pricing, bid terms, costs,deployment or supply.
* References, data, charts and analysis from this executive summary should be attributed to “GTM Research/SEIA U.S.Solar Market Insight®.”
* Media inquiries should be directed to Mike Munsell ([email protected]) at GTM Research and Ken Johnson([email protected]) at SEIA.
* All figures are sourced from GTM Research. For more detail on methodology and sources, visitwww.gtmresearch.com/solarinsight.
Our coverage in the U.S. Solar Market Insight reports includes 32 individual states and Washington, D.C.However, the national totals reported include all 50 states, Washington, D.C., and Puerto Rico.
Detailed data and forecasts for all 32 states are contained within the full version of this report, available atwww.greentechmedia.com/research/ussmi.
AUTHORS
GTM Research
Shayle Kann, Senior Vice President
MJ Shiao, Director of Solar Research
Cory Honeyman, Solar Analyst
Nicole Litvak, Solar Analyst
Jade Jones, Solar Analyst
Leandra Cooper, Research Associate
SEIA
Tom Kimbis, Vice President of Executive Affairs
Justin Baca, Director of Research
Shawn Rumery, Research Manager
Aaron Holm, Research Analyst
U.S. Solar Market Insight Introduction
© 2015, Greentech Media, Inc. and Solar Energy Industries Association. All Rights Reserved 2014 Year in Review │ 3
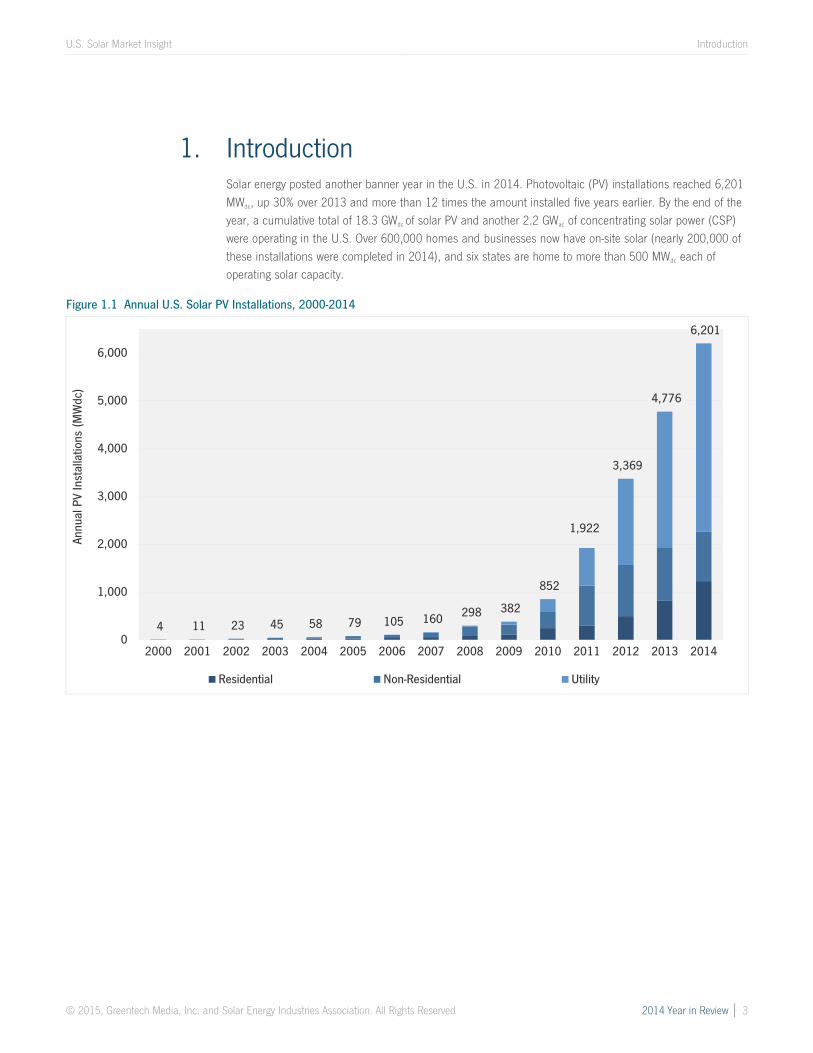
1. IntroductionSolar energy posted another banner year in the U.S. in 2014. Photovoltaic (PV) installations reached 6,201MWdc, up 30% over 2013 and more than 12 times the amount installed five years earlier. By the end of theyear, a cumulative total of 18.3 GWdc of solar PV and another 2.2 GWac of concentrating solar power (CSP)were operating in the U.S. Over 600,000 homes and businesses now have on-site solar (nearly 200,000 ofthese installations were completed in 2014), and six states are home to more than 500 MWdc each ofoperating solar capacity.
Figure 1.1 Annual U.S. Solar PV Installations, 2000-2014
4 11 23 45 58 79 105 160 298 382
852
1,922
3,369
4,776
6,201
0
1,000
2,000
3,000
4,000
5,000
6,000
2000 2001 2002 2003 2004 2005 2006 2007 2008 2009 2010 2011 2012 2013 2014
Annu
al P
V In
stal
latio
ns (M
Wdc
)
Residential Non-Residential Utility
U.S. Solar Market Insight Introduction
© 2015, Greentech Media, Inc. and Solar Energy Industries Association. All Rights Reserved 2014 Year in Review │ 4
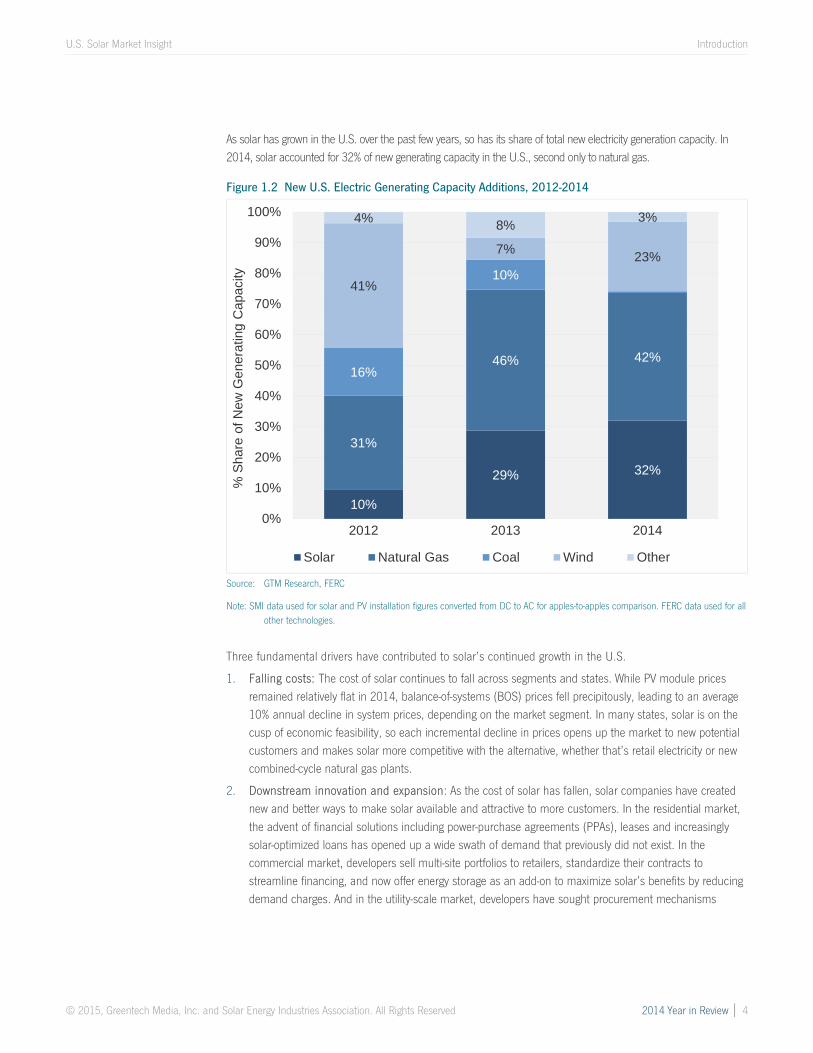
As solar has grown in the U.S. over the past few years, so has its share of total new electricity generation capacity. In2014, solar accounted for 32% of new generating capacity in the U.S., second only to natural gas.
Figure 1.2 New U.S. Electric Generating Capacity Additions, 2012-2014
Source: GTM Research, FERC
Note: SMI data used for solar and PV installation figures converted from DC to AC for apples-to-apples comparison. FERC data used for allother technologies.
Three fundamental drivers have contributed to solar’s continued growth in the U.S.
1. Falling costs: The cost of solar continues to fall across segments and states. While PV module pricesremained relatively flat in 2014, balance-of-systems (BOS) prices fell precipitously, leading to an average10% annual decline in system prices, depending on the market segment. In many states, solar is on thecusp of economic feasibility, so each incremental decline in prices opens up the market to new potentialcustomers and makes solar more competitive with the alternative, whether that’s retail electricity or newcombined-cycle natural gas plants.
2. Downstream innovation and expansion: As the cost of solar has fallen, solar companies have creatednew and better ways to make solar available and attractive to more customers. In the residential market,the advent of financial solutions including power-purchase agreements (PPAs), leases and increasinglysolar-optimized loans has opened up a wide swath of demand that previously did not exist. In thecommercial market, developers sell multi-site portfolios to retailers, standardize their contracts tostreamline financing, and now offer energy storage as an add-on to maximize solar’s benefits by reducingdemand charges. And in the utility-scale market, developers have sought procurement mechanisms
10%
29% 32%
31%
46% 42%16%
10%41%
7% 23%
4% 8% 3%
0%
10%
20%
30%
40%
50%
60%
70%
80%
90%
100%
2012 2013 2014
% S
hare
of N
ew G
ener
atin
g C
apac
ity
Solar Natural Gas Coal Wind Other
U.S. Solar Market Insight Introduction
© 2015, Greentech Media, Inc. and Solar Energy Industries Association. All Rights Reserved 2014 Year in Review │ 5
outside utility regulatory or legislative requirements, resulting in over 4 GWdc of new PPAs signed throughnon-traditional means over the past 12 months.
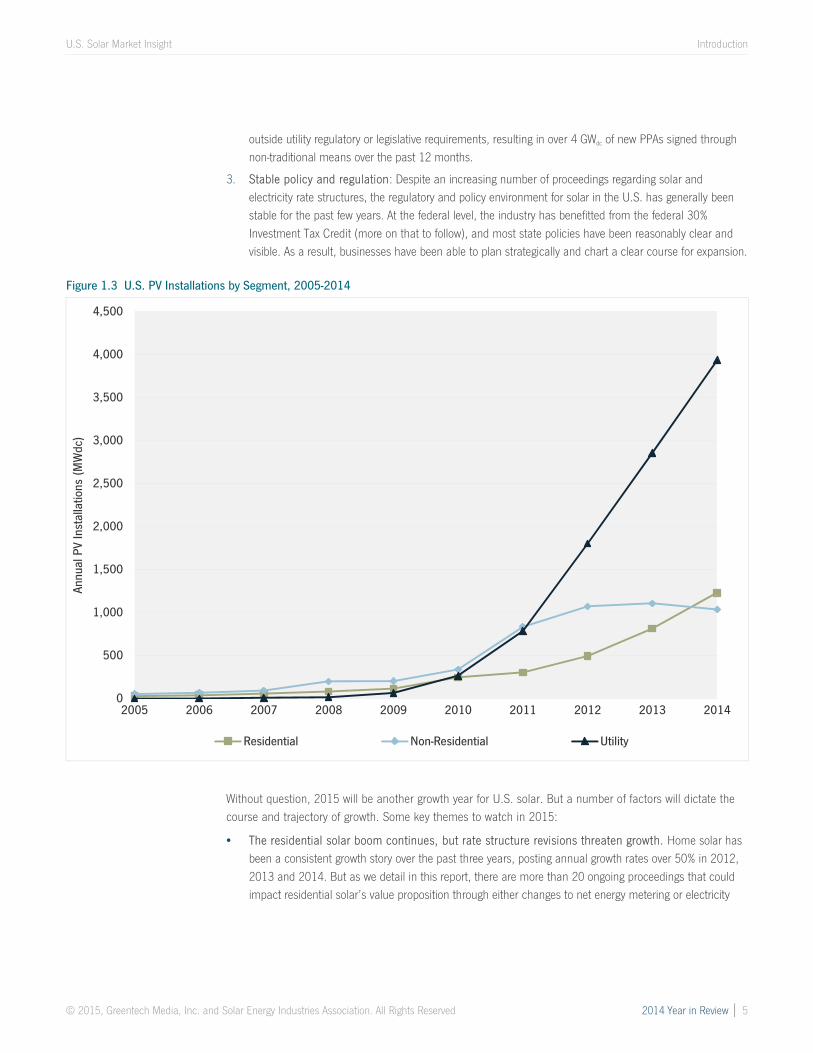
3. Stable policy and regulation: Despite an increasing number of proceedings regarding solar andelectricity rate structures, the regulatory and policy environment for solar in the U.S. has generally beenstable for the past few years. At the federal level, the industry has benefitted from the federal 30%Investment Tax Credit (more on that to follow), and most state policies have been reasonably clear andvisible. As a result, businesses have been able to plan strategically and chart a clear course for expansion.
Figure 1.3 U.S. PV Installations by Segment, 2005-2014
Without question, 2015 will be another growth year for U.S. solar. But a number of factors will dictate thecourse and trajectory of growth. Some key themes to watch in 2015:
The residential solar boom continues, but rate structure revisions threaten growth. Home solar hasbeen a consistent growth story over the past three years, posting annual growth rates over 50% in 2012,2013 and 2014. But as we detail in this report, there are more than 20 ongoing proceedings that couldimpact residential solar’s value proposition through either changes to net energy metering or electricity
0
500
1,000
1,500
2,000
2,500
3,000
3,500
4,000
4,500
2005 2006 2007 2008 2009 2010 2011 2012 2013 2014
Annu
al P
V In
stal
latio
ns (M
Wdc
)
Residential Non-Residential Utility
U.S. Solar Market Insight Introduction
© 2015, Greentech Media, Inc. and Solar Energy Industries Association. All Rights Reserved 2014 Year in Review │ 6
rate structures. 2015 will be the year in which some of the most prominent proceedings (most notablyCalifornia’s AB 327) start to see resolution, while new debates will undoubtedly emerge.
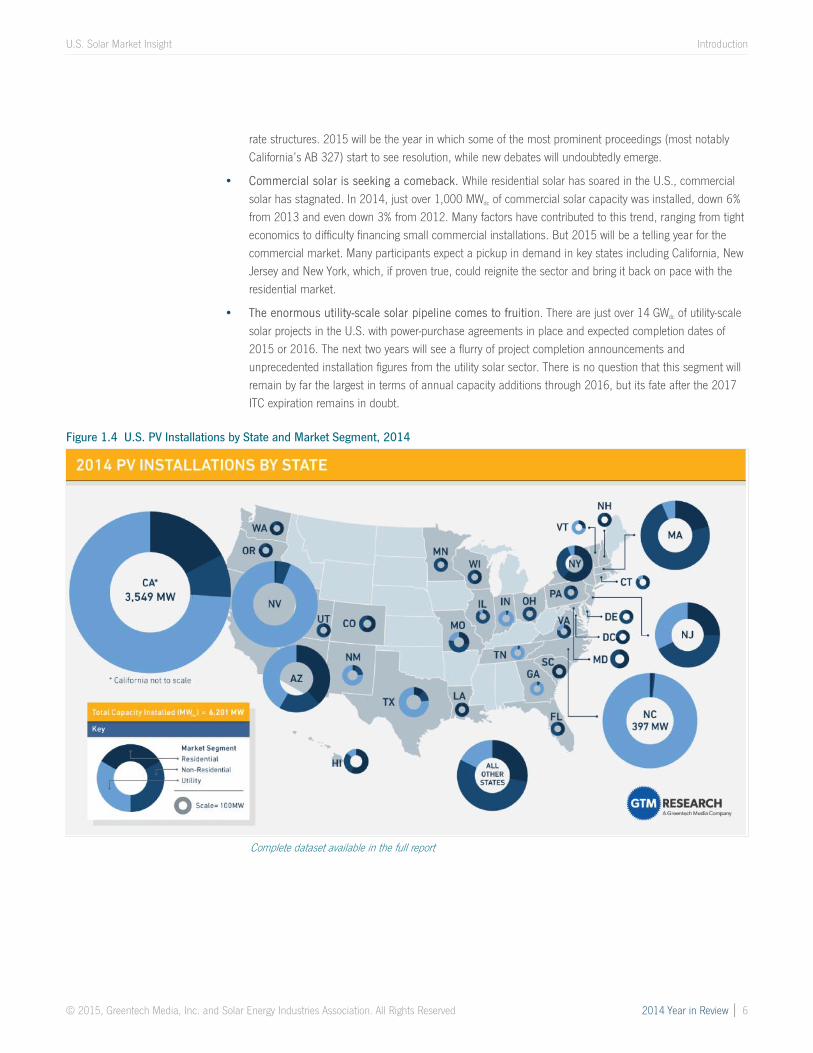
Commercial solar is seeking a comeback. While residential solar has soared in the U.S., commercialsolar has stagnated. In 2014, just over 1,000 MWdc of commercial solar capacity was installed, down 6%from 2013 and even down 3% from 2012. Many factors have contributed to this trend, ranging from tighteconomics to difficulty financing small commercial installations. But 2015 will be a telling year for thecommercial market. Many participants expect a pickup in demand in key states including California, NewJersey and New York, which, if proven true, could reignite the sector and bring it back on pace with theresidential market.
The enormous utility-scale solar pipeline comes to fruition. There are just over 14 GWdc of utility-scalesolar projects in the U.S. with power-purchase agreements in place and expected completion dates of2015 or 2016. The next two years will see a flurry of project completion announcements andunprecedented installation figures from the utility solar sector. There is no question that this segment willremain by far the largest in terms of annual capacity additions through 2016, but its fate after the 2017ITC expiration remains in doubt.
Figure 1.4 U.S. PV Installations by State and Market Segment, 2014
Complete dataset available in the full report
U.S. Solar Market Insight Introduction
© 2015, Greentech Media, Inc. and Solar Energy Industries Association. All Rights Reserved 2014 Year in Review │ 7
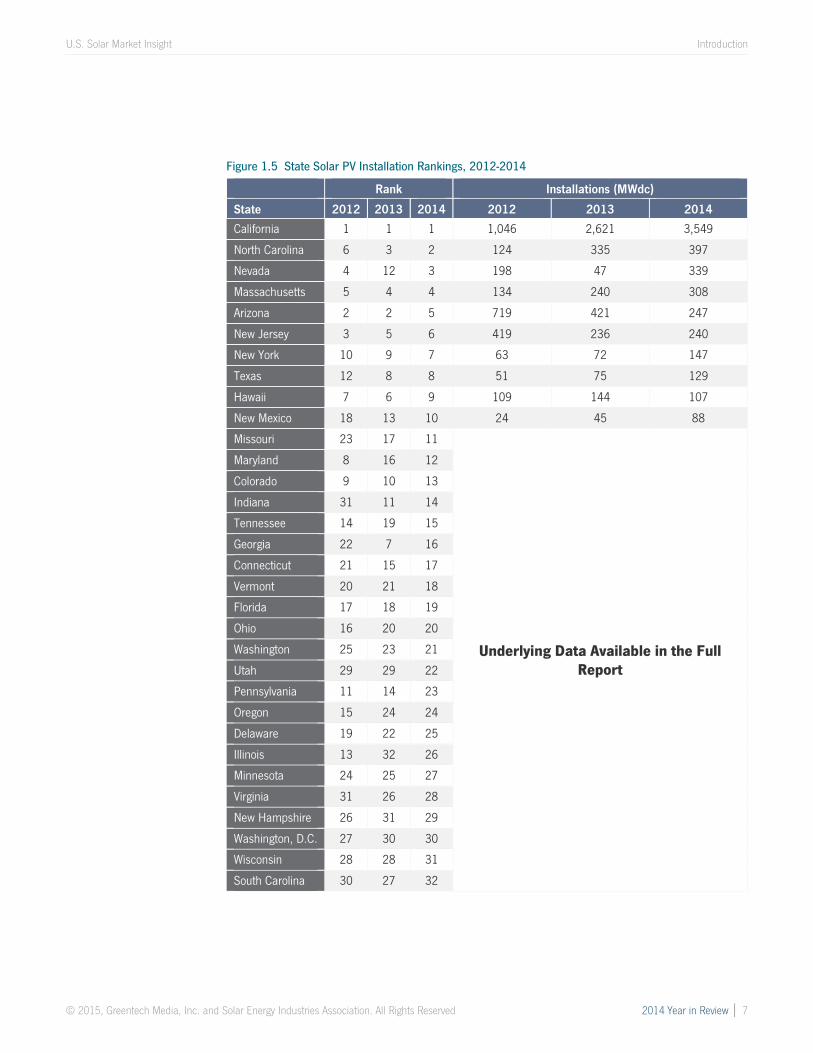
Figure 1.5 State Solar PV Installation Rankings, 2012-2014
Rank Installations (MWdc)
State 2012 2013 2014 2012 2013 2014
California 1 1 1 1,046 2,621 3,549
North Carolina 6 3 2 124 335 397
Nevada 4 12 3 198 47 339
Massachusetts 5 4 4 134 240 308
Arizona 2 2 5 719 421 247
New Jersey 3 5 6 419 236 240
New York 10 9 7 63 72 147
Texas 12 8 8 51 75 129
Hawaii 7 6 9 109 144 107
New Mexico 18 13 10 24 45 88
Missouri 23 17 11
Underlying Data Available in the FullReport
Maryland 8 16 12
Colorado 9 10 13
Indiana 31 11 14
Tennessee 14 19 15
Georgia 22 7 16
Connecticut 21 15 17
Vermont 20 21 18
Florida 17 18 19
Ohio 16 20 20
Washington 25 23 21
Utah 29 29 22
Pennsylvania 11 14 23
Oregon 15 24 24
Delaware 19 22 25
Illinois 13 32 26
Minnesota 24 25 27
Virginia 31 26 28
New Hampshire 26 31 29
Washington, D.C. 27 30 30
Wisconsin 28 28 31
South Carolina 30 27 32
U.S. Solar Market Insight Introduction
© 2015, Greentech Media, Inc. and Solar Energy Industries Association. All Rights Reserved 2014 Year in Review │ 8
Key Figures
The U.S. installed 6,201 MWdc of solar PV in 2014, up 30% over 2013, making 2014 the largest year everin terms of PV installations.
More than one-third of all cumulative operating PV capacity in the U.S. came on-line in 2014.
By the end of 2014, 20 states eclipsed the 100 MWdc mark for cumulative operating solar PV installations,and California’s market alone is home to 8.7 GWdc.
For the first time ever, more than half a gigawatt of residential solar installations came on-line without anystate incentive in 2014.
32% of all new electric generating capacity in the U.S. came from solar in 2014.
Growth remains driven primarily by the utility solar PV market, which installed 1.5 GWdc in Q4 2014, thelargest quarterly total ever for any market segment.
We forecast that PV installations will reach 8.1 GWdc in 2015, up 31% over 2014. Growth will occur in allsegments, but will be most rapid in the residential market.
2014 was the largest year ever for concentrating solar power, with 767 MWac brought on-line. Notableproject completions include the 392 MWac Ivanpah project. Genesis Solar project’s second phase of 125MWac, and Abengoa’s Mojave Solar (250 MWac), which achieved commercial operation in December 2014.
U.S. Solar Market Insight Photovoltaics
© 2015, Greentech Media, Inc. and Solar Energy Industries Association. All Rights Reserved 2014 Year in Review │ 9
2. Photovoltaics2.1.1. Market Segment Trends
Residential PV
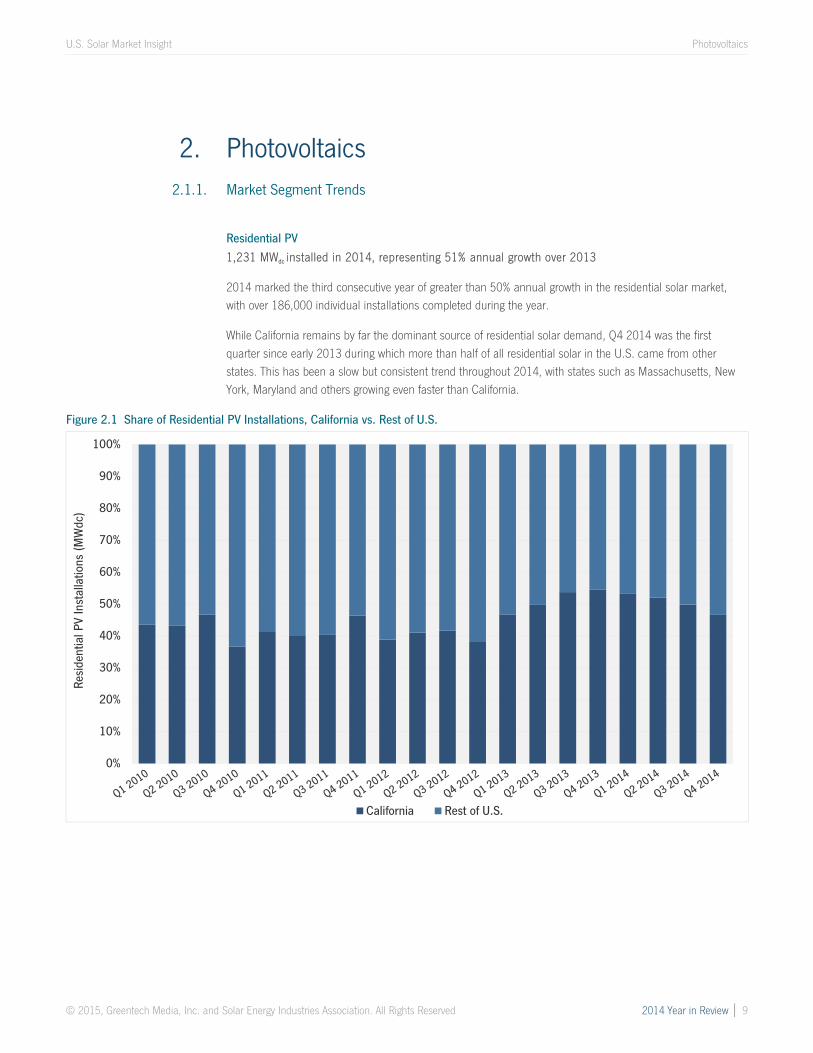
1,231 MWdc installed in 2014, representing 51% annual growth over 2013
2014 marked the third consecutive year of greater than 50% annual growth in the residential solar market,with over 186,000 individual installations completed during the year.
While California remains by far the dominant source of residential solar demand, Q4 2014 was the firstquarter since early 2013 during which more than half of all residential solar in the U.S. came from otherstates. This has been a slow but consistent trend throughout 2014, with states such as Massachusetts, NewYork, Maryland and others growing even faster than California.
Figure 2.1 Share of Residential PV Installations, California vs. Rest of U.S.
0%
10%
20%
30%
40%
50%
60%
70%
80%
90%
100%
Resi
dent
ial P
V In
stal
latio
ns (M
Wdc
)
California Rest of U.S.
U.S. Solar Market Insight Photovoltaics
© 2015, Greentech Media, Inc. and Solar Energy Industries Association. All Rights Reserved 2014 Year in Review │ 10
Non-Residential PV
1,036 MWdc installed overall in 2014, down 6% from 2013
The non-residential market jumped 28% in Q4 2014 versus the previous quarter, but this number wasinsufficient to keep the market from having its first down year in recent history. As we discuss further in the fullreport, the non-residential market has proven much harder to scale, and has been much more sensitive toincentive reduction, than the residential market. And while a few major state markets (Massachusetts, NewYork, California and Maryland) did grow in 2014, this expansion was offset by significant downturns in NewJersey, Arizona and Hawaii.
We remain confident that the non-residential market will see a resumption of growth in 2015. A wide range ofstates are poised to have a stronger year, while some of the incumbent markets (most notably New Jersey)appear to have hit their nadir.
Utility PV
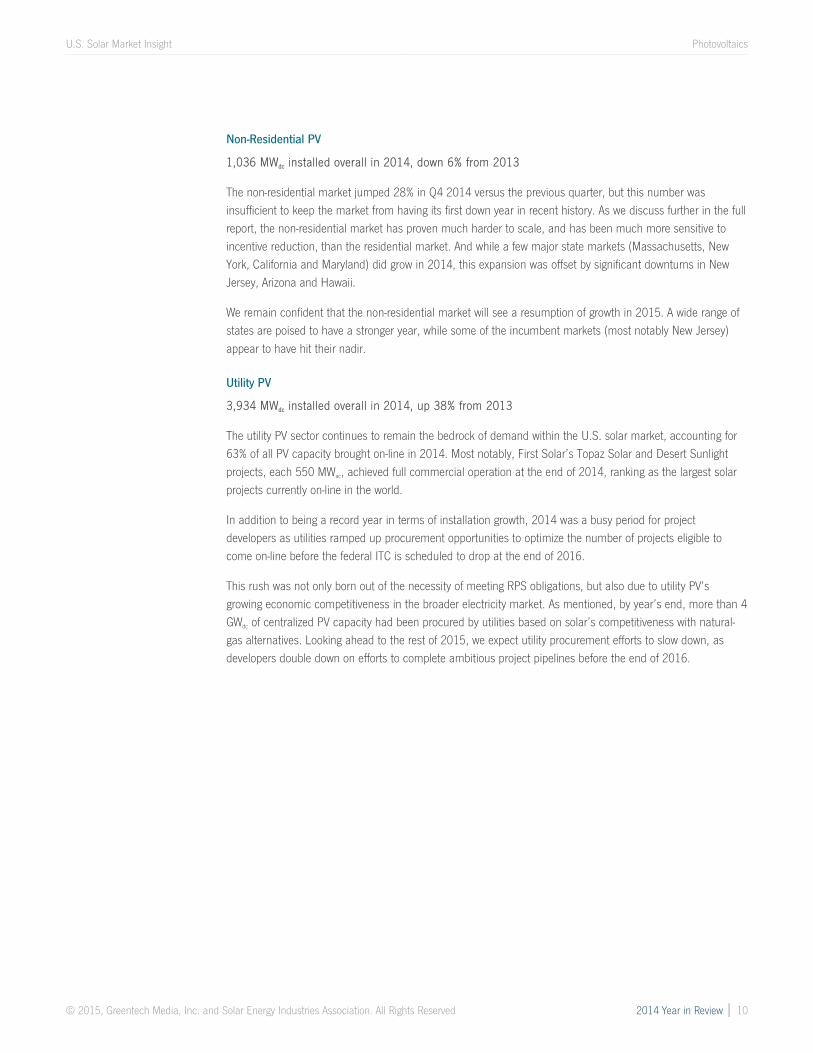
3,934 MWdc installed overall in 2014, up 38% from 2013
The utility PV sector continues to remain the bedrock of demand within the U.S. solar market, accounting for63% of all PV capacity brought on-line in 2014. Most notably, First Solar’s Topaz Solar and Desert Sunlightprojects, each 550 MWac, achieved full commercial operation at the end of 2014, ranking as the largest solarprojects currently on-line in the world.
In addition to being a record year in terms of installation growth, 2014 was a busy period for projectdevelopers as utilities ramped up procurement opportunities to optimize the number of projects eligible tocome on-line before the federal ITC is scheduled to drop at the end of 2016.
This rush was not only born out of the necessity of meeting RPS obligations, but also due to utility PV’sgrowing economic competitiveness in the broader electricity market. As mentioned, by year’s end, more than 4GWdc of centralized PV capacity had been procured by utilities based on solar’s competitiveness with natural-gas alternatives. Looking ahead to the rest of 2015, we expect utility procurement efforts to slow down, asdevelopers double down on efforts to complete ambitious project pipelines before the end of 2016.
U.S. Solar Market Insight Photovoltaics
© 2015, Greentech Media, Inc. and Solar Energy Industries Association. All Rights Reserved 2014 Year in Review │ 11
Figure 2.2 Utility PV Contracted Pipeline, Q1 2013-Q4 2014
Source: GTM Research, U.S. Utility PV Tracker
2.1.2. Full Report Excerpt | California Residential PV: The Epicenter of Market Maturity
In 2014, California once again reigned supreme as the largest residential state market in the U.S. – addingwell over half a gigawatt for the first time on an annual basis. As analyzed further in the full report, rebatefunding offered by the California Solar Initiative has fully depleted for residential installations. Given that, threekey factors fueled California’s continued momentum in 2014.
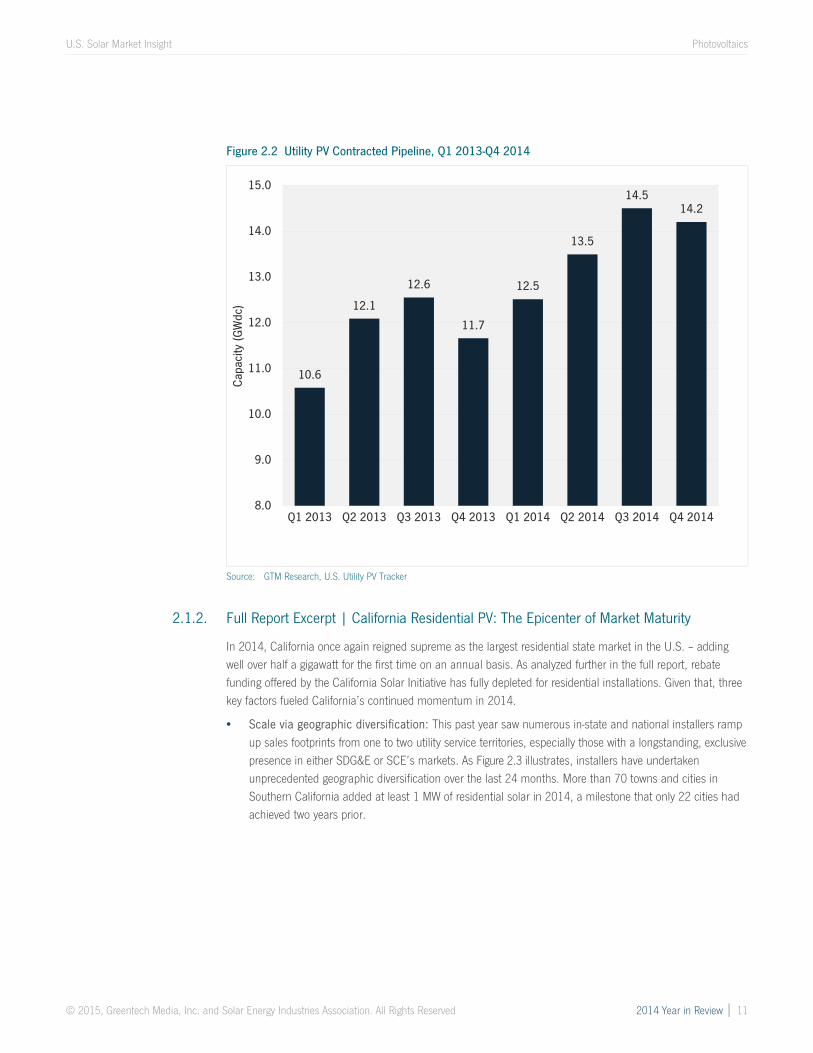
Scale via geographic diversification: This past year saw numerous in-state and national installers rampup sales footprints from one to two utility service territories, especially those with a longstanding, exclusivepresence in either SDG&E or SCE’s markets. As Figure 2.3 illustrates, installers have undertakenunprecedented geographic diversification over the last 24 months. More than 70 towns and cities inSouthern California added at least 1 MW of residential solar in 2014, a milestone that only 22 cities hadachieved two years prior.
10.6
12.1
12.6
11.7
12.5
13.5
14.514.2
8.0
9.0
10.0
11.0
12.0
13.0
14.0
15.0
Q1 2013 Q2 2013 Q3 2013 Q4 2013 Q1 2014 Q2 2014 Q3 2014 Q4 2014
Capa
city
(GW
dc)
U.S. Solar Market Insight Photovoltaics
© 2015, Greentech Media, Inc. and Solar Energy Industries Association. All Rights Reserved 2014 Year in Review │ 12
Figure 2.3 Cities in Southern California That Installed 1 MW or More of Residential PV Annually, 2010-2014
Based on residential PV installation figures for SDG&E, SCE, and LADWP territories
Above-average electricity bill hikes spurred higher sales: In the summer of 2014, the CPUC approvedretail rate hikes for customers of IOU utilities who use less energy, which in turn expanded the pool ofcustomers willing to install solar in California, an option offering savings of 10% to 20% on their monthlybills.
Standardizing financing and installation solutions: The diversification of homeowner financingsolutions, including PACE and solar loans, has scaled up closing rates for customers eager to own rooftopsolar rather than signing a lease or PPA. On top of that, installers are speeding up sales-to-installationtimelines by tapping into communities with over-the-counter permitting processes.
In 2015, California will be the first state to add more than 200 MWdc of residential installations in a givenquarter. Based on the continued availability of third-party financing solutions, along with the increasingpenetration of PACE and other loan products, California’s market remains well positioned to sustain its rank asthe top residential state market. But amidst this continued growth, for the first time since its passage, AB 327(which will create a net energy metering successor program, among other things) is already having a materialimpact on demand for residential solar within the state. In particular, certain installers are pushing to expeditesales through the first half of 2015, due to concerns that the aggregate NEM capacity limit could be reachedby Q4 2015 or early 2016. Once the cap is reached, the next version of NEM is scheduled to take effect,although decisions regarding NEM rule revisions could be announced by the CPUC as late as December 2015.
4
9
22
56
73
0
10
20
30
40
50
60
70
80
Installed At Least 1 MW
Num
ber o
f Citi
es
2010 2011 2012 2013 2014
U.S. Solar Market Insight Photovoltaics
© 2015, Greentech Media, Inc. and Solar Energy Industries Association. All Rights Reserved 2014 Year in Review │ 13
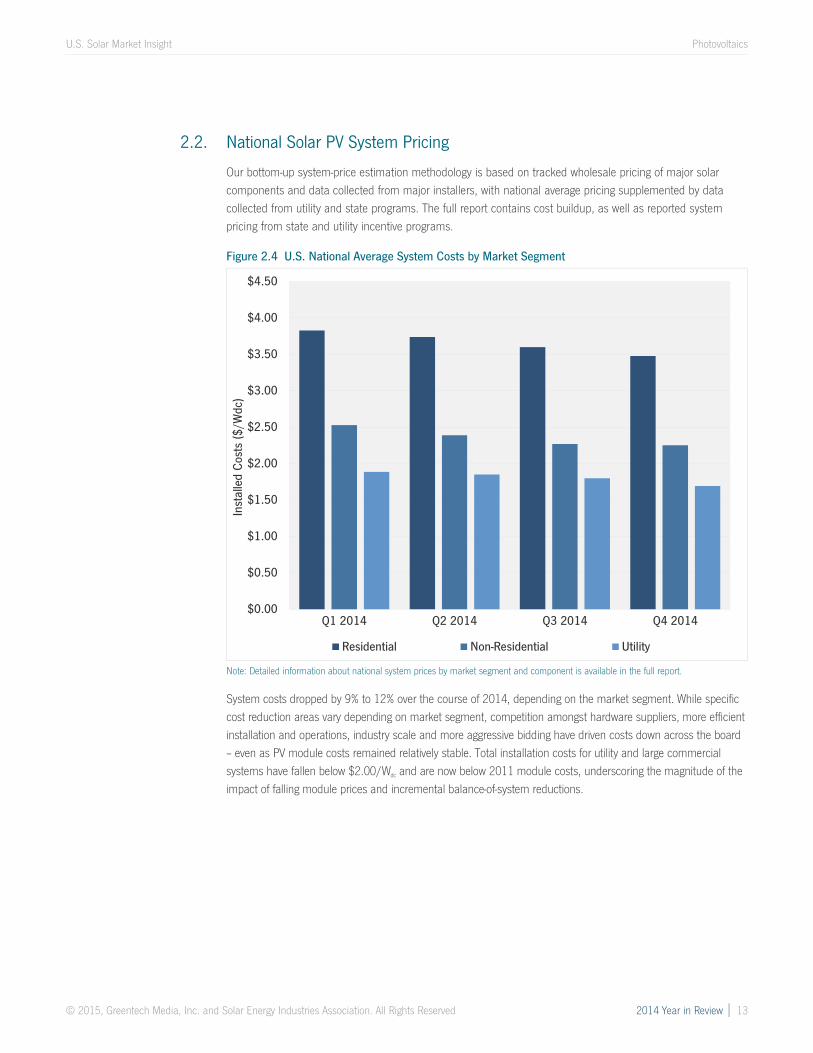
2.2. National Solar PV System Pricing
Our bottom-up system-price estimation methodology is based on tracked wholesale pricing of major solarcomponents and data collected from major installers, with national average pricing supplemented by datacollected from utility and state programs. The full report contains cost buildup, as well as reported systempricing from state and utility incentive programs.
Figure 2.4 U.S. National Average System Costs by Market Segment
Note: Detailed information about national system prices by market segment and component is available in the full report.
System costs dropped by 9% to 12% over the course of 2014, depending on the market segment. While specificcost reduction areas vary depending on market segment, competition amongst hardware suppliers, more efficientinstallation and operations, industry scale and more aggressive bidding have driven costs down across the board– even as PV module costs remained relatively stable. Total installation costs for utility and large commercialsystems have fallen below $2.00/Wdc and are now below 2011 module costs, underscoring the magnitude of theimpact of falling module prices and incremental balance-of-system reductions.
$0.00
$0.50
$1.00
$1.50
$2.00
$2.50
$3.00
$3.50
$4.00
$4.50
Q1 2014 Q2 2014 Q3 2014 Q4 2014
Inst
alle
d Co
sts
($/W
dc)
Residential Non-Residential Utility
U.S. Solar Market Insight Photovoltaics
© 2015, Greentech Media, Inc. and Solar Energy Industries Association. All Rights Reserved 2014 Year in Review │ 14
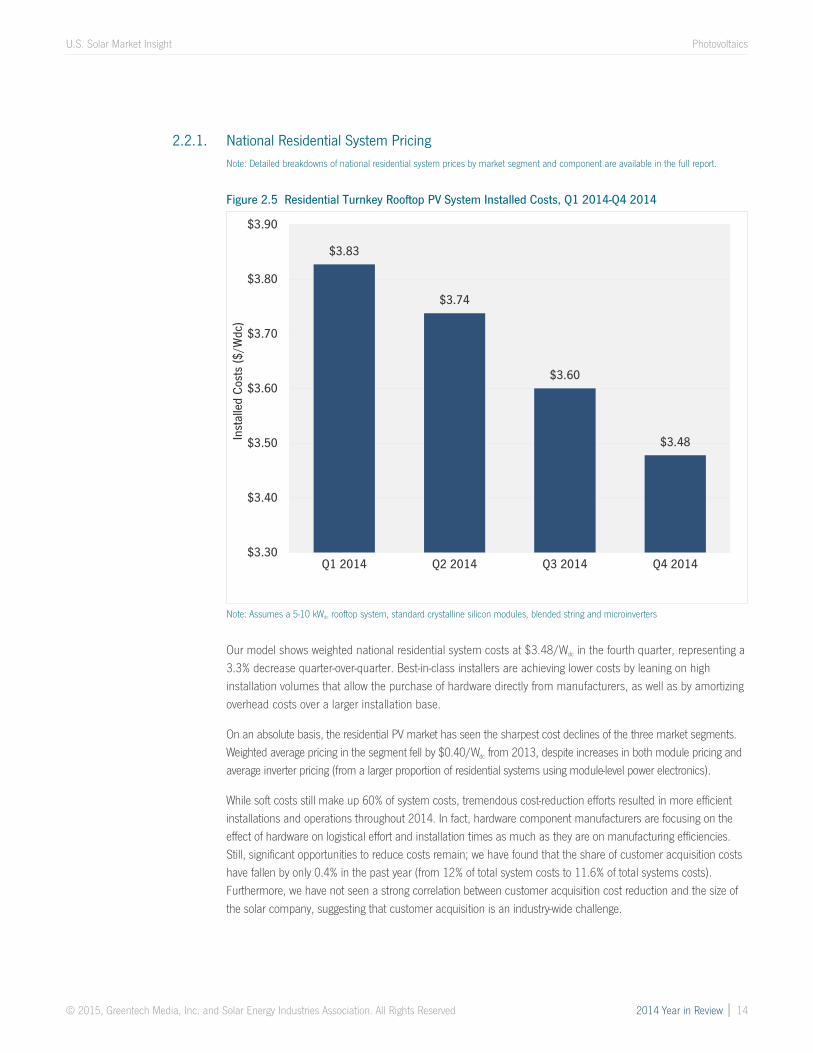
2.2.1. National Residential System PricingNote: Detailed breakdowns of national residential system prices by market segment and component are available in the full report.
Figure 2.5 Residential Turnkey Rooftop PV System Installed Costs, Q1 2014-Q4 2014
Note: Assumes a 5-10 kWdc rooftop system, standard crystalline silicon modules, blended string and microinverters
Our model shows weighted national residential system costs at $3.48/Wdc in the fourth quarter, representing a3.3% decrease quarter-over-quarter. Best-in-class installers are achieving lower costs by leaning on highinstallation volumes that allow the purchase of hardware directly from manufacturers, as well as by amortizingoverhead costs over a larger installation base.
On an absolute basis, the residential PV market has seen the sharpest cost declines of the three market segments.Weighted average pricing in the segment fell by $0.40/Wdc from 2013, despite increases in both module pricing andaverage inverter pricing (from a larger proportion of residential systems using module-level power electronics).
While soft costs still make up 60% of system costs, tremendous cost-reduction efforts resulted in more efficientinstallations and operations throughout 2014. In fact, hardware component manufacturers are focusing on theeffect of hardware on logistical effort and installation times as much as they are on manufacturing efficiencies.Still, significant opportunities to reduce costs remain; we have found that the share of customer acquisition costshave fallen by only 0.4% in the past year (from 12% of total system costs to 11.6% of total systems costs).Furthermore, we have not seen a strong correlation between customer acquisition cost reduction and the size ofthe solar company, suggesting that customer acquisition is an industry-wide challenge.
$3.83
$3.74
$3.60
$3.48
$3.30
$3.40
$3.50
$3.60
$3.70
$3.80
$3.90
Q1 2014 Q2 2014 Q3 2014 Q4 2014
Inst
alle
d Co
sts
($/W
dc)
U.S. Solar Market Insight Photovoltaics
© 2015, Greentech Media, Inc. and Solar Energy Industries Association. All Rights Reserved 2014 Year in Review │ 15
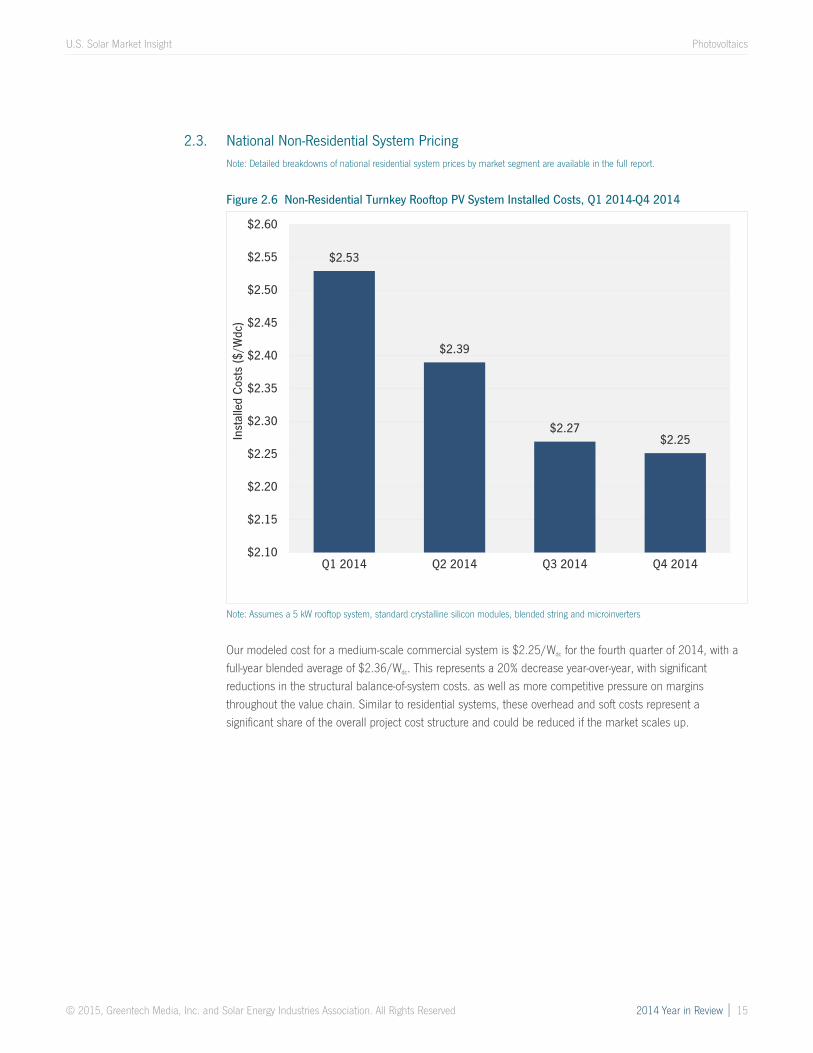
2.3. National Non-Residential System PricingNote: Detailed breakdowns of national residential system prices by market segment are available in the full report.
Figure 2.6 Non-Residential Turnkey Rooftop PV System Installed Costs, Q1 2014-Q4 2014
Note: Assumes a 5 kW rooftop system, standard crystalline silicon modules, blended string and microinverters
Our modeled cost for a medium-scale commercial system is $2.25/Wdc for the fourth quarter of 2014, with afull-year blended average of $2.36/Wdc. This represents a 20% decrease year-over-year, with significantreductions in the structural balance-of-system costs. as well as more competitive pressure on marginsthroughout the value chain. Similar to residential systems, these overhead and soft costs represent asignificant share of the overall project cost structure and could be reduced if the market scales up.
$2.53
$2.39
$2.27$2.25
$2.10
$2.15
$2.20
$2.25
$2.30
$2.35
$2.40
$2.45
$2.50
$2.55
$2.60
Q1 2014 Q2 2014 Q3 2014 Q4 2014
Inst
alle
d Co
sts
($/W
dc)
U.S. Solar Market Insight Photovoltaics
© 2015, Greentech Media, Inc. and Solar Energy Industries Association. All Rights Reserved 2014 Year in Review │ 16
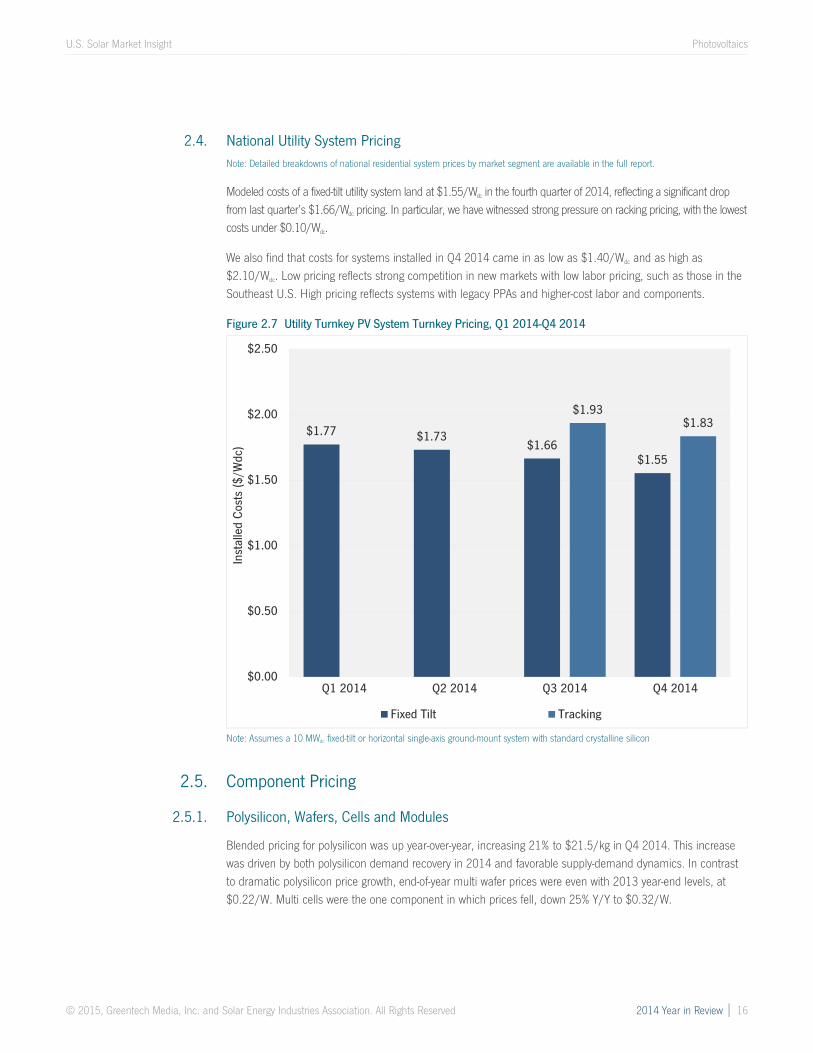
2.4. National Utility System PricingNote: Detailed breakdowns of national residential system prices by market segment are available in the full report.
Modeled costs of a fixed-tilt utility system land at $1.55/Wdc in the fourth quarter of 2014, reflecting a significant dropfrom last quarter’s $1.66/Wdc pricing. In particular, we have witnessed strong pressure on racking pricing, with the lowestcosts under $0.10/Wdc.
We also find that costs for systems installed in Q4 2014 came in as low as $1.40/Wdc and as high as$2.10/Wdc. Low pricing reflects strong competition in new markets with low labor pricing, such as those in theSoutheast U.S. High pricing reflects systems with legacy PPAs and higher-cost labor and components.
Figure 2.7 Utility Turnkey PV System Turnkey Pricing, Q1 2014-Q4 2014
Note: Assumes a 10 MWdc fixed-tilt or horizontal single-axis ground-mount system with standard crystalline silicon
2.5. Component Pricing
2.5.1. Polysilicon, Wafers, Cells and Modules
Blended pricing for polysilicon was up year-over-year, increasing 21% to $21.5/kg in Q4 2014. This increasewas driven by both polysilicon demand recovery in 2014 and favorable supply-demand dynamics. In contrastto dramatic polysilicon price growth, end-of-year multi wafer prices were even with 2013 year-end levels, at$0.22/W. Multi cells were the one component in which prices fell, down 25% Y/Y to $0.32/W.
$1.77 $1.73$1.66
$1.55
$1.93$1.83
$0.00
$0.50
$1.00
$1.50
$2.00
$2.50
Q1 2014 Q2 2014 Q3 2014 Q4 2014
Inst
alle
d Co
sts
($/W
dc)
Fixed Tilt Tracking
U.S. Solar Market Insight Photovoltaics
© 2015, Greentech Media, Inc. and Solar Energy Industries Association. All Rights Reserved 2014 Year in Review │ 17
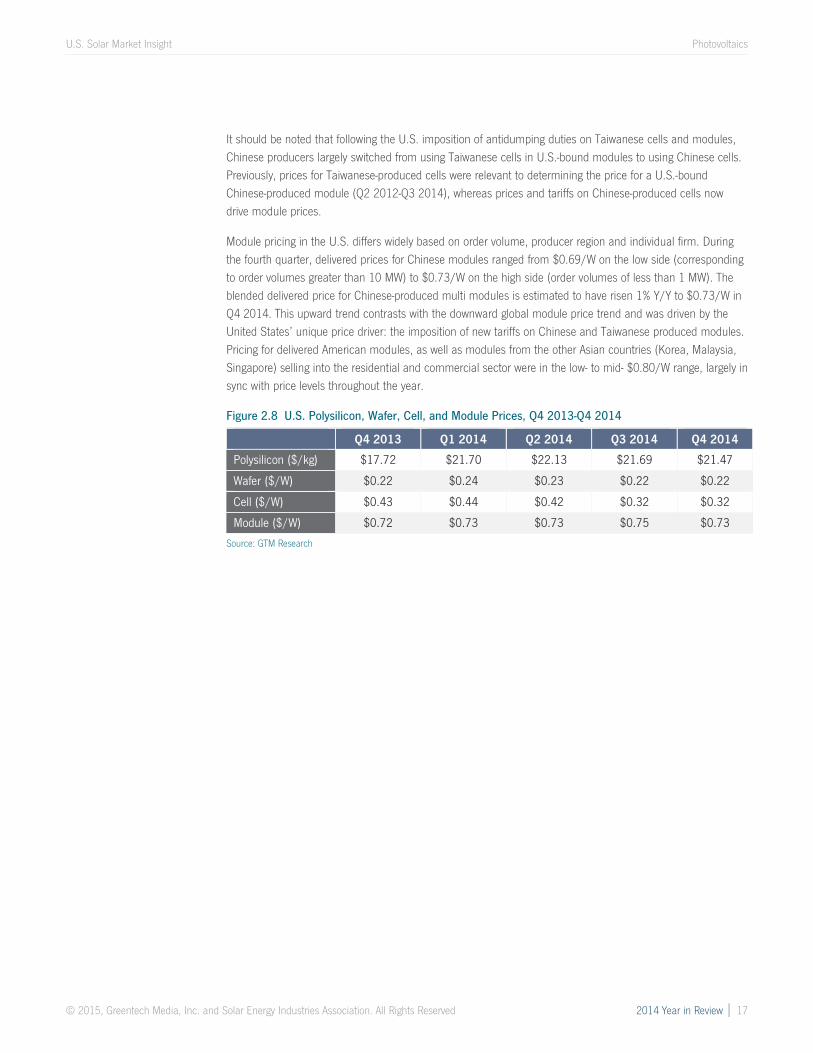
It should be noted that following the U.S. imposition of antidumping duties on Taiwanese cells and modules,Chinese producers largely switched from using Taiwanese cells in U.S.-bound modules to using Chinese cells.Previously, prices for Taiwanese-produced cells were relevant to determining the price for a U.S.-boundChinese-produced module (Q2 2012-Q3 2014), whereas prices and tariffs on Chinese-produced cells nowdrive module prices.
Module pricing in the U.S. differs widely based on order volume, producer region and individual firm. Duringthe fourth quarter, delivered prices for Chinese modules ranged from $0.69/W on the low side (correspondingto order volumes greater than 10 MW) to $0.73/W on the high side (order volumes of less than 1 MW). Theblended delivered price for Chinese-produced multi modules is estimated to have risen 1% Y/Y to $0.73/W inQ4 2014. This upward trend contrasts with the downward global module price trend and was driven by theUnited States’ unique price driver: the imposition of new tariffs on Chinese and Taiwanese produced modules.Pricing for delivered American modules, as well as modules from the other Asian countries (Korea, Malaysia,Singapore) selling into the residential and commercial sector were in the low- to mid- $0.80/W range, largely insync with price levels throughout the year.
Figure 2.8 U.S. Polysilicon, Wafer, Cell, and Module Prices, Q4 2013-Q4 2014
Q4 2013 Q1 2014 Q2 2014 Q3 2014 Q4 2014
Polysilicon ($/kg) $17.72 $21.70 $22.13 $21.69 $21.47
Wafer ($/W) $0.22 $0.24 $0.23 $0.22 $0.22
Cell ($/W) $0.43 $0.44 $0.42 $0.32 $0.32
Module ($/W) $0.72 $0.73 $0.73 $0.75 $0.73
Source: GTM Research
U.S. Solar Market Insight Photovoltaics
© 2015, Greentech Media, Inc. and Solar Energy Industries Association. All Rights Reserved 2014 Year in Review │ 18
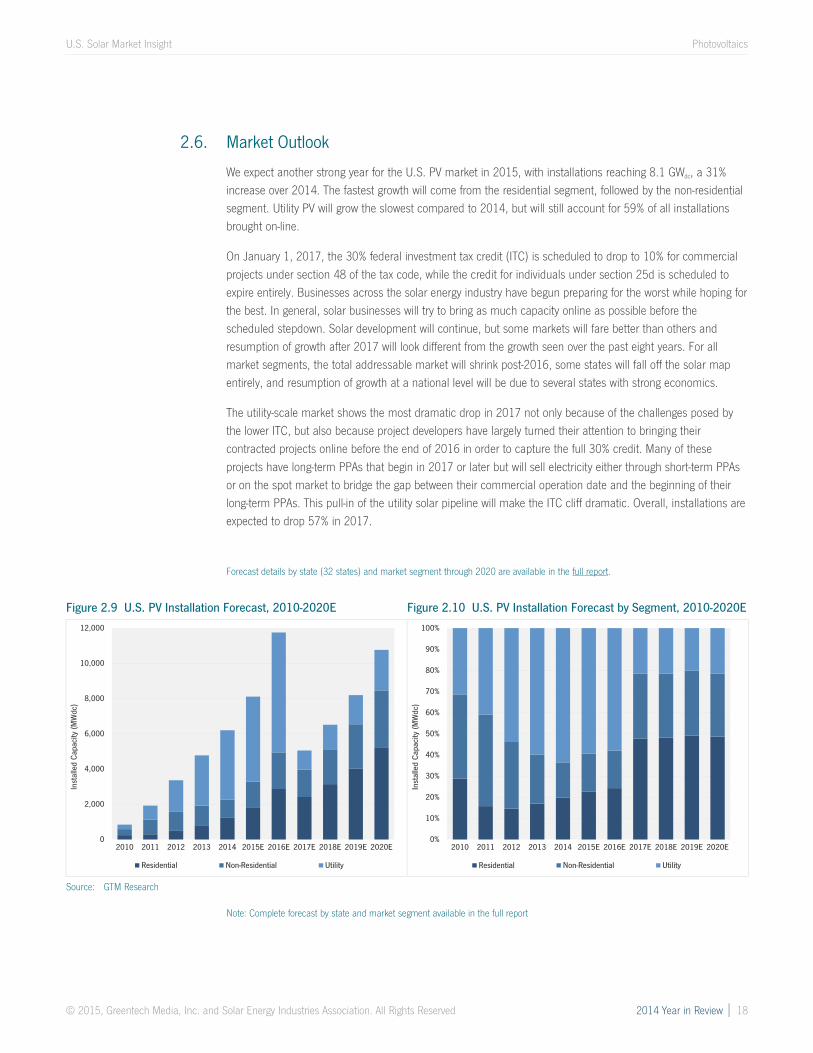
2.6. Market Outlook
We expect another strong year for the U.S. PV market in 2015, with installations reaching 8.1 GWdc, a 31%increase over 2014. The fastest growth will come from the residential segment, followed by the non-residentialsegment. Utility PV will grow the slowest compared to 2014, but will still account for 59% of all installationsbrought on-line.
On January 1, 2017, the 30% federal investment tax credit (ITC) is scheduled to drop to 10% for commercialprojects under section 48 of the tax code, while the credit for individuals under section 25d is scheduled toexpire entirely. Businesses across the solar energy industry have begun preparing for the worst while hoping forthe best. In general, solar businesses will try to bring as much capacity online as possible before thescheduled stepdown. Solar development will continue, but some markets will fare better than others andresumption of growth after 2017 will look different from the growth seen over the past eight years. For allmarket segments, the total addressable market will shrink post-2016, some states will fall off the solar mapentirely, and resumption of growth at a national level will be due to several states with strong economics.
The utility-scale market shows the most dramatic drop in 2017 not only because of the challenges posed bythe lower ITC, but also because project developers have largely turned their attention to bringing theircontracted projects online before the end of 2016 in order to capture the full 30% credit. Many of theseprojects have long-term PPAs that begin in 2017 or later but will sell electricity either through short-term PPAsor on the spot market to bridge the gap between their commercial operation date and the beginning of theirlong-term PPAs. This pull-in of the utility solar pipeline will make the ITC cliff dramatic. Overall, installations areexpected to drop 57% in 2017.
Forecast details by state (32 states) and market segment through 2020 are available in the full report.
Figure 2.9 U.S. PV Installation Forecast, 2010-2020E Figure 2.10 U.S. PV Installation Forecast by Segment, 2010-2020E
Source: GTM Research
Note: Complete forecast by state and market segment available in the full report
0
2,000
4,000
6,000
8,000
10,000
12,000
2010 2011 2012 2013 2014 2015E 2016E 2017E 2018E 2019E 2020E
Inst
alle
d Ca
paci
ty (M
Wdc
)
Residential Non-Residential Utility
0%
10%
20%
30%
40%
50%
60%
70%
80%
90%
100%
2010 2011 2012 2013 2014 2015E 2016E 2017E 2018E 2019E 2020E
Inst
alle
d Ca
paci
ty (M
Wdc
)
Residential Non-Residential Utility
U.S. Solar Market Insight Concentrating Solar Power
© 2015, Greentech Media, Inc. and Solar Energy Industries Association. All Rights Reserved 2014 Year in Review │ 19
3. Concentrating Solar PowerThe final quarter of 2013 kicked off the first wave of mega-scale CSP projects to be completed over the next fewyears, and Q1 2014 built on that momentum with 517 MWac brought on-line. This included BrightSource Energy’s392 MWac Ivanpah project and the second and final 125 MWac phase of NextEra’s Genesis solar project. While Q22014 and Q3 2014 were dormant for CSP, Abengoa finished commissioning its 250 MWac Mojave Solar project inDecember 2014. As a result, 2014 ranks as the largest year ever for CSP, with 767 MWac brought on-line. Thenext notable project slated for completion is SolarReserve’s 110 MWac Crescent Dunes project, which entered thecommissioning phase in February 2014 and is now expected to become fully operational before the end of March2015.
In 2016, growth prospects for the CSP market in the U.S. are bleak. On one hand, CSP when paired withstorage represents an attractive generation resource for utilities, offering a number of ancillary and resourceadequacy benefits. However, due to extensive permitting hurdles that have confronted CSP projects,developers are putting their CSP pipelines on hold given the short window to bring projects online before thefederal ITC is scheduled to expire at the end of 2016. Most notably, Abengoa’s Palen Solar project,BrightSource’s Hidden Hills project, and SolarReserve’s Rice Solar project are all delayed indefinitely.
Beyond 2016, the outlook for the CSP market will depend on further progress made towards mitigating earlystage development hurdles, lowering hardware costs, and strengthening the ancillary and capacity benefitsprovided by CSP paired with storage.
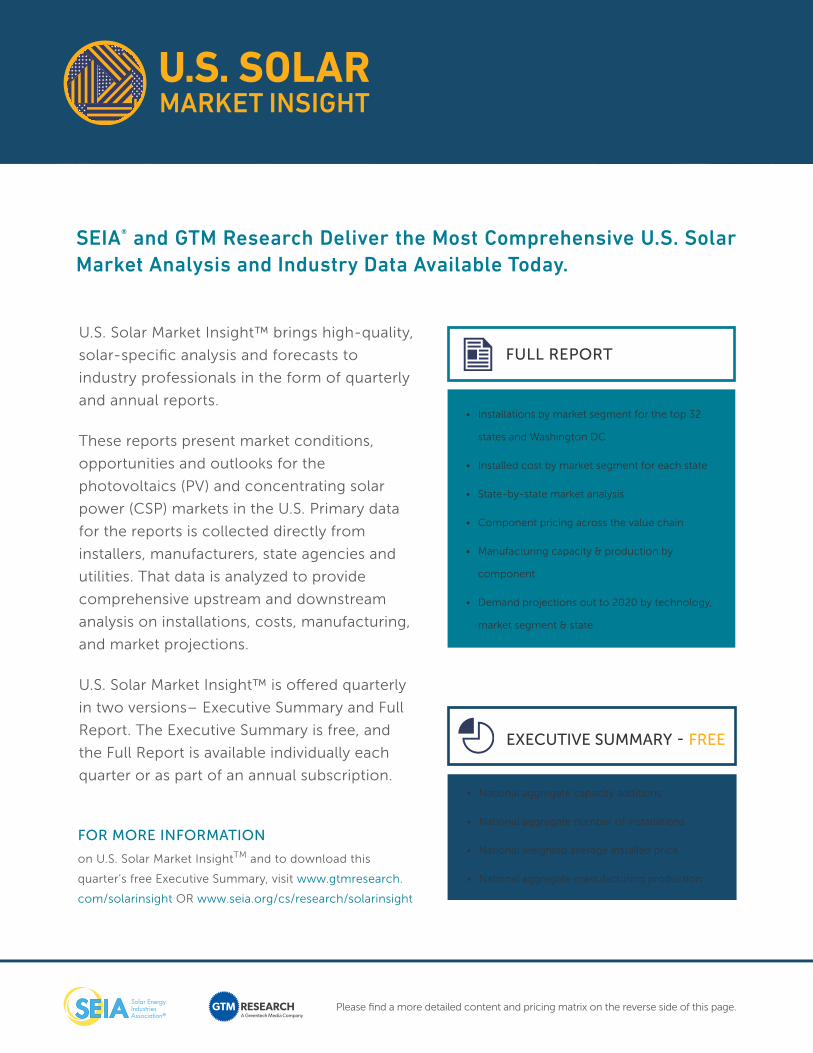
Please find a more detailed content and pricing matrix on the reverse side of this page.
U.S. Solar Market Insight™ brings high-quality,
solar-specific analysis and forecasts to
industry professionals in the form of quarterly
and annual reports.
These reports present market conditions,
opportunities and outlooks for the
photovoltaics (PV) and concentrating solar
power (CSP) markets in the U.S. Primary data
for the reports is collected directly from
installers, manufacturers, state agencies and
utilities. That data is analyzed to provide
comprehensive upstream and downstream
analysis on installations, costs, manufacturing,
and market projections.
U.S. Solar Market Insight™ is offered quarterly
in two versions– Executive Summary and Full
Report. The Executive Summary is free, and
the Full Report is available individually each
quarter or as part of an annual subscription. • National aggregate capacity additions
• National aggregate number of installations
• National weighted average installed price
• National aggregate manufacturing production
EXECUTIVE SUMMARY - FREE
• Installations by market segment for the top 32
states and Washington DC
• Installed cost by market segment for each state
• State-by-state market analysis
• Component pricing across the value chain
• Manufacturing capacity & production by
component
• Demand projections out to 2020 by technology,
market segment & state
FOR MORE INFORMATION
on U.S. Solar Market InsightTM and to download this
quarter’s free Executive Summary, visit www.gtmresearch.
com/solarinsight OR www.seia.org/cs/research/solarinsight
SEIA® and GTM Research Deliver the Most Comprehensive U.S. Solar Market Analysis and Industry Data Available Today.
FULL REPORT
A Greentech Media Company
U.S. SOLARMARKET INSIGHT
Installations + Market
Analysis
• Shipments vs.
Installations
• By Market Segment
• By State
• Number of Installations
Installed Price
Manufacturing
• Polysilicon
• Wafers
• Cells
• Modules
• Active U.S. Manufacturing
Plants
• Inverters
Component Pricing
• Polysilicon, Wafers, Cells
and Modules
• Inverters
• PV Mounting
Structures
Demand Projections
• By Market Segment
• By State
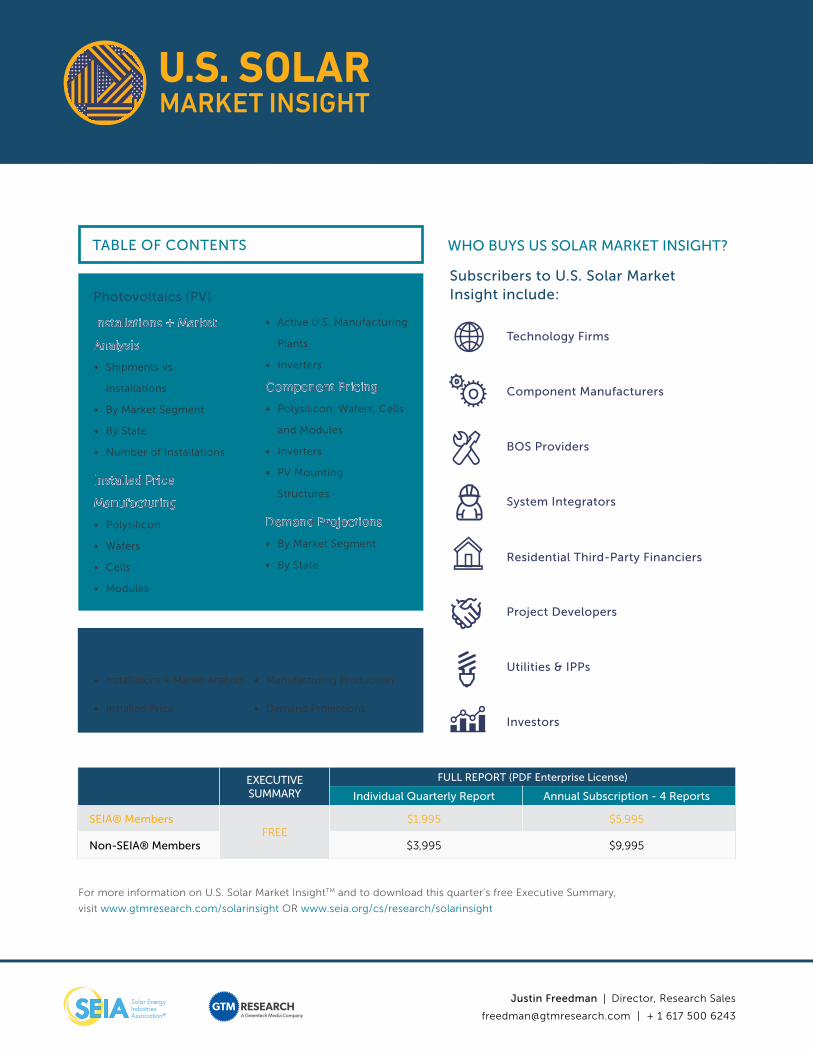
TABLE OF CONTENTS
Photovoltaics (PV)
• Installations + Market Analysis
• Installed Price
• Manufacturing Production
• Demand Projections
Concentrating Solar Power (CSP)
Subscribers to U.S. Solar Market Insight include:
Technology Firms
Component Manufacturers
BOS Providers
System Integrators
Residential Third-Party Financiers
Project Developers
Utilities & IPPs
Investors
WHO BUYS US SOLAR MARKET INSIGHT?
EXECUTIVE SUMMARY
FULL REPORT (PDF Enterprise License)
Individual Quarterly Report Annual Subscription - 4 Reports
SEIA® MembersFREE
$1,995 $5,995
Non-SEIA® Members $3,995 $9,995
For more information on U.S. Solar Market InsightTM and to download this quarter’s free Executive Summary,
visit www.gtmresearch.com/solarinsight OR www.seia.org/cs/research/solarinsight
Justin Freedman | Director, Research Sales
[email protected] | + 1 617 500 6243A Greentech Media Company
U.S. SOLARMARKET INSIGHT