u.s. navy pilot competence: an exploratory study of flight
TRANSCRIPT

U.S. NAVY PILOT COMPETENCE: AN EXPLORATORY STUDY OF FLIGHT
SIMULATION TRAINING
VERSUS ACTUAL AIRCRAFT TRAINING
Dr. Aaron Judy, Lead Test Engineer, Naval Air Warfare Center Training Systems Division
Dr. Thomas Gollery, Professor of Education, Southeastern University
ABSTRACT
The purpose of this study was to investigate the relationships between US Navy T-45C flight
simulation training time, actual aircraft training time, and intermediate and advanced jet pilot
competence as measured by the Naval Standard Score (NSS). Examining the relationships
between US Navy T-45C flight simulation time and actual aircraft flight time may provide further
information on flight simulation training versus actual aircraft training to aviation authorities,
flight instructors, the military aviation community, the commercial aviation community, and
academia. The study was non-experimental, correlational, causal-comparative with an emphasis
upon the establishment of mathematic and predictive relationships using archival data from the
Chief of Naval Air Training (CNATRA) Training Information System’s (TIMS) database. CNATRA
aircraft hours, flight simulation hours, and NSS scores of intermediate and advanced flight
students from 2015 to 2017 were analyzed and compared. Actual aircraft time was found to be a
significant predictor of NSS scores for both intermediate and advanced pilot trainees.
Implications of the study include recommendations for future research and strategies to improve
flight simulation in pilot training.
4
Judy and Gollery: Flight Simulation Training Versus Actual Aircraft Training
JASSRP Vol. 1 [2019]
Introduction
Military pilot training requires an enormous investment of time, energy, and resources.
In fiscal year 2017, the United States Department of Defense spent approximately 1.6 billion
dollars on flight training (Department of Defense, 2016). The Chief of Naval Operations (CNO)
established a simulator training strategy in 2014 that stated, “To the maximum extent
practicable, live training should be completed by simulators or fleet synthetic training where
training effectiveness, safety, and operational readiness are not compromised” (Department of
the Navy, 2014, p. 2). However, research suggests that flight simulation, though suitable for
training a myriad of tasks required, may not be the best method for training certain critical
aircraft tasks, such as those requiring significant mental problem-solving and high levels of
performance (Beaubien, Stacy, Wiggins, & Lucia, 2016). Therefore, this study was conducted
to investigate the relationships between flight simulation training, actual aircraft training, and
intermediate and advanced jet pilot competence as measured by the Naval Standard Score
(NSS).
The Department of the Navy is responsible for training both US Navy (USN) and US
Marine (USMC) pilots at various Training Air Wings located across the United States. Military
pilot training is extensive, costly, and in high demand. With the advent of computer-based
technologies, pilot training via computer simulations became standard practice in military pilot
training and has been, on the whole, very effective and efficient in developing the skills of naval
pilots (Department of the Navy, 2010). Both the USN and the USMC are very interested in
research designed to determine the optimal amount of training time necessary to achieve pilot
expertise in various aircraft. A major question posed by the USN and the USMC focuses on the
feasibility of reducing actual aircraft training time, which is labor and cost intensive, using
5
Journal of Applied Social Science Research and Practice, Vol. 1 [2019]
https://firescholars.seu.edu/jassrp/vol1/iss1/3

flight simulation training. In 2010, the Navy estimated that 61% of flight training should be
actual aircraft training (Department of the Navy, 2010). This important question was the
impetus for the study. Comparing actual aircraft training time and flight simulation training
time to overall pilot competence would make an important contribution to policy and decision-
making among the nation’s military forces.
Naval Standard Score (NSS)
The USN and USMC currently train fixed-wing pilots through Command Training
Wings located across the U.S. Primary training, which is the introduction to jet training, is
conducted in a Beechcraft T-6B Texan aircraft located at Training Wing FOUR in Corpus
Christi, Texas, or at Training Wing FIVE located in Milton, Florida. Primary training takes
approximately 28 weeks to complete. Upon completion of primary flight training, jet pilots
move into intermediate training, followed by advanced training before earning their Wings of
Gold. Intermediate and advanced flight training is conducted in a Boeing T-45C Goshawk
aircraft at Training Wing ONE in Meridian, Mississippi or at Training Wing TWO in
Kingsville, Texas. Intermediate training takes approximately 27 weeks to complete, and
advanced training takes approximately 25 weeks to complete. Pilots who graduate from
Training Wing ONE and TWO supply the operational needs of the USN and USMC as pilots
for F/A-18 aircraft and next-generation F-35 jet aircraft.
Overall pilot effectiveness is measured by the NSS as determined by the flight
instructor. The NSS is used to measure pilot competencies and skills for both the USN and
USMC flight students. Chief of Naval Air Training (CNATRA) considers the NSS score to be
a valid method of assessing pilot competency for the USN/USMC flight training program
(Naval Air Training Command, 2014). The NSS is calculated separately for each flight
6
Judy and Gollery: Flight Simulation Training Versus Actual Aircraft Training
JASSRP Vol. 1 [2019]

student who completes each phase of training (primary, intermediate, and advanced). This
study focused only on training times of flight students in the intermediate and advanced
phases of training.
Review of Literature
Bloom’s taxonomy of the cognitive domain is one of the most well-known models for
describing thinking, learning, and instruction (Palmer, 2001). Bloom (1956) conducted
extensive research leading to the identification of six levels of cognitive thought from lowest
to highest complexity: knowledge, comprehension, application, analysis, synthesis, and
evaluation (Bloom, 1956). Each of the levels of thinking includes and builds on the previous
levels in the hierarchy. Over time, the taxonomy of the cognitive domain came to be known
as Bloom’s taxonomy.
Bloom’s Taxonomy and Flight Training
Knowledge, perception, problem-solving, decision-making, awareness, and intellect
are all critical elements of flight training. As flight students apply higher order thinking skills
(HOTS) during flight training, they are continuously constructing knowledge and skills. The
researcher proposed that flight training is similar to Bloom’s taxonomy in that flight training
builds upon each level of pilot training designated by the Federal Aviation Administration
(FAA) and requires increased levels of complexity and performance as depicted in Figure 1.
7
Journal of Applied Social Science Research and Practice, Vol. 1 [2019]
https://firescholars.seu.edu/jassrp/vol1/iss1/3
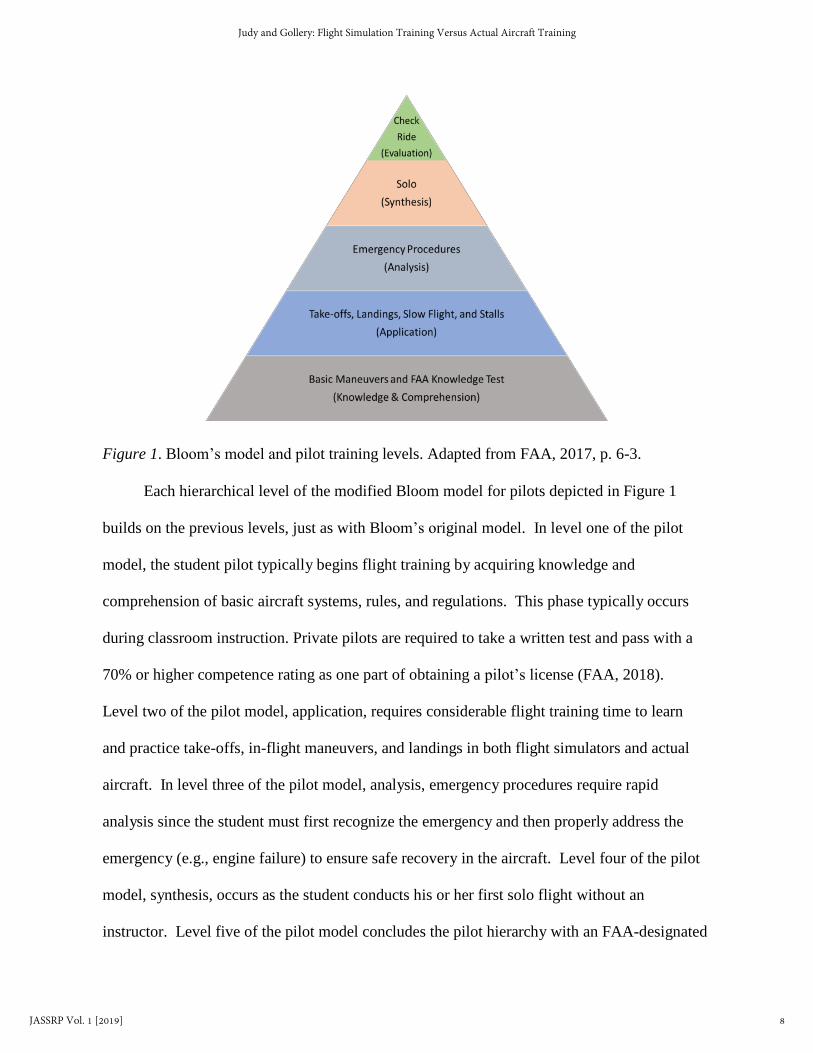
Figure 1. Bloom’s model and pilot training levels. Adapted from FAA, 2017, p. 6-3.
Each hierarchical level of the modified Bloom model for pilots depicted in Figure 1
builds on the previous levels, just as with Bloom’s original model. In level one of the pilot
model, the student pilot typically begins flight training by acquiring knowledge and
comprehension of basic aircraft systems, rules, and regulations. This phase typically occurs
during classroom instruction. Private pilots are required to take a written test and pass with a
70% or higher competence rating as one part of obtaining a pilot’s license (FAA, 2018).
Level two of the pilot model, application, requires considerable flight training time to learn
and practice take-offs, in-flight maneuvers, and landings in both flight simulators and actual
aircraft. In level three of the pilot model, analysis, emergency procedures require rapid
analysis since the student must first recognize the emergency and then properly address the
emergency (e.g., engine failure) to ensure safe recovery in the aircraft. Level four of the pilot
model, synthesis, occurs as the student conducts his or her first solo flight without an
instructor. Level five of the pilot model concludes the pilot hierarchy with an FAA-designated
8
Judy and Gollery: Flight Simulation Training Versus Actual Aircraft Training
JASSRP Vol. 1 [2019]
examiner check-ride evaluation. As identified in Figure 1, the modified Bloom model for
pilots developed by the researcher provides a conceptual framework for discussion of pilot
training.
Flight Simulation Training
A recent study of Navy F/A-18 pilots investigated methods to measure the ways
learning occurs during simulated carrier landings (Beaubien et al., 2016). The authors studied
fifteen Navy F/A-18 pilots who flew 24 landing passes in a high-fidelity simulator (Beaubien
et al., 2016). Measures of performance (MOP) scores were analyzed for each landing and
assessed during the last 18-23 seconds of the final approach. The MOP scores were then
averaged, and each pilot was assigned a score. Based on the simulator analysis, the MOP
scores demonstrated that performance had improved over time (Beaubien et al., 2016).
However, the measures of learning (MOL) scores revealed that auditory and/or visual cues
provided by the flight simulator actually resulted in reduced mean scores on final approach to
landing. In other words, negative transfer of learning occurred from the simulator to actual
pilot performance in the aircraft (Beaubien et al., 2016). Based on this study, both MOP and
MOL scores should be assessed when conducting simulated flight training or to help improve
flight simulation.
Actual Aircraft Training
Problem-solving, learning, and cognition are all key components of flight training and
include a plethora of research studies in a wide variety of disciplines. Classifying the cognitive
demands on pilots using a simulated device is an important method of describing and
measuring learning during flight training to help ensure proficiency (Hoke, Reuter, Romeas,
Montariol, Schnell, & Faubert, 2017). Hoke et al. (2017) conducted a study using a cognitive
9
Journal of Applied Social Science Research and Practice, Vol. 1 [2019]
https://firescholars.seu.edu/jassrp/vol1/iss1/3

assessment tool set (CATS) system, which was worn under a pilot’s flight suit. The CATS
system did not interfere with flying tasks and provided a real-time assessment of the cognitive
workload during flight training. The study’s sample included 10 low-time (100-300 flight
hours) pilots ranging in age from 20 to 25 and holding a valid U.S. private pilot certificate with
a Class III medical certification (Hoke et al., 2017). A Class III medical certification is granted
by a designated FAA medical examiner for recreational and private pilots. The study used
Neurotracker (NT) to evaluate the cognitive workload when piloting an L-29 jet trainer aircraft
and a L-29 simulator. Neurotracker is a scientific instrument developed to help improve
perceptual-cognitive abilities among athletes. The Neurotracker, also known as three-
dimensional multiple object tracking (3D-MOT), isolates a number of mental skills used for
reading and training and closely monitors the brain’s processes during complex motion.
Faubert and Sidebottom (2012) developed the 3D-MOT methodology to stimulate and measure
brain networks that work together during motion processing, attention processing, and working
memory. Using NT methodology, the Hoke et al. (2017) study revealed that flying, whether in
an aircraft or a flight simulator, is a cognitively demanding task. However, the results of the
study also showed that the pilots’ maneuvers as measured by NT were more cognitively
demanding when flying the L-29 jet aircraft than when flying in an L-29 simulator (Hoke et al.,
2017). This study provides empirical evidence related to the questions the USN and USMC
seek to answer.
Flight Simulator Effectiveness
US Navy training has traditionally focused on live training events; however, ongoing
budget constraints have served to promote the use of simulators to train pilots (Schank, Thie,
Graff, Beel, & Sollinger, 2002). In 2002, the Department of the Navy asked the RAND
10
Judy and Gollery: Flight Simulation Training Versus Actual Aircraft Training
JASSRP Vol. 1 [2019]

National Defense Research Institute to study the ways that a mix of classroom instruction,
simulation training, and aircraft training events could increase pilot training effectiveness. The
RAND study conducted by Schank et al. (2002) focused on two airborne training programs
within the Navy’s F/A-18 and the P-3C squadrons. Additionally, RAND also conducted a
trade-off analysis between live and simulated training events while analyzing flying hours and
simulator use for US Navy units. However, the data were based on best estimates and data that
were readily available. The study found that F/A-18 simulators made only a modest
contribution to flight training due to poor accessibility by pilots and low fidelity; however, P-
3C simulators were more widely used and accepted by the P-3C pilot community. The P-3C
simulators were used more often than the F/A-18 simulators by pilots, who judged that P-3C
simulators replicated the flight environment better than the F/A-18 simulators.
The Navy employs four types of F/A-18 simulators, although some simulators are in
the process of being replaced or are currently in the process of hardware and software
upgrades. The RAND study found that the F/A-18 simulators were used by the fleet training
schools 50% to 60% of the time; but fleet operational units (deployed units) used the
simulators 20% of time, and they were unused 20% of the time. The RAND researchers also
conducted interviews and determined that pilots frequently do not use the simulators due to a
lack of realistic mission profiles, lack of fidelity between the simulation and actual flight time,
and lack of availability. In 2002, pilots recognized the limitations and strengths of different
types of simulators and made their opinions known, both verbally and in their non-use of the
simulators.
An evaluation study by Koglbauer, Riesel, and Braunstingl (2016) was conducted on
the effects of combining actual aircraft and simulator training on student pilots’ skill
11
Journal of Applied Social Science Research and Practice, Vol. 1 [2019]
https://firescholars.seu.edu/jassrp/vol1/iss1/3

acquisition. The evaluation consisted of 61 general aviation flight students with zero flight
hours and approximately 40 hours of classroom training. The evaluation employed a pre- and
post-test design using the repeated measures t-test to compare simulator scores and scores on
aircraft flight tests. The alpha level was set at 0.05, and the t-test of dependent samples and
Pearson’s correlation coefficient were used to analyze the data. The results indicated that the
students’ aircraft flight performance scores were significantly higher on the post-test (p < .01)
after using the simulator. Also, a significant positive correlation was found between instructor
grades in the simulator and the aircraft flight post-test (p < .01). The study indicated that a
combination of actual aircraft training and simulator training have positive effects on
beginning pilots during actual flight.
Methodology
The current study was non-experimental, correlational, causal-comparative research
using archival data from the CNATRA Training Information System (TIMS) database. Chief
of Naval Air Training aircraft hours, flight simulation hours, and NSS scores of intermediate
and advanced flight students from 2015 to 2017 were analyzed and compared.
Sample
The study’s sample was purposive and obtained from CNATRA’s TIMS database
from years 2015 to 2017. The dataset was purposive since the data were selected for only
intermediate and advanced flight students who trained with the T-45C Goshawk and T-45C
operational flight trainer (OFT). Additionally, the years 2015 to 2017 were chosen to ensure
reliability and validity by limiting changes over time in simulation upgrades or aircraft
technology. Participants included all USN and USMC intermediate and advanced T-45C
Goshawk flight student completers from 2015 to 2017 from Training Wings ONE and TWO.
12
Judy and Gollery: Flight Simulation Training Versus Actual Aircraft Training
JASSRP Vol. 1 [2019]
The sample size consisted of 358 intermediate flight students and 334 advanced flight
students from Training Wings ONE and TWO. Flight students are required to complete a
minimum number of aircraft training hours and flight simulation hours, but students can request
more unproctored time in the simulator; as a result, simulator times are different for each
student.
The study was designed to compare actual aircraft training hours and flight simulation
training hours and their relationships to the naval standard score (NSS) of intermediate and
advanced USN and USMC flight students. The independent variables were actual aircraft
hours and flight simulation hours. The independent variables were continuous, interval-level
data. The dependent variable was the NSS score, which was normalized by the Navy as
interval-level data with a NSS range of 20 to 80, mean of 50, and a standard deviation of 10.
The researcher did not analyze any demographic data such as gender, military rank, or
age. The study examined only USN and USMC actual aircraft hours, flight simulation hours,
and the NSS for years 2015 to 2017. The study investigated the relationships between the T-
45C aircraft and associated T-45C OFT flight simulator in order to control key variables and
to help ensure comparability of data.
Instrumentation
The independent variables were actual aircraft hours and flight simulation hours.
Actual aircraft hours were flight hours completed in the T-45C Goshawk aircraft as recorded
in the CNATRA TIMS database. Actual aircraft hours were flown in the T-45C Goshawk, a
highly maneuverable, Boeing turbofan jet military training aircraft, as depicted in Figure 2
(Boeing, 2018).
13
Journal of Applied Social Science Research and Practice, Vol. 1 [2019]
https://firescholars.seu.edu/jassrp/vol1/iss1/3
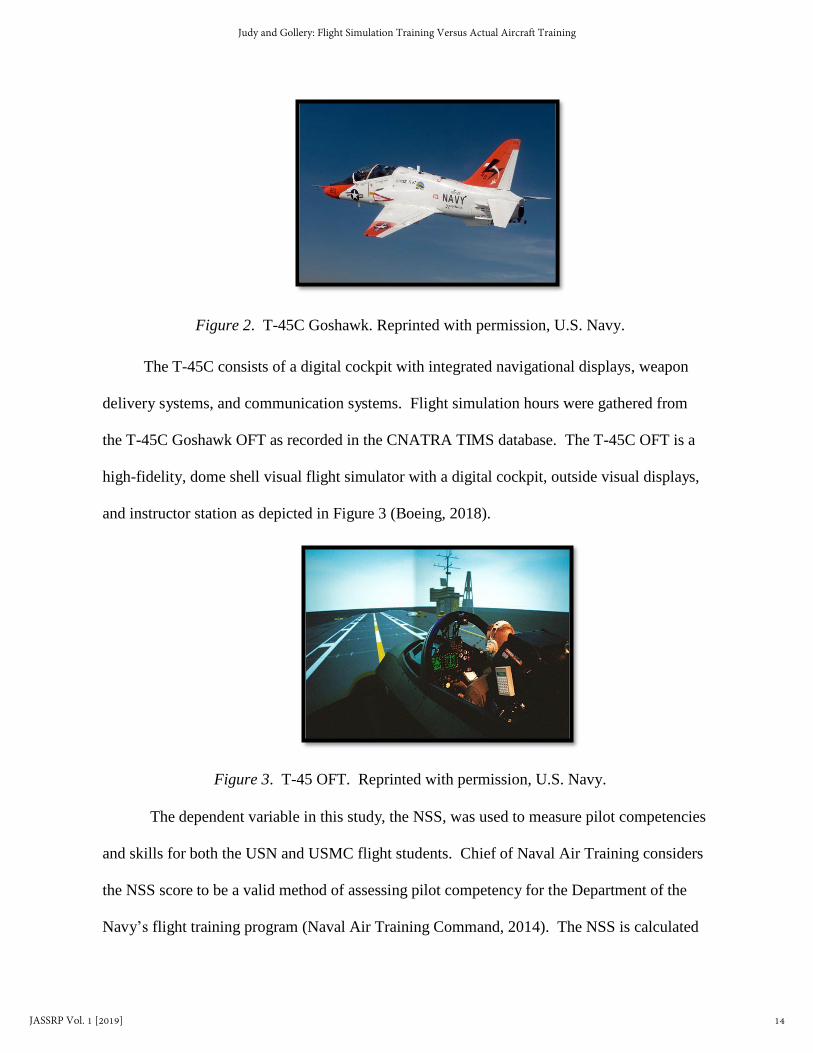
Figure 2. T-45C Goshawk. Reprinted with permission, U.S. Navy.
The T-45C consists of a digital cockpit with integrated navigational displays, weapon
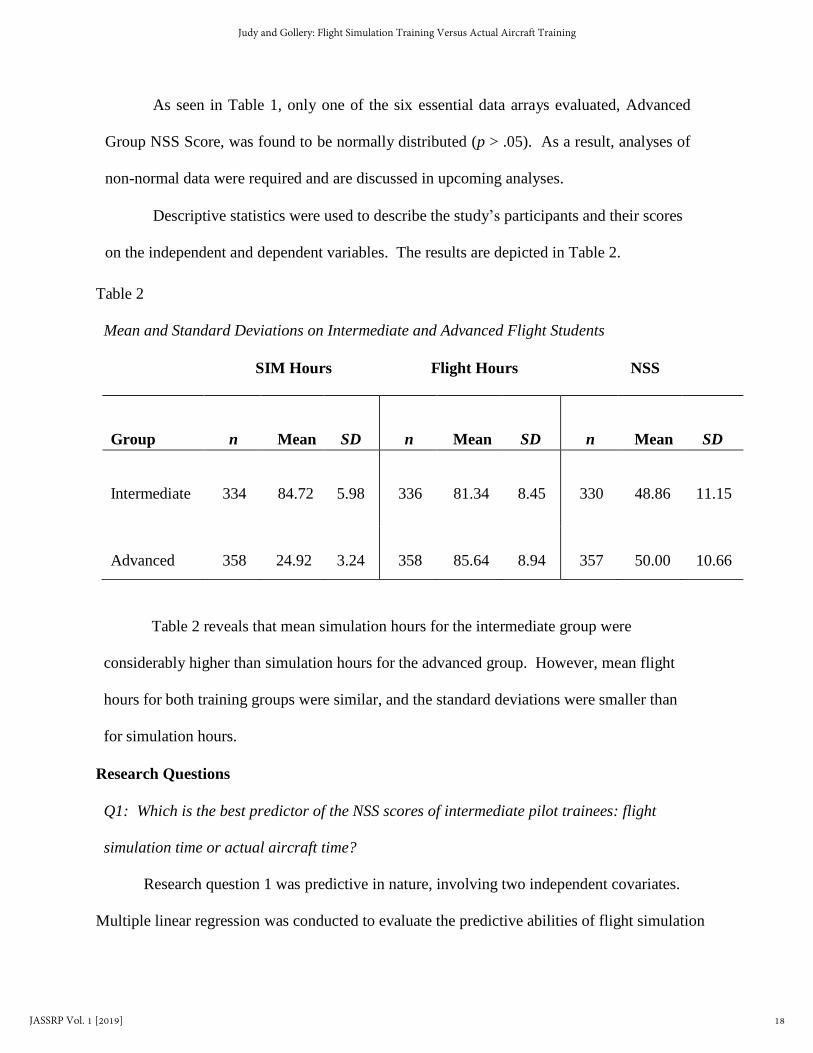
delivery systems, and communication systems. Flight simulation hours were gathered from
the T-45C Goshawk OFT as recorded in the CNATRA TIMS database. The T-45C OFT is a
high-fidelity, dome shell visual flight simulator with a digital cockpit, outside visual displays,
and instructor station as depicted in Figure 3 (Boeing, 2018).
Figure 3. T-45 OFT. Reprinted with permission, U.S. Navy.
The dependent variable in this study, the NSS, was used to measure pilot competencies
and skills for both the USN and USMC flight students. Chief of Naval Air Training considers
the NSS score to be a valid method of assessing pilot competency for the Department of the
Navy’s flight training program (Naval Air Training Command, 2014). The NSS is calculated
14
Judy and Gollery: Flight Simulation Training Versus Actual Aircraft Training
JASSRP Vol. 1 [2019]

separately for each flight student who completes each phase of training (primary, intermediate,
and advanced). The NSS is a normalized, cumulative score ranging from 20 to 80 and is
based on training events’ scores. The mean NSS is 50 with a standard deviation of 10.
During all three levels of training, a NSS score greater than 50 is considered by the Navy to be
above average, and a score of 60 would imply one standard deviation above average. Navy
flight students completing primary training with an NSS score less than 50 are not eligible to
fly pilot strike aircraft (e.g., F/A 18); Marine Corps flight students with an NSS less than 52
are not eligible to pilot Strike aircraft (Naval Air Training Command, 2014). This study
focused on training times of flight students in the intermediate and advanced phases of
training.
Data were collected from the CNATRA TIMS database and exported into a Microsoft
Office Excel file. Flight student data were then imported into Statistical Package for the
Social Sciences Version 24 (SPSS) for analysis purposes.
Data Analyses
Descriptive statistical techniques were used to analyze the archival dataset.
Specifically, missing data, essential demographic variables, and data array normality tests
was conducted for reporting purposes. The mean was calculated for flight simulation hours,
actual aircraft hours, and the NSS scores for both intermediate and advanced flight training
students. Additionally, Cohen’s d and Cohen’s q were used to evaluate the magnitude of
effect sizes. The alpha level of .05 was utilized as the threshold value for determining
statistical significance.
In advance of comparative analyses requiring the assumption of normality, the study’s
data arrays were assessed for normality using the Shapiro-Wilk test. To address the first and
15
Journal of Applied Social Science Research and Practice, Vol. 1 [2019]
https://firescholars.seu.edu/jassrp/vol1/iss1/3

second research questions, multiple linear regression was used to determine the significant
predictor(s) of the NSS scores. The independent variables were flight simulation time and
actual aircraft time; the dependent variables were the NSS scores of intermediate pilot trainees
and of advanced pilot trainees. Using the Fisher r to z transformation test statistic, the
difference in correlations between simulation time and aircraft time and NSS was evaluated
for statistical significance. Cohen’s q test statistic was used to evaluate the effect size of
correlations between simulation time and aircraft time. The alpha level of .05 was utilized as
the threshold value for determining statistical significance.
In light of the non-normal distribution of the data related to the comparison in research
question three, the Mann-Whitney U test was used to evaluate the statistical significance of the
difference between mean ranks for training type (flight simulation time versus actual aircraft
time) and training phase (intermediate and advanced). Cohen’s d statistic was used to
evaluate the magnitude of difference of mean ranking (effect size) in the respective
comparisons. The alpha level of .05 was utilized as the threshold value for determining
statistical significance.
Ancillary analyses were also conducted using Chi-Square to compare the intermediate
and advanced training groups’ mean scores on the NSS to determine whether significant
differences existed. Scores on the NSS were disaggregated into three different NSS sets (SS ≤
50, NSS +1 Standard Deviation (SD), and NSS + 2 SD) and then compared based on trainee
group. The alpha level of .05 was utilized as the threshold value for determining statistical
significance of differences.
16
Judy and Gollery: Flight Simulation Training Versus Actual Aircraft Training
JASSRP Vol. 1 [2019]

Results
Prior to formally addressing the research questions, preliminary analyses of the study’s
data were conducted. Specifically, missing data analysis, data array normality analyses, and
descriptive analyses of study variables were conducted.
Frequencies and percentages of missing data were analyzed using descriptive
statistical techniques. With regard to the three essential data arrays (simulation hours, flight
hours, and NSS scores), a total of nine data points of a possible 2,073 (0.43%) were identified
as missing. In light of the minimal degree of missing data (< 1.0%), the researcher
determined that imputation of missing data points within the essential arrays was not
necessary based on Schafer’s (1999) assertion that a missing data rate of 5% or less is
inconsequential.
In advance of comparative analyses requiring the assumption of normality, the study’s
data arrays were assessed for normality/relative normality using the Shapiro-Wilk test.
Results of the Shapiro-Wilk test are depicted in Table 1.
Table 1
Shapiro-Wilk Test Results by Training Type, Training Group, and NSS score
Group S-W
SIM Ho
df
urs
p
S-W
Flight Hours
df p
S-W
NSS
df
P
Intermediate
0.86
328
.000*
0.93
328
.000*
0.99
328
.003* n = 334
Advanced
0.86
357
.000*
0.83
357
.000*
0.99
357
.68a
n = 358
a p > .05 *p < .05
17
Journal of Applied Social Science Research and Practice, Vol. 1 [2019]
https://firescholars.seu.edu/jassrp/vol1/iss1/3
As seen in Table 1, only one of the six essential data arrays evaluated, Advanced
Group NSS Score, was found to be normally distributed (p > .05). As a result, analyses of
non-normal data were required and are discussed in upcoming analyses.
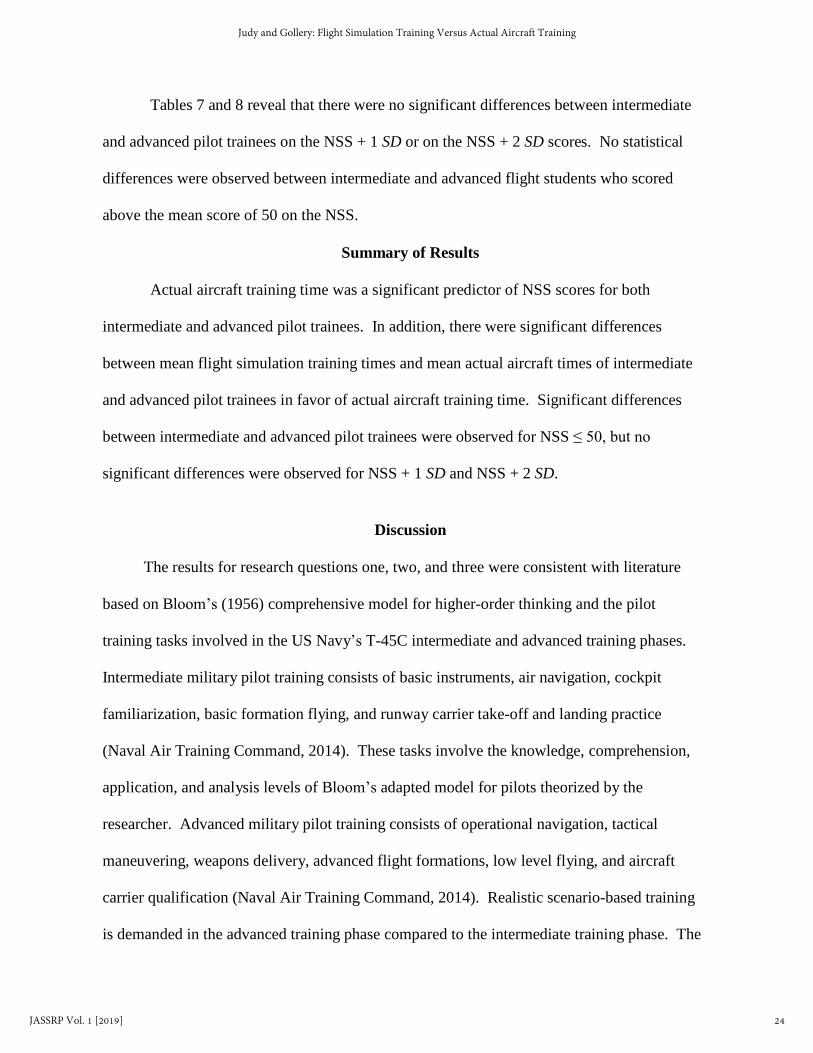
Descriptive statistics were used to describe the study’s participants and their scores
on the independent and dependent variables. The results are depicted in Table 2.
Table 2
Mean and Standard Deviations on Intermediate and Advanced Flight Students
SIM Hours Flight Hours NSS
Group
n
Mean
SD
n
Mean
SD
n
Mean
SD
Intermediate
334
84.72
5.98
336
81.34
8.45
330
48.86
11.15
Advanced
358
24.92
3.24
358
85.64
8.94
357
50.00
10.66
Table 2 reveals that mean simulation hours for the intermediate group were
considerably higher than simulation hours for the advanced group. However, mean flight
hours for both training groups were similar, and the standard deviations were smaller than
for simulation hours.
Research Questions
Q1: Which is the best predictor of the NSS scores of intermediate pilot trainees: flight
simulation time or actual aircraft time?
Research question 1 was predictive in nature, involving two independent covariates.
Multiple linear regression was conducted to evaluate the predictive abilities of flight simulation
18
Judy and Gollery: Flight Simulation Training Versus Actual Aircraft Training
JASSRP Vol. 1 [2019]

training time and actual aircraft training time. Table 3 depicts the results of the statistical test for
the intermediate group of pilot trainees.
Table 3
Prediction of NSS by Training Type of Intermediate Group (n=334)
Model Β Standard Error Standardized β
Intercept 100.26 9.39
Simulation Training -0.02 0.12 -.01
Aircraft Training -0.61 0.12 -.32***
***p < .001
The results indicated that actual aircraft training time was a strong, significant
(p < .001) predictor of NSS scores of intermediate pilot trainees. Flight simulation training
time was not a significant predictor of NSS scores of intermediate pilot trainees. The
regression weight (β = -0.61) indicates that for every one unit increase in aircraft training time
there is a -0.61 decrease in the NSS score. In other words, for every 1 hour increase in aircraft
training time, there is a -0.61 decrease in the NSS score. The -0.61 decrease in the NSS score
could possibly point to negative transfer from simulation training or the increased complexity
of training in the actual aircraft. Additionally, the -0.61 could simply be related to the student
pilot’s learning curve transition from simulated flight to real-flight in the actual T-45 aircraft.
The significant, predictive effect for actual aircraft training method in this sample is
considered medium (ES = .12) (Field, 2013). Using the Fisher r to z transformation test
statistic, the difference in correlations between flight simulation time, actual aircraft time, and
NSS scores was statistically significant (z = -4.10; p < .001). Using Cohen q to evaluate the
comparative relational effect between the two training methods, the magnitude of effect
(favoring actual aircraft training) was considered medium (Cohen’s q = 0.32; Cohen, 1988).
19
Journal of Applied Social Science Research and Practice, Vol. 1 [2019]
https://firescholars.seu.edu/jassrp/vol1/iss1/3

Q2: Which is the best predictor of the NSS scores of advanced pilot trainees: flight simulation
time or actual aircraft time?
Research question 2 was predictive in nature, involving two independent covariates.
Multiple linear regression was used to evaluate the predictive abilities of both flight
simulation training time and actual aircraft training time. Table 4 depicts the results of the
analysis.
Table 4
Prediction of NSS by Training Type of Advanced Group (n=358)
Model Β Standard Error Standardized β
Intercept 63.32 6.15
Simulation Training 0.13 0.23 .04
Aircraft Training 0.19 0.08 .15*
*p < .05
Aircraft training time was a statistically significant predictor (p < .05) of NSS scores of
advanced pilot trainees. The predictive effect for the aircraft training method was considered
small (ES = .02) (Field, 2013). Using the Fisher r to z transformation test statistic, the
difference in correlations between flight simulation time, actual aircraft time, and advanced
pilots’ NSS scores was not statistically significant (z = 1.48; p =.07). Using the Cohen q
statistic to evaluate the comparative relational effect between the two training methods, the
magnitude of effect (favoring aircraft training) was considered small (Cohen’s q = 0.11)
(Cohen, 1988). The regression weight (β = 0.19) means that for every one unit increase in
aircraft training time there was a 0.19 increase in the NSS score. In other words, for every 1-
hour increase in aircraft training time, there was a 0.19 increase in the NSS score. The results
indicated that actual flight time of advanced pilots was a statistically significant predictor of
20
Judy and Gollery: Flight Simulation Training Versus Actual Aircraft Training
JASSRP Vol. 1 [2019]

NSS scores in this sample.
Q3: Are there any significant differences between the intermediate and advanced pilot trainees’
flight simulation time and actual aircraft time?
In light of the non-normal distribution of the data arrays related to the comparison
inherent in Research question 3, a non-parametric test statistic alternative to the t-test of
independent means was utilized for analytical purposes. The Mann-Whitney U test was used
to determine whether significant differences existed between mean ranks of training type
(flight simulation time and actual aircraft time) and training groups (intermediate and
advanced). Cohen’s d statistic was used to evaluate the relative magnitude of difference of
mean ranks (effect size) in the respective comparisons. The results of the analyses are
depicted in Table 5.
Table 5
Mann-Whitney U Test and Cohen’s d of Training Type and Training Group
Comparison n Mean Rank Z p d
Intermediate
SIM Hours
334 525.50 22.75 .000*** 3.45a
Advanced
SIM Hours
358 179.50
Intermediate
Aircraft
Hours
336 278.65 8.77 .000*** 0.71
Advanced
Aircraft
Hours
358 412.12
***p < .001 a Cohen’s d = very large effect size (d ≥ 1.30)
The mean rankings of flight simulation training hours of intermediate and advanced
pilot trainees were significantly different. The intermediate pilot trainees utilized simulation
21
Journal of Applied Social Science Research and Practice, Vol. 1 [2019]
https://firescholars.seu.edu/jassrp/vol1/iss1/3

training significantly more often (p < .001) than advanced pilot trainees, and the magnitude of
effect as measured by Cohen’s d was considered very large (d > 1.30).
With regard to actual aircraft training time, the mean rankings between intermediate
and advanced trainees were also significantly different (p < .01). Advanced pilot trainees
utilized actual aircraft time significantly more often than intermediate pilot trainees, and the
magnitude of effect (effect size) in this comparison approached large (d = .80). These results
point to the greater use of simulation time at the intermediate level of pilot training than at the
advanced level. The differences in simulation and flight training mean rankings of
intermediate and advanced pilot trainees were significantly different.
Ancillary Results
Based on the significant findings of the intermediate and advanced groups favoring
actual aircraft training time in Research Questions 1 and 2, additional analyses were conducted
to compare the intermediate and advanced training groups’ scores on the NSS to determine
whether significant differences existed. Scores on the NSS were disaggregated into 3 different
NSS sets: (NSS ≤ 50 (the mean score for completers), NSS +1 Standard Deviation (SD), and
NSS + 2 SD). The sets were then compared based on trainee group. Table 6 depicts the results
of the comparisons of the two training groups using the Chi-Square test for the NSS category
of NSS ≤ 50.
22
Judy and Gollery: Flight Simulation Training Versus Actual Aircraft Training
JASSRP Vol. 1 [2019]

Table 6
Chi-Square Comparison of NSS Score ≤ 50 by Pilot Training Group
Group NSS ≤ 50
(n)
NSS ≤ 50
(%)
Intermediate 140 42.4
Advanced* 182 51.0
*x2 (1) = 5.94 p = .03
The results revealed that the two training groups in this comparison were significantly
different (p < .05) in favor of the advanced group. In other words, advanced pilot trainees
were significantly more likely than intermediate pilot trainees to score at the NSS mean score
of 50 or below.
Tables 7 and 8 depict the results of comparisons of NSS scores of the intermediate and
advanced training groups.
Table 7
Chi-Square Comparison of NSS Score ≤ 60 (+1 SD) by Pilot Training Group
Group NSS ≤ 60 (+1 SD)
(n)
NSS ≤ 60 (+1 SD)
(%)
Intermediate 49 14.8
Advanced 55 15.4
x2 (1) = 0.04 p = .84
Table 8
Chi-Square Comparison of NSS Score ≤ 70 (+2 SD) by Pilot Training Group
Group NSS ≤ 70 (+1 SD)
(n)
NSS ≤ 70 (+1 SD)
(%)
Intermediate 17 5.2
Advanced 10 2.8
x2 (1) = 2.51 p = .11
23
Journal of Applied Social Science Research and Practice, Vol. 1 [2019]
https://firescholars.seu.edu/jassrp/vol1/iss1/3
Tables 7 and 8 reveal that there were no significant differences between intermediate
and advanced pilot trainees on the NSS + 1 SD or on the NSS + 2 SD scores. No statistical
differences were observed between intermediate and advanced flight students who scored
above the mean score of 50 on the NSS.
Summary of Results
Actual aircraft training time was a significant predictor of NSS scores for both
intermediate and advanced pilot trainees. In addition, there were significant differences
between mean flight simulation training times and mean actual aircraft times of intermediate
and advanced pilot trainees in favor of actual aircraft training time. Significant differences
between intermediate and advanced pilot trainees were observed for NSS ≤ 50, but no
significant differences were observed for NSS + 1 SD and NSS + 2 SD.
Discussion
The results for research questions one, two, and three were consistent with literature
based on Bloom’s (1956) comprehensive model for higher-order thinking and the pilot
training tasks involved in the US Navy’s T-45C intermediate and advanced training phases.
Intermediate military pilot training consists of basic instruments, air navigation, cockpit
familiarization, basic formation flying, and runway carrier take-off and landing practice
(Naval Air Training Command, 2014). These tasks involve the knowledge, comprehension,
application, and analysis levels of Bloom’s adapted model for pilots theorized by the
researcher. Advanced military pilot training consists of operational navigation, tactical
maneuvering, weapons delivery, advanced flight formations, low level flying, and aircraft
carrier qualification (Naval Air Training Command, 2014). Realistic scenario-based training
is demanded in the advanced training phase compared to the intermediate training phase. The
24
Judy and Gollery: Flight Simulation Training Versus Actual Aircraft Training
JASSRP Vol. 1 [2019]

advanced phase of US Navy flight training heavily involves the analysis, synthesis, and
evaluation levels of the Bloom model.
Actual aircraft training time was a significant predictor of NSS scores for both
intermediate and advanced training phases. However, the magnitude of effect favoring actual
aircraft training for the intermediate training phase was considered medium (Cohen’s q = 0.32)
and the magnitude of effect favoring actual aircraft training in the advanced training phase was
considered small (Cohen’s q = 0.11).
The results of research question three revealed that advanced pilot trainees spent
significantly more training time in actual aircraft than intermediate pilots. The magnitude of
effect of the comparison was large (d = .80), which was not surprising since the advanced
training phase includes more difficult tasks than the intermediate training phase. These results
align with those of Betts et al. (2010) who found that pilots ranked Close Air Support (CAS)
or strike as the most critical mission training tasks for deployed military pilots. Close air
support and strike tasks used in combat and other mission-critical scenarios involve a great
deal of rehearsal to achieve optimal functioning, and the margin for error is quite small.
Ancillary analyses of the current study disaggregated NSS scores into three different
sets (NSS ≤ 50, NSS +1 Standard Deviation (SD), and NSS + 2 SD) and then compared the
NSS scores based on intermediate or advanced trainee group. A NSS of 50 or below is
considered below average and not passing. The results of the ancillary analyses indicated that
the difference between intermediate and advanced pilots at the NSS cutoff of 50 or less was
significant (p = .03). Advanced pilot trainees were significantly more likely than intermediate
pilot trainees to score at the NSS mean of 50 or below. Again, the results favoring advanced
pilot trainees is not surprising since the advanced phase of pilot training is more difficult than
25
Journal of Applied Social Science Research and Practice, Vol. 1 [2019]
https://firescholars.seu.edu/jassrp/vol1/iss1/3

intermediate training.
As a result, more flight students in the advanced phase earned a NSS of 50 or below; a
score below 50 is the Navy’s cutoff score for not passing each level of flight training. When
the NSS scores were one or two standard deviations above the mean, there were no significant
differences between intermediate and advanced pilot trainees on the NSS. However, the
numbers and percentages of pilot trainees who scored one or two standard deviations above
the mean on the NSS were small, reflecting the inherent difficulty of the tasks and pilot
execution required to earn a score above the mean.
Whatever the optimal ratios of flight simulation time to actual aircraft time, the review
of literature points to the critical need for simulators that are designed for maximum fidelity in
order to contribute to pilot competence (Povenmire & Roscoe, 1972). The RAND study
conducted by Schank et al. (2002) found that F/A-18 simulators were not used or widely
accepted by pilots due to low fidelity; however, P-3C simulators were used more often
because the P-3C flight simulators more closely replicated the actual P-3C flight environment.
Flight simulation has definite value in flight training. According to a study conducted
by Koglbauer et al. (2016), flight students’ aircraft performance scores were significantly
higher on a post-test (p < .01) after using a flight simulator. The authors concluded that a
combination of actual flight training and flight simulator training would have positive effects
on pilots’ competence.
Conducting simulator flights prior to actual flights reinforces positive transfer of
skills. Roof (1996) found that significant cost savings, a critical concern for military budgets,
could be realized when military training events were flown in a flight simulator more than 20
times. These findings were also uncovered at a time when flight simulations were designed
26
Judy and Gollery: Flight Simulation Training Versus Actual Aircraft Training
JASSRP Vol. 1 [2019]

for a personal computer and were not especially sophisticated compared to today’s flight
simulators. Roof also concluded in his 1996 study that certain flight tasks could be
effectively moved to simulators without compromising pilot training; however, he was quick
to point out that critical “must-fly” tasks he identified, mapped, and carried out in actual
aircraft training.
Schank et al. (2002) also suggested that independent of simulation accuracy or fidelity,
some training events such as tasks requiring essential physiological cues are best flown in an
actual aircraft. The Training and Readiness (T&R) matrices developed by the military,
combined with the “must-fly” criteria developed by Roof (1996), provide important design
information to guide the development of high-fidelity flight simulations.
Recommendations for Future Research
This study could be replicated using other military aircraft types and simulators, as
well as for commercial aviation platforms. Additionally, the study did not assess individual
training event scores, but evaluated only overall pilot NSS scores of intermediate and
advanced military pilot trainees. Additional studies could focus on comparing pilot trainees’
scores on individual training tasks to determine whether a specific training task score could be
predicted based on flight simulation time or actual aircraft training time. This type of study
might advance the research evidence needed to determine the optimal ratios of simulation
time versus aircraft time for military pilots without compromising pilot readiness and
competence.
The researcher’s observations of pilot training and interviews with flight instructors at
U.S. Navy Training Wing TWO uncovered other recommendations for future research
regarding the use of simulators in pilot training. The instructors and pilots recommended
27
Journal of Applied Social Science Research and Practice, Vol. 1 [2019]
https://firescholars.seu.edu/jassrp/vol1/iss1/3

improvement of flight simulation fidelity, particularly in the intermediate training phase; the
T-45C flight simulator plays an important role in familiarizing the intermediate pilot with the
cockpit hardware and aircraft systems’ functionality, and designers need to continue to
improve and assess the quality of the simulations. The interviewees also suggested
improvement of T-45C flight simulator visuals to prepare the advanced pilot trainees’
effectiveness during formation flying, tactics, and weapons delivery—all critical tasks in combat
situations. Also suggested was the inclusion of Virtual Reality (VR) and Augmented Reality (AR)
in the advanced phases of flight simulator training to make visuals outside the cockpit more
realistic. The interviewees also suggested the need for more research on new methods to
improve de-briefs after simulator or flight training events; the pilots specifically recommended
more research on the possibility of 3-dimensional capabilities to help de-brief specific training
scenarios. Research related to these specific areas of need will advance military pilot training
in valuable ways.
Based on the review of literature, flight training programs should encourage greater
simulator participation by pilots at all stages of their training and development and make
better use of simulators as a complement to actual aircraft training, but not as a substitute for
actual aircraft training. Roof (1996) concluded that substantial cost savings could be realized
by moving certain tasks, excluding “must-fly” tasks, from live aircraft training to a simulator
with no degradation in training or safety. These conclusions require further study and
analysis.
Future research should examine methodologies and evaluation tools that could be used
to conduct flight simulation versus actual aircraft military flight training experiments. For
example, a thorough analysis of the Navy’s T&R Matrices for aircraft types should be
28
Judy and Gollery: Flight Simulation Training Versus Actual Aircraft Training
JASSRP Vol. 1 [2019]

carefully reviewed. Using the analyses and experimental results, tasks from the actual aircraft
could be mapped and built into the design of a flight simulator. Mapping essential aircraft
training tasks to simulator devices is an important step in ensuring that operational readiness is
not compromised.
Simulation fidelity remains a concern; based on Bloom’s cognitive model, higher-order
thinking is critical when simulating flight as well as when flying an aircraft. Even with
advances in electronic technologies such as high-definition and faster computer processing,
simulation models should incorporate higher fidelity to support more training tasks. Virtual
reality and augmented reality are advanced technologies that have the potential to be highly
effective in flight simulation training. For example, AR may add value both in cost savings
and fidelity to current simulators without the extensive need for physical or software flight
simulator changes. This type of research will undoubtedly prove highly useful to both military
and commercial pilot training programs.
More research should be conducted on pilots’ views on flight simulation and the
concern that many pilots do not take simulation practice as seriously as actual aircraft flight
(Schank et al., 2002). Flight instructors should be well trained in the use of simulations and
could incorporate a method that holds pilots accountable for simulation training. Perhaps the
simulations can be timed to more realistically emulate rapid and error-free decision-making
required of every pilot. Flight instructors could require pilots to repeat tasks in the simulator
until the task is executed perfectly. The Department of the Navy may wish to consider
increasing the required number of hours spent in simulators as their design elements improve.
As the need arises to move more aircraft training tasks into the simulator, the accountability of
both pilots and instructors is vitally important not only for learning, but also for flight safety.
29
Journal of Applied Social Science Research and Practice, Vol. 1 [2019]
https://firescholars.seu.edu/jassrp/vol1/iss1/3

Research designed to address these important recommendations will provide more evidence
regarding the critical design and pilot usage elements that make simulations effective.
30
Judy and Gollery: Flight Simulation Training Versus Actual Aircraft Training
JASSRP Vol. 1 [2019]

References
Beaubien, J., Stacy, W., Wiggins, S., & Lucia, L. (2016). How can we measure learning? Let's
count the ways! Paper presented at the Interservice/Industry Training, Simulation, and
Education Conference, Orlando, FL.
Betts, L. R., McCauley, E. M., & Walwanis, M. (2010). Assessing the need for a deployable
training system for the F/A-18 hornet and super hornet. Paper presented at the
Interservice/Industry Training, Simulation, and Education Conference, Orlando, FL.
Bloom, B. S. (Ed.). (1956). Taxonomy of educational objectives: The classification of
educational goals. Handbook I: Cognitive domain. New York, NY: David McKay.
Boeing. (2018). T-45 goshawk trainer. Retrieved from http://www.boeing.com/history/
products/t-45-goshawk-trainer.page
Cohen, J. (1988). Statistical power analysis for the behavioral sciences (2nd ed.). Hillsdale, NJ:
Lawrence Earlbaum Associates.
Department of Defense. (2016). Operation and maintenance overview: Fiscal year 2017
budget estimates. Retrieved from http://comptroller.defense.gov/Portals/45/Documents
defbudget/fy2017/fy2017_OM_Overview.pdf
Department of the Navy. (2010). Simulated training strategy. Washington, DC: Department of
the Navy.
Department of the Navy. (2014). Chief of naval operations simulator development and training
strategy. Washington, DC: Department of the Navy.
Federal Aviation Administration. (2017). Aviation instructor’s handbook. New York, NY:
Skyhorse Publishing.
31
Journal of Applied Social Science Research and Practice, Vol. 1 [2019]
https://firescholars.seu.edu/jassrp/vol1/iss1/3
Federal Aviation Administration. (2018). Federal aviation regulations and aeronautical
information manual (FAR/AIM). Newcastle, WA: Aviation Supplies and Academics.
Faubert, J., & Sidebottom, L. (2012). Perceptual-cognitive training of athletes. Journal of
Clinical Sports Psychology, 6(1), 85-102.
Field, A. (2013). Discovering statistics using IBM SPSS statistics (4th ed.). Thousand Oaks,
CA: SAGE Publications.
Hoke, J., Reuter, C., Romeas, T., Montariol, M., Schnell, T., & Faubert, J. (2017). Perceptual
cognitive and physiological assessment of training effectiveness. Paper presented at the
Interservice/Industry Training, Simulation, and Education Conference, Orlando, FL.
Schafer, J. (1999). Multiple imputation: A primer. Statistical Methods in Medical Research,
8(1), 3-15. https://doi.org/10.1177/096228029900800102.
Schank, J. F., Thie, H. J., Graff, C. M., II., Beel, J., & Sollinger, J. (2002). Finding the right
balance: Simulator and live training for navy units. Santa Monica, CA: RAND.
32
Judy and Gollery: Flight Simulation Training Versus Actual Aircraft Training
JASSRP Vol. 1 [2019]
ABOUT THE AUTHORS
Dr. Aaron Judy is currently a Lead Test Engineer for Navy training systems at the Naval Air
Warfare Center Training Systems Division in Orlando, Florida. He earned a Bachelor of Science
in Aerospace Engineering and a Bachelor of Science in Mechanical Engineering from West
Virginia University, a Master of Science in Aeronautics from Embry Riddle Aeronautical
University, and a Doctor of Education from Southeastern University. He is a certified pilot and
has worked for the Naval Air Warfare Center Aircraft Division and the United States Special
Operations Command.
Dr. Tom Gollery is a Professor in the College of Education at Southeastern University in
Lakeland, Florida. He teaches master’s courses in the educational leadership program and
doctoral level research courses; in addition, he serves as a quantitative methodologist for the
Ed.D. program at SEU. Dr. Gollery earned his doctorate in the areas of Educational Leadership
and Exceptional Student Education from the University of Florida. Prior to his work at
Southeastern University, he served for 25 years as a school administrator for exceptional student
education (ESE) programs. For 23 of those years, he was Principal of an ESE Center School in
Florida. His research interests are interdisciplinary in nature, focusing on quantitative research
methodologies, quantitative data analysis, and statistics.
33
Journal of Applied Social Science Research and Practice, Vol. 1 [2019]
https://firescholars.seu.edu/jassrp/vol1/iss1/3