us imports from emerging economies have - piie · us imports from emerging economies have grown...
TRANSCRIPT


US imports from emerging economies have grown rapidly
0
0.01
0.02
0.03
0.04
0.05
0.06
0.07
US merchandise imports, 1978–2008
Industrial
Non-OPEC other
Ratio to GDP (current dollars)
OPEC = Organization of Petroleum Exporting Countries Source: Bureau of Economic Analysis

Manufacturing employment since 2000 down almost 6 million
0
2
4
6
8
10
12
14
16
18
20
Manufacturing employment, 1990–2011
Source: Bureau of Labor Statistics.
manufacturing employment

Public’s views on trade: it’s about jobs
• 63% “International trade is bad for the U.S. because it results in the loss of jobs and lower wages”
• 30% “International trade is good for the U.S. because it leads to lower prices for consumers”

Economists: trade could harm domestic welfare and wages
Aggregate Welfare • Paul Samuelson (2004): “Even where the leaders
continued to progress in absolute growth, their rate of growth tended often to be attenuated by an adverse headwind generated from low-wage competitors and technical imitators.”
• Lawrence Summers (2008) “Faster growth in oil-importing countries like China could increase the world price of oil and thus reduce US welfare by raising US import costs.”
Wage Inequality • Paul Krugman (2008): “growing U.S. trade with
third world countries reduces the real wages of many and perhaps most workers in this country.”
5

Agenda
1. Jobs and wages (public)
2. Welfare (economists – Samuelson, Summers)
3. Wage inequality and levels (Krugman)

It’s musical chairs: employment fears center on total jobs, lost jobs, and good jobs
• Not enough chairs when music stops – total jobs
• Too many changes in chairs – lost jobs
• And not enough comfortable chairs – good manufacturing jobs

Total jobs: Import and employment growth are positively associated
64% of US imports are capital goods and intermediate products -15
-10
-5
0
5
10
15
1991
1992
1993
1994
1995
1996
1997
1998
1999
2000
2001
2002
2003
2004
2005
2006
2007
2008
2009
2010
2011
imports
Association between US employment and import growth, 1991–2011 (annual growth rates in percent)
Nonfarm employment
Imports of goods and services
-5
-4
-3
-2
-1
0
1
2
3
4
-5
-4
-3
-2
-1
0
1
2
3
4employment

Lost jobs: imports account for a small share 2002 to 2011: • Growth in imports of goods and services in 2005 dollars:
$538 billion • Assuming 10 workers per million dollars this translates into
5.38 million maximum displacements
• Number of non-farm layoffs and involuntary discharges: 228 million
• Ratio (5.38 / 228) just 2.5% of job loss due to imports!

Good Jobs: Predictable! Trend in US manufacturing share of employment has not changed.
0
0.05
0.1
0.15
0.2
0.25
0.3
0.35
1961
1963
1965
1967
1969
1971
1973
1975
1977
1979
1981
1983
1985
1987
1989
1991
1993
1995
1997
1999
2001
2003
2005
2007
2009
share
Source: Bureau of Labor Statistics
Manufacturing share in establishment employment, 1961–2010
Fitted trendline
Share
Forecast

And Typical! Decline in manufacturing share of employment is similar across advanced economies

Rapid productivity growth is reflected in prices
0.4
0.5
0.6
0.7
0.8
0.9
1
1.1
1.2
1.3
1.4
Measures of relative manufacturing productivity and prices, 1960–2007
inde
x (1
995
= 1)
Productivity relative to GDP
Price of goods relative to GDP (inverse)

Spending on goods relative to services: Prices fall but Quantities rise slowly
-0.4
-0.2
0.0
0.2
0.4
0.6
0.8
1.0
1.2
1960
1962
1964
1966
1968
1970
1972
1974
1976
1978
1980
1982
1984
1986
1988
1990
1992
1994
1996
1998
2000
2002
2004
2006
2008
2010
Log
Scal
e (2
010
= 0)
Prices
Quantities
Values
Declining shares of nominal spending on goods relative to services
US spending on goods relative to services, 1960–2010

The American labor market is actually closing!
0
0.05
0.1
0.15
0.2
0.25
0.3
0.35
0.4
0.45
1929
1932
1935
1938
1941
1944
1947
1950
1953
1956
1959
1962
1965
1968
1971
1974
1977
1980
1983
1986
1989
1992
1995
1998
2001
2004
2007
share
Agriculture
Mining
Manufacturing
Goods
Source: Bureau of Economic Analysis
Services may have become more tradable, but the bigger story is fewer employment opportunities in tradable goods. Less globalization, not more!
Sector share in total employment, 1929–2009

Manufacturing employment, actual and without trade deficit: different levels, similar decline after 2000
0
5
10
15
20
25
1990
1991
1992
1993
1994
1995
1996
1997
1998
1999
2000
2001
2002
2003
2004
2005
2006
2007
2008
2009
2010
actu
al a
nd a
djus
ted
man
ufac
turin
g em
ploy
men
t (m
illio
ns)
Manufacturing employment, actual and adjusted for the manufacturing trade deficit, 1990–2010
Employment without trade deficit Actual manufacturing employment

Summary: Jobs
• A costly and painful experience for those who are dislocated
but…
• Import growth and deficits a sign of recovery
• Trade a small share of overall displacement
• Most deindustrialization due to technology and demand
Closing the trade deficit would mean more manufacturing jobs…
…but it’s like walking up a downward escalator

Agenda
1. Jobs and wages (public)
2. Welfare (economists – Samuelson, Saummers)
3. Wage inequality and levels (Krugman)

Welfare
• An emerging economy reduces US trade gains when trade leads to lower export prices and higher import prices, i.e. worse terms of trade
• The key is whether the emerging economy’s growth is biased towards their exports (good for US) or replacing their imports (bad for US)

Hicks: Early Growth – Export Biased
“We should … expect to find that the improvements which start a process of development will be export-biased. This is little more than a deduction from the general principle of the division of labor. Countries, like people, are most likely to make their improvements in those sorts of production which they already do relatively well than in those they do relatively badly.”
John Hicks, 1953

Ratio of export to import prices (terms of trade) fell with advanced country trade, but steady with emerging economy trade
0
20
40
60
80
100
120
140
160
19
50
19
52
19
54
19
56
19
58
19
60
19
62
19
64
19
66
19
68
19
70
19
72
19
74
19
76
19
78
19
80
19
82
19
84
19
86
19
88
19
90
19
92
19
94
19
96
19
98
20
00
20
02
20
04
20
06
20
08 2010
index (2006 = 100)
Source: Bureau of Economic Analysis, National Income Accounts
US terms of trade (goods and services), 1950–2010
US terms of trade improved until 1970
when Japan and Europe caught up
Not much movement in terms of trade since 1994,
despite NAFTA and the rise of Chinese exports

Developing countries today are well below GDP per captia of developed countries in the 1950’s, adjusted for PPP
• China had 19% of US level PPP-converted GDP per capita in 2009.
• As of 2009, Brazil (23), India (8), and Mexico (28), were at or below where Japan (24), Italy (4), an France (54) were relative to the US in 1950.
Source: Heston, Summers, and Aten (2011).

Non-oil terms of trade: rising after 1994 Overall terms of trade: decline after 2002 due to oil
-0.15
-0.1
-0.05
0
0.05
0.1
0.15US terms of trade, 1980–2010
Terms of trade for goods and services
Terms of trade for goods
Terms of trade for goods excluding oil import prices
log scale (2005 = 0)
Non-Oil Terms of Trade
1994

Manufacturing terms of trade have risen for the US and Germany since 1996
-0.12
-0.1
-0.08
-0.06
-0.04
-0.02
0
0.02
0.04
0.06
1996 1997 1998 1999 2000 2001 2002 2003 2004 2005 2006 2007 2008 2009
Germany
Japan
United States
Log Scale 2006 = 0
Source: Organization for Economic Cooperation and Development.
Manufacturing terms of trade, 1996–2009

-0.3
-0.25
-0.2
-0.15
-0.1
-0.05
0
0.05
1990 1991 1992 1993 1994 1995 1996 1997 1998 1999 2000 2001 2002 2003 2004 2005 2006 2007 2008
Ratios of Non-Agricultural Export Prices to Prices of Manufactured Goods Imports from Developed and Developing Countries
Prices of US nonagricultural merchandise exports (PXNAG) / Prices of US manufactured imports from developed countries (PMDC)
Prices of US nonagricultural merchandise exports (PXNAG) / Prices of US manufactured imports from developing countries (PMLDC)
US exports increasingly price advantaged over developing country imports, but not imports from the developed world
Developing countries responsible for manufacturing terms of trade improvements: good news for living standards but could be bad news for inequality
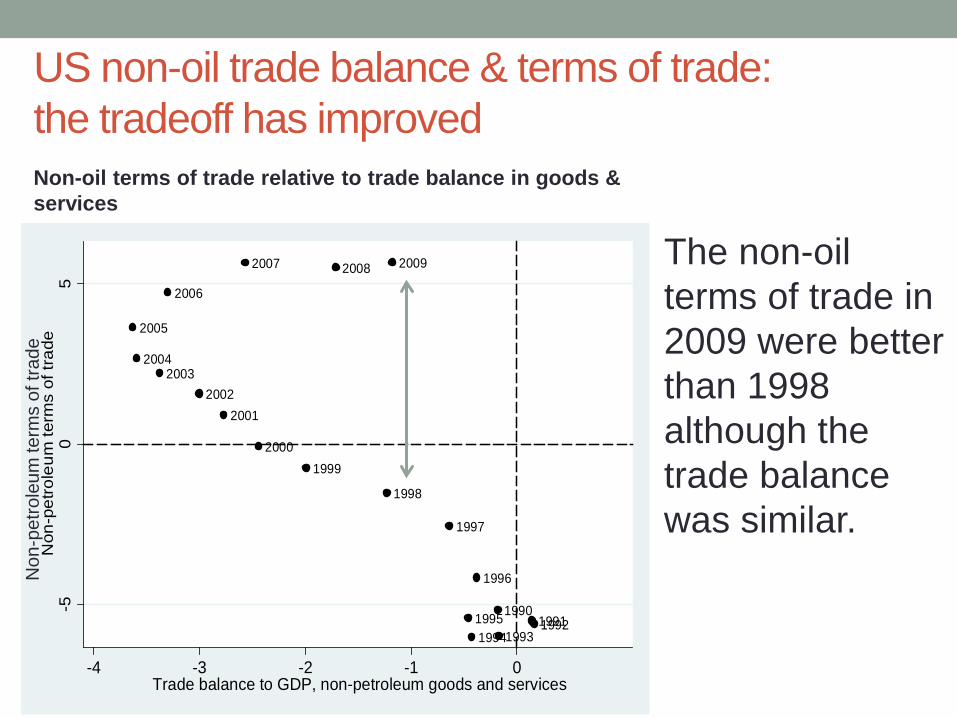
US non-oil trade balance & terms of trade: the tradeoff has improved
199019911992
199319941995
1996
1997
1998
19992000
20012002
20032004
2005
2006
2007 2008 2009
-50
5N
on-p
etro
leum
term
s of
trad
e
-4 -3 -2 -1 0Trade balance to GDP, non-petroleum goods and services
The non-oil terms of trade in 2009 were better than 1998 although the trade balance was similar.
Non
-pet
role
um te
rms
of tr
ade
Non-oil terms of trade relative to trade balance in goods & services

US and emerging economies do not compete head to head in export markets

Emerging economy exports are much cheaper
1990 2000 2006Singapore 0.67 1.06 1.62France 1.47 1.19 1.36UK 1.25 1.14 1.25Japan 1.36 1.05 1.15Germany 1.22 1.1 1.08Developed 0.74 0.91 0.9Korea 0.78 0.57 0.61India 0.52 0.37 0.57Mexico 0.61 0.57 0.49ASEAN4 0.62 0.43 0.48Taiwan 0.33 0.4 0.47HongKong 0.49 0.45 0.38China 0.32 0.28 0.36
Unit Values Relative to US Exports
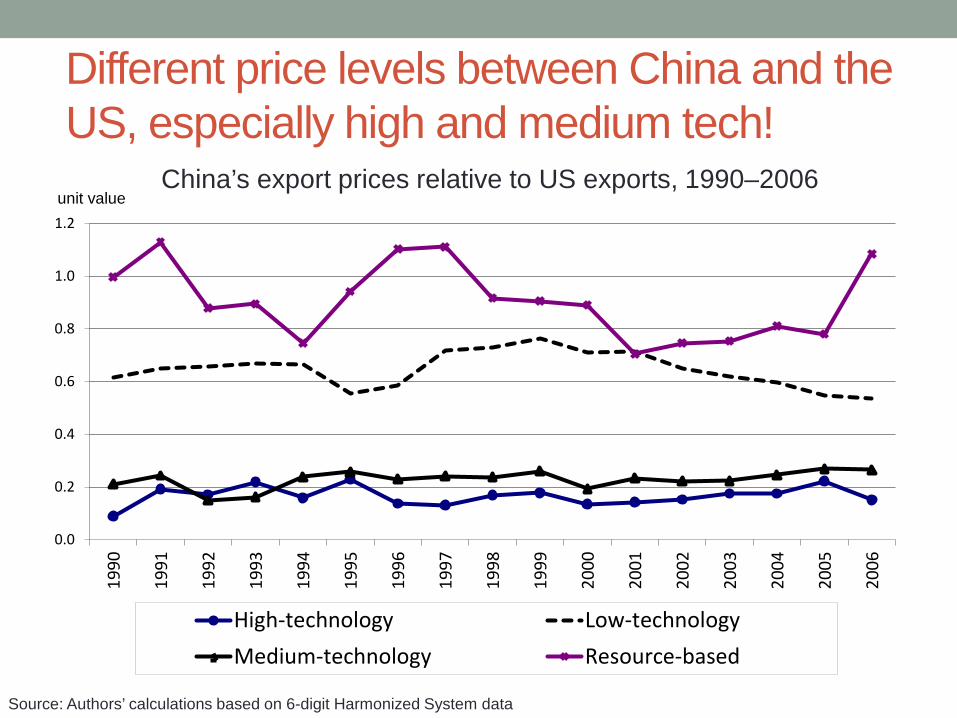
Different price levels between China and the US, especially high and medium tech!
0.0
0.2
0.4
0.6
0.8
1.0
1.2
1990
1991
1992
1993
1994
1995
1996
1997
1998
1999
2000
2001
2002
2003
2004
2005
2006
High-technology Low-technologyMedium-technology Resource-based
unit value
Source: Authors’ calculations based on 6-digit Harmonized System data
China’s export prices relative to US exports, 1990–2006

Higher oil prices: Made in OECD! Accounting for production, OECD caused most oil price increases
Shortfall = (Ex ante demand growth) - (Production growth), for the period Ex ante demand = (GDP growth, for the period) * (Income elasticity of oil consumption, 1995-2000) Sources: International Monetary Fund, World Economic Outlook database; International Energy Agency

Summary: Welfare • Terms of trade movements have been positive. Emerging
economies sell the US cheaper imports and do not compete head to head in exports
• In addition the US benefits from increased variety and enhanced productivity
• Using the methodology of Arkolakis et. al. we find the gains from trade with emerging economies equals $500 per person in the US, about half due to China
• Improvements remain even with balanced trade
• Oil is an exception but mainly due to advanced economies

Agenda
1. Jobs and wages (public)
2. Welfare (economists – Samuelson, Summers)
3. Wage inequality and levels (Krugman)

What are we explaining? College premium steady after 2000
50
60
70
80
90
100
110
Ratio of college to high school graduate wages (2008=100)
2000

Import prices of manufactured goods from developing countries have fallen relative to other imports
0
0.05
0.1
0.15
0.2
0.25
0.3
1990 1991 1992 1993 1994 1995 1996 1997 1998 1999 2000 2001 2002 2003 2004 2005 2006 2007 2008
Log
Sca
le (2
008
= 0)
Ratio of Manufactured Import Prices from Developing Countries to Manufactured Import Prices from Developed Countries, 1990 to 2008

Falling import prices do not translate into falling prices of unskill-intensive goods
-0.04
-0.03
-0.02
-0.01
0
0.01
0.02
0.03
0.04
0.05
0.06
0.07
1987
1988
1989
1990
1991
1992
1993
1994
1995
1996
1997
1998
1999
2000
2001
2002
2003
2004
2005
2006
Developing/developed countries, import-weighted
Production/nonproduction, cost-share weighted
Domestic effective prices weighted by import shares and production and nonproduction employment, 1987–2006
log
scal
e (2
006
= 0)
Leads to greater wage equality!
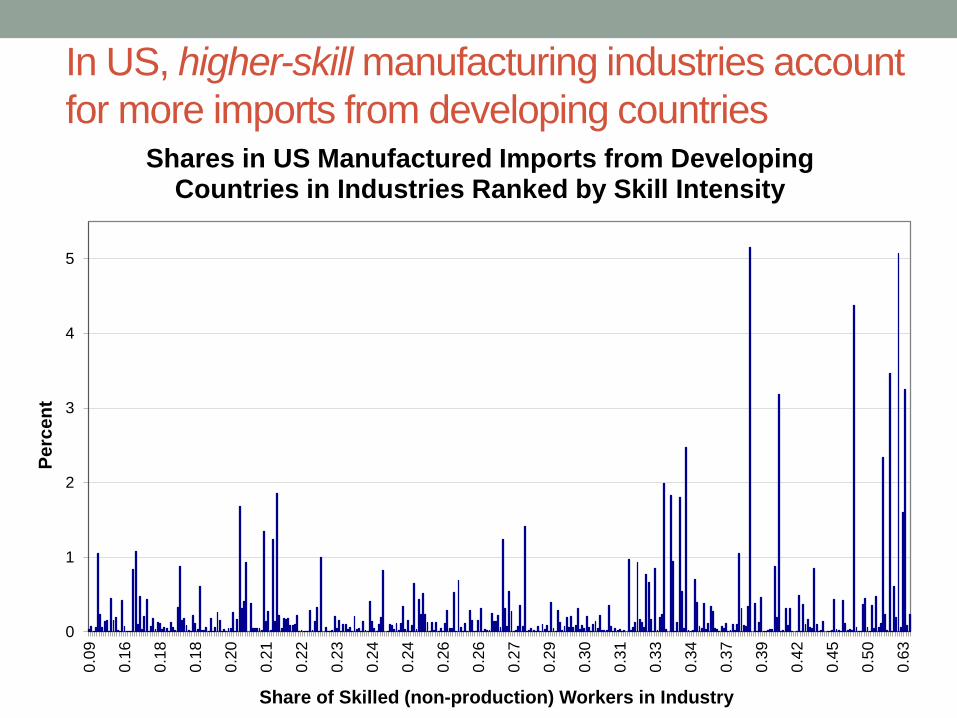
In US, higher-skill manufacturing industries account for more imports from developing countries
0
1
2
3
4
5
0.09
0.16
0.18
0.18
0.20
0.21
0.22
0.23
0.24
0.24
0.26
0.26
0.27
0.29
0.30
0.31
0.33
0.34
0.37
0.39
0.42
0.45
0.50
0.63
Perc
ent
Share of Skilled (non-production) Workers in Industry
Shares in US Manufactured Imports from Developing Countries in Industries Ranked by Skill Intensity

Trade and wages Skill Premium
• Factor content studies: almost no impact, because skill content
differences in US exports and imports from emerging economies are small
• Simulation studies: 2% rise in skill premium over 1995-2006
• An upper bound. Assume: • All imports produced at home • All imports from emerging economies unskilled (ignore supply chains)
• Our Study: We apply mandated factor prices and find no significant impact
• There is evidence of impact on specific wages
Conclusions • Faster foreign growth is part of the solution to US employment problems.
• Foreign growth has had some adverse effects on particular workers, causing
dislocation and wage loss.
• Trade accounts for just a small part of overall worker displacement in an economy which is astoundingly volatile.
• Declining trend in US manufacturing employment: driven by the combination of a shift in domestic demand away from spending on goods and faster productivity growth in manufacturing.
• Trade has improved US living standards. With exception of oil, emerging economies have been mainly complementary rather than competitive with US.
• Recent trade not a major source of wage inequality along the lines of skill.