agricultural policies in emerging economies agricultural ... · agricultural policies in emerging...
TRANSCRIPT

Agricultural Policies in Emerging Economies MONITORING AND EVALUATION
This report analyses policy developments during 2006-08 in seven economies: Brazil, Chile, China, India, Russia, South Africa and Ukraine. This period was marked by a significant increase in world prices for most, but not all, agricultural commodities. Policy responses to rising food prices included tariff reductions, export restrictions, increased minimum prices and price controls, input subsidies, sales of stocks and direct transfers to the most disadvantaged. Other major common policy developments included: expanded government-supported credit facilities and/or debt rescheduling, endeavours to improve the delivery and performance of agricultural policies, extended coverage of insurance programmes and further efforts in land reform. A comprehensive statistical annex containing a wide range of contextual information for these economies is also included in this report.Estimates of support to agriculture in six economies (India is not yet covered) from 1995 to 2007 are provided, in conformance with recent changes to the OECD measurement methodology. This allows a consistent comparison across emerging economies and with OECD countries in terms of changes in the level and composition of support to producers and the sector as a whole. Findings show that the level of producer support during 2006-08 was lower than the OECD average in all six economies, with significant differences between them. Nevertheless, the level of producer support has shown a general increase over time and is typically provided in ways that distort production and trade. The database of indicators for the six economies is available on line: www.oecd.org/tad/support/psecse.
FURTHER READING
OECD Rural Policy Reviews: China (2009)OECD Review of Agricultural Policies: Chile (2008)Agricultural Policies in OECD Countries: At a Glance (2008)OECD’s Producer Support Estimate and Related Indicators of Agricultural Support: Concepts, Calculations, Interpretation and Use (The PSE Manual) (2008), available at www.oecd.org/tad/support/psecse
Agricultural Policies in Emerging EconomiesMONITORING AND EVALUATION
www.oecd.org/tad
HIGHLIGHTS HIGHLIGHTS
2009
«

AGRICULTURAL POLICIES IN EMERGING ECONOMIES:
MONITORING AND EVALUATION 2009
HIGHLIGHTS
OECD
ORGANISATION FOR ECONOMIC CO-OPERATION AND DEVELOPMENT
ORGANISATION FOR ECONOMIC CO-OPERATION
AND DEVELOPMENT
The OECD is a unique forum where the governments of 30 democracies work together to
address the economic, social and environmental challenges of globalisation. The OECD is also at the
forefront of efforts to understand and to help governments respond to new developments and concerns,
such as corporate governance, the information economy and the challenges of an ageing population.
The Organisation provides a setting where governments can compare policy experiences, seek answers
to common problems, identify good practice and work to co-ordinate domestic and international
policies.
The OECD member countries are: Australia, Austria, Belgium, Canada, the Czech Republic,
Denmark, Finland, France, Germany, Greece, Hungary, Iceland, Ireland, Italy, Japan, Korea,
Luxembourg, Mexico, the Netherlands, New Zealand, Norway, Poland, Portugal, the Slovak Republic,
Spain, Sweden, Switzerland, Turkey, the United Kingdom and the United States. The Commission of
the European Communities takes part in the work of the OECD.
OECD Publishing disseminates widely the results of the Organisation’s statistics gathering and
research on economic, social and environmental issues, as well as the conventions, guidelines and
standards agreed by its members.
This work is published on the responsibility of the Secretary-General of the
OECD. The opinions expressed and arguments employed herein do not necessarily
reflect the official views of the Organisation or of the governments of its member
countries.
This document has been produced with the financial assistance of the European
Union. The views expressed herein can in no way be taken to reflect the official
opinion of the European Union.
Also available in French under the title:
Politiques agricoles des économies émergentes : Suivi et évaluation 2009
Cover illustration:
In the centre © Adalberto Rios Szalay/Sexto Sol/Photodisc/Getty Images
On the top left © OECD
On the top right © Javier Pierini/Photographer's Choice RF/Getty Images
On the bottom right © Jon Warburton Lee/Photographer's Choice RF/Getty Images
© OECD 2009
OECD freely authorises the use, including the photocopy, of this material for private, non-commercial purposes. Permission to photocopy portions of
this material for any public use or commercial purpose may be obtained from the Copyright Clearance Center (CCC) at [email protected] or the
Centre français d’exploitation du droit de copie (CFC) [email protected]. All copies must retain the copyright and other proprietary notices in their original forms. All requests for other public or commercial uses of this material or for translation rights should be submitted to [email protected].

3
Foreword
A key objective of the OECD is to facilitate policy dialogue among policy makers with a view to
identifying good practices across a wide range of economic and social policy issues. The OECD places a
high priority on its dialogue with non-member economies, recognising that such dialogue improves the
quality and relevance of the work and assists collective action to address global economic challenges.
During 2006-08, the period covered by the report, high prices for many agricultural commodities posed a
major policy challenge for many countries. Policy responses to the “food crisis” are a special focus of this
report.
This monitoring exercise documents and evaluates the latest agricultural policy developments in
seven emerging economies: Brazil, Chile, China, India, Russia, South Africa and Ukraine. Chile has been
included for the first time, following the completion of a country review of agricultural policies in 2008.
Bulgaria and Romania, which were included in the previous edition, have subsequently acceded to the
European Union and therefore, by convention, are now covered in the annual monitoring and evaluation
report of agricultural policies in OECD countries.
The other important development since the previous report concerns changes made to the method
used to calculate and present the Producer Support Estimate (PSE) and related indicators of support.
Ongoing changes in agricultural policies require that the methodology be reviewed periodically. A new
classification of policy measures within the PSE and a new method for calculating commodity-specific
support have been adopted, and consequently implemented in this report. Definitions of support indicators
and changes in the classification system are detailed in an annex, along with a description of improvements
made to the estimates of support for each economy.
The structure of the report is similar to that prepared on an annual basis for OECD countries,
providing a common benchmark for international dialogue on agricultural policy reform. An overview
chapter provides context on world commodity markets, comments on policy developments, compares
support indicators between economies and over time, and presents some conclusions on recent changes.
For each economy, a separate chapter describes policy developments in 2006-08 and presents estimates of
agricultural support in a consistent format. A comprehensive statistical annex containing a wide range of
contextual information for these economies is also included.

4
HIGHLIGHTS
This report monitors and evaluates government support to agriculture in seven emerging economies
during 2006-08: Brazil, Chile, China, India, Russia, South Africa and Ukraine. While the economic
importance of the agricultural sector is falling relative to other sectors in these countries, the sector
continues to play a vital role in providing employment and contributing to food security. Although weather
conditions can cause large short-term fluctuations, over the longer-term both agricultural production and,
in particular, agro-food trade are growing rapidly. Brazil, Chile, India and Ukraine are net exporters of
agro-food products, while China and Russia are net importers.
Developments in world food markets
The three-year period from 2006 to 2008 was characterised by extreme volatility in international
prices for agricultural commodities. The price spikes in many commodities witnessed in the first half of
2008 were caused by a complex mix of factors including adverse weather conditions, lower stock levels,
higher demand (in particular for biofuels), government policy responses, apparent speculative activity and
higher energy costs. International oil prices rose sharply in 2006-07, resulting in a substantial increase in
the cost of energy based inputs such as fuel, fertiliser and irrigation. In the second half of 2008, downward
pressure on commodity prices was exerted by the global financial crisis. This pressure is likely to intensify
should the crisis lead to a global recession (Box 1).
Box 1. Potential impacts on agriculture of the financial crisis
The impacts of higher food and fuel prices are likely to be compounded by the global financial crisis that developed in the latter half of 2008. While the outcome of various co-ordinated efforts by political leaders and their financial authorities to address issues of liquidity, solvency and recapitalisation is still unknown, the impact of the financial crisis may have a number of effects on agriculture. Directly it will:
Reduce the availability of loans – lenders will want more equity and collateral before approving loans. This will not only affect producers but also processors, traders and retailers who rely on credit.
Increase the cost of borrowing through higher interest rates.
Reduce the level of foreign direct investment – which is crucial for the development of emerging economies. In the context of the spreading recession, it will indirectly:
Put additional downward pressure on prices – while this may be beneficial for consumers and reduce input costs for producers, it sends a signal to decrease production which may lead to future shortages in supply, increasing both the level and variability of prices.
Put pressure on government budgets (through reduced tax revenue and higher borrowing costs) – this may lead to a reduction in expenditure on items not related to current concerns such as research and development, although expenditure on infrastructure may rise as governments try to stimulate economic recovery.
Reduce the level of remittances – which can be an important source of finance for developing countries.
Potentially reduce official development assistance – as OECD governments face increasing deficits, they may be tempted to reduce ODA spending.
Increase pressure to raise protectionism – which would increase price variability on world markets and reduce trading opportunities.
Reinforce an orientation towards self-sufficiency in food production – which would lead to a reallocation of resources away from their most efficient use.

5
Main changes in agricultural policies
Government responses to higher food prices
Along with a large number of other countries, the seven emerging economies made various policy
interventions in response to higher food prices. Table 1 summarises these different measures in terms of
their orientation: whether policies are directly orientated to affect consumers, producers or trade. Of
course, policies oriented to one group will have an effect on others. A number of these measures were
introduced for just a limited period of time and are no longer in effect.
The most common policy response taken by the emerging economies – and also worldwide – has
been to reduce or suspend import tariffs on food products. The products on which tariffs were
reduced, and the time and quantity limit varied between economies, as well as the extent of the
tariff reduction. For example, while Brazil has provided tariff-free access for 2 million tonnes of
wheat, the MFN applied tariff is just 6%. Changes of this magnitude can be expected to make
only a limited impact on inflation.
The next most common response has been to impose export barriers in the form of export
restrictions or export taxes. The measures imposed by India, Russia and Ukraine were
particularly significant given the potential quantities involved. Export barriers are likely to lower
domestic prices for the products concerned but have serious spill-over effects, impeding price
signals to producers and decreasing supplies for importing countries.
Another common response was to release government held stocks, particularly of grains, on to
the domestic market to ensure supply and reduce upward price pressure. Many governments used
up a large proportion of their buffer stocks during 2007-08.
Another response has been to stimulate domestic production by raising minimum prices and
expanding input subsidies. The increase in minimum prices may indicate a failure in the
transmission of market price signals to farmers, which in turn could be due to other policy
decisions, or it may reflect efforts to rebuild government stock holdings. The expansion of input
subsidies reflects initiatives to counteract the increase in energy costs. These policies take time to
work through the system and do little to reduce the position of the most vulnerable in the short
run.
Retail price controls have been introduced in China, Russia and Ukraine.
China and South Africa made changes to their biofuel policies to reduce pressure on food
security.
Chile and South Africa provided additional direct transfers to those most vulnerable to the effect
of higher food prices: a cash-based transfer in Chile and the provision of food in South Africa.

6
Table 1. Policy measures taken by governments to reduce the impact of higher food prices
Consumer orientated Producer orientated Trade orientated
Macro-economic
Social Market Production support
Market management
Import Export
Interest and exchange
rates
Food subsidies
and others
Price controls and taxes
Release stocks Food procurement and others
Producer credit and other
Minimum producer prices and other
Import tariffs and other Quantitative export controls
Export price controls and tax measures
Brazil
Increased interest rates
Lowered the excise tax on petrol and diesel
Released stocks of beans, maize and wheat
Increased funds to raise the level of safety stocks
Increased access to credit and expanded extension services
Increased minimum prices for 2008/09 crop season
Reduced tariffs on wheat, sardines, palm kernel oil and some fertilisers; eliminated the merchant marine levy on wheat and flour
Chile
Increased interest rates
One-off cash bonus for the 40% poorest
China
Allowed the CNY to appreciate
Price controls on cooking oil, pork, eggs, instant noodles, milk, grains, natural gas, gasoline and electricity
Released stocks of grain
Stopped approval for any new grain-based biofuel processing plant
Increased subsidies for the purchase of farm machinery, fuels, fertilisers and improved seeds
Increased minimum purchase prices for wheat and rice
Reduced tariffs for a variety of products including pigmeat, cod fish, infant food, soybean and peanut meal.
Imposed export licences on grains, soybean and flour
Suspended VAT export rebates on grain and grain products, later reinforced by provisional export taxes on grains, soybeans, flour and fertilisers
India
Increased interest rates
Increased food subsidies
Administratively fixed prices of key food products for public distribution kept unchanged
Efforts to secure sufficient supplies of grain for buffer stocks
Increased input subsidies particularly for fertilisers
Increased minimum prices and banned futures trading on a range of agricultural commodities
Removed tariffs on wheat, rice, maize and pulses
Export ban on wheat, corn, pulses and non-basmati rice
Introduced minimum export price and duty on basmati rice
Russia
Increased interest rates
Price freeze on wheat and rye bread, milk and fermented milk, sunflower oil and eggs; voluntary price restraint agreement
Released stocks of grain
Fuel subsidies to mitigate higher energy prices; additional per tonne subsidies for pigmeat and poultry
Reduced tariffs on milk and milk products, cheese, some types of vegetable oil and vegetables
Lifted duties on poultry and eggs imported for breeding purposes
Introduced temporary ban on exports of wheat to Belarus and Kazakhstan
Introduced export taxes on grain
South Africa
Increased spending on the food package programme
Lowered the biofuel target level in liquid fuel from 4% to 2.5%
Removed tariffs on maize if the world price is greater than USD 110 for more than two weeks
Ukraine
Mark-up limits on flour and retail price limits on breads, voluntary price restraint agreements
Released stocks of grain, flour, sugar and meat
Granted preference to state trading enterprises
Export quotas for grains and oilseeds
Source: OECD Secretariat, 2008. The table structure is based on that developed by the FAO Global Information and Early Warning System (GIEWS) on food and agriculture.

7
The varying responses of the seven economies reflect differences in their net trading positions
(Figure 1), income levels, distribution of poverty, share of expenditure on food, and government economic
policy. The contrasting responses of Chile and China illustrate this. In comparison with China, the
response in Chile has been quite muted reflecting the fact that Chile is a net exporter while China is a net
importer; income per capita in Chile (measured in PPP USD) is 2.5 times higher than in China; the share of
expenditure on food in Chile is around half the level in China; and the level of state involvement in the
market is minimal in Chile.
Figure 1. Agricultural and food trade balance, 1995 and 2007
-10 000
-8 000
-6 000
-4 000
-2 000
0
2 000
4 000
6 000
8 000
10 000
Russia China South Africa Ukraine Chile India Brazil
USD Million
1995 2007
38 865
-18 518
Data for Russia and Ukraine is for 1996 instead of 1995; data for South Africa is for 2000 instead of 1995. Source: UN, UN Comtrade database, 2008; OECD calculations based on national data, 2008.
Other changes reflect differing policy objectives among the emerging economies
During 2006-08, a number of new policy measures and major changes to existing policies were
introduced in each of the seven economies:
Brazil – Prior to the introduction of policy measures to deal with rising food prices, a number of
measures were introduced in 2006 to deal with falling producer incomes. Lower output prices,
attributable in large part to the appreciation of the Real against the USD, and higher production
costs as well as localised droughts, pest and disease outbreaks were causing financial hardships
for many farmers. In response, the government introduced a new payment based on output,
expanded credit facilities and deferred debt repayments on investment and working capital for a
period of one year (which was further rolled over in 2007). Of particular note was the extent to
which these measures were introduced to support soybean producers.
8
Chile – Stronger emphasis was put on credit programmes for small-scale agriculture. These
programmes are designed and co-ordinated by the National Institute of Agricultural
Development (INDAP) with the purpose of increasing credit allocations to smallholders from the
private financial sector. In 2007, investments in general services increased to account for more
than a third of total expenditures to support agriculture.
China – Agricultural tax reform was completed in 2006 and a new Property Law adopted in 2007
strengthened farmers’ legal rights to land. However, farmers are still prohibited from raising a
mortgage on the land, which limits access to credit. Pilot insurance schemes have been
introduced for grain and livestock producers, with the cost shared between central government,
local government and farmers. Stronger support for farmers is part of a wider programme of
improving access to basic services such as education, health care and social security for the rural
population.
India – Improvement of rural infrastructure has been given a high priority to make India’s
growth “more inclusive and equitable”. A large part of this rural investment is to be undertaken
within a programme Bharat Nirman focussing on the expansion of irrigation area, improved
water management, support for rural roads, housing, electrification, telecommunication, research
and diversification of economic activities. The National Policy for Farmers, introduced in 2007,
places greater emphasis on the economic well-being of farmers and rural development rather than
just on agricultural production. In 2006, a new package was introduced to revive the short-term
rural co-operative credit structure and to expand credit available to farmers at preferential interest
rates. In 2008, the government announced a large scheme to waive overdue and unpaid debt,
initially for small and marginal farmers, but then extended to include commercial producers.
Russia – As part of a broader administrative reform process, the roles and responsibilities of
central and regional governments in the delivery and financing of agricultural programmes were
defined more clearly, and a multi-year overarching framework for the delivery of agricultural
policy was introduced. With twin aims of stimulating agricultural production and improving rural
areas through technological modernisation and investment in social infrastructure, there has been
a significant expansion in concessional credit.
South Africa – Following an evaluation of the performance of its land, agriculture and rural
sector policies, the government adopted three new measures to accelerate the pace of land
redistribution: the Land and Agrarian Reform Project (LARP) provides a new Framework for
delivery and collaboration on land reform and agricultural support to accelerate the rate and
sustainability of transformation through aligned and joint action by all involved stakeholders; the
Pro-Active Land Acquisition Strategy (PLAS) under which the government proactively
identifies, purchases and distributes land in terms of established needs; and Sourcing Strategic
Partners (from key non-governmental stakeholders) that will speed up land delivery, and more
importantly, ensure stability of the farms and projects delivered, by providing skills and expertise
that are currently lacking in the public service.
Ukraine – The main driver of policy changes over the period was the long awaited accession to
the WTO in 2008. Many modifications in national legislation were implemented to comply with
the WTO requirements. Prior to accession, tariffs had been reduced substantially for key
commodities such as pigmeat, poultry and sugar. An attempt is being made to improve co-
ordination regarding the formation and implementation of agricultural policy measures.
While negotiations for Russia’s accession to the WTO have reached an advanced stage, particularly in
terms of market access, the remaining issues include determining the level of agricultural domestic support
commitments. At the multilateral level, agriculture remains one of the areas of continuing difficulty in the
WTO negotiations. In June 2008, ministers from WTO member countries failed to conclude a final

9
agreement in the Doha round of negotiations. An impasse was reached on the terms that would govern
Special Safeguard Mechanism remedies, with some developing countries, notably China and India, arguing
that they needed additional flexibility, including the right to raise tariffs above bound rates – a position that
could not be reconciled with demands for improved access to developing country markets.
All seven emerging economies have been engaged in bilateral and regional trade negotiations during
2006-08. Among the most significant to be concluded, or in which substantive progress was made, were
agreements between: Ukraine and the European Union (EU); India and the Association of South East
Asian Nations (ASEAN), and with the EU; China and Pakistan, and with New Zealand; South Africa, as
part of the Southern African Development Community, and the EU; and Brazil, as part of Mercosur, with
Venezuela, Chile and Israel.
Developments in agricultural support
Producer support is provided at a relatively low level
The percentage Producer Support Estimate (%PSE) is the key indicator used to measure the level of
support to agricultural producers. It expresses the estimated monetary value of policy transfers from
consumers and taxpayers to producers (defined as the PSE) as a percentage of gross farm receipts. The
%PSE is useful for analysing changes in the level of support both over time and between countries.
The report examines agricultural support estimates for six of the seven emerging economies (support
estimates are not available for India because the government of India does not participate in the review
process). For all six economies, the level of producer support as measured by the %PSE has been lower
than the OECD average for all years of the past decade (Figure 2).
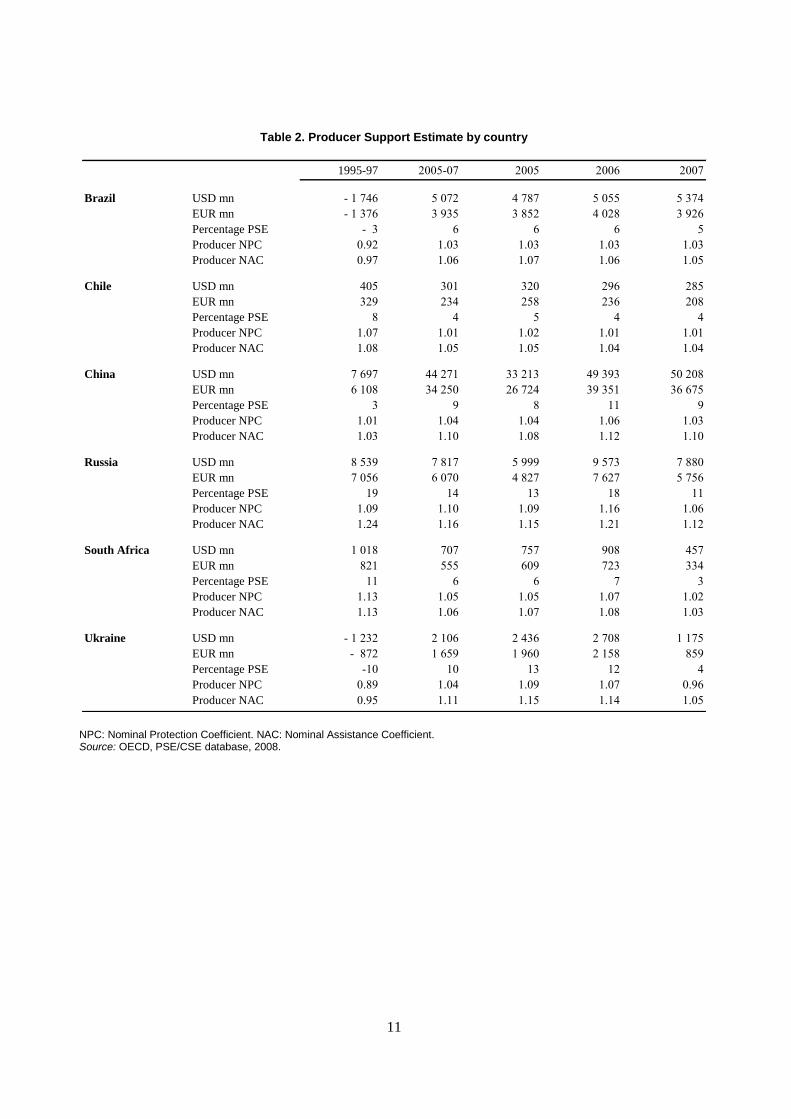
In 2005-07, the value of policy transfers to producers represented 4% of gross farm receipts in Chile,
6% in Brazil and South Africa, around 9% in China and Ukraine, and 14% in Russia. This compares with
an average level of producer support in the OECD area of 26% in 2005-07. Russia, with the exception of
1999 (a year following the 1998 financial crisis), has the highest level of producer support among the six
emerging economies being evaluated in this study (Table 2).
Trends in the level of producer support over time vary between economies:
In Chile and South Africa, the level of producer support has fallen from around 10% in the
mid-1990s, to 4% and 7% respectively in 2005-07.
While the level of producer support in Brazil has been relatively constant at about 5% during the
current decade, this represents a slight rise from the mid-1990s when policies effectively taxed
the sugar cane/ethanol sector.
Since the late 1990s, there has been a steady rise in producer support in China, which has
stabilised at around 9% in recent years.
The level of support to agricultural producers in Russia has been steadily rising over the current
decade, from around 5% of farm receipts in the early 2000s to 14% in 2005-07, although it
remains below the 1995-97 level of 19%.
Ukraine has the greatest variability in producer support levels from year to year. Even as
recently as 2003, agricultural producers in Ukraine were being “taxed” rather than supported by
government policies.

10
Figure 2. Evolution of producer support levels, 1997 to 2007
%PSE
-10
-5
0
5
10
15
20
25
30
35
40
1997 1998 1999 2000 2001 2002 2003 2004 2005 2006 2007
Brazil Chile China Russia South Africa Ukraine OECD
Source: OECD, PSE/CSE database, 2008.
11
Table 2. Producer Support Estimate by country
1995-97 2005-07 2005 2006 2007
Brazil USD mn - 1 746 5 072 4 787 5 055 5 374
EUR mn - 1 376 3 935 3 852 4 028 3 926
Percentage PSE - 3 6 6 6 5
Producer NPC 0.92 1.03 1.03 1.03 1.03
Producer NAC 0.97 1.06 1.07 1.06 1.05
Chile USD mn 405 301 320 296 285
EUR mn 329 234 258 236 208
Percentage PSE 8 4 5 4 4
Producer NPC 1.07 1.01 1.02 1.01 1.01
Producer NAC 1.08 1.05 1.05 1.04 1.04
China USD mn 7 697 44 271 33 213 49 393 50 208
EUR mn 6 108 34 250 26 724 39 351 36 675
Percentage PSE 3 9 8 11 9
Producer NPC 1.01 1.04 1.04 1.06 1.03
Producer NAC 1.03 1.10 1.08 1.12 1.10
Russia USD mn 8 539 7 817 5 999 9 573 7 880
EUR mn 7 056 6 070 4 827 7 627 5 756
Percentage PSE 19 14 13 18 11
Producer NPC 1.09 1.10 1.09 1.16 1.06
Producer NAC 1.24 1.16 1.15 1.21 1.12
South Africa USD mn 1 018 707 757 908 457
EUR mn 821 555 609 723 334
Percentage PSE 11 6 6 7 3
Producer NPC 1.13 1.05 1.05 1.07 1.02
Producer NAC 1.13 1.06 1.07 1.08 1.03
Ukraine USD mn - 1 232 2 106 2 436 2 708 1 175
EUR mn - 872 1 659 1 960 2 158 859
Percentage PSE -10 10 13 12 4
Producer NPC 0.89 1.04 1.09 1.07 0.96
Producer NAC 0.95 1.11 1.15 1.14 1.05
NPC: Nominal Protection Coefficient. NAC: Nominal Assistance Coefficient. Source: OECD, PSE/CSE database, 2008.

12
Table 3. Consumer Support Estimate by country
1995-97 2005-07 2005 2006 2007
Brazil USD mn 2 700 - 1 863 - 1 923 - 1 655 - 2 012
EUR mn 2 193 - 1 445 - 1 547 - 1 319 - 1 469
Percentage CSE 5 - 3 - 3 - 3 - 3
Consumer NPC 0.95 1.04 1.05 1.03 1.03
Consumer NAC 0.95 1.03 1.04 1.03 1.03
Chile USD mn - 405 - 178 - 316 - 131 - 86
EUR mn - 329 - 141 - 254 - 104 - 63
Percentage CSE - 8 - 3 - 5 - 2 - 1
Consumer NPC 1.09 1.03 1.05 1.02 1.01
Consumer NAC 1.09 1.03 1.05 1.02 1.01
China USD mn - 3 667 - 21 507 - 13 405 - 27 446 - 23 669
EUR mn - 2 758 - 16 647 - 10 786 - 21 866 - 17 289
Percentage CSE -2 -4 -3 -6 -4
Consumer NPC 1.02 1.05 1.04 1.07 1.04
Consumer NAC 1.02 1.04 1.03 1.06 1.04
Russia USD mn -3 894 -9 970 -7 485 -12 097 -10 328
EUR mn -3 502 -7 735 -6 022 -9 638 -7 544
Percentage CSE -7 -15 -13 -18 -13
Consumer NPC 1.09 1.16 1.14 1.21 1.15
Consumer NAC 1.10 1.17 1.15 1.21 1.16
South Africa USD mn - 1 024 - 555 - 470 - 928 - 266
EUR mn - 823 - 437 - 378 - 739 - 194
Percentage CSE -12 -4 -4 -7 -2
Consumer NPC 1.14 1.05 1.05 1.08 1.02
Consumer NAC 1.13 1.05 1.04 1.08 1.02
Ukraine USD mn 2 062 - 922 - 1 691 - 1 465 391
EUR mn 1 536 - 747 - 1 361 - 1 167 285
Percentage CSE 18 -6 -10 -8 2
Consumer NPC 0.88 1.05 1.11 1.08 0.96
Consumer NAC 0.89 1.06 1.11 1.09 0.98
NPC: Nominal Protection Coefficient. NAC: Nominal Assistance Coefficient. Source: OECD, PSE/CSE database, 2008.
Producer support is provided through measures which support commodity output or input use
In addition to the level of support, it is also instructive to analyse the composition of support, showing
the different ways in which support is provided. As in most OECD countries, support based on commodity
output (market price support – MPS, and payments based on output) is an important way in which transfers
are delivered to producers in the six emerging economies, particularly in Russia, South Africa and Ukraine
(Figure 3). In the emerging economies this almost exclusively takes the form of transfers associated with
MPS policies, primarily import protection, with only Brazil, Russia and Ukraine providing payments based
on output. In contrast to most OECD countries, a considerable portion of support is provided to agricultural
producers in the six emerging economies through payments based on input use (interest concessions,
fertiliser subsidies, etc), with comparatively less use made of other payments, such as those based on land,
animals or income.

13
While support based on commodity output decreased in importance for the OECD as a whole between
1995-97 and 2005-07, it increased in importance for four of the six emerging economies. Only in Chile and
South Africa did support based on commodity output fall as a share of gross farm receipts between the two
periods; hence it is the main factor contributing to the reduction in the level of producer support in both
countries. In China and Russia there was a rise in support based on commodity output. While this led to a
rise in the level of producer support in China, in Russia the level of support has fallen because of a
reduction in other forms of support, most notably transfers associated with debt restructuring. Brazil and
Ukraine both had significantly negative commodity based support in 1995-97. This has changed, with
producers in both countries benefiting from support based on commodity output leading to an increase in
the %PSE, but in Ukraine MPS was again negative in 2007.
Figure 3. Composition of producer support, 1995-97 and 2005-07
%PSE
-20 -15 -10 -5 0 5 10 15 20 25 30
2005-07
1995-97
2005-07
1995-97
2005-07
1995-97
2005-07
1995-97
2005-07
1995-97
2005-07
1995-97
2005-07
1995-97
Ch
ileB
razi
lC
hin
aSo
uth
A
fric
aU
krai
ne
Ru
ssia
OEC
D
MPS + payments based on output Payments to inputs Other payments
Source: OECD, PSE/CSE database, 2008.
These changes in support based on commodity output are also quite clearly shown by changes in the
producer Nominal Protection Coefficient (producer NPC): the ratio between the producer price (including
payments per unit of output) and the border price. This highlights the degree to which policies increase
prices received by domestic producers.
The average producer NPC for the OECD area was 1.20 for the period 2005-07, meaning that in the
OECD farmers received, on average, prices that were 20% above international levels (Figure 4). In
1995-97 prices were 30% higher (NPC of 1.30), indicating that the gap between domestic and world prices
has fallen by about one-third on average across all commodities across the OECD.

14
Figure 4. Producer Nominal Protection Coefficients, 1995-97 and 2005-07
0.8 0.9 1.0 1.1 1.2 1.3 1.4
Chile
Brazil
Ukraine
China
South Africa
Russia
OECD
1995-97 2005-07
Source: OECD, PSE/CSE database, 2008.
The gap between domestic and international prices also fell in Chile and South Africa between
1995-97 and 2005-07, although producer prices in Chile are, on average, more closely aligned with world
prices than in South Africa. In contrast, producer NPCs for Russia and China have increased, implying a
greater misalignment of domestic prices vis-à-vis world market levels. In Brazil and Ukraine, the situation
is more complex. In 1995-97, producers received on average prices that were around 10% lower than
world prices (negative NPCs): in 2005-07, producers received prices 3%-4% greater than world prices
(positive NPCs). Consequently, while the producer NPC increased in both Brazil and Ukraine, average
producer prices are now more closely aligned with world prices than in 1995-97.
Producer support is often concentrated on a few commodities
The composition of support can also be analysed from the standpoint of the flexibility that policies
accord to producers in determining production choices. For example, a payment designated for one specific
commodity implies that in order to receive payment a farmer must produce that commodity. In contrast,
payments may be provided to a group of commodities, i.e. any crop belonging to the cereals group, simply
to any commodity without distinction. The prevalence of transfers directed to single commodities – as
reflected by the share of Single Commodity Transfers (SCT) in the PSE – conveys important information
on the flexibility given to producers in their production choices.1
1. SCT includes all market price support and payments based on output – as these forms of support are
specific to a particular commodity be definition – as well as any payments provided to single commodities
under other categories of support which require commodity production.

15
The share of SCT in the PSE for the OECD countries fell from 74% in 1995-97 to 59% in 2005-07,
driven mainly by a fall in MPS (Figure 5). Among the emerging economies, around 70% of producer
support in South Africa and Russia is provided through single commodity transfers, indicating little
production flexibility for farmers if they want to retain support. In contrast, less than 30% of support in
Chile and China is provided in this form. Around 50% of producer support in Brazil and Ukraine is
provided through transfers designated for a specific commodity.
Figure 5. Single Commodity Transfers as a share of PSE, 1995-97 and 2005-07
0 10 20 30 40 50 60 70 80 90 100
Chile
China
Ukraine
Brazil
Russia
South Africa
OECD
Share of Producer SCT in Total PSE (%)
1995-97 2005-07
Data is not presented for Brazil and Ukraine for the years 1995-97 because SCT was negative in these countries during this period. For China, SCT as a share of PSE was just 0.1 % for the years 1995-97. Source: OECD, PSE/CSE database, 2008.
It is also instructive to look at the extent to which farmer’s receipts for a particular commodity depend
on the Single Commodity Transfers (the %SCT indicator). This measures the estimated monetary value of
SCT for a commodity as a share of gross farm receipts for that commodity. While the level of support to
agricultural producers in the emerging economies is below 10% of gross farm receipts for the sector as a
whole, with the exception of Russia, there are commodities in each economy where SCTs account for a
substantial share of farmers’ receipts (Table 4).

16
Table 4. Single Commodity Transfers by commodity, 2005-07
%PSE SCT as per cent of gross farm receipts for each commodity
10%-20% 20%-30% 30%-40% Over 40%
Brazil 5.8 Cotton Rice Chile 4.4 Sugar China 9.2 Soybean, Sheepmeat Maize Sugar Cotton Russia 13.9 Milk Beef & veal, Poultry Sugar, Pigmeat South Africa 5.7 Sugar, Sheepmeat Ukraine 9.9 Beef & veal Pigmeat, Sugar Poultry
Source: OECD, PSE/CSE database, 2008.
Sugar appears in the list for all countries, with the exception of Brazil. There is no consistent pattern
of support for any other commodities across the emerging economies, reflecting differences in production
and consumption patterns and policy objectives. For example, it is mainly crops that receive SCT support
in China, while it is mostly livestock products in Russia and Ukraine. Brazil, Chile and South Africa, the
three emerging economies with the lowest level of producer support, have only one or two commodities
with a %SCT value above 10%, although the level of support for cotton and rice in Brazil is relatively
higher.
Relative importance of support to general services is increasing in some economies but falling in others
In addition to support provided to producers individually (PSE), the agricultural sector is assisted
through public financing of services such as agricultural research and development, training, inspection,
infrastructure, marketing and promotion, and public stockholding. The General Services Support
Estimate (GSSE) measures the value of the associated transfers. Some of these expenditures constitute
potentially important areas of public investment, which may in the long run improve the competitiveness
of the agricultural sector and yield higher and sustained returns to farmers than commodity price support or
input subsidies.
The share of GSSE in total support (%GSSE) indicates the relative importance of these transfers
within overall support to the agricultural sector. The six emerging economies spend a greater proportion of
total support on general services than for the OECD as a whole (Figure 6). In South Africa, over half of
total transfers to agriculture are categorised as GSSE, which represents about one-third of transfers in
Chile, and one-quarter in Brazil and China.
In all six emerging economies, expenditure on infrastructure to support agriculture (irrigation,
drainage, farm consolidation, etc.) is one of the major categories of GSSE category of expenditure. A
significant portion goes to research and development in Chile and South Africa, although in Brazil
expenditure on research and development has fallen in relative importance. Public stockholding is
important in China, and there has been a considerable increase in expenditure on inspection services in
Russia and Ukraine.
The total value of support to the agricultural sector is measured by the Total Support Estimate (TSE),
which represents the sum of transfers to agricultural producers individually (PSE) and collectively (GSSE),
as well as subsidies from taxpayers to consumers. For the OECD as a whole, total transfers arising from
agricultural support policies represented around 1% of GDP in 2005-07, and have fallen over time as non-
agricultural sectors of the economy have grown and support levels to agriculture have fallen (Figure 7).
This is not the case for some emerging economies, in particular for China, where, despite the rapid
expansion of the Chinese economy, support to agriculture has risen from about 1.5% of GDP in 1995-97 to
more than 2% in 2005-07. Support to agriculture also imposes a considerable burden on the economy in
Ukraine, with a %TSE of about 2.5%. For the other four countries, support to agriculture represents around
1% or less of GDP.

17
Figure 6. Level and composition of General Services Support Estimate, 2000-02 and 2005-07
Share of Total Support (%GSSE)
0 5 10 15 20 25 30 35 40 45 50 55 60
2005-07
2000-02
2005-07
2000-02
2005-07
2005-07
2000-02
2005-07
2000-02
2005-07
2000-02
2005-07
2000-02
Russ
iaBr
azil
Ukr
aine
Chin
aCh
ileSo
uth
Afric
aO
ECD
%
Infrastructure Research and Development Other GSSE
2000-021
1. For Ukraine, data for 2000-02 is not presented because the TSE was negative in 2002. Source: OECD, PSE/CSE database, 2008.
Figure 7. Composition of Total Support Estimate, 1995-97 and 2005-07
Per cent of GDP
-3 -2 -1 0 1 2 3
2005-07
1995-97
2005-07
1995-97
2005-07
1995-97
2005-07
1995-97
2005-07
1995-97
2005-07
1995-97
2005-07
1995-97
Chile
Braz
ilSo
uth
Afr
ica
Russ
iaCh
ina
Ukr
aine
OEC
D
%
GSSE Transfers to consumers from taxpayers PSE
Source: OECD, PSE/CSE database, 2008.

18
Policy observations and recommendations
Based on the previous sections of this overview, the following policy conclusions and
recommendations can be drawn:
The level of support to agricultural producers in the emerging economies is relatively low
compared to that provided in many OECD countries. However, there are certain commodities in
each economy that benefit from a greater amount of support than others, with sugar being an
obvious example in many cases. This provides a strong incentive to farmers to retain production
of these commodities, diverting more resources such as land, labour and fertilisers into their
production than would otherwise be the case. As governments consider policy measures to
increase food production in response to higher food prices, they should consider reducing support
for some commodities which are attracting more resources than they would otherwise because of
current policy settings.
The imposition of export barriers in response to higher food prices, while reflecting legitimate
concerns about food security, does not target those most in need and is likely to undermine
producers’ supply response. Moreover, while they may reduce the risks of food shortages in the
short term, they are likely to make international markets smaller and more volatile. Export bans
undermine trust in trade and encourage self-sufficiency driven policies in importing countries.
Export restrictions have harmful effects on import-dependent trading partners. For example,
export restrictions on rice in India affected Bangladeshi consumers adversely and also dampened
the incentives for rice farmers in India to invest in agriculture, which is a long-term driver of
growth. They also impede the transmission of price signals to domestic producers. For example,
export quotas involved substantial foregone revenue in the grain and oilseed sectors, and reduced
Ukraine’s total export earnings.
The introduction of export barriers, and their subsequent destabilising effect on world markets,
has drawn attention to the fact that WTO rules do not prevent countries from imposing such
export restrictions and that export taxation is not well disciplined. Weak rules in this area create
uncertainty about the world market as a reliable source of food supplies.2
A number of countries have responded to the food price crisis by increasing input subsidies,
particularly for fertiliser, to stimulate production. While prices for energy based inputs have
certainly increased, great care needs to be exercised in the delivery of these policies. In particular,
it may be sensible to make such increases in subsidies time bound, or closely linked to
international prices so that they are reduced if prices come back down. Further, appropriate
regulations and extension services need to be provided and enforced to ensure that the increased
use of chemical inputs does not lead to further environmental damage.
Efforts are being made to improve the delivery of agricultural policy in a number of emerging
economies, through administrative reform, the rationalisation of policy measures, the
establishment of co-ordinated multi-year frameworks, and the introduction of private sector
expertise and skills, among other initiatives. These are all welcome developments as consistency
and transparency are vital for the success of any policy regime.
Initiatives to introduce or expand insurance opportunities for farmers are also positive steps.
Insurance schemes, if successful, can reduce the need for market intervention and assist farmers
2. At present, the WTO provides only minimal disciplines on export restrictions, mainly a notification
requirement. Under the current DDA modalities members would be obliged to notify the WTO of new
export restrictions or prohibitions within 90 days of their entry into force, with the duration of these
measures limited to 12 months, or up to 18 months if affected importing countries were to agree.

19
develop appropriate risk management strategies. However, when heavily subsidised, insurance
schemes can encourage excessive risk taking, leading to an expansion in production of the
commodities covered by the insurance scheme at the expense of those that are not and the
development of farming in areas which are not suitable for agricultural production, resulting in
environmental degradation. When establishing or reviewing these schemes, governments need to
consider carefully whether subsidies provided for the operation of the scheme can be phased out
over a period of time, so that farmers gradually move towards paying the full costs of the
programmes.
Producer access to credit is vital for the development of agriculture in the emerging economies. A
number of governments have increased the amount of credit available to farmers, including both
commercial and small-scale producers. While the government can play a vital role in establishing
the credit market, more can be done to expand private sources of credit, particularly to small
producers. Rather than simply expanding government-supported credit, barriers to the expansion
of private credit need to be reviewed and removed if feasible. However, the global financial crisis
during the latter half of 2008 is likely to severely curtail governments’ opportunities for doing
this.
A number of governments have taken steps during the period to either defer repayment of
producer debt or completely write it off. These actions were taken to address a short term
problem (financial difficulties) but they may worsen a long term structural deficiency
(underdeveloped credit markets) because they can damage the discipline of credit systems. They
can also create an expectation on the part of farmers that the government will bail them out in the
event of future payment difficulties. Furthermore, such schemes may end up compounding rather
than alleviating the debt problem because they make farmers’ eligible for fresh credit despite not
being creditworthy.
The relative increase in expenditure on general services for agriculture, particularly infrastructure
and research and development, is reassuring. However, significant room remains for improving
the efficiency of public resources by increasing investments on high-priority public goods. Public
investments are needed to ensure that the supply responses to higher prices can take place and
that new strains of crops which deliver quantum yield increases are developed.

20
Table of Contents
of the publication
Foreword
List of Acronyms and Abbreviations
Executive Summary
Chapter 1. Overview
Developments in world food markets Main changes in agricultural policies Developments in agricultural support Policy observations and recommendations Bibliography
Chapter 2. Brazil
Summary of policy developments Policy context: Brazil agriculture at a glance Policy developments Bibliography
Chapter 3. Chile
Summary of policy developments Policy context: Chile’s agriculture at a glance Policy developments Bibliography
Chapter 4. China
Summary of policy developments Policy context: China’s agriculture at a glance Policy developments Bibliography
Chapter 5. India
Overview of support estimates for Indian agriculture Policy context: India’s agriculture at a glance Policy developments Bibliography
Chapter 6. Russia
Summary of policy developments Policy context: Russia’s agriculture at a glance Policy developments Bibliography
Chapter 7. South Africa
Summary of policy developments Policy context: South Africa’s agriculture at a glance Policy developments Bibliography

21
Chapter 8. Ukraine
Summary of policy developments Policy context: Ukraine’s agriculture at a glance Policy developments Bibliography
Annex A. Measuring Agricultural Support
1. Definitions of OECD indicators of agricultural support 2. The PSE classification 3. Measuring agricultural support in emerging economies: technical updates and improvements
Annex B. Statistical Annex

Agricultural Policies in Emerging Economies MONITORING AND EVALUATION
This report analyses policy developments during 2006-08 in seven economies: Brazil, Chile, China, India, Russia, South Africa and Ukraine. This period was marked by a significant increase in world prices for most, but not all, agricultural commodities. Policy responses to rising food prices included tariff reductions, export restrictions, increased minimum prices and price controls, input subsidies, sales of stocks and direct transfers to the most disadvantaged. Other major common policy developments included: expanded government-supported credit facilities and/or debt rescheduling, endeavours to improve the delivery and performance of agricultural policies, extended coverage of insurance programmes and further efforts in land reform. A comprehensive statistical annex containing a wide range of contextual information for these economies is also included in this report.Estimates of support to agriculture in six economies (India is not yet covered) from 1995 to 2007 are provided, in conformance with recent changes to the OECD measurement methodology. This allows a consistent comparison across emerging economies and with OECD countries in terms of changes in the level and composition of support to producers and the sector as a whole. Findings show that the level of producer support during 2006-08 was lower than the OECD average in all six economies, with significant differences between them. Nevertheless, the level of producer support has shown a general increase over time and is typically provided in ways that distort production and trade. The database of indicators for the six economies is available on line: www.oecd.org/tad/support/psecse.
FURTHER READING
OECD Rural Policy Reviews: China (2009)OECD Review of Agricultural Policies: Chile (2008)Agricultural Policies in OECD Countries: At a Glance (2008)OECD’s Producer Support Estimate and Related Indicators of Agricultural Support: Concepts, Calculations, Interpretation and Use (The PSE Manual) (2008), available at www.oecd.org/tad/support/psecse
Agricultural Policies in Emerging EconomiesMONITORING AND EVALUATION
www.oecd.org/tad
HIGHLIGHTS HIGHLIGHTS
2009
«