u.s. forest products annual market review and prospects
TRANSCRIPT

U.S. Forest Products Annual Market Review and Prospects, 2009–2013James L. HowardDavid B. McKeever
ForestProductsLaboratory
Research NoteFPL–RN–0330
United States Department of AgricultureForest Service

July 2013
Howard, James L.; McKeever, David B. 2013. U.S. forest products annual market review and prospects, 2009–2013. Research Note FPL-RN-0330. Madison, WI: U.S. Department of Agriculture, Forest Service, Forest Prod-ucts Laboratory. 10 p.
A limited number of free copies of this publication are available to the public from the Forest Products Laboratory, One Gifford Pinchot Drive, Madison, WI 53726–2398. This publication is also available online at www.fpl.fs.fed.us. Laboratory publications are sent to hundreds of libraries in the United States and elsewhere.
The Forest Products Laboratory is maintained in cooperation with the University of Wisconsin.
The use of trade or firm names in this publication is for reader information and does not imply endorsement by the United States Department of Agriculture (USDA) of any product or service.
The USDA prohibits discrimination in all its programs and activities on the basis of race, color, national origin, age, disability, and where applicable, sex, marital status, familial status, parental status, religion, sexual orienta-tion, genetic information, political beliefs, reprisal, or because all or a part of an individual’s income is derived from any public assistance program. (Not all prohibited bases apply to all programs.) Persons with disabilities who require alternative means for communication of program informa-tion (Braille, large print, audiotape, etc.) should contact USDA’s TARGET Center at (202) 720–2600 (voice and TDD). To file a complaint of discrimi-nation, write to USDA, Director, Office of Civil Rights, 1400 Independence Avenue, S.W., Washington, D.C. 20250–9410, or call (800) 795–3272 (voice) or (202) 720–6382 (TDD). USDA is an equal opportunity provider and employer.
AbstractThis paper describes the current state of the U.S. economy and provides general and statistical information on forest products production, trade, consumption, and prices. Market developments are described for sawn softwood, sawn hard-wood, softwood log trade, wood-based panels, paper and paperboard, fuelwood, forest product prices, and housing starts. Policy initiatives that can affect domestic markets and international trade in wood products are also discussed. Data are provided through the end of the year 2011 with estimates for 2012 and forecasts for 2013.
Keywords: production, trade, prices, forest products
AcknowledgmentThis publication contains contributions from Zoe Abrams, Economics Assistant, who organized and compiled much of the data contained in this report.
ContentsExecutive Summary ............................................................ 1
General Economic and Major Market Trends ..................... 2
Timber Products Production, Trade, and Consumption ...... 3
Statistics and Prospects ................................................... 3
U.S. Wood Product Market Shares ................................. 3
Sawn Softwood ............................................................... 5
Sawn Hardwood .............................................................. 5
Softwood Log Trade ....................................................... 5
Hardwood Log Trade ...................................................... 5
Pulpwood ........................................................................ 5
Structural Panels ............................................................. 7
Hardwood Plywood ........................................................ 7
Particleboard and Medium Density Fiberboard .............. 7
Hardboard ....................................................................... 7
Insulation Board .............................................................. 7
Fuelwood......................................................................... 8
Forest Products Prices ..................................................... 8
Energy Policy Initiatives ..................................................... 8
Wood Energy ................................................................... 8
Biomass Energy .............................................................. 9
Summary of Timber Products and Energy Policy ............... 9
References ........................................................................... 9
Other Sources of Information ........................................... 10

U.S. Forest Products Annual Market Review and Prospects, 2009–2013James L. Howard, EconomistDavid B. McKeever, Research Forester
Forest Products Laboratory, Madison, Wisconsin
Executive SummarySomewhat unexpected, economic activity in the United States exhibited continued weakness during the third quarter of 2012, confirmed by the decline in the estimated annual rate of real gross domestic product (GDP) to 1.6%. Econom-ic activity during the fourth quarter of 2012 was projected to increase to an annual rate of 2.1%. The rate of growth in the U.S. economy will likely remain flat in the first half of 2013, as predicted earlier in the year by the 48 forecasters surveyed by the Federal Reserve Bank of Philadelphia (FRB 2012). The lower rate of growth in the U.S. economy predicted for 2013 results from the declining growth in exports for the U.S. economy as Europe cuts imports. The indications are that global trade is stalling, dimming pros-pects that exports will buoy the U.S. economy in the coming months. Growth in U.S. real output looks weaker and infla-tion lower over the near term compared with previous esti-mates. Forecasters, as expected, saw a slight decline in the 2012 unemployment rate, measured on an annual-average basis. Unemployment was expected to fall from 8.1% in the second quarter of 2012 to 7.9% in the first quarter of 2013, but the decline to 7.8% in the third quarter of 2012 was unexpected. The unemployment rate was 9.6% at the beginning of 2011 because many unemployed people simply stopped looking for work. The forecasters see prices rising in the third quarter of 2012 at a slightly lower rate than pre-viously expected, and then declining in the fourth quarter of 2012 staying level into 2013. Much stronger during the first 9 months of 2012, the housing recovery seems to be gaining a little momentum. While still remaining close to historic lows, new home sales remained steady in September with expectations for continued improvement into 2013 (NAHB 2012a,b). September’s housing starts were also encourag-ing, jumping 2.3% to their highest level since April 2010 (NAHB 2012a,b). The increase came mostly from the single family sector, which the industry finds encouraging. Without a sustained housing sector recovery, some economists be-lieve, the economy cannot fully recover.
The decline in the housing sector had a negative effect on softwood lumber consumption through 2010. According to the Western Wood Products Association (WWPA), during the first 7 months of 2012, softwood lumber consumption increased 6.9% from the same period in 2011, and
ship ments of softwood lumber from western mills increased 9.5% during the first 7 months of 2012 compared with the same period in 2011. The Southern region continues to have the highest levels of production and shipments of softwood lumber on a volume basis while the West leads in produc-tion and shipments of softwood lumber on a percentage basis.
Total structural panel production increased 4.3% over the first three quarters of 2012 when compared with the first three quarters of 2011 (APA 2012). For the first 9 months of 2012, structural panel production was up about 631 thou-sand cubic meters when compared with the same time pe-riod in 2011. Structural panel consumption at the end of the third quarter of 2012 was 1.2 million cubic meters above the same time period of a year ago, representing a 7.6% increase for the first three quarters in 2012. Overall, structural panel consumption is expected to increase to 23.0 million cubic meters in 2012 (Adair 2012). Structural panel market shares were negatively affected by the current economic downturn.
Roundwood production for pulp and wood-based panel mills was 127 million cubic meters in 2012, down slightly from 2011. As expected, roundwood pulpwood consumption continued to decrease during 2012. Pulpwood supplied from residues continued to decrease relative to roundwood. This is a result of declining residual production and competition for residuals for pellets and biomass and not out of prefer-ence on the part of pulp producers.
U.S. timber exports to China surged during 2011 but the opposite is true for the first 7 months of 2012, as both soft-wood lumber and softwood log exports to China are below levels of a year ago. Mills in the Pacific Northwest such as Weyerhaeuser and Plum Creek Timber benefited the most from the 2011 surge. China’s demand for wood was being fueled by demand for nonresidential construction, which has slowed.
The U.S. furniture industry, in retreat since 1999, was rela-tively flat during the first 8 months of 2012 as low-cost furniture imports and the sluggish global economy continues to erode the domestic industry market share. Employment in the domestic furni ture industry has fallen more than 50% since 1999.

Research Note FPL–RN–0330
2
General Economic and Major Market TrendsAccording to 48 forecasters surveyed August 10, 2012, by the Federal Reserve Bank of Philadelphia (FRB 2012) the U.S. economy is expected to grow at a slower rate during the third quarter of 2012 than during the second quarter, and the expectations of a fourth quarter rebound are slim. The forecasters expect real gross domestic product (GDP) to grow at an annual rate of 1.6% in 2012. The increased pes-simism about the labor market accompanies the outlook for weaker output growth. Measured on an annual-average ba-sis, unemployment is expected to average 8.2% in the third and fourth quarters of 2012 with the fourth quarter revised lower, for an average of 8.2% this year. The 48 forecasters expect unemployment to improve to 7.9% in 2013. This de-cline in unemployment equates to nonfarm payroll employ-ment growing at a rate of 125,000 jobs per month during the third quarter and 135,300 jobs per month next quarter. On an annual-average basis, the forecasters expect job gains of 154,600 per month in 2012 and 143,200 in 2013. During the Great Recession from 2007 to 2009, the effect on the job market was 8 million jobs lost in the worst economic down-turn since the 1930’s Great Depression. Almost every sector experienced job cuts: construction lost 2 million jobs, financial services lost 800,000 jobs, and the auto sector lost additional thousands of jobs. There were already about 7 million adults looking for full-time employment before the recession hit in December 2007. The U.S. economy must create about 125,000 new jobs per month just to keep up with population growth and to prevent unemployment from rising. The strength of GDP growth will be the major determinant of when the U.S. economy reaches full employ-ment. With strong GDP growth, full employment could be reached in 4 years. But if GDP growth is weak, reaching full employment could take 10 years.
Core inflation, as measured by the Price Index for personal consumption expenditures, is expected to average 2.0% in 2012 and rise slightly to 2.1% into 2013. On an annual- average over annual-average basis, inflation in the core consumer price index is projected to remain around 2.2% in 2012 before declining to 2.0% in 2013 (FRB 2012).
New housing construction showed improvement during the third quarter of 2012 when 872,000 units were started in September at a seasonally adjusted rate (NAHB 2012a,b). The increase was due mainly to gains of single family starts, which jumped to 603,000 units, up 11% from August. All four regions in the United States contributed to the increase in the level of housing starts during the first three quarters of 2012. After declining in August and September, starts in the Northeast are still on pace to exceed the 2011 level of August and September starts. After two months of falling starts, the Midwest and South saw starts rise by 6.7% and 20.0%, respectively, in September. The west region also experienced increases of 20.0% in September.
Single-family building permits in September increased 6.7% from 511,000 in August to 545,000 in September. The increase in starts reported in the Northeast and Midwest coincided with increases in permits of 6.0% and 19.5%, re-spectively. The South also experienced an increase in build-ing permits of 43,000 in September. New single-family units completed in September increased 8.5%, from 483,000 to 524,000 units. Total housing starts for 2011 were 609,000 units, and the expectations for 2012 are for significant improvement.
In August 2012, the total value of all new construction in the United States was $837 billion (U.S. short scale 109), $47 billion above the annual 2011 value of $790 billion (NAHB 2012a,b). The seasonally adjusted annual rate for the total value of new construction was above the 2011 annual rate for each month through August in 2012. Resi-dential construction was $273 billion in August 2012, $36 billion above the $237 billion annual rate of residential construction in 2011. Nonresidential construction was $289 billion during August 2012, 7% above the $269 billion in 2011. Public construction in 2011 accounted for nearly 36% of all construction. The National Association of Home Builders (NAHB) 2012 forecast calls for the housing sector to improve slightly in the 4th quarter, but starts and sales overall for 2012 will still end near 2011 levels.
With a large forest resource and high production and con-sumption of wood products, the United States continues to play an important role in world forest product markets. But for the past two or more years, the U.S. role on the world stage has diminished as a result of the contraction in the wood segment of America’s economy, precipitated by the decline in residential construction and production of build-ing materials. The United States is a world leader in the con-sumption of paper and paperboard (about 74 million metric tons in 2011), which is mostly supplied by domestic produc-tion and imports from Canada (AF&PA 2012). Domestic paper and paperboard production for the first 8 months of 2012 was about 1.2% below the production for the first 8 months of 2011. The U.S. solid wood industry manufactured about 61 million cubic meters of lumber and 16 million cu-bic meters of structural panel products in 2011. For the first 8 months of 2012, softwood lumber production was 6.9% above 2011 production, and for the first 8 months of 2012, structural panel consumption was 3.6% above 2011 levels. The U.S. forest products industry’s annual harvest was 365 million cubic meters in 2011, exceeding the 358 million cubic meters harvested in 2010. Domestic roundwood timber harvest in 2012 that supports domestic consumption is expected to be above the 2011 harvest level.
Expenditures for residential repair and remodeling fell in 2010 to $116 billion, down 38% from the record high years of 2006 and 2007. They remained flat in 2011. In 2007, the U.S. Department of Commerce stopped collecting residen-tial repair and remodeling data. The estimates for 2010 and

U.S. Forest Products Annual Market Review and Prospects, 2009–2013
3
2011 presented here are Forest Service estimates based on private residential construction expenditures. The NAHB Remodeling Market Index climbed to 50.0 in the third quar-ter 2012 up from 45.0 in the second quarter of 2012. This index level is equal to the level in 2005 prior to the hous-ing market crash. During this same period, new residential construction exhibited strengthening and continues do so into the fourth quarter 2012. Since 2000, expenditures for maintenance and repairs to all existing residential proper-ties have averaged about 25% of total expenditures, with the remaining 75% for improvements. Given the unprecedented levels of home foreclosures in the United States in recent years, residential improvements and repairs may be an even bigger part of the economy than usual. Many foreclosed homes need significant maintenance to become marketable. Expectations are for continued and growing investments in existing residential properties.
Two of the three major indicators of demand for wood prod-ucts—furniture and related products, paper products output, and total industrial production—were higher during the first 8 months of 2012 relative to 2011. Total industrial output also fell from year-ago levels:
Industrial production, an important demand determinant for pallet lumber, containerboard, and some grades of paper, increased 2.8% during the first 8 months of 2012 when compared with the annual level for 2011.
Furniture and related products output, a determinant of high-grade lumber production, was up during the first 8 months of 2012 by 2.1%.
Paper products output, a determinant of pulpwood and wood residue use, as well as recycled fiber availability and use, decreased during the first 8 months of 2012 compared with the 2011 average. The index (2007 = 100) of paper products output for the first 8 months of 2012 was 2.1% below of the 2011 average for the com-parable time period.
In summary, the housing sector gained strength during the first three quarters of 2012 and is expected to improve slightly going into the fourth quarter, and this strength is expected to continue into 2013. Starts in 2012 will prob-ably exceed year-ago levels but not by much. With the slow rate of growth in GDP, most analysts predict that conditions favorable to the growth of timber markets won’t occur until the second half of 2013. Selected U.S. economic indicators are shown in Table 1.
Timber Products Production, Trade, and ConsumptionStatistics and ProspectsProspects for wood and wood products are shown in Table 2. All volumes are reported in 1,000 cubic meters. Data for 2012 are preliminary estimates, data for 2013 are forecasts.
U.S. Wood Product Market SharesAnnual U.S. solid wood products production and foreign trade data are collected annually by governmental agencies and industry associations. This information provides an overview of how robust the wood using sectors of the U.S. economy are, and how their performance has changed over time (Howard and Westby 2013). But it does not provide detailed information specific to individual end-use markets needed to further evaluate changing patterns of consump-tion. End-use markets of interest include new single family, multifamily, and mobile home construction, repair and re-modeling of existing residential structures, low-rise nonresi-dential building and other types of nonresidential construc-tion, furniture and other manufactured wood products, and packaging and shipping. These end-use markets typically account for 80% to 90% of all solid wood products con-sumption. Market share estimates presented here are based on findings from limited public and private research reports that were related to more readily available, annual economic indicator data specific to each end-use market. Consumption
Table 1. Selected U.S. economic indicators, 2008–2012 Actuala Estimateb Forecastc
Indicator 2009 2010 2011 2012 2013 Gross domestic product (billion 2005 dollars) 14,119 14,662 15,076 15,673 16,320 New housing starts (million units) 0.56 0.59 0.61 0.75 0.84 Mobile home shipments (thousand units) 50 50 51 53 55 Total residential fixed investment (billion 2005 dollars) 346.6 346.2 327.6 364.2 399 Total nonresidential fixed investment (billion 2005 dollars) 1,290.8 1,362.6 1,378.2 1,500.0 1,586.9 Total industrial production (Index: 2007 = 100) 87.7 92.5 93.7 97.6 100.4 Furniture and related products (Index: 2002 = 100) 73.0 65.0 69.0 70.0 72.0 Paper products (Index: 2002 = 100) 80.0 81.2 84.0 82.0 80.0 aBoard of Governors of the Federal Reserve System. 2012, Council of Economic Advisors. 2012, NAHB. 2012a, U.S. Department of Commerce, Bureau of the Census. 2012. bForest Service estimates based on 2011 actual data and preliminary 2012 data. cNAHB. 2012b, Survey of Professional Forecasters and Forest Service estimates.

Research Note FPL–RN–0330
4
Table 2. Wood products production, trade and consumption for 2011‒2012, and outlook for 2013 Sawn softwood Oriented strandboard (OSB)
2011 2012 2013 2011 2012 2013 Production 45,390 48,567 49,766 Production 9,115 9,015 8,936 Imports 21,948 22,000 22,679 Imports 2,502 2,577 2,662 Exports 4,102 3,906 3,988 Exports 247 250 301 Consumption 63,236 66,661 68,457 Consumption 11,370 11,342 11,297
Coniferous logs Particleboard
2011 2012 2013 2011 2012 2013 Production 92,987 93,677 94,998 Production 4,053 3,902 4,006 Imports 1,409 1,601 1,666 Imports 590 889 837 Exports 6,399 6,102 5,900 Exports 236 295 260 Consumption 87,997 89,176 90,764 Consumption 4,407 4,496 4,583
Sawn hardwood Medium density fiberboard (MDF)
2011 2012 2013 2011 2012 2013 Production 16,284 16,333 16,490 Production 2,585 2,662 2,701 Imports 708 760 812 Imports 1,639 1,701 1,750 Exports 4,720 3,800 3,906 Exports 542 550 580 Consumption 12,272 13,293 13,396 Consumption 3,682 3,813 3,871
Hardwood logs Insulation board
2011 2012 2013 2011 2012 2013 Production 36,597 36,716 37,004 Production 2,755 2,755 2,755 Imports 122 143 167 Imports 150 177 177 Exports 2,209 1,906 2,001 Exports 129 140 140 Consumption 34,510 34,953 35,170 Consumption 2,776 2,792 2,792
Coniferous plywood Roundwood pulpwood
2011 2012 2013 2011 2012 2013 Production 8,081 8,090 81,006 Production 127,448 127,361 127,520 Imports 389 388 391 Imports 533 548 566 Exports 704 760 801 Exports 446 463 475 Consumption 7,766 7,718 80,596 Consumption 127,535 127,446 127,611
Nonconiferous plywood Hardboard
2011 2012 2013 2011 2012 2013 Production 1,243 1,266 1,301 Production 743 790 850 Imports 2,303 1,977 1,977 Imports 206 235 275 Exports 185 192 192 Exports 235 240 282 Consumption 3,361 3,051 3,086 Consumption 714 785 843 aAll volumes are reported in 1,000 cubic meters. Figures for 2012 are Forest Service linear extrapolated estimates, 2013 are Forest Service linear extrapolated forecasts when industry forecasts are unavailable. rRevised.

U.S. Forest Products Annual Market Review and Prospects, 2009–2013
5
was then balanced over all end uses, and market shares de-veloped. These estimates provide a consistent, reliable look at solid wood products markets in the United States (McKeever and Howard 2011).
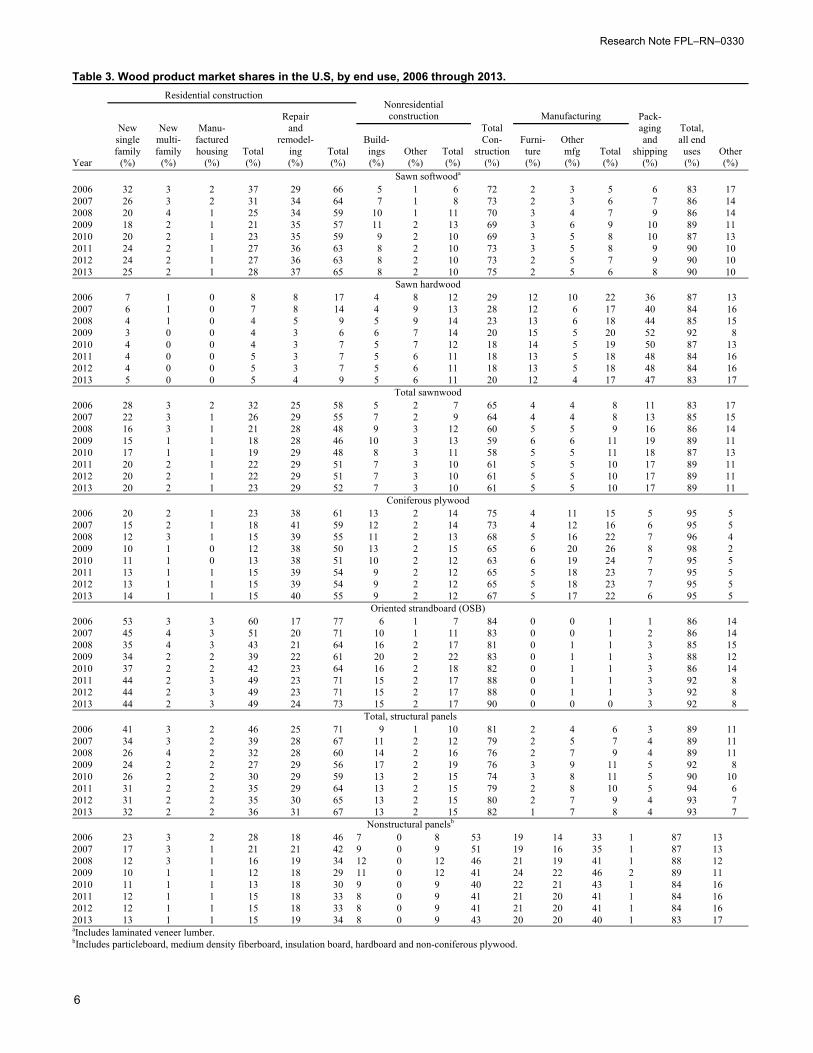
Table 3 presents annual balanced wood products consump-tion by end use for sawn wood, structural panels, and non-structural panels for the period 2006 through 2011, with pre-liminary estimates for 2012 and forecasts for 2013. Figure 1 shows market shares for all solid wood products combined for the same time period.
Sawn SoftwoodThe housing sector is improving as evidenced by its over-all increasing market share and will have a positive effect on softwood lumber consumption (Fig. 1, Table 3). U.S. housing construction industry grew over the first half of 2012. According to the Western Wood Products Association (WWPA), during the first 7 months of 2012, softwood lum-ber consumption increased 7.7% from the same period last year, and shipments of softwood lumber from western mills also increased 9.5% during the first 7 months of 2012 compared with the same period in 2011 (WWPA 2012). Production increased during this period in the South 5.1%. Apparent consumption for the first 7 months of 2012 was 21 million cubic meters, 7.7% above the 19 million cubic meters for the first 7 months of 2011.
Timber production as a result of a strengthening domestic market continued to increase in 2012 slightly above the 2011 timber growth level. Softwood production through the first 7 months of 2012 was 28.3 million cubic meters, which was up 6.9% when compared with the first 7 months of 2011 when 26.5 million cubic meters of sawn softwood were produced. Production of sawn softwood for 2012 is forecast to exceed 2011 levels, and then continue to rebound with a gradual increase in 2013.
Sawn softwood imports decreased 7.0% during the first 7 months of 2012 relative to the same time period a year ago. The volume of Canadian imports, which constituted 90% of all sawn softwood imports, increased by 9.0% over this period. Total sawn softwood imports were 21.9 million cubic meters in 2011.
During the first 7 months of 2012, U.S. sawn softwood ex-ports decreased 6.3% compared with exports for the same period in 2011. Exports to Canada decreased by 6.4%, while exports to China decreased 40.6% and exports to Mexico increased 24.6%.
Sawn HardwoodSawn hardwood production is expected to increase to 16.9 million cubic meters in 2012. Imports in 2012 are ex-pected to increase from one year earlier. Given the increase in U.S. production and imports as well as a strengthening housing market, apparent consumption for 2012 is forecast to exceed the 2011 volume.
Softwood Log TradeSoftwood log exports to China declined over the first 7 months of 2012 when compared with exports in the same period of 2011 falling by 35.9%. Softwood log exports to Canada increased by 2.1% in the same period. Softwood log exports to all other countries decreased by 12.3% during the first 7 months of 2012 when compared with the same time period of one year ago. Fueling the decline in softwood log exports especially during the third quarter of 2012 is the decline of exports to China as China’s economy enters a period of contraction. Most of the decline has been cen-tered in the Pacific Northwest. Overall, the volume of U.S. logs shipped to China fell to an estimated 2.4 million cubic meters in 2011, or about 7% of the region’s total log produc-tion. Softwood log imports increased by 68.6% over the first 7 months of 2012 compared with a year earlier. During 2012, the timber harvest surpassed the 2011 harvest and the forecast calls for a further rise in harvest in 2013.
Hardwood Log TradeHardwood log exports decreased by 15.1% and imports fell by 8.7% during 2011 compared with 2010. Canada tradi-tionally provides about 95% of U.S. imports. The trend in hardwood log exports was up, unchanged from a year ago through the first 7 months of 2012. Hardwood log imports were down slightly through the first 7 months of 2012 when compared with 2011.
PulpwoodRoundwood production for pulp and wood-based panel mills was 127 million cubic meters in 2011, up slightly from 2010. Roundwood pulpwood consumption is expected to decrease during 2012 as indicated by a 1.6% decline in paper and paperboard production over the first 7 months of 2012. Pulpwood supplied from residues continued to de-crease relative to roundwood. This is a result of declining wood residual production and competition for residuals for pellets and biomass for energy and not out of preference on the part of pulp producers. The residue portion of pulpwood
5
15
25
35
45
2006 2007 2008 2009 2010 2011 2012 2013
Con
sum
ptio
n (%
)
New housingResidential repair & remodelingNonresidential constructionManufacturing, packaging & shippingOther
Figure 1. Solidwood timber products consumption market shares, 2006–2013.
Research Note FPL–RN–0330
6
Table 3. Wood product market shares in the U.S, by end use, 2006 through 2013.
Year
Residential construction Nonresidentialconstruction
TotalCon-
struction(%)
Manufacturing Pack- agingand
shipping(%)
Total, all end uses(%)
Other (%)
Repairand
remodel- ing(%)
Total(%)
New single family
(%)
New multi- family
(%)
Manu- factured housing
(%) Total(%)
Build-ings (%)
Other (%)
Total(%)
Furni-ture(%)
Other mfg (%)
Total(%)
Sawn softwooda
2006 32 3 2 37 29 66 5 1 6 72 2 3 5 6 83 17 2007 26 3 2 31 34 64 7 1 8 73 2 3 6 7 86 14 2008 20 4 1 25 34 59 10 1 11 70 3 4 7 9 86 14 2009 18 2 1 21 35 57 11 2 13 69 3 6 9 10 89 11 2010 20 2 1 23 35 59 9 2 10 69 3 5 8 10 87 13 2011 24 2 1 27 36 63 8 2 10 73 3 5 8 9 90 10 2012 24 2 1 27 36 63 8 2 10 73 2 5 7 9 90 10 2013 25 2 1 28 37 65 8 2 10 75 2 5 6 8 90 10
Sawn hardwood 2006 7 1 0 8 8 17 4 8 12 29 12 10 22 36 87 13 2007 6 1 0 7 8 14 4 9 13 28 12 6 17 40 84 16 2008 4 1 0 4 5 9 5 9 14 23 13 6 18 44 85 15 2009 3 0 0 4 3 6 6 7 14 20 15 5 20 52 92 8 2010 4 0 0 4 3 7 5 7 12 18 14 5 19 50 87 13 2011 4 0 0 5 3 7 5 6 11 18 13 5 18 48 84 16 2012 4 0 0 5 3 7 5 6 11 18 13 5 18 48 84 16 2013 5 0 0 5 4 9 5 6 11 20 12 4 17 47 83 17
Total sawnwood 2006 28 3 2 32 25 58 5 2 7 65 4 4 8 11 83 17 2007 22 3 1 26 29 55 7 2 9 64 4 4 8 13 85 15 2008 16 3 1 21 28 48 9 3 12 60 5 5 9 16 86 14 2009 15 1 1 18 28 46 10 3 13 59 6 6 11 19 89 11 2010 17 1 1 19 29 48 8 3 11 58 5 5 11 18 87 13 2011 20 2 1 22 29 51 7 3 10 61 5 5 10 17 89 11 2012 20 2 1 22 29 51 7 3 10 61 5 5 10 17 89 11 2013 20 2 1 23 29 52 7 3 10 61 5 5 10 17 89 11
Coniferous plywood 2006 20 2 1 23 38 61 13 2 14 75 4 11 15 5 95 5 2007 15 2 1 18 41 59 12 2 14 73 4 12 16 6 95 5 2008 12 3 1 15 39 55 11 2 13 68 5 16 22 7 96 4 2009 10 1 0 12 38 50 13 2 15 65 6 20 26 8 98 2 2010 11 1 0 13 38 51 10 2 12 63 6 19 24 7 95 5 2011 13 1 1 15 39 54 9 2 12 65 5 18 23 7 95 5 2012 13 1 1 15 39 54 9 2 12 65 5 18 23 7 95 5 2013 14 1 1 15 40 55 9 2 12 67 5 17 22 6 95 5
Oriented strandboard (OSB) 2006 53 3 3 60 17 77 6 1 7 84 0 0 1 1 86 14 2007 45 4 3 51 20 71 10 1 11 83 0 0 1 2 86 14 2008 35 4 3 43 21 64 16 2 17 81 0 1 1 3 85 15 2009 34 2 2 39 22 61 20 2 22 83 0 1 1 3 88 12 2010 37 2 2 42 23 64 16 2 18 82 0 1 1 3 86 14 2011 44 2 3 49 23 71 15 2 17 88 0 1 1 3 92 8 2012 44 2 3 49 23 71 15 2 17 88 0 1 1 3 92 8 2013 44 2 3 49 24 73 15 2 17 90 0 0 0 3 92 8
Total, structural panels 2006 41 3 2 46 25 71 9 1 10 81 2 4 6 3 89 11 2007 34 3 2 39 28 67 11 2 12 79 2 5 7 4 89 11 2008 26 4 2 32 28 60 14 2 16 76 2 7 9 4 89 11 2009 24 2 2 27 29 56 17 2 19 76 3 9 11 5 92 8 2010 26 2 2 30 29 59 13 2 15 74 3 8 11 5 90 10 2011 31 2 2 35 29 64 13 2 15 79 2 8 10 5 94 6 2012 31 2 2 35 30 65 13 2 15 80 2 7 9 4 93 7 2013 32 2 2 36 31 67 13 2 15 82 1 7 8 4 93 7
Nonstructural panelsb
2006 23 3 2 28 18 46 7 0 8 53 19 14 33 1 87 13 2007 17 3 1 21 21 42 9 0 9 51 19 16 35 1 87 13 2008 12 3 1 16 19 34 12 0 12 46 21 19 41 1 88 12 2009 10 1 1 12 18 29 11 0 12 41 24 22 46 2 89 11 2010 11 1 1 13 18 30 9 0 9 40 22 21 43 1 84 16 2011 12 1 1 15 18 33 8 0 9 41 21 20 41 1 84 16 2012 12 1 1 15 18 33 8 0 9 41 21 20 41 1 84 16 2013 13 1 1 15 19 34 8 0 9 43 20 20 40 1 83 17 aIncludes laminated veneer lumber. bIncludes particleboard, medium density fiberboard, insulation board, hardboard and non-coniferous plywood.

U.S. Forest Products Annual Market Review and Prospects, 2009–2013
7
was 59.4 million cubic meters in 2011, a 2% decrease from 2010 (Howard and Westby 2013).
Trade patterns have continued to have a significant impact on paper and paperboard production and have affected pulpwood use, but the significant decline in U.S. paper and board production and consumption that occurred over the past decade was largely due to a downturn in consumer spending associated with the United States and global reces-sion. Exports of paper, paperboard, and converted products increased by 1.0% to 13.9 million metric tons, while imports of paper and paperboard decreased by 3.5% to 9.3 million metric tons in 2011. Paper and paperboard production de-creased by 2.0% in 2011, falling to 74.4 million metric tons. The production of paper and paperboard in 2012 is forecast to be 2.0% below 2011 production as reflected in the an-nual year to date rate for September 2011 of 40.1 million metric tons, which is down 1.6% from 2011 when paper and paperboard was produced at a level of 40.9 million metric tons. Paper and paperboard imports were at an annual rate in September of 9.0 million metric tons, which is down 3.5% from last year.
Structural PanelsStructural panel production in 2011 was 2.1% below that of 2010, while consumption was 1.3% below consumption in 2010 (APA 2012). Structural panel production at the end of the third quarter of 2012 was 13.4 million cubic meters, which is below the first three quarters of 2011. Overall, structural panel production is expected to decrease to 19.0 million cubic meters in 2012 (Adair 2012). Structural panel market shares were negatively affected by the current economic downturn. New residential construction, which in 2006 captured 46% of all structural panel consumption, fell to 35% in 2011, and is expected to fall further in 2012 (Table 3).
In 2011, 8.9 million cubic meters of oriented strandboard (OSB) were produced (Table 2). OSB consumption totaled 11.2 million cubic meters in 2011 and constituted 60% of the structural panel market (Table 3). This represented a 4% share decrease from 2008. Consumption is expected to further decline in 2012. At the end of the third quarter 2012, OSB consumption was 15.1 million cubic meters, 7.6% above the first three quarters of 2012. The weak economic recovery but growing residential construction is expected to keep OSB consumption in 2012 near 19 million cubic meters.
Softwood plywood production was 7.9 million cubic meters in 2011 (Table 2) (APA 2012). This level of production was 3.1% below 2010. Softwood plywood production at the end of the third quarter in 2012 was 6.1 million cubic meters relatively unchanged when compared to the numbers at the end of the third quarter in 2011. The volume of softwood plywood production fell throughout the 1990s, and the de-cline has continued into 2011. Softwood plywood imports
increased in 2011 by 4.3% compared with 2010 data, while softwood plywood third quarter exports increased in 2012 by 29%. Plywood exports to Canada decreased by 9% dur-ing the first 9 months in 2012 compared with a year earlier, and plywood imports from Canada decreased 19%. Soft-wood plywood consumption was 5.8 million cubic meters at the end of the third quarter 2012, which was slightly below last year. Apparent consumption of softwood plywood is expected to decrease in 2012 and 2013.
Hardwood PlywoodHardwood plywood production, including core material such as softwood plywood and OSB, was estimated at 1.3 million cubic meters in 2011, down from 2010 produc-tion. Hardwood plywood imports increased 22% in 2010 climbing to 2.3 million cubic meters when compared with 2009. Hardwood plywood exports rose in 2010, increasing 43.2% to 185,000 cubic meters. Production and consump-tion of hardwood plywood in 2010 and 2011 is forecasted to steadily fall to 2008 levels (Table 2). These declines are a result of falling total industrial production and furniture and related products indexes (Table 1), coupled with the U.S. housing market collapse.
Particleboard and Medium Density FiberboardInformation from the Composite Panel Association (CPA 2012) indicates that particleboard and medium density fiber-board (MDF) production increased during 2011. Particle-board production was 4.4 million cubic meters, an increase of 2.2%, and MDF production was 3.9 million cubic meters, an increase of 2.3%. (Table 2) During 2011, particleboard and MDF imports combined was relatively unchanged on a volume basis, compared with 2009. Particleboard and MDF exports were also relatively unchanged. Consumption was forecast to increase slightly in 2011 and then increase slight-ly in 2012. Particleboard and MDF account for well over one-half of all nonstructural panels consumed in the United States. Although they aren’t a large component in residential construction, their market share fell by nearly half between 2006 and 2010 (Table 3).
HardboardBased on data from the Composite Panel Association (CPA 2012), 802,000 cubic meters of hardboard were produced in 2011; this level of production is expected to decline slightly in 2012. Hardboard imports and exports are expected to re-main flat over the next two years.
Insulation BoardInformation from the American Forest and Paper Associa-tion (AF&PA 2012) showed that 2.7 million cubic meters of insulation board was produced in 2012, unchanged from 2011. Production of insulation board has been flat for sev-eral years, resulting in a stable level of apparent annual consumption of about 3.0 million cubic meters.

Research Note FPL–RN–0330
8
FuelwoodUsing data from a 2011 Department of Energy survey (EIA 2013) and adjusting for the 2011 winter weather and an increasing trend in fuelwood use per household, fuel-wood consumption was estimated to be 39.6 million cubic meters in 2011—a decrease of 3.4% from 2010. Households use most fuelwood for heating and aesthetic enjoyment. Industry uses mill residues rather than roundwood for fuel. A small portion of roundwood fuelwood is used for electric power production. Use for electric power is limited by the low cost of coal and natural gas alternatives. Fuelwood consumption for 2011 was below the level for 2010 and the forecast calls for decreased fuelwood consumption through 2012. Renewable Fuel Standards and other biomass-related energy policies are unlikely to increase the growth rate for fuelwood production and consumption, but likely to increase other forms of wood energy use such as pellets.
Forest Products PricesTrends in the wholesale price of forest products are avail-able for two broad categories: lumber and wood products (such as lumber and wood-based panels) and pulp and paper products (Fig. 2). Throughout the late 1990s, the producer price of lumber and wood products as reflected by the producer price index (PPI) continued to fluctuate around a level reached by the mid-1990s before peaking during the second half of 1999 (DOL 2012). The PPI for lumber and wood products continued to decrease during the first quarter of 2008, but rose and peaked in the third quarter, and then declined again in the fourth quarter. The PPI for lumber was down 7.3 points in 2009 from 2008. Changes in the price of softwood lumber and a depressed lumber market accounted for much of this change and most of the volatility in the in-dex. In 1999, the deflated composite price index reached an all-time high (at a level more than 50% higher than that of the base year, 1982), followed immediately by a sustained decline that continued throughout 2000 and into 2011. The PPI reached its lowest level in 5 years during this period.
The PPI for both lumber and pulp paper and allied products has been increasing throughout 2012. Because of these sustained low prices, U.S. demand for lumber and wood products during 2000 and into 2005 remained near record levels. But the current strengthening in the housing market has caused an uptick in the price levels during this current resurgence fueled also by the increase in demand for wood products as a result of rebuilding made necessary by dam-age incurred from tropical storm Sandy in Octoer 2012. In contrast, the PPI of prices in the pulp and paper sector has exhibited considerably less short-term volatility. In deflated terms, the composite index began 2008 with a flat to declin-ing trend, before undergoing an upturn in the third quarter of 2008 that became flat in the first quarter of 2009 before fluc-tuating throughout 2011 and into the fourth quarter of 2012.
Energy Policy InitiativesWood EnergyThe wood energy market in the United States is composed of four major sectors: industrial (68%), residential (20%), electricity (9%), and commercial (3%). The industrial sec-tor includes primarily wood products mills and pulp and paper mills. The amount of wood energy it consumes is de-termined mainly by wood product output rather than public policies. The other three sectors have been influenced some-what more by public policy at the state and federal level. Historically, public policy focused on promoting the use of biomass for electricity and in recent years, there has been greater support for use of biomass to make liquid fuels for transport.
The most effective federal incentives introduced since 2004 according to recent publications appear to be (a) the Renew-able Energy Production Tax Credits, (b) Clean Renewable Energy Bonds, (c) Qualified Energy Conservation Bonds, (d) Investment Tax Credits (Aguilar and others 2011). All of these incentives are tailored to the electricity generation sector. Recent publications also suggest that the eligibility of open-loop biomass plants (i.e., not relying on bio-energy dedicated crops, but instead on material harvested from working forest and industry co-products) for Renewable En-ergy production Tax Credits have favored the greater use of woody materials, especially in the electricity sector.
Biomass Crop Assistance Program (BCAP) implementa-tion guidelines (section 9.4.1.2) have been recently updated. BCAP, a policy established to help meet U.S. Federal Re-newable Fuel Standards, mandates increased national bio-fuel use to reach 36 billion gallons a year by 2022, with 21 billion gallons per year from advanced biofuels (U.S. Public Law 110-140).
Wood pellet manufacturing is the most dynamic wood ener-gy sector in the United States with increases in capacity and production of industrial pellets for export in the European Union (EU). U.S. export capacity has increased from less
40
60
80
100
120
140
160
1997199819992000200120022003200420052006200720082009201020112012
Defla
ted
pric
e in
dex
Deflated lumber & wood productsDeflated pulp, paper, and allied products
Figure 2. Wholesale prices of forest products, 1997–2012.

U.S. Forest Products Annual Market Review and Prospects, 2009–2013
9
than 100,000 metric tons in 2008 to almost 2 million tonnes in 2011. Pellet production for the local market and use for U.S. residential heating is stalled and perhaps declining, with current production capacity estimated at about 5 mil-lion tonnes (Forisk Consulting 2012).
Biomass EnergyThe downturn in the world economy has had a significant impact on wood and energy demand, but the near-term fu-ture of U.S. wood and energy markets is tied to the United States domestic uncertain pace of recovery from the down-turn. Wood energy demand will also be influenced by grow-ing concern about greenhouse gas (GHG) emissions and changes in investment in renewable fuels, and by increasing production of unconventional natural gas. Investments in wood energy will be influenced by recovery of the world’s financial markets because the capital-intensive nature of most large projects.
Although the electricity sector has been a major beneficiary of federal public policy support, it has recently been facing increased scrutiny because of greenhouse gas (GHG) emis-sions. Whether power generation using woody feedstock is considered a GHG carbon-neutral option is undergoing de-bate. On January 12, 2011, the U.S. Environmental Protec-tion Agency (EPA) announced its plan to defer for 3 years the requirement for GHG permits for CO2 emissions from biomass-fired and other biogenic sources (EPA 2011b).
EPA has been developing guidelines to restrict emissions from certain stationary sources, such as electric power plants. EPA has suggested the possibility that emissions from biomass might be treated on the same terms as emis-sions from fossil fuels. At the same time, it recognized the uncertainty about the carbon offset benefits of wood and other biomass sources (EPA 2010). Biogenic CO2 emis-sions being reviewed include diverse sources such as those derived from combustion of biological material, including all types of wood and wood co-products, forest residues, and agricultural material (EPA 2011a).
The Pellet Fuels Institute has been created as a North American trade association to promote energy independence through the efficient use of densified biomass fuel.
Summary of Timber Products and Energy PolicyThe past year has been a volatile one for United States wood and energy markets, with oil prices rising throughout 2012 and wood markets gaining strength. Economic activ-ity in the United States was sluggish in 2011 but is showing strength during the first three quarters of 2012, as evidenced by the increase in real GDP growth to an expected 2.7% in the third quarter 2012, signaling renewed strength in major sectors of the economy. With weak GDP growth during the second half of 2011, resulting partly from the weakness in the housing sector as reflected in the decline in building
permits, increasing unemployment, and anxieties about the financial system, there was little reason to expect better economic conditions over the following few months. Also, with more home refinancing instead of new home purchases and weak GDP growth, which is an indicator of employment growth, the recovery of the U.S. economy seemed months away. But current inflationary pressures are low and unem-ployment fell, leading to higher expectations for the U.S. economy. The future strength for other domestic and foreign trade sectors of the wood products industry also depends on the general economy, future lumber prices (which are stron-ger in 2012), the improving housing sector, and the strength-ening value of the dollar. Although U.S. timber exports to China are in decline in 2012, they are being made up by surging exports to Mexico. As a result of increased tariffs on wood exports in 2007 from Russia, Chinese buyers have turned to Canada for wood amid the country’s construction decline. If the surge in exports to Mexico is sustained and if the housing market continues to rebound throughout 2012, 2013 could be a good year for the U.S. wood industry.
The United States furniture industry, in retreat since 1999, continued declining in 2011 as low-cost furniture imports and the global economic recession continue to erode the do-mestic industry market share. Employment in the domestic furniture industry has fallen more than 50% since 1999 (Fig. 3). The projections for 2012 show the furniture indus-try in continued decline but at a slower rate.
ReferencesAdair, Craig. 2012. Structural panel and engineered wood yearbook. APA Economics Report E175. Tacoma, WA: APA – The Engineered Wood Association. 80 p.
AF&PA. 2012. Paper, paperboard, and wood pulp—monthly statistical summary. Washington, D.C.: American Forest and Paper Association.
Aguilar, F.X., Song, N., Shiftley, S. 2011. Consumption trends and public policies promoting woody biomass as an energy feedstock in the U.S. biomass and bioenergy. 35: 3708–3718.
020406080
100120140160
1978 1982 1986 1990 1994 1998 2002 2006 2010
Thou
sand
em
ploy
ees
Figure 3. Employment in wood household furniture industry, 1978–2012.

Research Note FPL–RN–0330
10
APA. 2012. Engineered Wood Statistics, Third Quarter 2011. Tacoma, WA: APA – The Engineered Wood Associa-tion. 9 p.
CPA. 2012. Particleboard and medium-density fiberboard annual production and shipments. [Annual]. Silver Spring, MD: Composite Panel Association.
EIA. 2013. Heating and cooling no longer majority of U.S. home energy use. Washington, D.C: U.S. Department of En-ergy, Energy Information Administration. www.eia.doe.gov/emeu/recs/contens.html. Accessed 6/20/3013.
EPA. 2010. Prevention of significant deterioration and Title V Greenhouse Gas Tailoring Rule. Washington, D.C.: Environmental Protection Agency. www.epa.gov/nsr/documents/20100413final.pdf. Accessed 11/06/2012.
EPA. 2011a. Fact sheet: Proposed rule – deferral for C02 emissions from bioenergy and other biogenic sources under the prevention of significant deterioration (PSD) and Title V programs. Washington, D.C.: Environmental Protection Agency. www.epa.gov/nsr/ghgdocs/biogenicfs.pdf. Ac-cessed 11/06/2012.
Forisk Consulting. 2012. Wood Bioenergy U.S. December 2012. Volume 4, Issue 7. www.forisk.com
FRB. 2012. Economic Research, Survey of Professional Forecasters, Third Quarter 2012. Philadelphia, PA: Federal Reserve Bank of Philadelphia. www.phil.frb.org/research-and-data/real-time-center/survey-of-professional-forecast-ers/ Accessed 11/06/2012.
Howard, James L.; Westby, Rebecca M. 2013. U.S. timber production, trade, consumption and price statistics 1965–2011. Research Paper FPL-RP-676. Madison, WI: U.S. Department of Agriculture, Forest Service, Forest Products Laboratory. 91 p.
McKeever, David B.; Howard, James L. 2011. Solid wood timber products consumption in major end uses in the United States, 1950–2009; a technical document supporting the Forest Service 2010 RPA Assessment. General Technical Report FPL-GTR-199. Madison, WI: U.S. Department of Agriculture, Forest Service, Forest Products Laboratory. 41 p.
NABH. 2012a. Housing economics. Washington, D.C.: National Association of Home Builders. www.nahb.org/showpage_details.aspx?showPageID=311§ionID=1163 Accessed 11/06/2012.
NABH. 2012b. Executive-level forecast. David Crowe. Washington, D.C.: National Association of Home Builders. Eye on the Economy. www.nahb.org/reference_list.aspx?sectionID=869&channelID=311 Accessed 11/06/2012.
WWPA. 2012. Lumber Track. [Monthly]. November 2011 Portland, OR: Western Wood Products Association.
Other Sources of InformationBoard of Governors of the Federal Reserve System. 2012. Statistical releases and historical data. Industrial production and capacity utilization - G.17. Washington, D.C. www.federalreserve.gov/releases/G17/Current/ table1.htm Accessed 11/06/2012.
Council of Economic Advisors. 2012. Economic Indicators. United States Government Printing Office [Monthly]. August 2011. Washington, D.C. [Source for Table 1]. www.gpoaccess.gov/indicators/09augbro.html. Accessed 11/06/2012.
DOL. 2012. Producer prices and price indexes. [Monthly and annual]. Washington, D.C.: U.S. Department of Labor, Bureau of Labor Statistics. www.bls.gov/ppi. Accessed 11/06/2012.
EPA. 2011b. Guidance for determining best available con-trol technology for reducing carbon dioxide emissions from bioenergy production. Washington, D.C.: Environmental Protection Agency. Office of Air and Radiation. March 2011. www.epa.gov/nsr/ghgdocs/bioenergyguidance.pdf. Accessed 11/06/2012.
United Nations Economics Commission Europe and the Food Agriculture Organization. Forests products annual market review, 2010-2011. pp. 90-94.
