u.s. fish and wildlife service - association of … wetlands_llww... · u.s. fish and wildlife...
TRANSCRIPT

U.S.FISHANDWILDLIFESERVICE
RhodeIslandWetlands:UpdatedInventory,Characterization,and
Landscape‐levelFunctionalAssessment
May 2014

Cover: Diamond Bog, Richmond. (Michael Narcisi Photo)
Rhode Island Wetlands: Updated Inventory, Characterization, and
Landscape-level Functional Assessment
Ralph W. Tiner1, Kevin McGuckin2, and Jason Herman2
1U.S. Fish and Wildlife Service National Wetlands Inventory Program
Northeast Region 300 Westgate Center Drive
Hadley, MA 01035
2Conservation Management Institute Virginia Tech University
1900 Kraft Drive Blacksburg, VA 24061
May 2014

This report should be cited as: Tiner, R.W., K. McGuckin, and J. Herman. 2014. Rhode Island Wetlands: Updated Inventory, Characterization, and Landscape-level Functional Assessment. U.S. Fish and Wildlife Service, Northeast Region, Hadley, MA. 63 pp. Note: The findings and conclusions in the report are those of the authors and do not necessarily represent the views of the U.S. Fish and Wildlife Service.
TABLE OF CONTENTS Page Introduction 1 Study Area 2 Methods 4 Updating NWI Data 4
Creating the NWI+ Database 4 Expanded Wetland Classification 5 Data Analysis and Summaries 9 Geospatial Data and Online Map Production 9 Limitations of the Updated Inventory and Landscape-level Functional Assessment 10 Results 17 Geospatial Data and Online Mapper 17 Wetlands Classified by NWI Types 18 Wetlands Classified by LLWW Types 22 Waters Classified by NWI Types 26 Estuarine and Fresh Waters Classified by LLWW Types 26 Tidally Restricted Waters and Wetlands 30 Preliminary Landscape-level Functional Assessment 30 Discussion 38 Comparison with Previous NWI Results 38 Functional Assessment 38 Acknowledgments 42 References 43 Appendices 45 A. Correlation table showing wetlands of significance for each of eleven functions 46 B. Introduction to the NWI+ Web Mapper and Its Contents 57
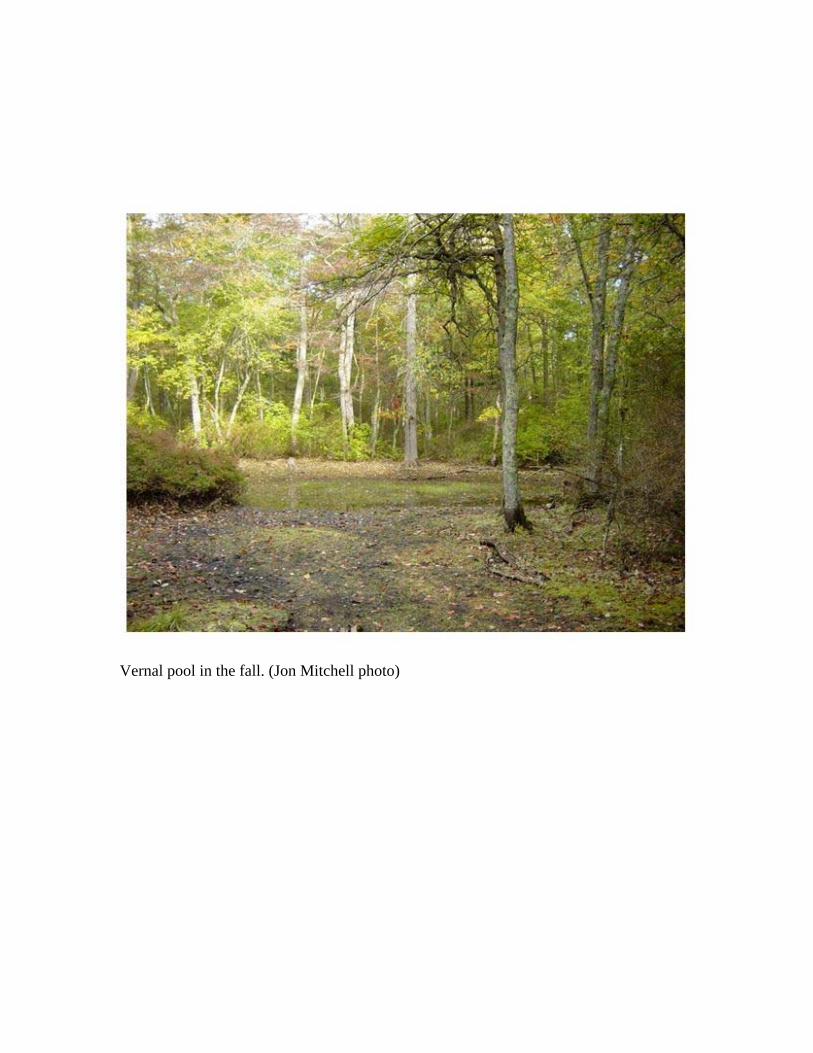
Vernal pool in the fall. (Jon Mitchell photo)
1
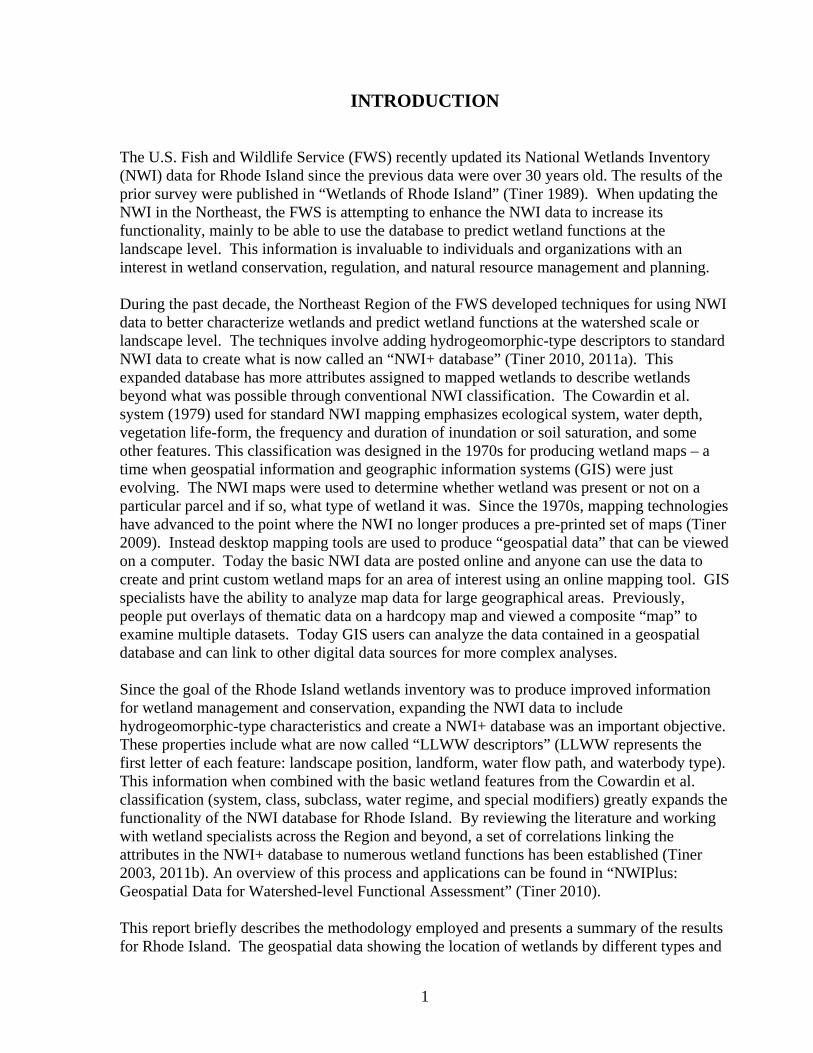
INTRODUCTION
The U.S. Fish and Wildlife Service (FWS) recently updated its National Wetlands Inventory (NWI) data for Rhode Island since the previous data were over 30 years old. The results of the prior survey were published in “Wetlands of Rhode Island” (Tiner 1989). When updating the NWI in the Northeast, the FWS is attempting to enhance the NWI data to increase its functionality, mainly to be able to use the database to predict wetland functions at the landscape level. This information is invaluable to individuals and organizations with an interest in wetland conservation, regulation, and natural resource management and planning. During the past decade, the Northeast Region of the FWS developed techniques for using NWI data to better characterize wetlands and predict wetland functions at the watershed scale or landscape level. The techniques involve adding hydrogeomorphic-type descriptors to standard NWI data to create what is now called an “NWI+ database” (Tiner 2010, 2011a). This expanded database has more attributes assigned to mapped wetlands to describe wetlands beyond what was possible through conventional NWI classification. The Cowardin et al. system (1979) used for standard NWI mapping emphasizes ecological system, water depth, vegetation life-form, the frequency and duration of inundation or soil saturation, and some other features. This classification was designed in the 1970s for producing wetland maps – a time when geospatial information and geographic information systems (GIS) were just evolving. The NWI maps were used to determine whether wetland was present or not on a particular parcel and if so, what type of wetland it was. Since the 1970s, mapping technologies have advanced to the point where the NWI no longer produces a pre-printed set of maps (Tiner 2009). Instead desktop mapping tools are used to produce “geospatial data” that can be viewed on a computer. Today the basic NWI data are posted online and anyone can use the data to create and print custom wetland maps for an area of interest using an online mapping tool. GIS specialists have the ability to analyze map data for large geographical areas. Previously, people put overlays of thematic data on a hardcopy map and viewed a composite “map” to examine multiple datasets. Today GIS users can analyze the data contained in a geospatial database and can link to other digital data sources for more complex analyses. Since the goal of the Rhode Island wetlands inventory was to produce improved information for wetland management and conservation, expanding the NWI data to include hydrogeomorphic-type characteristics and create a NWI+ database was an important objective. These properties include what are now called “LLWW descriptors” (LLWW represents the first letter of each feature: landscape position, landform, water flow path, and waterbody type). This information when combined with the basic wetland features from the Cowardin et al. classification (system, class, subclass, water regime, and special modifiers) greatly expands the functionality of the NWI database for Rhode Island. By reviewing the literature and working with wetland specialists across the Region and beyond, a set of correlations linking the attributes in the NWI+ database to numerous wetland functions has been established (Tiner 2003, 2011b). An overview of this process and applications can be found in “NWIPlus: Geospatial Data for Watershed-level Functional Assessment” (Tiner 2010). This report briefly describes the methodology employed and presents a summary of the results for Rhode Island. The geospatial data showing the location of wetlands by different types and
2
wetlands of functional significance can be viewed through an online mapper. Although waterbodies were also classified by this project, the emphasis of this report will be on wetlands with only some reference to waterbody classification and acreage. Study Area
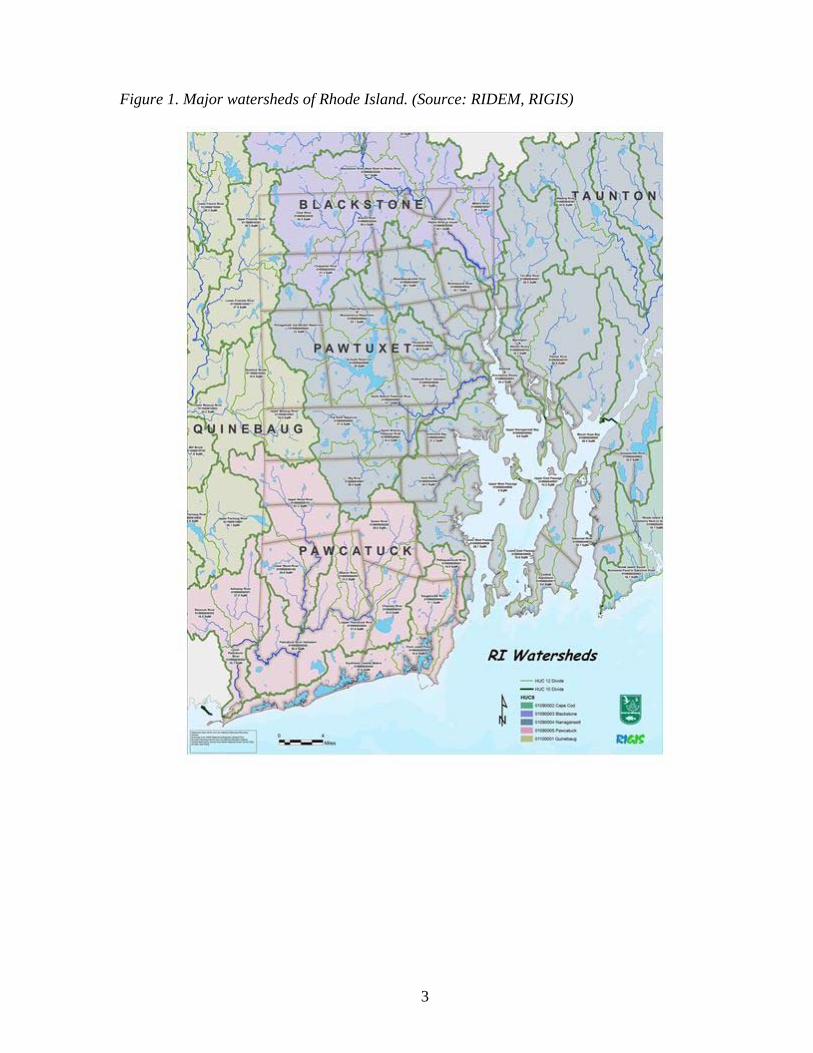
Rhode Island encompasses 1,544 square miles: 1,033 of land and 510 of water. Narragansett Bay is the state’s most prominent waterbody, occupying about 120 square miles (http://sos.ri.gov/library/history/facts/). Five counties comprise the state, with Providence County having the largest land mass and Washington County the most water area (Table 1). Five watersheds drain parts of the state: Blackstone, Pawtuxet, Taunton, Pawtucket, and Quinebaug (Figure 1).
Table 1. County area in square miles for Rhode Island. (Source: U.S. Census Bureau, 2013 U.S. Gazetteer Files)
Area Area (land/water) % of State
Bristol County 44 (24/20) 2.8 (2.3/3.9)
Kent County 189 (168/20) 12.2 (16.3/3.9)
Newport County 313 (102/211) 20.3 (9.9/41.4)
Providence County 436 (410/26) 28.2 (39.7/5.1)
Washington County 562 (329/233) 36.4 (31.8/45.7)
-----------------------------------------------------------------------------------
State Total 1,544 (1,033/510)
-----------------------------------------------------------------------------------
3
Figure 1. Major watersheds of Rhode Island. (Source: RIDEM, RIGIS)
4
METHODS
Updating NWI Data The pre-existing 2004 NWI data were updated via on-screen interpretation of 2010 digital imagery. Wetlands and deepwater habitats were typically classified by system, subsystem, class, subclass, water regime, and special modifiers according to Cowardin et al. (1979) following standard NWI mapping protocols. The “a” water chemistry modifier was applied in attempt to identify bogs, mainly those dominated by leatherleaf (Chamaedaphne calyculata) or black spruce (Picea mariana). Other modifiers applied to the data are listed in Table 2. The target mapping unit (i.e., the smallest unit consistently mapped) was 0.5 acre, recognizing that some wetlands larger than this size were not mapped for a few reasons (e.g., no distinctive wetland signature, too narrow to map, evergreen canopy cover, extreme dry periods, and image quality). Some wetlands smaller than the target size were mapped where conspicuous. These wetlands usually were observed with standing water (e.g., ponds). Collateral data used to assist in photointerpretation were digital raster graphics (DRGs; U.S. Geological Survey) and U.S.D.A. Natural Resources Conservation Service soil survey data (http://websoilsurvey.nrcs.usda.gov/app/HomePage.htm). Table 2. Special modifiers applied to emphasize certain wetlands. Modifier Code Highlighted Wetland Type and Term a acid Bog (acidic peatland) b beaver Beaver-influenced wetland d partly drained Ditched wetland f farmed Farmed wetland (PSSf = commercial cranberry bog) g organic soil Atlantic white cedar swamp h diked/impounded Impounded wetland (also applied to deepwater habitats) r artificial Artificial wetland (e.g., rock jetty or groin) s spoil Wetland built on dredged material x excavated Dug-out wetland (also applied to dredged deepwater habitats) Creating the NWI+ Database The updated Rhode Island wetlands inventory served as the foundation for this characterization and functional assessment. To be able to use the updated database for landscape-level functional assessment, additional properties of mapped wetlands were added to the basic inventory data, thereby creating a “NWI+ database.” These features included landscape position, landform, and water flow path following Tiner (2011a). Deepwater habitats and ponds were further classified by waterbody type and water flow path. Collectively these descriptors are called “LLWW descriptors” (using the first letter of each descriptor). To expand the wetland classification, the mapped wetlands were re-examined using digital geospatial data for streams (National Hydrography Data, NHD), topography (Digital Raster
5
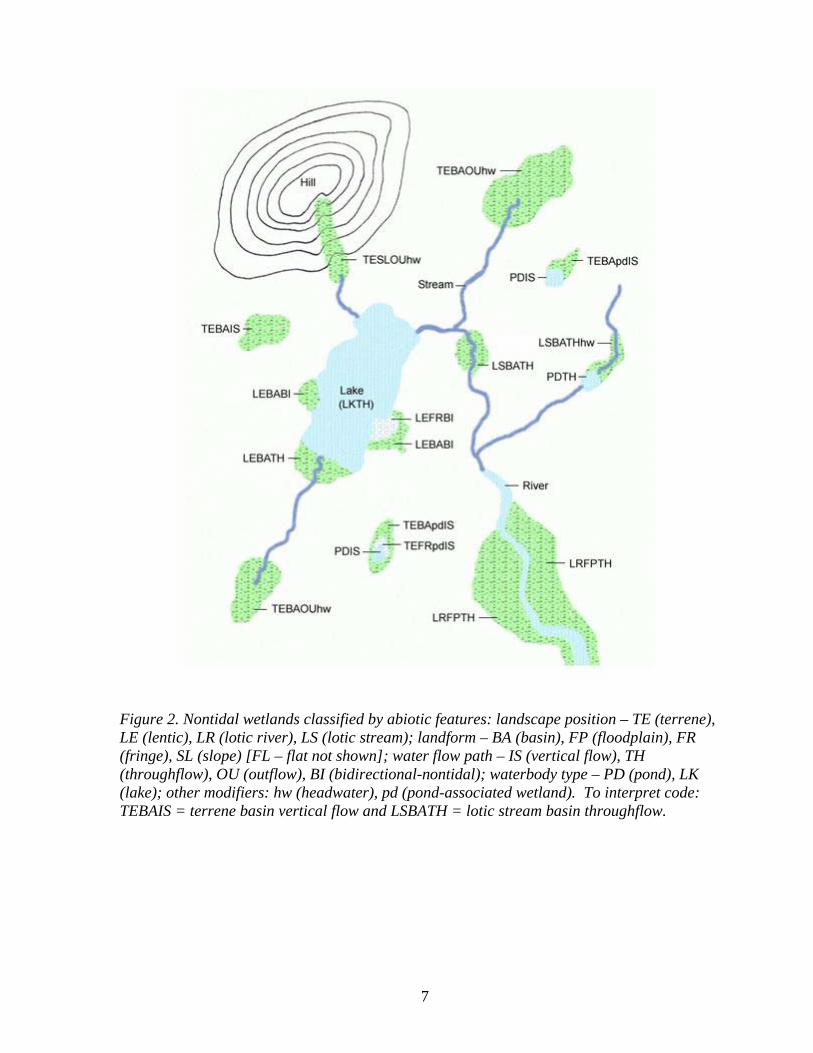
Graphics, DRGs), elevation (Digital Elevation Models, DEMs), and digital imagery from the summer of 2010. Adding hydrogeomorphic-type descriptors to existing wetland inventory data created an “NWI+ database” that could be further expanded to include other geospatial data such as wetlands of significance for a variety of functions and potential wetland restoration sites. Expanded Wetland Classification The LLWW classification contains four major elements to describe wetlands beyond the Cowardin et al. (1979) classification: 1) landscape position, 2) landform, 3) water flow path, and 4) waterbody type (Tiner 2011a). These hydrogeomorphic-type descriptors focus on abiotic properties that are vital to predicting wetland functions. Five landscape positions describe the location of a wetland relative to a waterbody if present: 1) marine (along the ocean), 2) estuarine (along tidal brackish waters), 3) lotic (along rivers and streams and subject to overflow), 4) lentic (in basins of lakes and reservoirs), and 5) terrene (sources of streams or “geographically isolated” – completely surrounded by upland, or not affected by the aforementioned waters). Landform describes the physical shape of the wetland. Several types are recognized: basin (depressional wetland), flat (wetland on a nearly level plain), floodplain (overflow land along rivers subject to periodic inundation), fringe (wetland in water, within the banks of a river, or on an estuarine intertidal plain), island (wetland completely surrounded by water), and slope (wetland on a hillside). Water flow path defines the direction of flow of water associated with the wetlands (Table 3). If the wetland is a source of a stream or a seep, it is an outflow wetland. River and streamside wetlands are throughflow wetlands with water running through them (both into and out of) during high water periods. Wetlands that only receive water from channelized flow without any outflow are considered inflow wetlands. Some wetlands have no channelized inflow or outflow – they have vertical flow: water moves up and down in response to precipitation, runoff, and groundwater influence). Wetlands along lakes and reservoirs have water levels that rise and fall with lake levels - bidirectional-nontidal; lakeshore wetlands associated with streams are classified as throughflow. Tidal wetlands experience bidirectional-tidal flow with ebb and flood tides. Figure 2 shows the classification of different types of nontidal wetlands across the landscape. The characteristics of all mapped wetlands and waterbodies were expanded by adding the above attributes plus waterbody type and some other descriptors (e.g., headwater, tidally restricted by road, coastal pond, partly drained, and severely human-impacted) (see Table 4 for outline of steps). This NWI+ database would be used to describe wetlands in more detail than provided by Cowardin et al. (1979) and to predict wetland functions for Rhode Island wetlands at the state level.
6
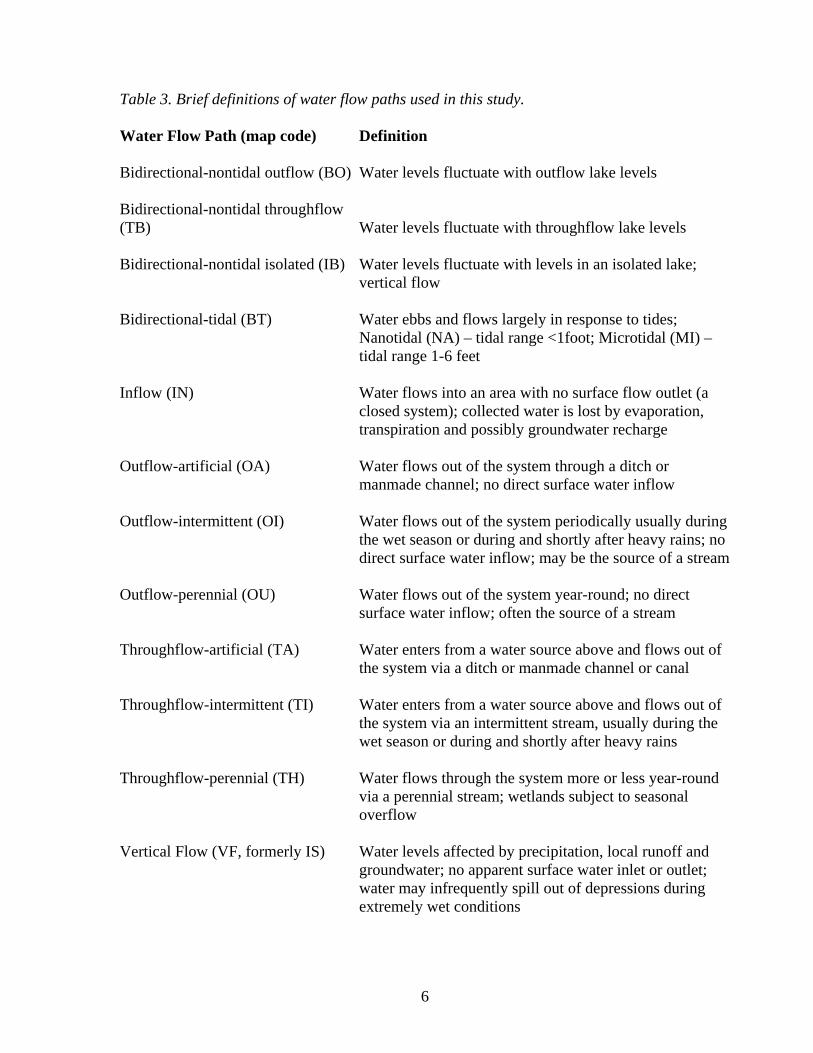
Table 3. Brief definitions of water flow paths used in this study. Water Flow Path (map code) Definition Bidirectional-nontidal outflow (BO) Water levels fluctuate with outflow lake levels Bidirectional-nontidal throughflow (TB) Water levels fluctuate with throughflow lake levels Bidirectional-nontidal isolated (IB) Water levels fluctuate with levels in an isolated lake;
vertical flow Bidirectional-tidal (BT) Water ebbs and flows largely in response to tides;
Nanotidal (NA) – tidal range <1foot; Microtidal (MI) – tidal range 1-6 feet
Inflow (IN) Water flows into an area with no surface flow outlet (a
closed system); collected water is lost by evaporation, transpiration and possibly groundwater recharge
Outflow-artificial (OA) Water flows out of the system through a ditch or manmade channel; no direct surface water inflow Outflow-intermittent (OI) Water flows out of the system periodically usually during the wet season or during and shortly after heavy rains; no direct surface water inflow; may be the source of a stream Outflow-perennial (OU) Water flows out of the system year-round; no direct surface water inflow; often the source of a stream Throughflow-artificial (TA) Water enters from a water source above and flows out of the system via a ditch or manmade channel or canal Throughflow-intermittent (TI) Water enters from a water source above and flows out of
the system via an intermittent stream, usually during the wet season or during and shortly after heavy rains
Throughflow-perennial (TH) Water flows through the system more or less year-round via a perennial stream; wetlands subject to seasonal overflow Vertical Flow (VF, formerly IS) Water levels affected by precipitation, local runoff and
groundwater; no apparent surface water inlet or outlet; water may infrequently spill out of depressions during extremely wet conditions
7
Figure 2. Nontidal wetlands classified by abiotic features: landscape position – TE (terrene), LE (lentic), LR (lotic river), LS (lotic stream); landform – BA (basin), FP (floodplain), FR (fringe), SL (slope) [FL – flat not shown]; water flow path – IS (vertical flow), TH (throughflow), OU (outflow), BI (bidirectional-nontidal); waterbody type – PD (pond), LK (lake); other modifiers: hw (headwater), pd (pond-associated wetland). To interpret code: TEBAIS = terrene basin vertical flow and LSBATH = lotic stream basin throughflow.
8
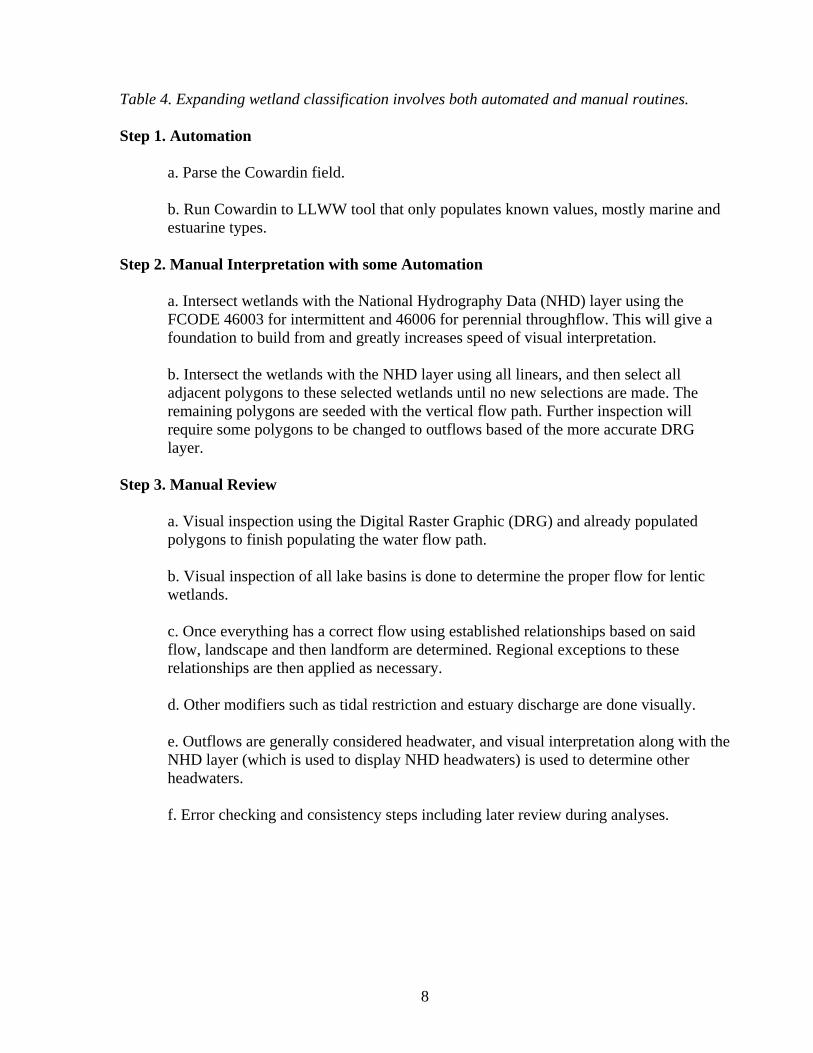
Table 4. Expanding wetland classification involves both automated and manual routines. Step 1. Automation a. Parse the Cowardin field. b. Run Cowardin to LLWW tool that only populates known values, mostly marine and estuarine types. Step 2. Manual Interpretation with some Automation a. Intersect wetlands with the National Hydrography Data (NHD) layer using the FCODE 46003 for intermittent and 46006 for perennial throughflow. This will give a foundation to build from and greatly increases speed of visual interpretation.
b. Intersect the wetlands with the NHD layer using all linears, and then select all adjacent polygons to these selected wetlands until no new selections are made. The remaining polygons are seeded with the vertical flow path. Further inspection will require some polygons to be changed to outflows based of the more accurate DRG layer.
Step 3. Manual Review a. Visual inspection using the Digital Raster Graphic (DRG) and already populated polygons to finish populating the water flow path. b. Visual inspection of all lake basins is done to determine the proper flow for lentic wetlands. c. Once everything has a correct flow using established relationships based on said flow, landscape and then landform are determined. Regional exceptions to these relationships are then applied as necessary. d. Other modifiers such as tidal restriction and estuary discharge are done visually. e. Outflows are generally considered headwater, and visual interpretation along with the NHD layer (which is used to display NHD headwaters) is used to determine other headwaters. f. Error checking and consistency steps including later review during analyses.
9
Data Analysis and Summaries The NWI+ database was used to generate acreage summaries of wetlands and deepwater habitats grouped by the Cowardin et al. types and LLWW types (landscape position, landform, water flow path, and waterbody type) and to predict wetland functions for the state. To do the latter, relationships between properties in the NWI+ database and a variety of wetland functions had to be established. From previous studies, a table listing each of 11 functions and the relevant wetland properties was used to identify wetlands with potential to perform each function at high or moderate levels (Appendix A). The 11 functions were: 1) surface water detention (for nontidal wetlands only), 2) streamflow maintenance, 3) coastal storm surge detention, 4) nutrient transformation, 5) sediment and other particulate retention, 6) carbon sequestration, 7) bank and shoreline stabilization, 8) provision of fish and aquatic invertebrate habitat, 9) provision of waterfowl and waterbird habitat, 10) provision of habitat for other wildlife, and 11) provision of habitat for unique, uncommon, or highly diverse wetland plant communities. The foundation for the functional assessment was an earlier report relating specific wetland types to functional performance (Tiner 2003, slightly revised based on more recent applications, e.g., Tiner 2011b). Geospatial Data and Online Map Production The NWI+ database was used to construct an online mapping tool using ESRI’s ArcGIS online mapping service (Appendix B). Data layers included classifications of wetlands by NWI types (Cowardin et al. 1979), landscape position, landform, water flow path, and by their predicted potential to provide each of 11 different functions mentioned above. The online mapper allows users to zoom into specific areas of interest and thereby see more detail than possible with hardcopy maps. Moreover, the tool permits the user to display the data on aerial imagery or topographic or planimetric maps and to produce custom maps for use in reports or for other purposes. The online mapper can be accessed through a website called “Wetlands One-Stop Mapping” (http://aswm.org/wetland-science/wetlands-one-stop-mapping). The geospatial data produced for this project allows for other geographic analyses (e.g., watersheds, counties, towns, and other areas of special interest) using GIS tools. Data will be available from Virginia Tech’s Conservation Management Institute.

10
LIMITATIONS OF THE UPDATED INVENTORY AND
LANDSCAPE-LEVEL FUNCTIONAL ASSESSMENT Source Data Limitations Since this project was a rapid update of the 2004 inventory using 2010 imagery, the focus of this update was on wetland changes and the general classification. The effort did not attempt to address all classification inconsistencies in the 2004 results. For example, the 2004 inventory did not apply the “d” (partly drained) modifier consistently in the estuarine system. Although many estuarine wetlands were identified as partly drained due to the presence of “mosquito ditches,” there are parts of others that could also be so designated. Given that inconsistency, the data therefore are not reported in this publication. Individuals interested in this feature must re-examine the NWI polygons to determine the full extent of ditching on Rhode Island’s tidal wetlands. Deepwater habitats did not receive any significant attention during the update so the classifications largely reflect the 2004 categorization. Also since it is now 2014, changes in some wetlands have occurred since the effective date of this update (2010) that are not reflected in the database. These changes may be due to: 1) permitted alterations by Federal, state, and local governments, and unauthorized activities, 2) natural process including erosion, accretion, and sea-level rise, and 3) differences in the interpretation based on the quality of the source imagery. The 2010 database should reasonably reflect contemporary conditions because wetlands in this state are subject to regulation at Federal, state, and local levels. Tidal flats posed a unique challenge for inventory. Since this project relied on existing imagery and low-tide imagery did not exist for the entire coast, tidal flats were conservatively mapped. Their locations were interpreted from the imagery and the original NWI data which also consulted the U.S.G.S. topographic maps. Their limits should therefore be considered approximate. It is important to recognize the limitations of any wetland mapping effort derived mainly through photointerpretation techniques (see Tiner 1990, 1999 for details). Wetland data derived from these techniques do not show all wetlands. Some wetlands are simply too small to map given the imagery used, while others avoid detection due to evergreen tree cover, dry surface conditions, or other factors. The minimum target mapping unit was a 0.5 acre wetland, but many wetlands (especially ponds) smaller than this were mapped. Mapped wetlands may contain small areas (inclusions) that are different from the mapped type due to scale and map complexity issues. For example, a 10-acre forested wetland may include a 0.5-acre stand of emergent wetland and a 0.5-acre upland island that may not be pulled out of the larger wetland forest unit. Drier-end wetlands such as seasonally saturated and temporarily flooded palustrine wetlands are often difficult to separate from nonwetlands through photointerpretation. Only those wetlands displaying a “wetland signature” were mapped, other “hydric soil” areas were not. The latter can be interpreted from USDA soils data by users. Finally, despite our best attempts at quality control, some errors of interpretation and classification are likely to occur due to the sheer number of polygons in the wetland database.
11
Source data were a primary limiting factor for this landscape-level functional assessment. All wetland and stream mapping have limitations due to scale, photo quality, survey date, and the difficulty of photointerpreting certain wetland types and narrow or intermittent streams especially those flowing through dense evergreen forests and beneath built-up lands. Also joining different geospatial data sources is challenging and often times inexact because they were interpreted from different imagery and aligned to different products (i.e., aerial imagery or topographic maps). The 2010 NWI data for Rhode Island and high-resolution NHD served as the foundation for identifying wetlands and streams and their linkages. In examining the NWI wetlands on other imagery via the NWI+ web mapper during draft product review, small wetlands were detected along lakes and streams, and in some geographically isolated locations that did not appear in the NWI coverage. A number of these wetlands were added to the original NWI database, but there are undoubtedly other small wetlands that were not. Readers should be able to locate other missing wetlands by using the NWI+ web mapper – view wetlands on aerial imagery (basemap) and zoom in to 1:5,000 or larger scale. Similarly, source data for streams was mainly NHD and DRGs which do not show all streams. Consequently, wetlands designated as “vertical flow” may actually be connected by a small stream. This would affect the predicted function of such wetlands. Use of Existing NWI Polygons for LLWW Classification Since the NWI data were the foundation for identifying the location and configuration of wetlands, the pre-existing polygons were the wetlands that were reclassified. Consequently, some of the polygons may actually include two different types that would affect their predicted functions. Each polygon was assigned LLWW descriptors; no polygon was further subdivided into additional polygons. The LLWW descriptors were assigned to the predominant type within the polygon. For example, if a large wetland polygon included a streamside wetland and a wetland on a gentle slope above the likely “floodplain,” the designation for its landscape position would be classified as lotic if the majority of the polygon was believed subject to overflow or as terrene if most of the wetland was above this elevation and more likely influenced by groundwater. This would also be reflected in the water flow path classification: throughflow for the former and outflow for the latter. It is recognized that lotic wetlands in headwater locations are also potentially influenced by groundwater, especially the large ones. Another situation that occurred in a few places (e.g., Worden, Watchaug and Chapman Ponds) was separating lentic wetlands from lotic wetlands where lakeside wetlands merged into riverside wetlands (floodplain). NWI polygons that had more area in one location than the other were classified accordingly. Cautions re: Classification of Some Types Because wetland classification drives a wetland’s designation as high, moderate, or not significant for a given function (see Appendix A), any misclassification would affect such designation. NWI water regimes were particularly important in this regard (e.g., flooded regimes versus seasonally saturated hydrology). The following are examples of situations

12
where the user may want to take a closer look at imagery and other sources when considering classification and functions of individual wetlands. Wetlands with Vertical Flow. Many wetlands have been designated as having vertical water flow based on the data examined (i.e., the wetland appears to be completely surrounded by upland and lacks surface water outflow via a stream channel). It is important to recognize that such wetlands may experience spillover during heavy rainfall or snowmelt periods or discharge water downslope via seepage. Other wetlands classified as vertical flow may be connected to other wetlands and waters by a small stream that was not observed on the imagery or at the scale viewed for this inventory.1 Where this is the case, the wetland is actually an outflow wetland and should be significant for streamflow maintenance with possible differences in other functions as well. Other vertical flow wetlands may be throughflow wetlands; these are often linear wetlands that are streamside wetlands. When interested in evaluating a specific “vertical flow” wetland for its functions, the user is encouraged to view the wetland on imagery (e.g., provided via the NWI+ Web Mapper) and zoom in to see if there is a small stream present.2 If a stream is observed, then reclassify the wetland and use the correlation table (Appendix A) to determine the appropriate levels of functions for this wetland. A final situation affecting the classification of vertical flow wetlands involves those found across a road at a relatively short distance from another wetland. Although no stream connection was observed on the imagery at our interpretation scale for such sites, there may be culverts beneath the road that link the two wetlands. Should a connection be found through a more in-depth examination of aerial imagery or onsite investigation, the user should modify the classification and functional assessment accordingly. Wetlands along Rivers and Streams. Wetlands may also be misclassified along major rivers where located above a distinct topographic break (visible on a USGS topographic map). Given that they were not likely to be overflowed by the watercourse, these wetlands were classified as terrene wetlands (e.g., outflow where a stream was present). Some of these wetlands may occur on the river’s active floodplain depending on the height of the topographic break relative to the river flood stage elevation, while others are located on terraces (e.g., the 20- to 100-year floodplain). If subject to overflow every other year at a minimum (the active floodplain), the wetland should be classified as lotic. If however, the wetland is higher up on the floodplain, it would be a terrene wetland (more dependent on groundwater and surface water from precipitation and local runoff than from river overflow). The terrene outflow wetland would have been designated as moderate for surface water detention, whereas if classified as a lotic river floodplain wetland, it would be rated as high for that function. A similar issue may arise along streams where wetlands were classified with a seasonally or temporarily flooded water regime. Streamside wetlands with these water regimes were routinely classified as lotic stream
1 During final review, this situation was observed when zoomed in; these were reclassified. As this was done through spot-checking, there are undoubtedly others that have small streams and are actually outflow types. It was beyond the scope of this preliminary characterization/assessment to re-examine every “vertical flow” wetland for the presence of a small stream, hence this user caution. 2 This imagery is different than that used for this survey and may therefore show a stream; also zooming in allows viewing at a larger scale than used for the inventory which also facilitates identification of small streams and other features. Since this is a preliminary classification we did not zoom in to evaluate every wetland designated as vertical flow due to time and budget constraints. Many such wetlands may, in fact, be outflow types upon closer examination.

13
wetlands. If, however, they are not subject to biennial overbank flooding because they are located on a terrace, they should be classified as terrene wetlands as such wetlands would be groundwater types and not overflow types. This classification difference would influence a number of functions. Classification of Ponds. Most ponds appeared to be created by either excavation or impoundment or a combination of both actions, while other ponds have formed naturally on the landscape. The landscape context of the pond and the shape of the pond provided clues for classification. It is possible, however, that some ponds with similar properties may have been classified differently by the interpreters. Functional Assessment Recognizing source data limitations, it is equally important to understand that this type of functional assessment is a preliminary one based on wetland characteristics interpreted through remote sensing and using the best professional judgment of various specialists to develop relationships between wetland characteristics in the database and wetland functions. This type of functional analysis is designed to produce landscape- or watershed-level assessments covering large geographic areas. The wetland classification employed, although expanded from the traditional NWI, does not account for all elements of variability in wetlands such as chemical variation in surface waters that are strongly influenced by underlying geology, especially in relatively undisturbed watersheds (Azzolina et al. 2007). Recognize, however, that the NWI classification (Cowardin et al. 1979) and the LLWW system (Tiner 2011a) have provisions for characterizing wetlands by water chemistry (pH and halinity/salinity) and for adding a descriptor to indicate significant groundwater influence. Wetlands are rated based on their biotic or abiotic characteristics as having high or moderate potential for supporting each of 11 wetland functions: surface water detention (nontidal wetlands), coastal storm surge detention (tidal wetlands and contiguous nontidal wetlands), streamflow maintenance (headwater wetlands), sediment and other particulate retention, nutrient transformation, carbon sequestration, bank and shoreline stabilization (wetlands along waterbodies), and provision of habitat for: a) fish and aquatic invertebrates, b) waterfowl and waterbirds, c) other wildlife, and d) unique, uncommon, and highly diverse wetland plant communities. Wetlands not assigned a rating are assumed to have little or no potential for providing such function at a significant level, with one exception for unique, uncommon, and highly diverse wetland plant communities which is by design a very conservative assessment. The ratings are based on a review of the literature and best professional judgment of numerous wetland scientists from public agencies, private non-government organizations, and academia. Also, no attempt is made to produce a more qualitative ranking for each function (e.g., comparison to a “reference” type representing a wetland of the type in the “best” condition, or considering the degree to which it actually performs a function given opportunity and adjacent land uses) or for each wetland based on multiple functions. To do that would require more input from others and more data, well beyond the scope of this type of broad-scale evaluation. For detailed reviews of wetland functions, see Mitsch and Gosselink (2007) and Tiner (2013) and for a broad overview, see Tiner (2005a).

14
Functional assessment of wetlands can involve many parameters. Typically such assessments have been done in the field on a case-by-case basis, considering observed features relative to those required to perform certain functions or by actual measurement of performance. The preliminary assessments based on remote-sensing information do not seek to replace the need for field evaluations since they represent the ultimate assessment of the functions for individual wetlands. Yet, for a watershed analysis, basin-wide field-derived assessments are not practical, cost-effective, or even possible given access considerations. For watershed planning, a more generalized assessment (level 1 assessment) is worthwhile for targeting wetlands that may provide certain functions, especially for those functions dependent on landscape position, landform, hydrologic processes, and vegetative life form (Brooks et al. 2004). Later these results can be field-verified when evaluating particular wetlands for acquisition purposes (e.g., for conserving biodiversity or preserving flood storage capacity) or project impact assessment. Current aerial photography may also be examined to aid in further evaluations (e.g., condition of wetland/stream buffers or adjacent land use) that can supplement the preliminary assessment. For this project a landscape-level functional assessment approach based on remotely sensed data and GIS analysis was used to identify wetlands likely to perform a suite of functions at high or moderate levels. This approach applies general knowledge about wetlands and their functions to predict the potential level of performance of mapped wetlands. To accomplish this objective, the relationships between wetlands and various functions are simplified into a set of practical criteria or observable characteristics based on the classification features in the expanded wetland database (i.e., NWI+ database). The approach does not account for the opportunity that a wetland has to provide a function resulting from a certain land-use practice upstream or the presence of certain structures or land-uses downstream. For example, two wetlands of equal size and similar vegetation may be in the appropriate landscape position to retain sediments. One, however, may be downstream of a land-clearing operation that has generated considerable suspended sediments in the water column, while the other is downstream from an undisturbed forest. The former should be actively trapping huge quantities of sediment, whereas the latter is not. Yet if land-clearing takes place in the latter area, the second wetland will likely trap additional sediments as well as the first wetland. The entire analysis typically tends to ignore opportunity since such opportunity may have occurred in the past or may occur in the future but the important point is that the wetland is there to perform this service at higher levels when necessary. It also does not address the condition of the adjacent upland (e.g., level of disturbance or stress) or the actual water quality of the associated waterbody both of which may be regarded as important metrics for assessing the health of individual wetlands. Collection and analysis of these data may be done as a follow-up investigation, where desired, for so-called “condition assessments.” It is important to re-emphasize that the preliminary assessment does not obviate the need for more detailed assessments of the various functions and assessment of wetland condition and opportunities to provide more benefits given the state of the contributing watershed and adjacent land use activities. This preliminary assessment should be viewed as a starting point for more rigorous assessments, because it attempts to identify wetlands that may likely provide significant functions based on generally accepted principles and the source information used
15
for this analysis. This assessment is most useful for regional or watershed planning purposes, for a cursory screening of sites for acquisition, and to aid in developing landscape-level wetland conservation and protection strategies. The approach can also be used to evaluate cumulative impacts of various alterations and changes in wetlands on key functions as was done for the Nanticoke River watershed on the Delmarva Peninsula (Tiner 2005b) or to consider the national and regional-scale impacts of policy changes on certain wetland types (e.g., “geographically isolated” wetlands or headwater wetlands, or determining significant nexus to waters of the United States). For site-specific evaluations, additional work will be required, especially field verification and collection of site-specific data for potential functions (e.g., following the hydrogeomorphic assessment approach as described by Brinson 1993 or other onsite evaluation procedures, such as rapid field assessment). This is particularly true for assessments of fish and wildlife habitats. Other sources of data may exist to help refine some of the findings of this report. For example, state natural heritage programs and others (e.g., Rhode Island Natural History Survey) may have produced geospatial data on “critical habitats” that is much more extensive than the conservative listing of wetlands identified as “Unique, Uncommon, or Highly Diverse Wetland Plant Communities” in this report. Additional modeling could be done, for example, to identify habitats of likely significance to individual species of animals based on their specific life history requirements (see U.S. Fish and Wildlife Service 2003 for Gulf of Maine habitat analysis). Also note that the criteria used for the relationships were based on current applications of the Service's wetland classification (Cowardin et al. 1979) and on professional judgment of many experienced wetland scientists in the eastern region. Through this analysis, numerous wetlands are predicted to perform a given function at a significant level. "Significance" is a relative term and is used in this analysis to identify wetlands that are likely to perform a given function at a high or moderate level. Wetlands not highlighted may perform the function at a low level or may not perform the function at all. It is also emphasized that the assessment is limited to NWI-mapped wetlands (i.e., classified according to the Cowardin et al. 1979 system). Deepwater habitats and streams were not included in the assessment, although their inherent value to wetlands and many wetland-dependent organisms is apparent and widely recognized. Limitations of Predictions for Certain Functions Predicting Waterfowl and Waterbird Habitat. For wood duck, wooded wetlands in urban areas were also identified by the selection process. The width of the wetlands and the intensity of development in the surrounding area may have an effect on the actual function, but this was not evaluated. Consult state waterfowl biologists for more information. Some streamside wetlands along what may be intermittent streams may have been designated as significant for wood duck. Predicting Provision of Habitat for Other Wildlife. Size and diversity of vegetative life-forms were used in highlighting wetlands important for this function, yet natural ponds of any size were rated as high since they may be important for amphibians. This was an attempt to highlight potential vernal pools. Given limitations of scale in mapping streamside wetlands, the NWI data represented what may be a larger linear wetland as a series of smaller wetlands. Consequently, some streamside wetlands have been identified as having moderate significance
16
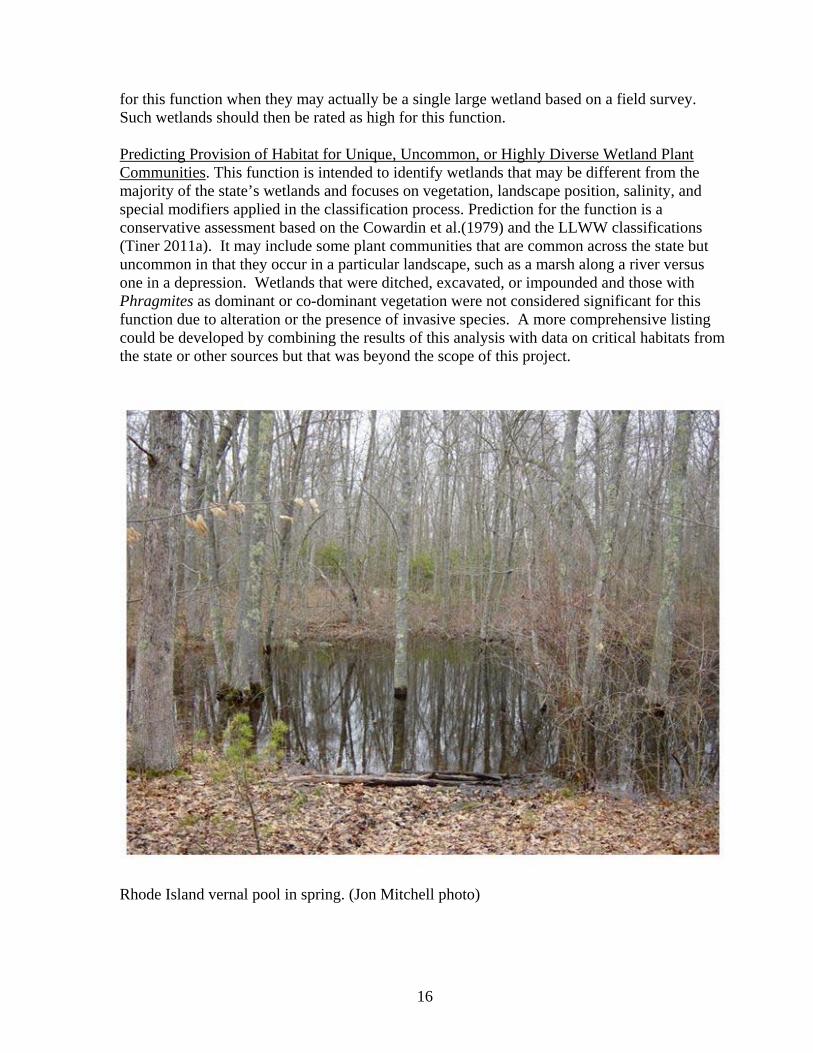
for this function when they may actually be a single large wetland based on a field survey. Such wetlands should then be rated as high for this function. Predicting Provision of Habitat for Unique, Uncommon, or Highly Diverse Wetland Plant Communities. This function is intended to identify wetlands that may be different from the majority of the state’s wetlands and focuses on vegetation, landscape position, salinity, and special modifiers applied in the classification process. Prediction for the function is a conservative assessment based on the Cowardin et al.(1979) and the LLWW classifications (Tiner 2011a). It may include some plant communities that are common across the state but uncommon in that they occur in a particular landscape, such as a marsh along a river versus one in a depression. Wetlands that were ditched, excavated, or impounded and those with Phragmites as dominant or co-dominant vegetation were not considered significant for this function due to alteration or the presence of invasive species. A more comprehensive listing could be developed by combining the results of this analysis with data on critical habitats from the state or other sources but that was beyond the scope of this project.
Rhode Island vernal pool in spring. (Jon Mitchell photo)
17
RESULTS Geospatial Data and Online Mapper Geospatial data for Rhode Island’s wetlands and deepwater habitats are available online via the online mapper at the Association of State Wetland Managers website under the topic “Wetlands One-Stop Mapping” (http://aswm.org/wetland-science/wetlands-one-stop-mapping; see Appendix B for an introduction to this tool). As mentioned earlier, custom maps for specific areas can be made using the online mapping tool with data displayed on a variety of basemaps including aerial imagery. While the website displays numerous data layers, the ones of interest for functional assessment are LLWW types and wetlands of significance for various functions (Table 5). To view the location of wetlands by the classifications of this assessment, readers must access the NWI+ Web Mapper. Some examples from the mapper are included in the following sections. ----------------------------------------------------------------------------------------------------------------- Table 5. List of data layers included on the NWI+ web mapper that are particularly relevant to this report and available for Rhode Island. “NWI+ Footprints” – shows project areas where NWI+ data are available. “Wetland Codes” – places dots on the wetlands so that user can click on the dot to get the wetland classification by NWI type and by LLWW type. “NWI – Common Types” – shows mapped wetlands and deepwater habitats by Cowardin et al. (1979) types (color-coded types – legend can be viewed by clicking on “Show Legend” icon on the tool bar and then click on “NWI – Common Types” from the list of legends). “NWI+ Landscape” – shows mapped wetlands classified by landscape position (color-coded types – view legend as described above, but click on “NWI+ Landscape”) “NWI+ Landform” – shows mapped wetlands classified by landform (color-coded types – view legend as described above, but click on “NWI+ Landform”) “NWI+ Water Flow Path” - shows mapped wetlands classified by water flow path (color-coded types – view legend as described above) “______ Function” shows wetlands predicted to perform specific functions at significant levels (e.g., high or moderate): “BSS” (bank and shoreline stabilization, “CAR” (carbon sequestration, “CSS” (coastal storm surge detention), “FAIH” (fish and aquatic invertebrate habitat), NT (nutrient transformation), OWH (other wildlife habitat), SM (streamflow maintenance), SR (sediment and other particulate retention), SWD (surface water detention – for freshwater wetlands only), UWPC (unique, uncommon or highly diverse wetland plant communities – based on NWI codes only), and WBIRD (waterfowl and waterbird habitat). To view legend, click on the “Show Legend” icon on the toolbar, then on the applicable function.

18
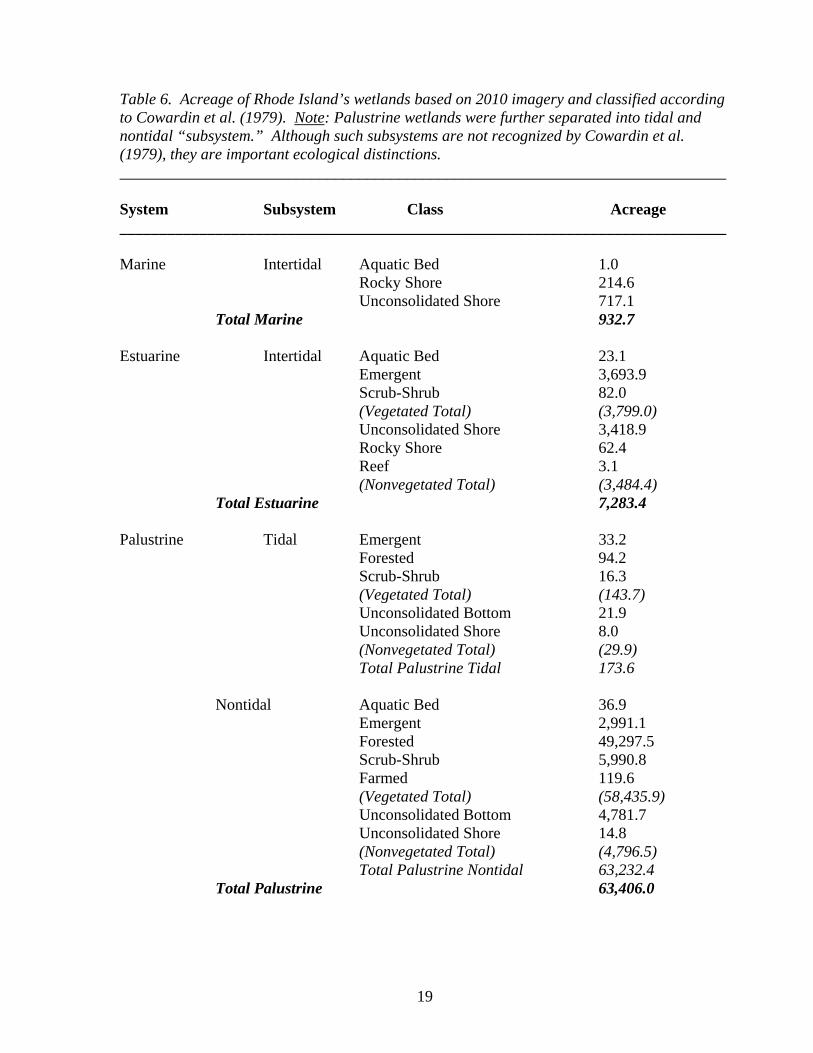
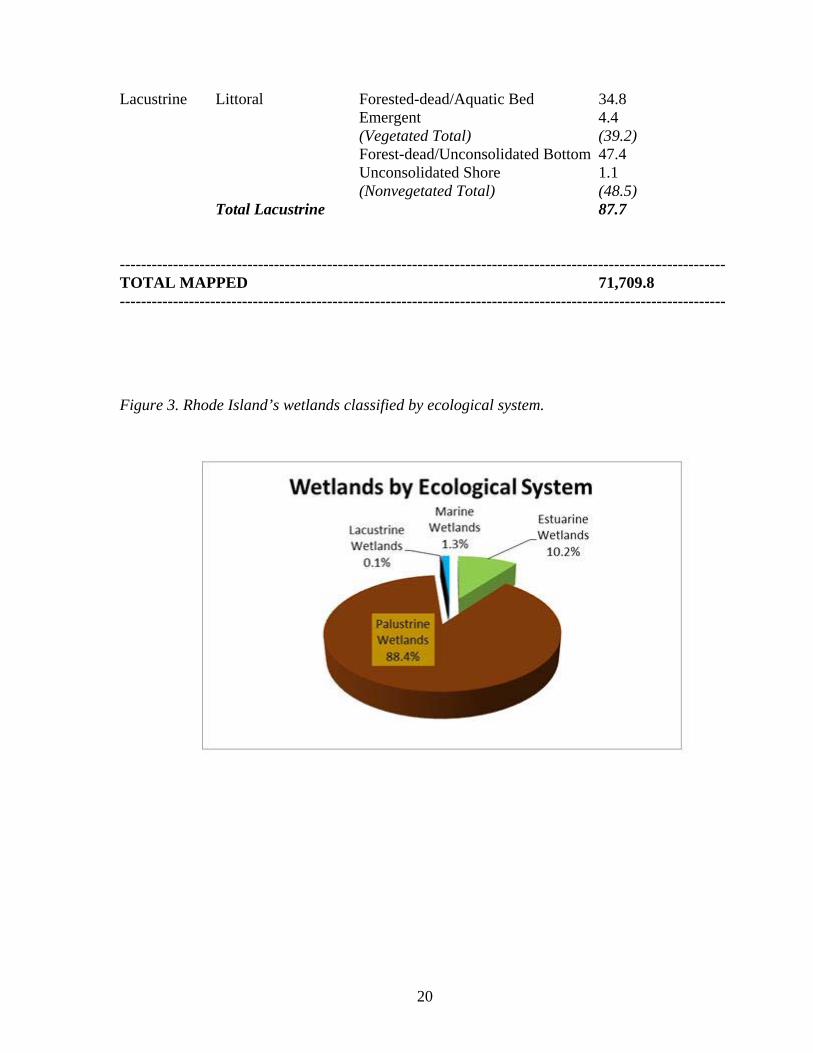
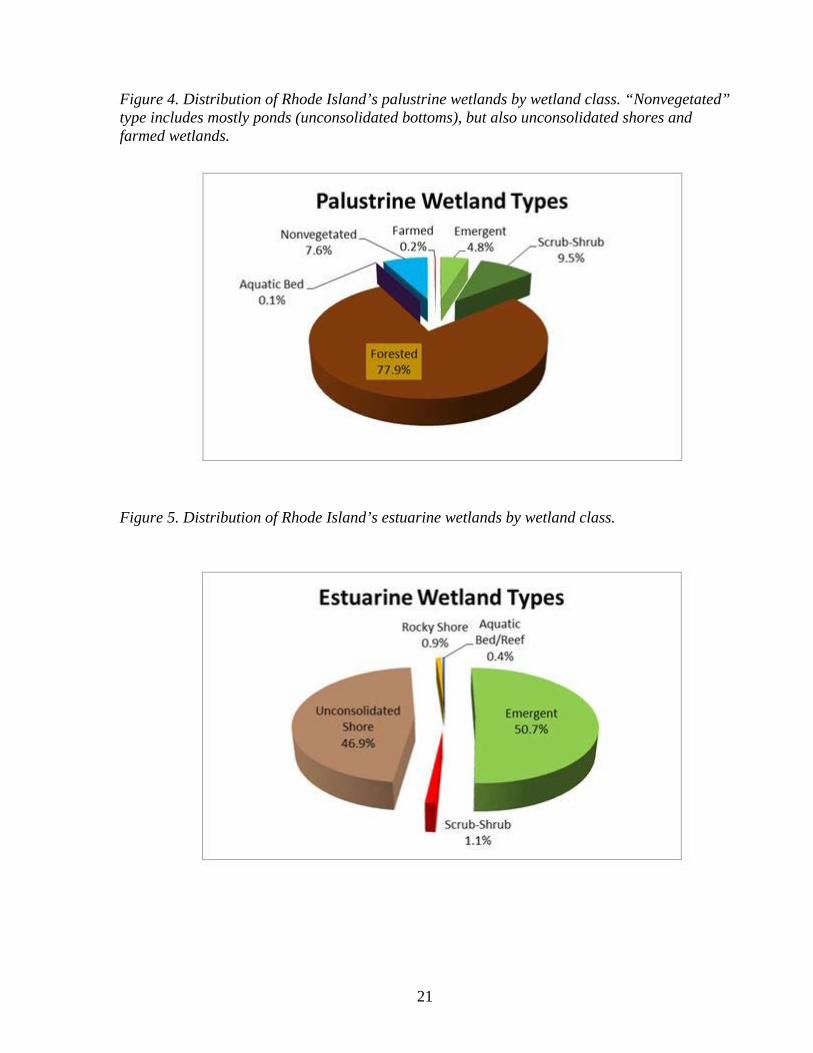
Wetlands Classified by NWI Types Nearly 72,000 acres of wetlands were inventoried (Table 6), covering about 11% of the state’s land area. Palustrine wetlands are the predominant type as they are the “inland wetlands” - composed of forested wetlands, shrub swamps, wet meadows, marshes, bogs, and ponds. They make up 88% of the state’s wetlands (Figure 3). Forested wetlands are the major palustrine type, comprising 78% of Rhode Island’s freshwater wetlands (Figure 4). Scrub-shrub wetlands (shrub swamps) are next in abundance followed by ponds, emergent wetlands, farmed wetlands, and aquatic beds rounding out the palustrine types. (Note: Aquatic beds are under-represented in the inventory.) The survey located 94 acres of bogs and 2,560 acres of Atlantic white cedar swamps (Note: The latter figure may include some hemlock swamps). Estuarine wetlands represent about 10% of the state’s wetlands. The emergent type (salt and brackish marshes) and unconsolidated shores (beaches and tidal flats) predominated, accounting for 51% and 47% of the state’s estuarine wetlands, respectively (Figure 5). Of the estuarine total, 421 acres were located in slightly brackish (oligohaline) environments. Marine wetlands (mostly beaches and tidal flats, 932 acres) and lacustrine wetlands (88 acres; mostly shallow water zone of lakes and large impoundments and associated aquatic beds) together comprised less than 2% of the state’s wetlands. (Note: Rocky shores are under-represented since they are mostly linear features that were not mapped as polygons.) From a hydrologic standpoint, estuarine wetlands were mostly irregularly flooded (64%; inundated by the tides less than daily), while 19% were regularly flooded (daily) and 17% were irregularly exposed. Freshwater wetlands had more variable hydrologies. Most (83%) of the freshwater wetlands were seasonally flooded types. Eight percent were permanently flooded (mostly ponds), 4% saturated (mostly seasonally saturated types), 3% temporarily flooded, 1% semipermanently flooded, and the rest were artificially flooded (13 acres) and tidal (174 acres). Humans and beavers impact the state’s wetlands. A total of 8,322 wetland acres were affected by impoundment, whereas only 548 acres of palustrine wetlands were mapped as excavated. More than 2,000 acres of wetlands were identified as ditched, yet this is an underestimate as many other wetlands or portions thereof could also be so designated. A total of 120 acres were farmed mostly for cranberry cultivation (119 acres). Beaver activity affected only 50 acres statewide according to this rapid update.
19
Table 6. Acreage of Rhode Island’s wetlands based on 2010 imagery and classified according to Cowardin et al. (1979). Note: Palustrine wetlands were further separated into tidal and nontidal “subsystem.” Although such subsystems are not recognized by Cowardin et al. (1979), they are important ecological distinctions. ____________________________________________________________________________ System Subsystem Class Acreage ____________________________________________________________________________ Marine Intertidal Aquatic Bed 1.0 Rocky Shore 214.6 Unconsolidated Shore 717.1 Total Marine 932.7 Estuarine Intertidal Aquatic Bed 23.1 Emergent 3,693.9 Scrub-Shrub 82.0 (Vegetated Total) (3,799.0) Unconsolidated Shore 3,418.9 Rocky Shore 62.4 Reef 3.1 (Nonvegetated Total) (3,484.4) Total Estuarine 7,283.4 Palustrine Tidal Emergent 33.2 Forested 94.2 Scrub-Shrub 16.3 (Vegetated Total) (143.7) Unconsolidated Bottom 21.9 Unconsolidated Shore 8.0 (Nonvegetated Total) (29.9) Total Palustrine Tidal 173.6 Nontidal Aquatic Bed 36.9 Emergent 2,991.1 Forested 49,297.5 Scrub-Shrub 5,990.8 Farmed 119.6 (Vegetated Total) (58,435.9) Unconsolidated Bottom 4,781.7 Unconsolidated Shore 14.8 (Nonvegetated Total) (4,796.5) Total Palustrine Nontidal 63,232.4 Total Palustrine 63,406.0
20
Lacustrine Littoral Forested-dead/Aquatic Bed 34.8 Emergent 4.4 (Vegetated Total) (39.2) Forest-dead/Unconsolidated Bottom 47.4 Unconsolidated Shore 1.1 (Nonvegetated Total) (48.5) Total Lacustrine 87.7 ------------------------------------------------------------------------------------------------------------------ TOTAL MAPPED 71,709.8 ------------------------------------------------------------------------------------------------------------------
Figure 3. Rhode Island’s wetlands classified by ecological system.
21
Figure 4. Distribution of Rhode Island’s palustrine wetlands by wetland class. “Nonvegetated” type includes mostly ponds (unconsolidated bottoms), but also unconsolidated shores and farmed wetlands.
Figure 5. Distribution of Rhode Island’s estuarine wetlands by wetland class.
22
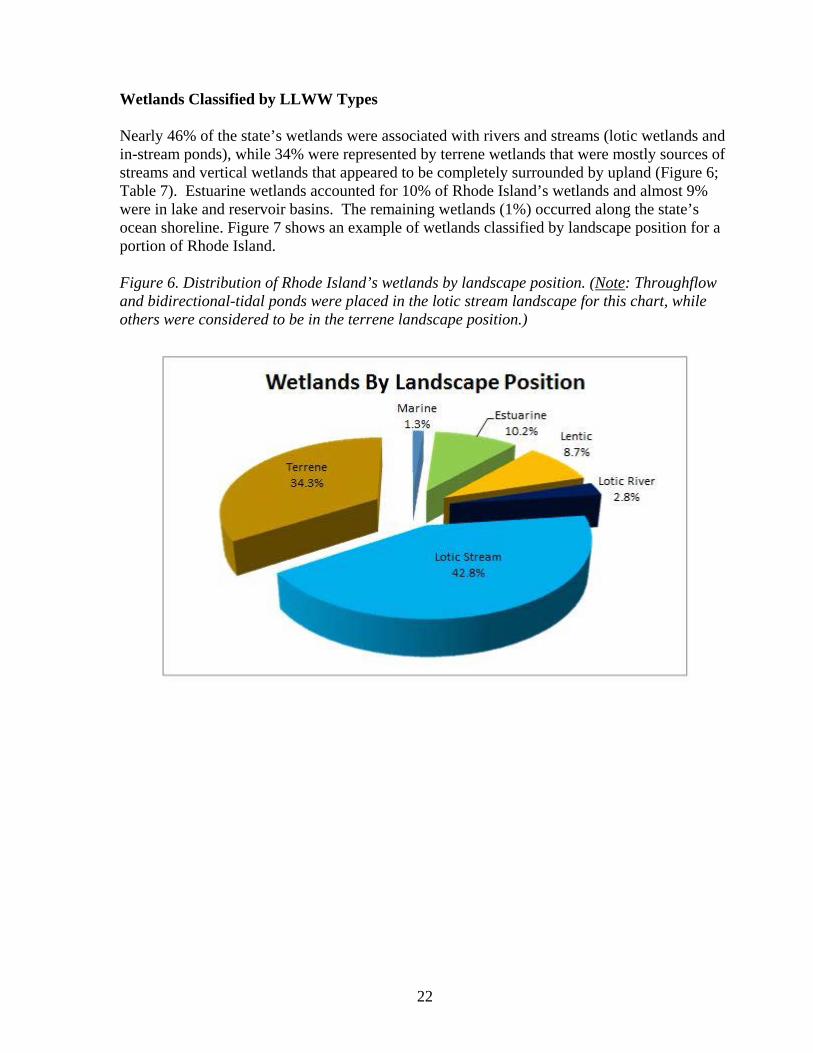
Wetlands Classified by LLWW Types Nearly 46% of the state’s wetlands were associated with rivers and streams (lotic wetlands and in-stream ponds), while 34% were represented by terrene wetlands that were mostly sources of streams and vertical wetlands that appeared to be completely surrounded by upland (Figure 6; Table 7). Estuarine wetlands accounted for 10% of Rhode Island’s wetlands and almost 9% were in lake and reservoir basins. The remaining wetlands (1%) occurred along the state’s ocean shoreline. Figure 7 shows an example of wetlands classified by landscape position for a portion of Rhode Island. Figure 6. Distribution of Rhode Island’s wetlands by landscape position. (Note: Throughflow and bidirectional-tidal ponds were placed in the lotic stream landscape for this chart, while others were considered to be in the terrene landscape position.)
23
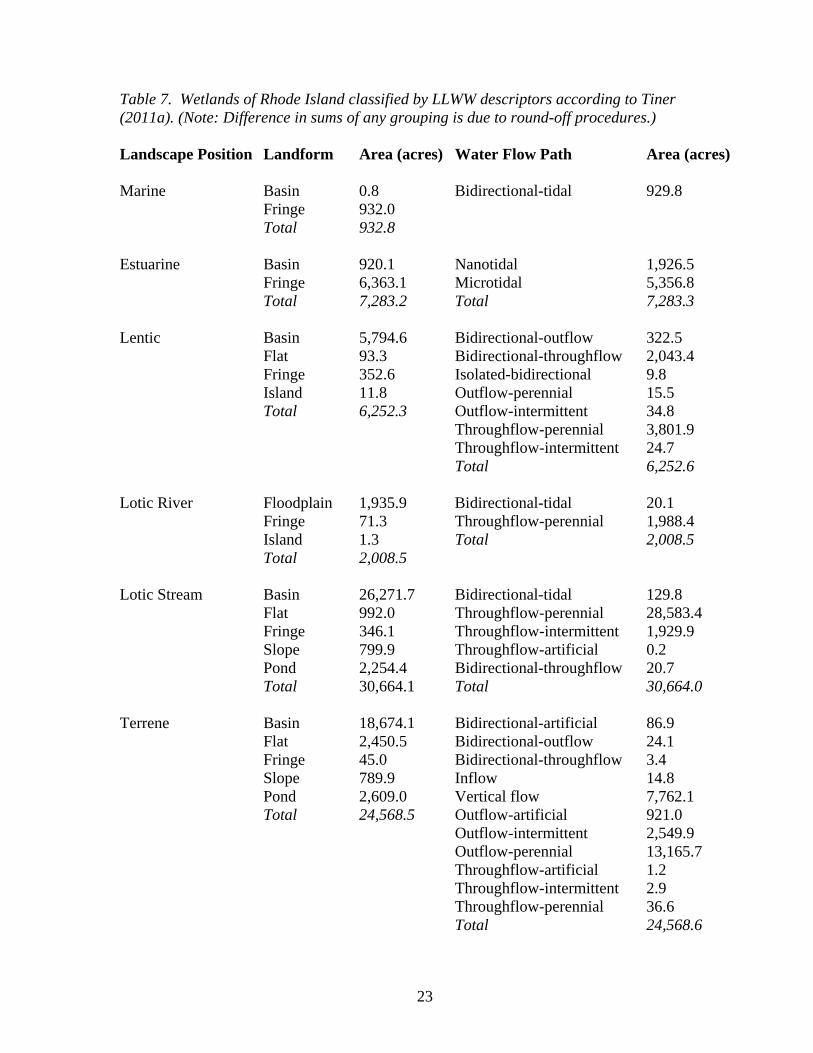
Table 7. Wetlands of Rhode Island classified by LLWW descriptors according to Tiner (2011a). (Note: Difference in sums of any grouping is due to round-off procedures.) Landscape Position Landform Area (acres) Water Flow Path Area (acres) Marine Basin 0.8 Bidirectional-tidal 929.8 Fringe 932.0 Total 932.8 Estuarine Basin 920.1 Nanotidal 1,926.5 Fringe 6,363.1 Microtidal 5,356.8 Total 7,283.2 Total 7,283.3 Lentic Basin 5,794.6 Bidirectional-outflow 322.5 Flat 93.3 Bidirectional-throughflow 2,043.4 Fringe 352.6 Isolated-bidirectional 9.8 Island 11.8 Outflow-perennial 15.5 Total 6,252.3 Outflow-intermittent 34.8 Throughflow-perennial 3,801.9 Throughflow-intermittent 24.7 Total 6,252.6 Lotic River Floodplain 1,935.9 Bidirectional-tidal 20.1 Fringe 71.3 Throughflow-perennial 1,988.4 Island 1.3 Total 2,008.5 Total 2,008.5 Lotic Stream Basin 26,271.7 Bidirectional-tidal 129.8 Flat 992.0 Throughflow-perennial 28,583.4 Fringe 346.1 Throughflow-intermittent 1,929.9 Slope 799.9 Throughflow-artificial 0.2 Pond 2,254.4 Bidirectional-throughflow 20.7 Total 30,664.1 Total 30,664.0 Terrene Basin 18,674.1 Bidirectional-artificial 86.9 Flat 2,450.5 Bidirectional-outflow 24.1 Fringe 45.0 Bidirectional-throughflow 3.4 Slope 789.9 Inflow 14.8 Pond 2,609.0 Vertical flow 7,762.1 Total 24,568.5 Outflow-artificial 921.0 Outflow-intermittent 2,549.9 Outflow-perennial 13,165.7 Throughflow-artificial 1.2 Throughflow-intermittent 2.9 Throughflow-perennial 36.6 Total 24,568.6
24
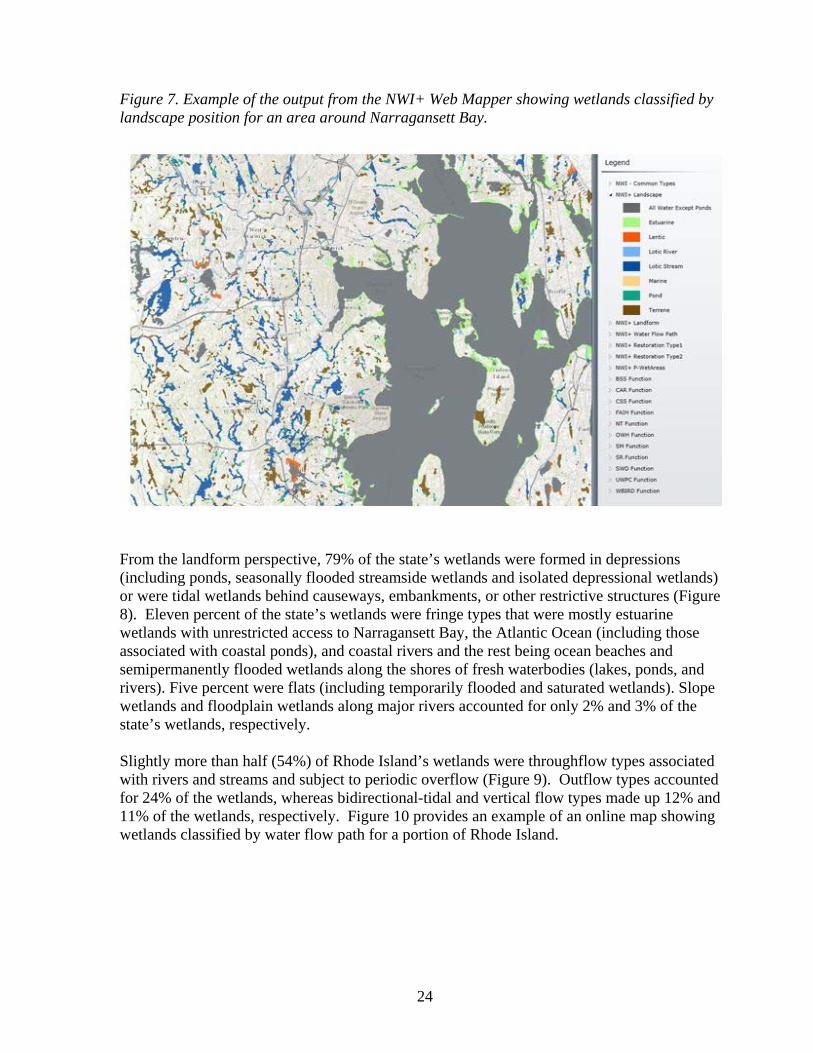
Figure 7. Example of the output from the NWI+ Web Mapper showing wetlands classified by landscape position for an area around Narragansett Bay.
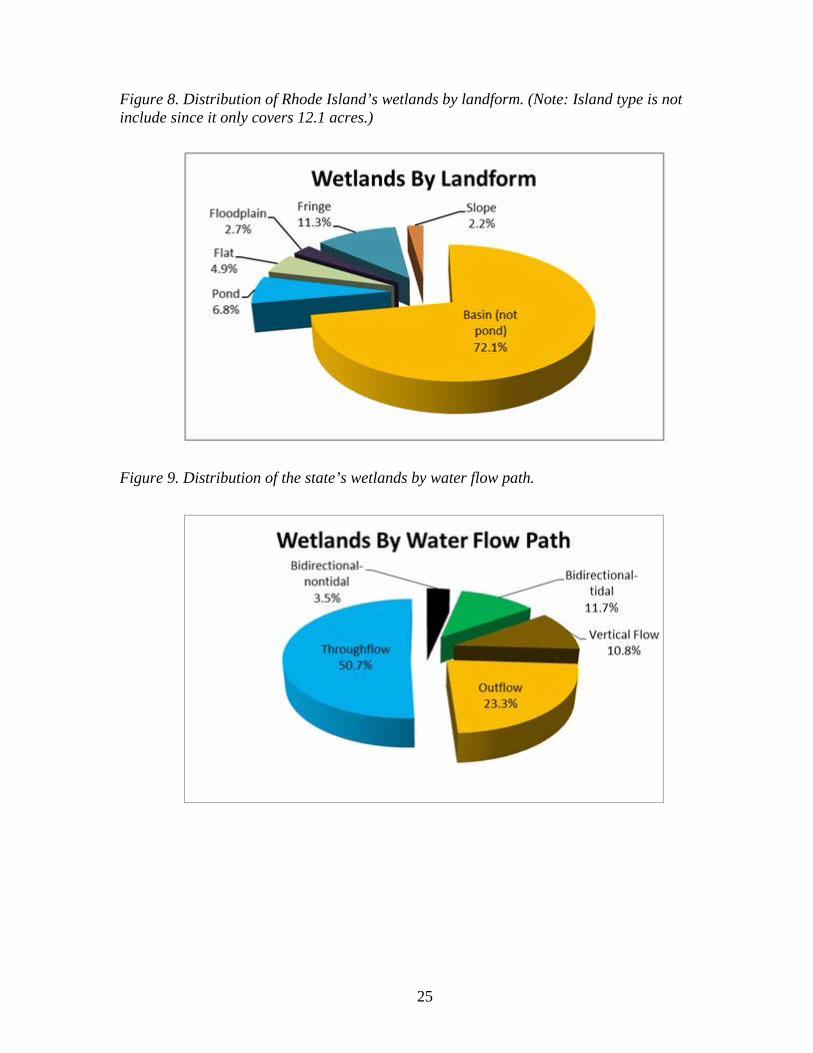
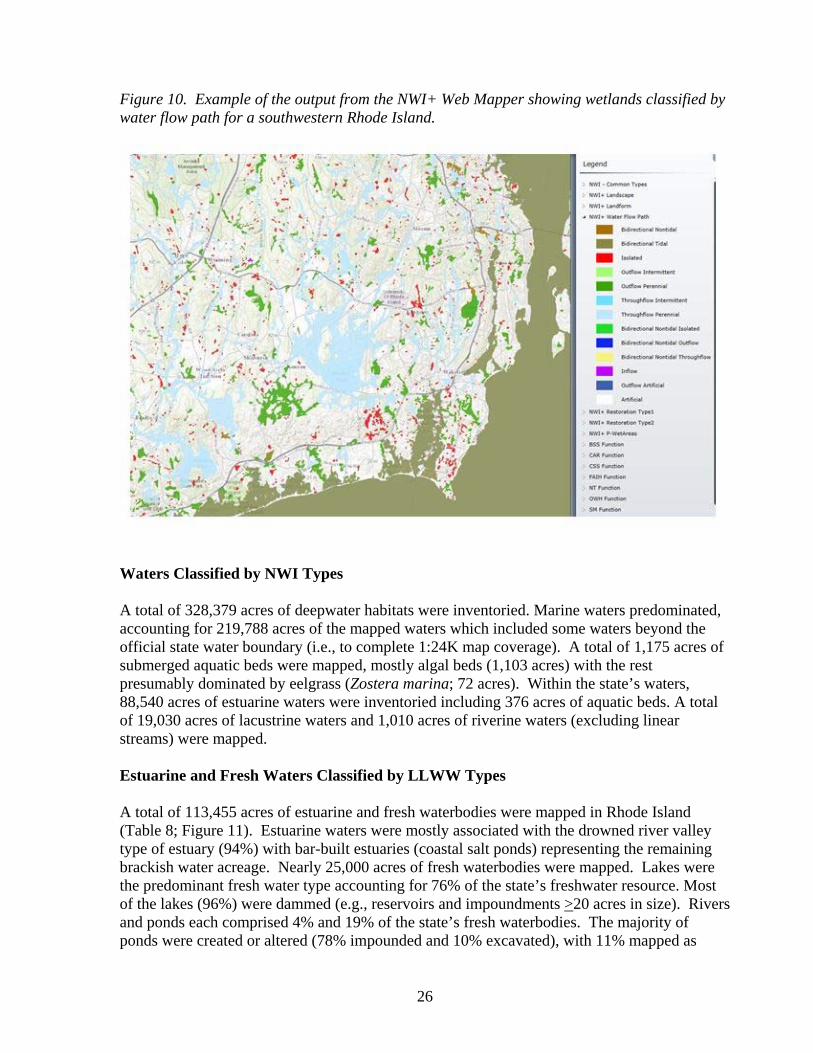
From the landform perspective, 79% of the state’s wetlands were formed in depressions (including ponds, seasonally flooded streamside wetlands and isolated depressional wetlands) or were tidal wetlands behind causeways, embankments, or other restrictive structures (Figure 8). Eleven percent of the state’s wetlands were fringe types that were mostly estuarine wetlands with unrestricted access to Narragansett Bay, the Atlantic Ocean (including those associated with coastal ponds), and coastal rivers and the rest being ocean beaches and semipermanently flooded wetlands along the shores of fresh waterbodies (lakes, ponds, and rivers). Five percent were flats (including temporarily flooded and saturated wetlands). Slope wetlands and floodplain wetlands along major rivers accounted for only 2% and 3% of the state’s wetlands, respectively. Slightly more than half (54%) of Rhode Island’s wetlands were throughflow types associated with rivers and streams and subject to periodic overflow (Figure 9). Outflow types accounted for 24% of the wetlands, whereas bidirectional-tidal and vertical flow types made up 12% and 11% of the wetlands, respectively. Figure 10 provides an example of an online map showing wetlands classified by water flow path for a portion of Rhode Island.
25
Figure 8. Distribution of Rhode Island’s wetlands by landform. (Note: Island type is not include since it only covers 12.1 acres.)
Figure 9. Distribution of the state’s wetlands by water flow path.
26
Figure 10. Example of the output from the NWI+ Web Mapper showing wetlands classified by water flow path for a southwestern Rhode Island.
Waters Classified by NWI Types A total of 328,379 acres of deepwater habitats were inventoried. Marine waters predominated, accounting for 219,788 acres of the mapped waters which included some waters beyond the official state water boundary (i.e., to complete 1:24K map coverage). A total of 1,175 acres of submerged aquatic beds were mapped, mostly algal beds (1,103 acres) with the rest presumably dominated by eelgrass (Zostera marina; 72 acres). Within the state’s waters, 88,540 acres of estuarine waters were inventoried including 376 acres of aquatic beds. A total of 19,030 acres of lacustrine waters and 1,010 acres of riverine waters (excluding linear streams) were mapped. Estuarine and Fresh Waters Classified by LLWW Types A total of 113,455 acres of estuarine and fresh waterbodies were mapped in Rhode Island (Table 8; Figure 11). Estuarine waters were mostly associated with the drowned river valley type of estuary (94%) with bar-built estuaries (coastal salt ponds) representing the remaining brackish water acreage. Nearly 25,000 acres of fresh waterbodies were mapped. Lakes were the predominant fresh water type accounting for 76% of the state’s freshwater resource. Most of the lakes (96%) were dammed (e.g., reservoirs and impoundments >20 acres in size). Rivers and ponds each comprised 4% and 19% of the state’s fresh waterbodies. The majority of ponds were created or altered (78% impounded and 10% excavated), with 11% mapped as
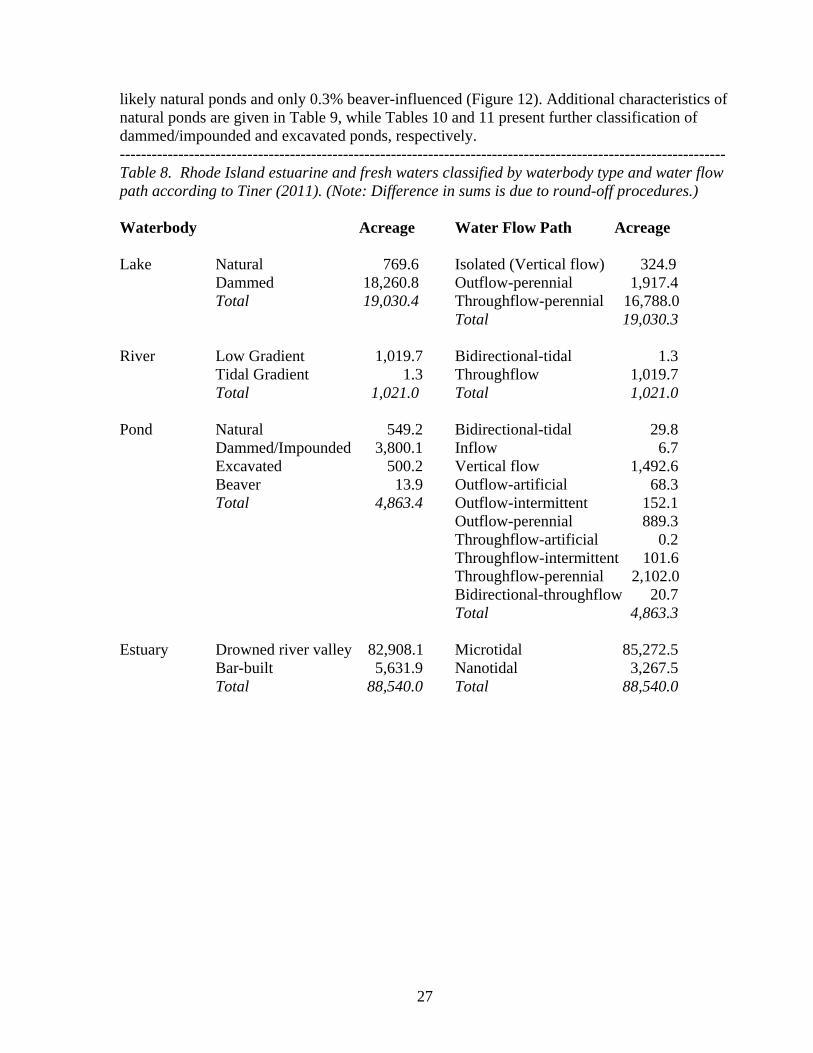
27
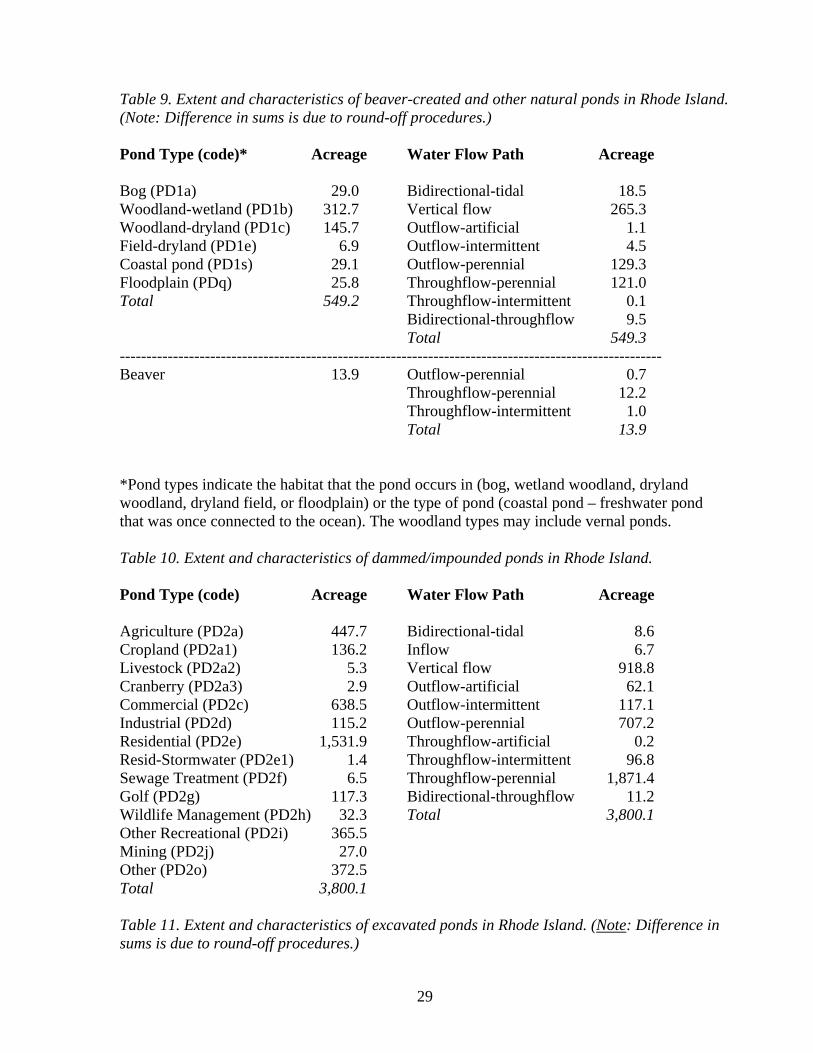
likely natural ponds and only 0.3% beaver-influenced (Figure 12). Additional characteristics of natural ponds are given in Table 9, while Tables 10 and 11 present further classification of dammed/impounded and excavated ponds, respectively. ------------------------------------------------------------------------------------------------------------------ Table 8. Rhode Island estuarine and fresh waters classified by waterbody type and water flow path according to Tiner (2011). (Note: Difference in sums is due to round-off procedures.) Waterbody Acreage Water Flow Path Acreage Lake Natural 769.6 Isolated (Vertical flow) 324.9 Dammed 18,260.8 Outflow-perennial 1,917.4 Total 19,030.4 Throughflow-perennial 16,788.0 Total 19,030.3 River Low Gradient 1,019.7 Bidirectional-tidal 1.3 Tidal Gradient 1.3 Throughflow 1,019.7 Total 1,021.0 Total 1,021.0 Pond Natural 549.2 Bidirectional-tidal 29.8 Dammed/Impounded 3,800.1 Inflow 6.7 Excavated 500.2 Vertical flow 1,492.6 Beaver 13.9 Outflow-artificial 68.3 Total 4,863.4 Outflow-intermittent 152.1 Outflow-perennial 889.3 Throughflow-artificial 0.2 Throughflow-intermittent 101.6 Throughflow-perennial 2,102.0 Bidirectional-throughflow 20.7 Total 4,863.3 Estuary Drowned river valley 82,908.1 Microtidal 85,272.5 Bar-built 5,631.9 Nanotidal 3,267.5 Total 88,540.0 Total 88,540.0

28
Figure 11. Distribution of Rhode Island’s 113,455 acres of open water (excluding marine waters). (Note: This figure does not include the 88 acres of shallow water wetlands mapped in lakes or the 37 acres of palustrine aquatic bed wetlands in open water of ponds; those acreages are too small to have any significant effect on the percentages given below.)
Figure 12. Distribution of pond types in Rhode Island.
29
Table 9. Extent and characteristics of beaver-created and other natural ponds in Rhode Island. (Note: Difference in sums is due to round-off procedures.) Pond Type (code)* Acreage Water Flow Path Acreage Bog (PD1a) 29.0 Bidirectional-tidal 18.5 Woodland-wetland (PD1b) 312.7 Vertical flow 265.3 Woodland-dryland (PD1c) 145.7 Outflow-artificial 1.1 Field-dryland (PD1e) 6.9 Outflow-intermittent 4.5 Coastal pond (PD1s) 29.1 Outflow-perennial 129.3 Floodplain (PDq) 25.8 Throughflow-perennial 121.0 Total 549.2 Throughflow-intermittent 0.1 Bidirectional-throughflow 9.5 Total 549.3 ------------------------------------------------------------------------------------------------------ Beaver 13.9 Outflow-perennial 0.7 Throughflow-perennial 12.2 Throughflow-intermittent 1.0 Total 13.9 *Pond types indicate the habitat that the pond occurs in (bog, wetland woodland, dryland woodland, dryland field, or floodplain) or the type of pond (coastal pond – freshwater pond that was once connected to the ocean). The woodland types may include vernal ponds. Table 10. Extent and characteristics of dammed/impounded ponds in Rhode Island. Pond Type (code) Acreage Water Flow Path Acreage Agriculture (PD2a) 447.7 Bidirectional-tidal 8.6 Cropland (PD2a1) 136.2 Inflow 6.7 Livestock (PD2a2) 5.3 Vertical flow 918.8 Cranberry (PD2a3) 2.9 Outflow-artificial 62.1 Commercial (PD2c) 638.5 Outflow-intermittent 117.1 Industrial (PD2d) 115.2 Outflow-perennial 707.2 Residential (PD2e) 1,531.9 Throughflow-artificial 0.2 Resid-Stormwater (PD2e1) 1.4 Throughflow-intermittent 96.8 Sewage Treatment (PD2f) 6.5 Throughflow-perennial 1,871.4 Golf (PD2g) 117.3 Bidirectional-throughflow 11.2 Wildlife Management (PD2h) 32.3 Total 3,800.1 Other Recreational (PD2i) 365.5 Mining (PD2j) 27.0 Other (PD2o) 372.5 Total 3,800.1 Table 11. Extent and characteristics of excavated ponds in Rhode Island. (Note: Difference in sums is due to round-off procedures.)
30
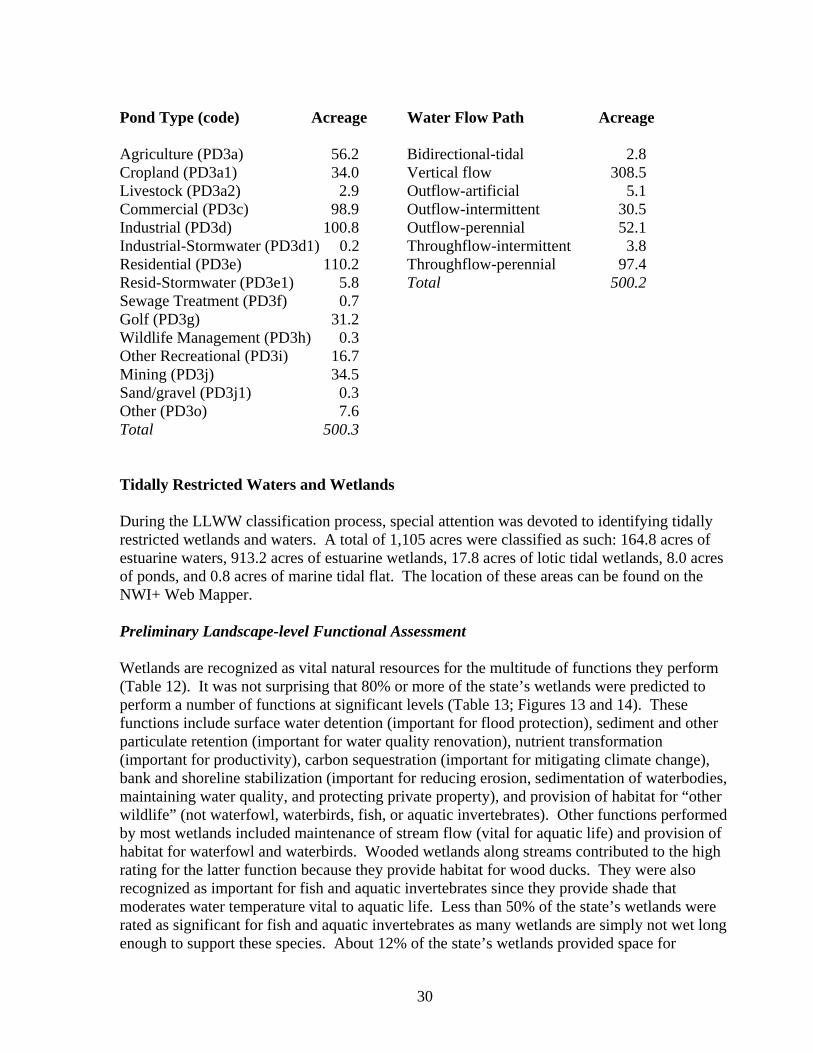
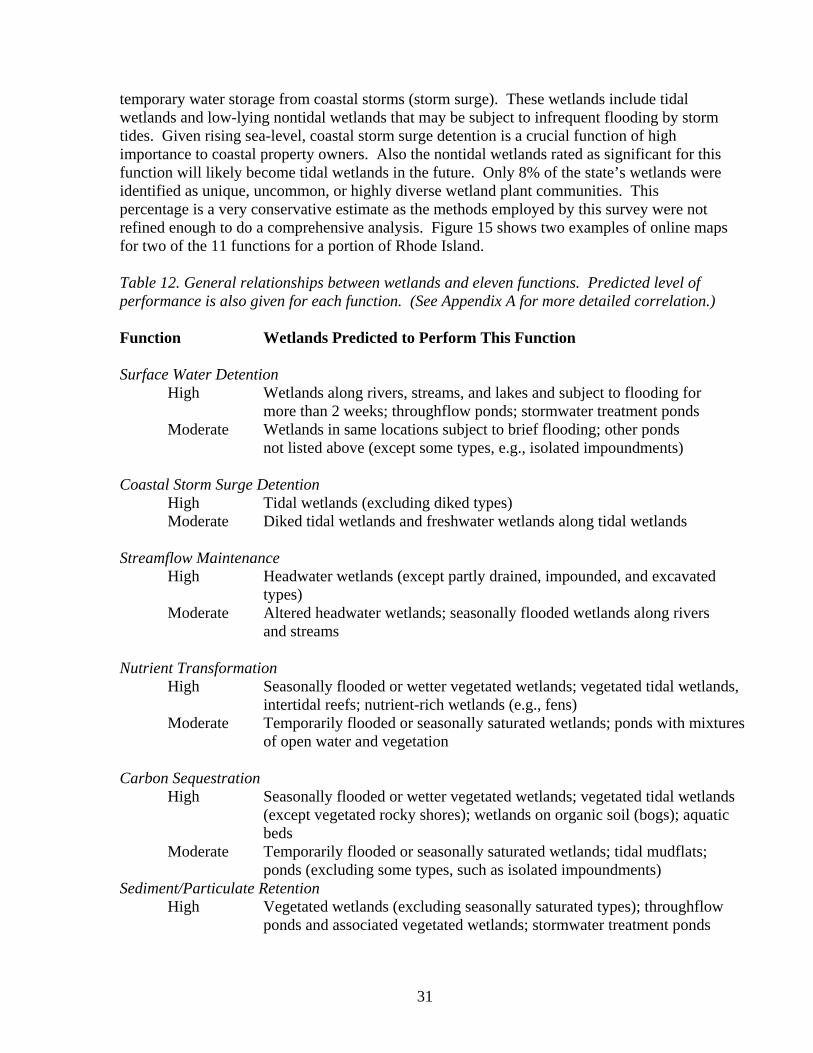
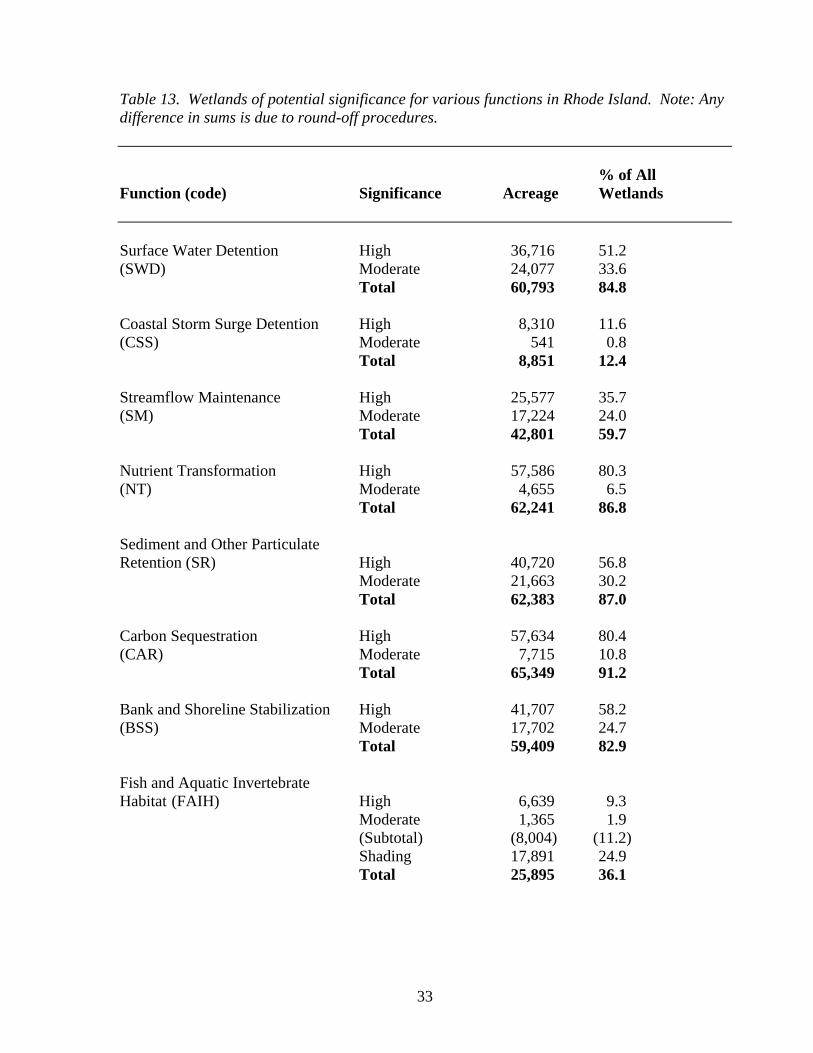
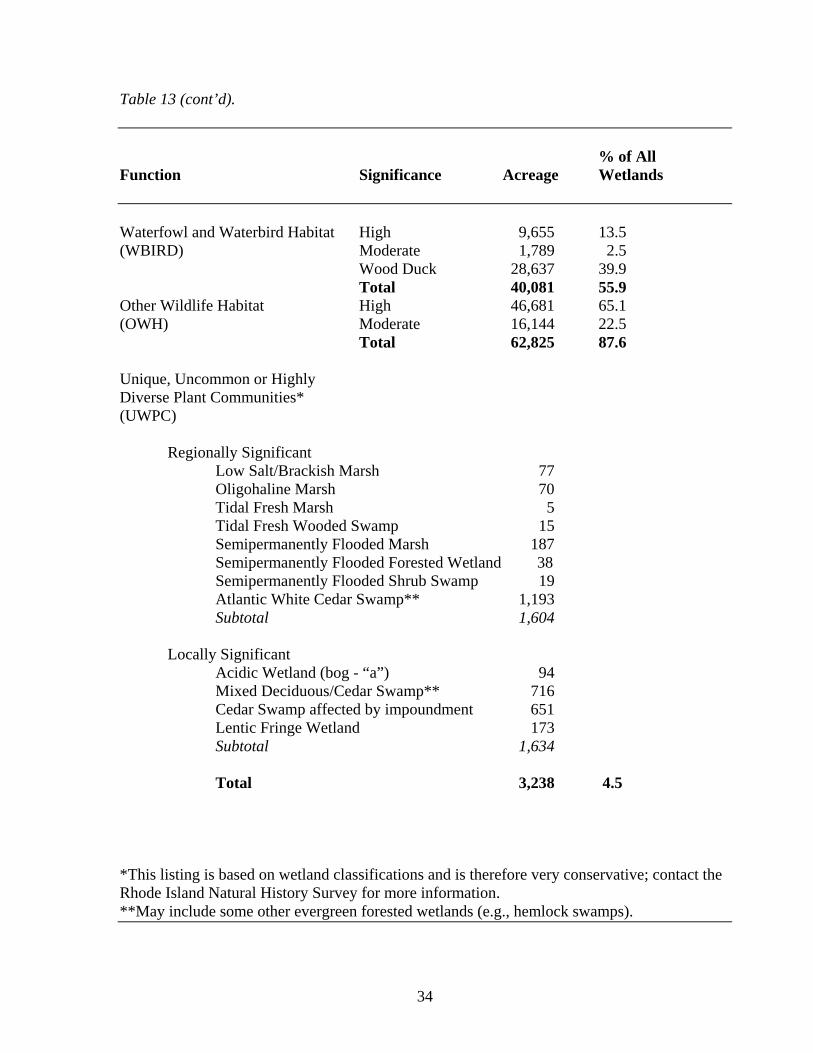
Pond Type (code) Acreage Water Flow Path Acreage Agriculture (PD3a) 56.2 Bidirectional-tidal 2.8 Cropland (PD3a1) 34.0 Vertical flow 308.5 Livestock (PD3a2) 2.9 Outflow-artificial 5.1 Commercial (PD3c) 98.9 Outflow-intermittent 30.5 Industrial (PD3d) 100.8 Outflow-perennial 52.1 Industrial-Stormwater (PD3d1) 0.2 Throughflow-intermittent 3.8 Residential (PD3e) 110.2 Throughflow-perennial 97.4 Resid-Stormwater (PD3e1) 5.8 Total 500.2 Sewage Treatment (PD3f) 0.7 Golf (PD3g) 31.2 Wildlife Management (PD3h) 0.3 Other Recreational (PD3i) 16.7 Mining (PD3j) 34.5 Sand/gravel (PD3j1) 0.3 Other (PD3o) 7.6 Total 500.3 Tidally Restricted Waters and Wetlands During the LLWW classification process, special attention was devoted to identifying tidally restricted wetlands and waters. A total of 1,105 acres were classified as such: 164.8 acres of estuarine waters, 913.2 acres of estuarine wetlands, 17.8 acres of lotic tidal wetlands, 8.0 acres of ponds, and 0.8 acres of marine tidal flat. The location of these areas can be found on the NWI+ Web Mapper. Preliminary Landscape-level Functional Assessment Wetlands are recognized as vital natural resources for the multitude of functions they perform (Table 12). It was not surprising that 80% or more of the state’s wetlands were predicted to perform a number of functions at significant levels (Table 13; Figures 13 and 14). These functions include surface water detention (important for flood protection), sediment and other particulate retention (important for water quality renovation), nutrient transformation (important for productivity), carbon sequestration (important for mitigating climate change), bank and shoreline stabilization (important for reducing erosion, sedimentation of waterbodies, maintaining water quality, and protecting private property), and provision of habitat for “other wildlife” (not waterfowl, waterbirds, fish, or aquatic invertebrates). Other functions performed by most wetlands included maintenance of stream flow (vital for aquatic life) and provision of habitat for waterfowl and waterbirds. Wooded wetlands along streams contributed to the high rating for the latter function because they provide habitat for wood ducks. They were also recognized as important for fish and aquatic invertebrates since they provide shade that moderates water temperature vital to aquatic life. Less than 50% of the state’s wetlands were rated as significant for fish and aquatic invertebrates as many wetlands are simply not wet long enough to support these species. About 12% of the state’s wetlands provided space for
31
temporary water storage from coastal storms (storm surge). These wetlands include tidal wetlands and low-lying nontidal wetlands that may be subject to infrequent flooding by storm tides. Given rising sea-level, coastal storm surge detention is a crucial function of high importance to coastal property owners. Also the nontidal wetlands rated as significant for this function will likely become tidal wetlands in the future. Only 8% of the state’s wetlands were identified as unique, uncommon, or highly diverse wetland plant communities. This percentage is a very conservative estimate as the methods employed by this survey were not refined enough to do a comprehensive analysis. Figure 15 shows two examples of online maps for two of the 11 functions for a portion of Rhode Island. Table 12. General relationships between wetlands and eleven functions. Predicted level of performance is also given for each function. (See Appendix A for more detailed correlation.) Function Wetlands Predicted to Perform This Function Surface Water Detention High Wetlands along rivers, streams, and lakes and subject to flooding for more than 2 weeks; throughflow ponds; stormwater treatment ponds Moderate Wetlands in same locations subject to brief flooding; other ponds not listed above (except some types, e.g., isolated impoundments)
Coastal Storm Surge Detention High Tidal wetlands (excluding diked types) Moderate Diked tidal wetlands and freshwater wetlands along tidal wetlands Streamflow Maintenance High Headwater wetlands (except partly drained, impounded, and excavated types) Moderate Altered headwater wetlands; seasonally flooded wetlands along rivers and streams Nutrient Transformation High Seasonally flooded or wetter vegetated wetlands; vegetated tidal wetlands, intertidal reefs; nutrient-rich wetlands (e.g., fens) Moderate Temporarily flooded or seasonally saturated wetlands; ponds with mixtures of open water and vegetation Carbon Sequestration High Seasonally flooded or wetter vegetated wetlands; vegetated tidal wetlands (except vegetated rocky shores); wetlands on organic soil (bogs); aquatic beds Moderate Temporarily flooded or seasonally saturated wetlands; tidal mudflats; ponds (excluding some types, such as isolated impoundments) Sediment/Particulate Retention High Vegetated wetlands (excluding seasonally saturated types); throughflow ponds and associated vegetated wetlands; stormwater treatment ponds
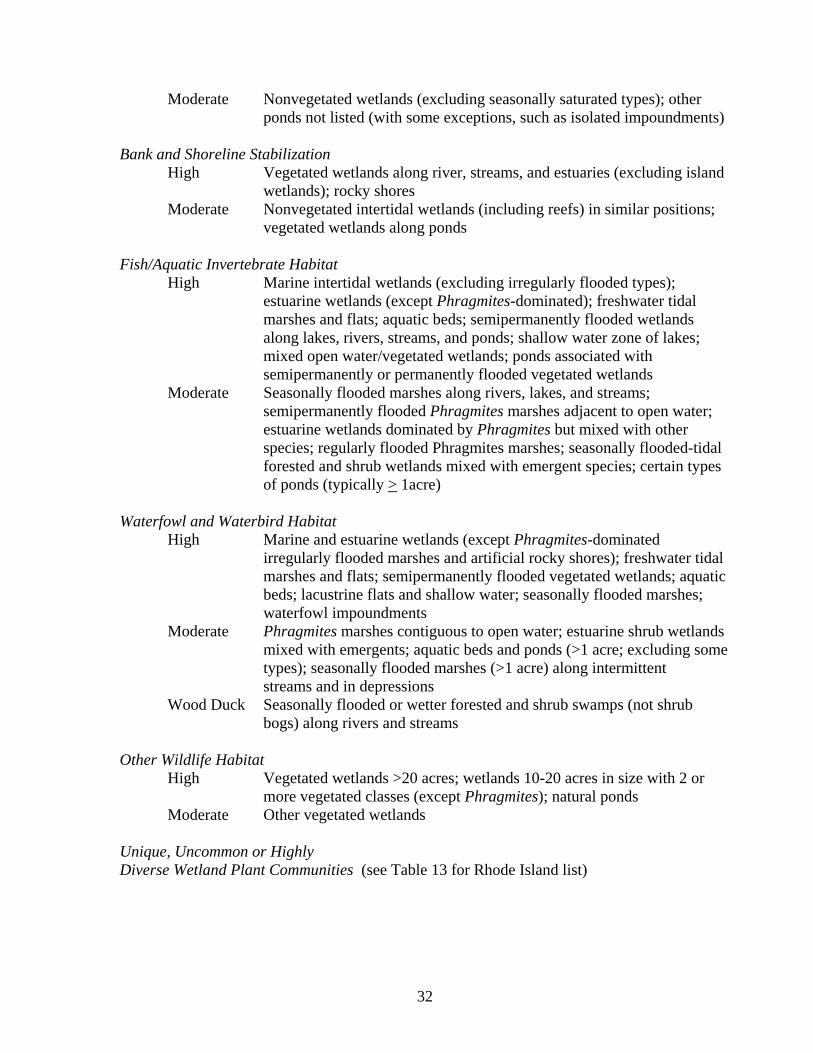
32
Moderate Nonvegetated wetlands (excluding seasonally saturated types); other ponds not listed (with some exceptions, such as isolated impoundments) Bank and Shoreline Stabilization High Vegetated wetlands along river, streams, and estuaries (excluding island wetlands); rocky shores Moderate Nonvegetated intertidal wetlands (including reefs) in similar positions; vegetated wetlands along ponds Fish/Aquatic Invertebrate Habitat High Marine intertidal wetlands (excluding irregularly flooded types); estuarine wetlands (except Phragmites-dominated); freshwater tidal marshes and flats; aquatic beds; semipermanently flooded wetlands along lakes, rivers, streams, and ponds; shallow water zone of lakes; mixed open water/vegetated wetlands; ponds associated with semipermanently or permanently flooded vegetated wetlands Moderate Seasonally flooded marshes along rivers, lakes, and streams; semipermanently flooded Phragmites marshes adjacent to open water; estuarine wetlands dominated by Phragmites but mixed with other species; regularly flooded Phragmites marshes; seasonally flooded-tidal forested and shrub wetlands mixed with emergent species; certain types of ponds (typically > 1acre) Waterfowl and Waterbird Habitat High Marine and estuarine wetlands (except Phragmites-dominated irregularly flooded marshes and artificial rocky shores); freshwater tidal marshes and flats; semipermanently flooded vegetated wetlands; aquatic beds; lacustrine flats and shallow water; seasonally flooded marshes; waterfowl impoundments Moderate Phragmites marshes contiguous to open water; estuarine shrub wetlands mixed with emergents; aquatic beds and ponds (>1 acre; excluding some types); seasonally flooded marshes (>1 acre) along intermittent streams and in depressions Wood Duck Seasonally flooded or wetter forested and shrub swamps (not shrub bogs) along rivers and streams Other Wildlife Habitat High Vegetated wetlands >20 acres; wetlands 10-20 acres in size with 2 or more vegetated classes (except Phragmites); natural ponds Moderate Other vegetated wetlands Unique, Uncommon or Highly Diverse Wetland Plant Communities (see Table 13 for Rhode Island list)
33
Table 13. Wetlands of potential significance for various functions in Rhode Island. Note: Any difference in sums is due to round-off procedures. % of All Function (code) Significance Acreage Wetlands Surface Water Detention High 36,716 51.2 (SWD) Moderate 24,077 33.6 Total 60,793 84.8 Coastal Storm Surge Detention High 8,310 11.6 (CSS) Moderate 541 0.8 Total 8,851 12.4 Streamflow Maintenance High 25,577 35.7 (SM) Moderate 17,224 24.0 Total 42,801 59.7 Nutrient Transformation High 57,586 80.3 (NT) Moderate 4,655 6.5 Total 62,241 86.8 Sediment and Other Particulate Retention (SR) High 40,720 56.8 Moderate 21,663 30.2 Total 62,383 87.0 Carbon Sequestration High 57,634 80.4 (CAR) Moderate 7,715 10.8 Total 65,349 91.2 Bank and Shoreline Stabilization High 41,707 58.2 (BSS) Moderate 17,702 24.7 Total 59,409 82.9 Fish and Aquatic Invertebrate Habitat (FAIH) High 6,639 9.3 Moderate 1,365 1.9 (Subtotal) (8,004) (11.2) Shading 17,891 24.9 Total 25,895 36.1
34
Table 13 (cont’d). % of All Function Significance Acreage Wetlands Waterfowl and Waterbird Habitat High 9,655 13.5 (WBIRD) Moderate 1,789 2.5 Wood Duck 28,637 39.9 Total 40,081 55.9 Other Wildlife Habitat High 46,681 65.1 (OWH) Moderate 16,144 22.5 Total 62,825 87.6 Unique, Uncommon or Highly Diverse Plant Communities* (UWPC) Regionally Significant
Low Salt/Brackish Marsh 77 Oligohaline Marsh 70 Tidal Fresh Marsh 5 Tidal Fresh Wooded Swamp 15 Semipermanently Flooded Marsh 187 Semipermanently Flooded Forested Wetland 38 Semipermanently Flooded Shrub Swamp 19 Atlantic White Cedar Swamp** 1,193 Subtotal 1,604 Locally Significant Acidic Wetland (bog - “a”) 94 Mixed Deciduous/Cedar Swamp** 716 Cedar Swamp affected by impoundment 651 Lentic Fringe Wetland 173 Subtotal 1,634 Total 3,238 4.5 *This listing is based on wetland classifications and is therefore very conservative; contact the Rhode Island Natural History Survey for more information. **May include some other evergreen forested wetlands (e.g., hemlock swamps).

35
Figure 13. Percent of state’s wetlands predicted to perform various functions at significant levels. See Table 13 for function codes. Note: Findings for “UWPC” are very conservative.
*UWPC – red color relates to regionally significant types and yellow to locally significant.
36
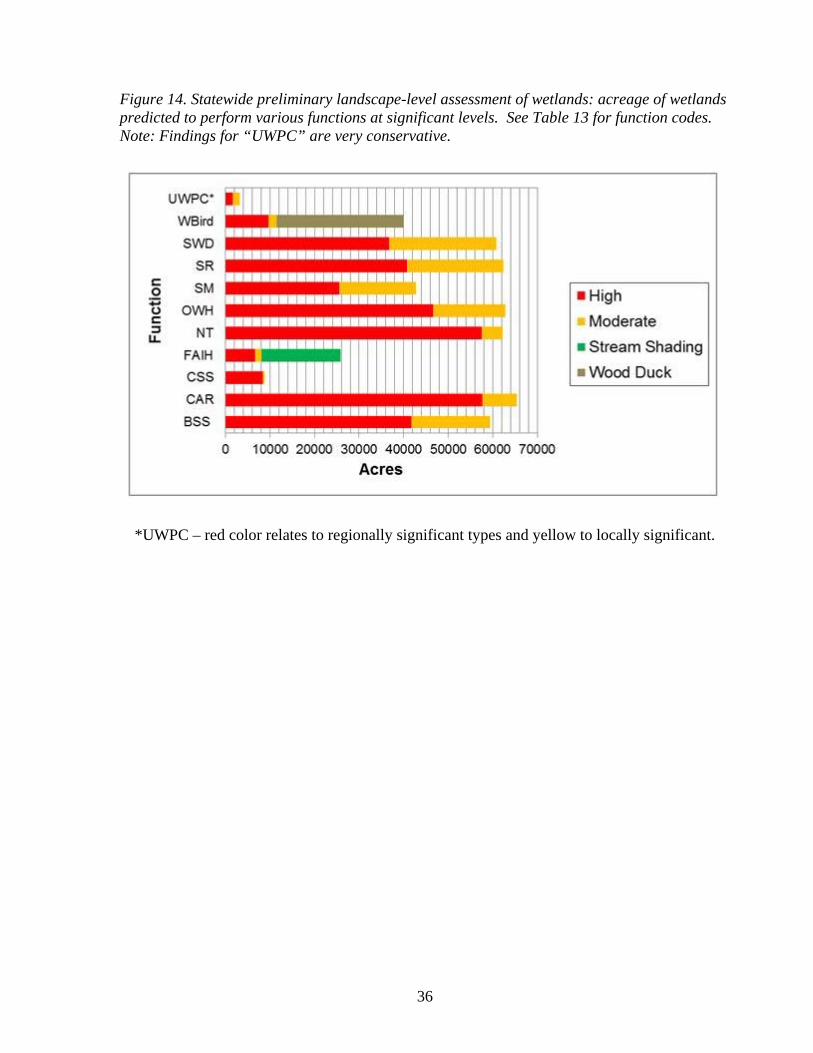
Figure 14. Statewide preliminary landscape-level assessment of wetlands: acreage of wetlands predicted to perform various functions at significant levels. See Table 13 for function codes. Note: Findings for “UWPC” are very conservative.
*UWPC – red color relates to regionally significant types and yellow to locally significant.

37
Figure 15. Example of the outputs from the NWI+ Web Mapper showing wetlands predicted to be significant for provision of waterfowl and waterbird habitat (top) and coastal storm surge detention (bottom).
38
DISCUSSION Comparison with Previous NWI Results In the 1980s the U.S. Fish and Wildlife Service completed its first comprehensive inventory of Rhode Island’s wetlands with the findings presented in a state wetland report – “Wetlands of Rhode Island” (Tiner 1989). In addition to the inventory methods and results, the report describes wetland formation and hydrology, hydric soils and their statewide extent based on U.S. Department of Agriculture soil surveys, the variety of wetlands found across the state and their plant composition, wetland values, and wetland protection. Using 1:80,000 black and white aerial photographs from the mid-1970s that inventory located and mapped a total of 65,154 acres of wetlands and 106,257 acres of deepwater habitats excluding marine waters (Table 14). The expected minimum mapping unit for that survey was 3-5 acres, so wetlands below this size were typically not identified. The current survey (2010) used higher resolution digital imagery and was able to map wetlands down to about 0.5 acre in size. It was therefore not surprising that the current inventory reports more wetland acreage than the prior survey, especially since state and federal wetland regulations were actively restricting wetland conversion since the 1980s (Table 14). Functional Assessment While this report and the online maps provide a statewide perspective on wetland functions, there are other valuable sources of information to consult when doing environmental planning or site reviews. For example, using the NWI+ database, a large group of wetlands were predicted to provide significant habitat for fish and wildlife as well as smaller group predicted to provide habitat for what have been called “rare, uncommon, or highly diverse plant communities.” Clearly this statewide assessment is limited in scope and a field-based assessment would provide for a more in-depth analysis. The Rhode Island Division of Fish and Wildlife (including the Natural Heritage Program) and others like the Rhode Island Natural History Survey and The Nature Conservancy should have this type of information. Using data from the Rhode Island Department of Environmental Management, the Environmental Data Center at the University of Rhode Island has produced town and watershed maps showing areas important for maintaining the state’s biodiversity which should be useful information to assess priorities for acquisition (Figures 16 and 17). Wetlands in designated critical habitat areas should receive special attention.

39
Table 14. Comparison of wetland and deepwater habitat acreage (excluding marine waters) for Rhode Island from the mid-1970s inventory (Tiner 1989) and the 2010 inventory (this report). The difference largely reflects different methods because the current inventory was far more comprehensive. Note of caution: Wetland change cannot be computed from this type of comparison. For determining wetland trends, image to image analysis is required and that was beyond the scope of the current inventory. Habitat Mid-1970s Acreage 2010 Acreage Marine wetlands Unconsolidated Shore 592 717 Rocky Shore 339 215 Aquatic Bed 0 1 Total 931 933 Estuarine wetlands Unconsolidated Shore 3,476 3,419 Rocky Shore 22 62 Reef 0 3 Aquatic Bed 0 23 Emergent 3,468 3,694 Scrub-Shrub 52 82 Total 7,018 7,283 Palustrine wetlands Unconsolidated Bottom 2,435 4,827* Aquatic Bed 74 37 Emergent 1,679 3,024 Scrub-Shrub 5,302 6,007 Forested (FO5 = 145) 47,532 49,392 Farmed (Cranberry) 84 120 Total 57,106 63,407 Lacustrine Wetlands 99 88 TOTAL WETLANDS 65,154 71,711 Estuarine Deepwater 86,909 88,540 Riverine Deepwater 526 1,021 Lacustrine Deepwater 18,822 19,030 TOTAL DEEPWATER 106,257 108,591 ---------------------------------------------------------------------------------------------- *Includes 23 acres of unconsolidated shore.

40
Figure 16. Biodiversity map for Glocester, Rhode Island. (Source: RIDEM)

41
Figure 17. Biodiversity map of the Pawtuxet River watershed. (Source: RIDEM)

42
ACKNOWLEDGMENTS
The basic interpretation of the 2004 imagery was performed by Herb Bergquist (FWS, Region 5) and quality controlled by John Swords (FWS, Region 5). This dataset was updated through a rapid review process examining the 2004 wetland data on 2010 imagery. This work was done by staff at Virginia Tech’s Conservation Management Institute (CMI) under the direction of Kevin McGuckin. Pamela Swint performed the interpretation for the rapid update, while geodata processing and analysis was performed by Jason Herman. Ralph Tiner (FWS, Region 5) served as project coordinator and reviewed the final data. Peer review of the draft report was accomplished by Dr. Bill Wilen and Jo Ann Mills (FWS, Headquarters), Dr. Nancy Karraker (University of Rhode Island), Hank Ellis and Daniel Kowal (RI Department of Environmental Management), Michelle Peach (RI Natural History Survey), Dave Reis (RI Coastal Resources Management Council), and Erica Sachs (U.S. Environmental Protection Agency). Thanks also go to Michael Narcisi (U.S. Army Corps of Engineers) and Jon Mitchell (Pine Point School) for use of their photographs.
Rhode Island freshwater marsh. (Michael Narcisi photo)
43
REFERENCES Azzolina, N.A., D.I., Siegel, J.C. Brower, S.D. Samson, M.H. Otz, and I. Otz. 2007. Can the HGM classification of small, non-peat forming wetlands distinguish wetlands from surface water geochemistry? Wetlands 27: 884-893. Brinson, M. M. 1993a. A Hydrogeomorphic Classification for Wetlands. U.S. Army Corps of Engineers, Washington, DC. Wetlands Research Program, Technical Report WRP-DE-4. Brooks, R. P., D. H. Wardrop, and J. A. Bishop. 2004. Assessing wetland condition on a watershed basis in the Mid-Atlantic region using synoptic land cover maps. Environmental Monitoring and Assessment 94:9-22. Cowardin, L.M., V. Carter, F.C. Golet, and E.T. LaRoe. 1979. Classification of Wetlands and Deepwater Habitats of the United States. U.S. Fish and Wildlife Service, Washington, DC. FWS/OBS-79/31. http://library.fws.gov/FWS-OBS/79_31.pdf Mitsch, W.J. and J.G. Gosselink. 2007. Wetlands. Fourth edition. John Wiley & Sons, Inc., New York, NY. Tiner, R.W. 2013. Tidal Wetland Primer: An Introduction to Their Ecology, Natural History, Status, and Conservation. The University of Massachusetts Press, Amherst, MA. Tiner, R.W. 2011a. Dichotomous Keys and Mapping Codes for Wetland Landscape Position, Landform, Water Flow Path, and Waterbody Type Descriptors: Version 2.0. U.S. Fish and Wildlife Service, National Wetlands Inventory Program, Northeast Region, Hadley, MA. http://digitalmedia.fws.gov/cdm/ref/collection/document/id/1324 Tiner, R.W. 2011b. Predicting Wetland Functions at the Landscape Level for Coastal Georgia Using NWIPlus Data. U.S. Fish and Wildlife Service, National Wetlands Inventory Program, Region 5, Hadley, MA. In cooperation with the Georgia Department of Natural Resources, Coastal Resources Division, Brunswick, GA and Atkins North America, Raleigh, NC. http://digitalmedia.fws.gov/cdm/ref/collection/document/id/1363 Tiner, R.W. 2010. NWIPlus: Geospatial database for watershed-level functional assessment. National Wetlands Newsletter 32(3): 4-7, 23. http://www.fws.gov/northeast/wetlands/Publications%20PDFs%20as%20of%20March_2008/Mapping/NWIPlus_NWN.pdf Tiner, R.W. (editor). 2009. Status Report for the National Wetlands Inventory Program: 2009. U.S. Fish and Wildlife Service, Division of Habitat and Resource Conservation, Branch of Resource and Mapping Support, Arlington, VA. http://www.fws.gov/northeast/wetlands/pdf/StatusReportNWIProgram2009.pdf
44
Tiner, R.W. 2005a. In Search of Swampland: A Wetland Sourcebook and Field Guide. Revised 2nd Edition. Rutgers University Press, New Brunswick, NJ. Tiner, R.W. 2005b. Assessing cumulative loss of wetland functions in the Nanticoke River watershed using enhanced National Wetlands Inventory data. Wetlands 25(2): 405-419. Tiner, R.W. 2003. Correlating Enhanced National Wetlands Inventory Data with Wetland Functions for Watershed Assessments: A Rationale for Northeastern U.S. Wetlands. U.S. Fish and Wildlife Service, National Wetlands Inventory Program, Region 5, Hadley, MA. http://www.fws.gov/northeast/wetlands/pdf/CorrelatingEnhancedNWIDataWetlandFunctionsWatershedAssessments[1].pdf Tiner, R.W. 1999. Wetland Indicators: A Guide to Wetland Identification, Delineation, Classification, and Mapping. Lewis Publishers, CRC Press, Boca Raton, FL. Tiner, R.W. 1990. Use of high-altitude aerial photography for inventorying forested wetlands in the United States. Forest Ecology and Management 33/34: 593-604. Tiner, R.W. 1989. Wetlands of Rhode Island. U.S. Fish and Wildlife Service, National Wetlands Inventory, Newton Corner, MA. http://digitalmedia.fws.gov/cdm/ref/collection/document/id/1365 U.S. Fish and Wildlife Service. 2003. Gulf of Maine Watershed Habitat Analysis. Version 3.1. Gulf of Maine Coastal Program Office, Falmouth, MA. (http://gulfofmaine.fws.gov)

45
APPENDICES
46
APPENDIX A: Correlation table showing wetlands of significance for each of eleven functions Note: For a key to the codes that appear on the following list, see “Dichotomous Keys and Mapping Codes for Wetland Landscape Position, Landform, Water Flow Path, and Waterbody Type Descriptors: Version 2.0.” (Tiner 2011) http://digitalmedia.fws.gov/cdm/ref/collection/document/id/1324)
47
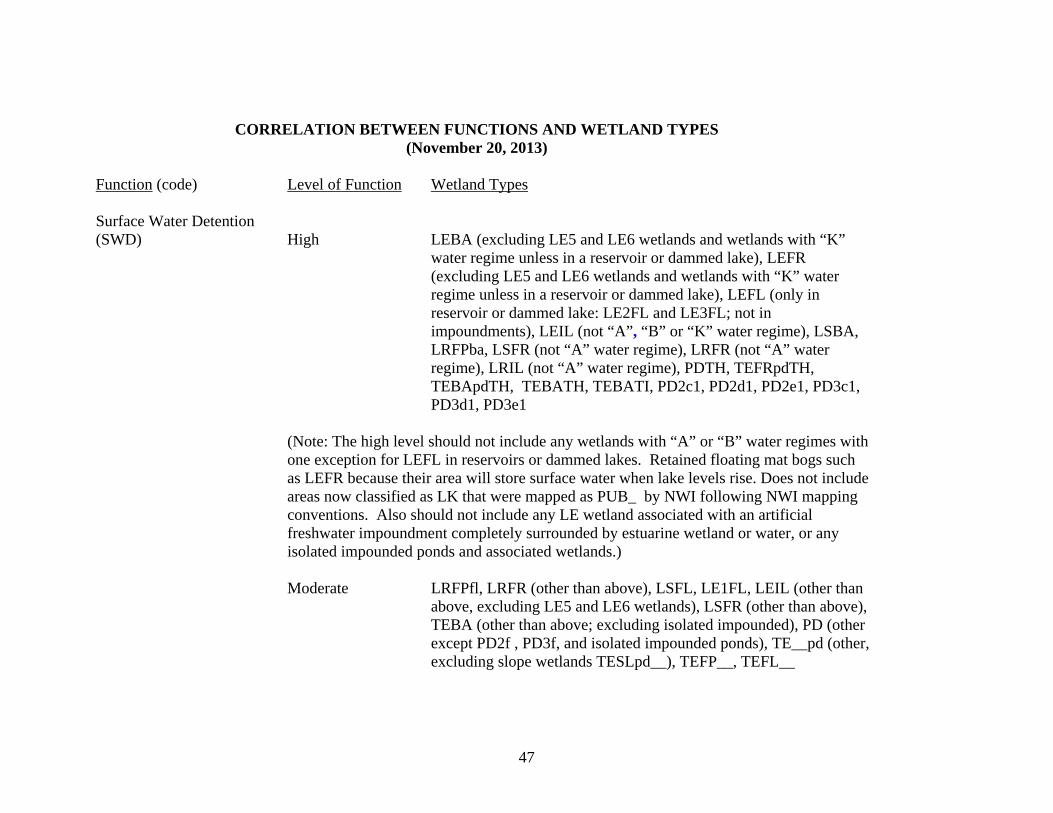
CORRELATION BETWEEN FUNCTIONS AND WETLAND TYPES (November 20, 2013)
Function (code) Level of Function Wetland Types
Surface Water Detention (SWD) High LEBA (excluding LE5 and LE6 wetlands and wetlands with “K”
water regime unless in a reservoir or dammed lake), LEFR (excluding LE5 and LE6 wetlands and wetlands with “K” water regime unless in a reservoir or dammed lake), LEFL (only in reservoir or dammed lake: LE2FL and LE3FL; not in impoundments), LEIL (not “A”, “B” or “K” water regime), LSBA, LRFPba, LSFR (not “A” water regime), LRFR (not “A” water regime), LRIL (not “A” water regime), PDTH, TEFRpdTH, TEBApdTH, TEBATH, TEBATI, PD2c1, PD2d1, PD2e1, PD3c1, PD3d1, PD3e1
(Note: The high level should not include any wetlands with “A” or “B” water regimes with one exception for LEFL in reservoirs or dammed lakes. Retained floating mat bogs such as LEFR because their area will store surface water when lake levels rise. Does not include areas now classified as LK that were mapped as PUB_ by NWI following NWI mapping conventions. Also should not include any LE wetland associated with an artificial freshwater impoundment completely surrounded by estuarine wetland or water, or any isolated impounded ponds and associated wetlands.)
Moderate LRFPfl, LRFR (other than above), LSFL, LE1FL, LEIL (other than above, excluding LE5 and LE6 wetlands), LSFR (other than above), TEBA (other than above; excluding isolated impounded), PD (other except PD2f , PD3f, and isolated impounded ponds), TE__pd (other, excluding slope wetlands TESLpd__), TEFP__, TEFL__
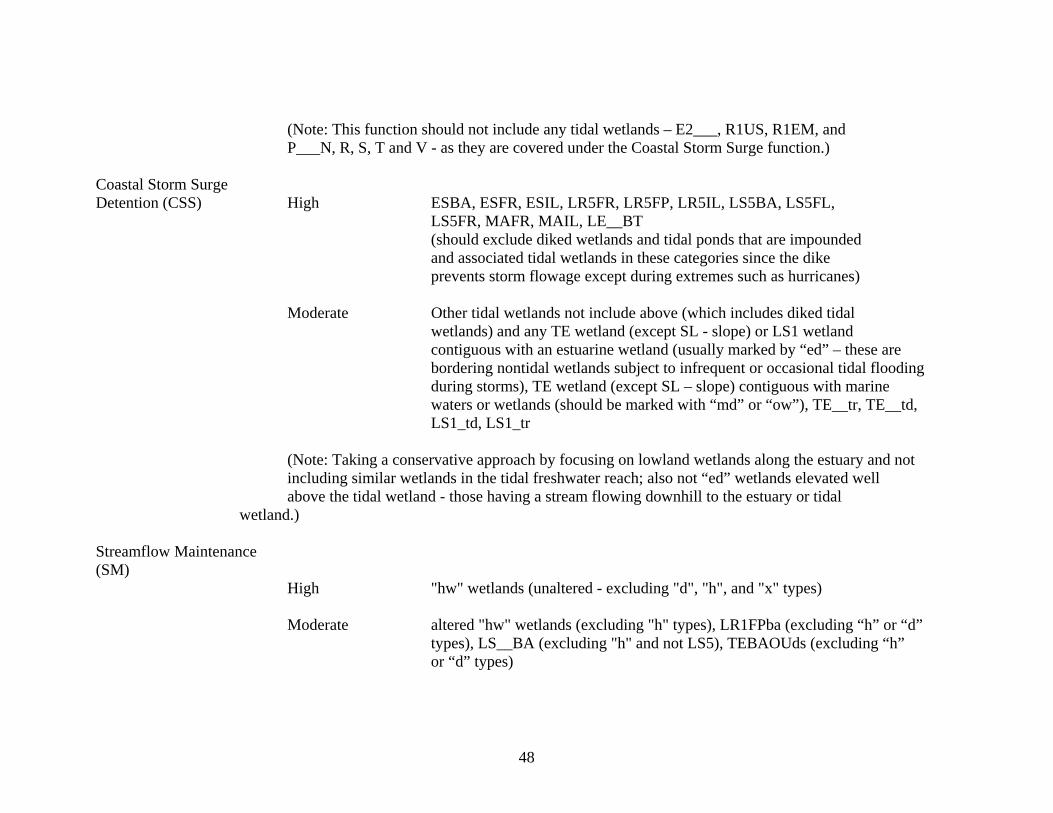
48
(Note: This function should not include any tidal wetlands – E2___, R1US, R1EM, and P___N, R, S, T and V - as they are covered under the Coastal Storm Surge function.)
Coastal Storm Surge Detention (CSS) High ESBA, ESFR, ESIL, LR5FR, LR5FP, LR5IL, LS5BA, LS5FL, LS5FR, MAFR, MAIL, LE__BT (should exclude diked wetlands and tidal ponds that are impounded
and associated tidal wetlands in these categories since the dike prevents storm flowage except during extremes such as hurricanes)
Moderate Other tidal wetlands not include above (which includes diked tidal wetlands) and any TE wetland (except SL - slope) or LS1 wetland contiguous with an estuarine wetland (usually marked by “ed” – these are bordering nontidal wetlands subject to infrequent or occasional tidal flooding during storms), TE wetland (except SL – slope) contiguous with marine waters or wetlands (should be marked with “md” or “ow”), TE__tr, TE__td, LS1_td, LS1_tr (Note: Taking a conservative approach by focusing on lowland wetlands along the estuary and not including similar wetlands in the tidal freshwater reach; also not “ed” wetlands elevated well above the tidal wetland - those having a stream flowing downhill to the estuary or tidal wetland.) Streamflow Maintenance (SM) High "hw" wetlands (unaltered - excluding "d", "h", and "x" types) Moderate altered "hw" wetlands (excluding "h" types), LR1FPba (excluding “h” or “d” types), LS__BA (excluding "h" and not LS5), TEBAOUds (excluding “h” or “d” types)

49
(Note: While acreage of headwater wetlands may increase due to building ponds in headwater seeps (point features not polygons) and blocking drainageways, these wetlands do not increase streamflow and are not included in this function. However, when headwater vegetated wetlands are excavated to create ponds, the streamflow maintenance function is lowered from high (natural headwater wetland) to moderate as the wetland still provides for flow at high water periods and some flow at other times as well.)
Nutrient Transformation (NT) High P__(AB, EM, SS, FO and mixes)C, P__(AB, EM, SS, FO and
mixes)E, P__(AB, EM, SS, FO and mixes including __/UB and UB/__, etc.)F, P__(AB, EM, SS, FO and mixes)R, P__(AB, EM, SS, FO and mixes)T, P__(AB, EM, SS, FO and mixes)N, P__(AB, EM, SS, FO and mixes)H, P__(AB, EM, SS, FO and mixes)L or V, E2AB, E2EM (and mixes), E2SS (and mixes), E2FO (and mixes), E2RF, M2AB, P__(AB, EM, SS, FO and mixes)Bt (fen) , L2_(AB, EM and mixes)C, L2_(AB, EM, and mixes)E, L2_(AB, EM, and mixes)F, L2_(AB, EM, and mixes)H, L2_(AB,EM, and mixes)N, L2_(AB,EM, and mixes)R, L2_(AB,EM, and mixes)T, L2_(AB, EM, and mixes)V
GA coast – Include PFO3B, PSS3B and mixes of the two since they
are permanently saturated; but not mixes with other types of “B” wetlands (FO1, FO4, EM, etc.).
(Note: In relevant regions, try to separate fens from bogs as the former are nutrient-rich sites while the latter are nutrient-poor sites: use circumneutral modifier “t” to identify fens EM1_t,
SS__t, FO__t from bogs PSS__Ba, PFO__Ba, for example. Exclude PFO5 and PSS5 from high.)
Moderate P__(AB, EM, SS, FO and mixes)B (not “t” fen), P__(AB, EM, SS, FO)A, P__(AB, EM, SS, FO and mixes)S, L2EM_A, PUS/__(mixed with vegetation classes excluding FO5 and SS5), PUB/__(mixed with vegetation classes)H, L2EM_S, PFO5/other vegetated, PSS5/other vegetated
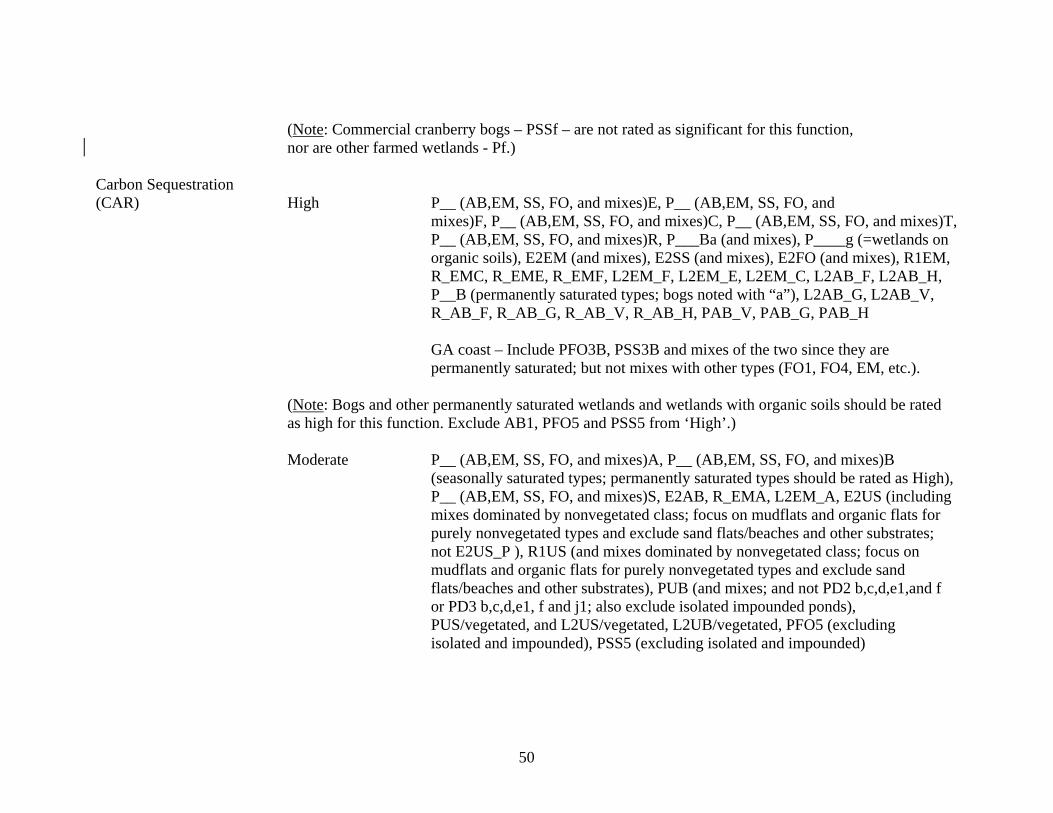
50
(Note: Commercial cranberry bogs – PSSf – are not rated as significant for this function, nor are other farmed wetlands - Pf.) Carbon Sequestration (CAR) High P__ (AB,EM, SS, FO, and mixes)E, P__ (AB,EM, SS, FO, and mixes)F, P__ (AB,EM, SS, FO, and mixes)C, P__ (AB,EM, SS, FO, and mixes)T,
P__ (AB,EM, SS, FO, and mixes)R, P___Ba (and mixes), P____g (=wetlands on organic soils), E2EM (and mixes), E2SS (and mixes), E2FO (and mixes), R1EM, R_EMC, R_EME, R_EMF, L2EM_F, L2EM_E, L2EM_C, L2AB_F, L2AB_H, P__B (permanently saturated types; bogs noted with “a”), L2AB_G, L2AB_V, R_AB_F, R_AB_G, R_AB_V, R_AB_H, PAB_V, PAB_G, PAB_H
GA coast – Include PFO3B, PSS3B and mixes of the two since they are permanently saturated; but not mixes with other types (FO1, FO4, EM, etc.). (Note: Bogs and other permanently saturated wetlands and wetlands with organic soils should be rated as high for this function. Exclude AB1, PFO5 and PSS5 from ‘High’.)
Moderate P__ (AB,EM, SS, FO, and mixes)A, P__ (AB,EM, SS, FO, and mixes)B (seasonally saturated types; permanently saturated types should be rated as High),
P__ (AB,EM, SS, FO, and mixes)S, E2AB, R_EMA, L2EM_A, E2US (including mixes dominated by nonvegetated class; focus on mudflats and organic flats for purely nonvegetated types and exclude sand flats/beaches and other substrates; not E2US_P ), R1US (and mixes dominated by nonvegetated class; focus on mudflats and organic flats for purely nonvegetated types and exclude sand flats/beaches and other substrates), PUB (and mixes; and not PD2 b,c,d,e1,and f or PD3 b,c,d,e1, f and j1; also exclude isolated impounded ponds), PUS/vegetated, and L2US/vegetated, L2UB/vegetated, PFO5 (excluding isolated and impounded), PSS5 (excluding isolated and impounded)

51
(Note: Mixes for vegetated wetlands are those where vegetation is the dominant class, while mixes for nonvegetated wetlands are those where the substrate is the dominant class. Commercial cranberry bogs – PSSf – and other farmed wetlands P__f are not included; also “mixes” should include nonvegetated wetlands where vegetated types predominate and vegetated wetlands where nonvegetated types predominate. If mapping includes any H, G or V wetlands that are vegetated by vascular plants other than aquatic bed species – not dead trees, they too should be rated as high for this function. Also exclude M2AB1__ and E2AB1__ as these types are typically associated with rocky shores as mapped. )
Sediment and Other Particulate Retention (SR) High ES__(vegetated and mixes), LEBA, LEFR (vegetated and mixes,
not “fm”-floating mat), LEIL(veg and mixes, not “fm”), M2AB3__, LSBA, LRBA, LSFP, LRFP, LRFR (veg, not “fm”), LSFR(veg, not “fm”), LRIL (veg, not “fm”), PDTH, TE__pdTH (including __pq), PDBT, TE__pdBT, TEBATH, TEBATI, TEIFbaTH, TEIFbaTI, TEFRpdTH, PD2c1, PD2d1, PD2e1, PD3c1, PD3d1, PD3e1
Moderate E2__(US, SB, RF, excluding RS), LEFR (nonveg), LEFL (veg), LSFL (not
P___B_), LRIL (nonveg), LRFR (nonveg), LSFR (nonveg), M2US, M2RF, Other TEBA (not P__B_), PD1, PD2 and PD3 (not c, d, e, f, g, j types), PD4, TEFLpd (not P__B_ ), TEFP__ (not P_B_), TEFL__ (P__A, not P__B_), TE__pdOU, TE__pdIN, Other TEFRpd__
(Note: No “B” wetlands should be identified as significant for this function; only flooded types: A, C, E, F, H, R, S, T, R, N, M, and L should be rated. This will exclude bogs.)
Bank and Shoreline Stabilization (BSS) High E2__(AB, EM, SS, FO and mixes; not IL), E2RS (not ESIL),
E2US_P (not ESIL), M2RS(not MAIL), M2AB1N (not IL), LR_(AB, EM, SS, FO and mixes; not LRIL and not “fm”), LS_(AB, EM, SS, FO and mixes and not “fm” ”), LE__(AB, EM, SS, FO and mixes; not LEIL and not “fm” ”), R_RS, L2RS

52
Moderate E2US_N or M (not IL), M2US (not IL), TE__pd (AB, EM, SS, FO and mixes), TE__OUhw (AB, EM, SS, FO and mixes), E2RF (when occur along a shoreline), M2RF (when occur along a shoreline), TE__OIhw (Note: Exclude IL wetlands from this function since they are not shoreline features.) Fish and Aquatic Invertebrate Habitat (FAIH)
High E2EM (including mixes with other types where EM1 or EM2 predominates; excluding E2EM5P__ and mixes where EM5 predominates and mixed communities dominated by E2FO or E2SS), E2US_M, E2US_N, E2RF, E2AB, E2RS/AB, L2_F, L2_H or G, L2AB, L2UB/__(AB, EM, SS, FO), LE__ (vegetated; AB, EM, SS, FO) and NWI water regime = H (permanently flooded), M2AB, M2RS/AB, M2US_M, M2US_N, M2RF; P__F and adjacent to PD (PD1, PD2 a3,b,and h, PD3b and h, and PD4 only), LK, RV (all except LR4), or ST (all except LS4) waters; P__F and __FRsl or __BAsl (slough), PAB (not excavated or impounded), PUB/__(AB, EM, SS, FO), P__(EM, SS, FO)H, PEM__(N,R,T, or L, except EM5), PSS_T, PFO_T, PD (PD1, PD2 a3,b,and h, PD3b and h , and PD4 only) associated with P__(AB, EM, SS, FO)F, R1EM, R1AB, R1US(except S), R2AB, R2EM, PD (PD1, PD2a3, 2b, 2h, PD3b, and 3h, and PD4) associated with P__(AB, EM, SS, FO)H
(Note: M1AB3L = submerged eelgrass – important habitat but is not wetland so it is not included above; reports will note this. L2__K wetlands were not rated due to unknown management.)
Moderate LE__ and PEM1E (and mixes and contiguous with waterbody),
LR__ and PEM1E (and mixes and contiguous with waterbody), LS__ and PEM1E (and mixes and contiguous with waterbody), PEM5F and adjacent to LK, RV (except LR4), or ST(except LS4)
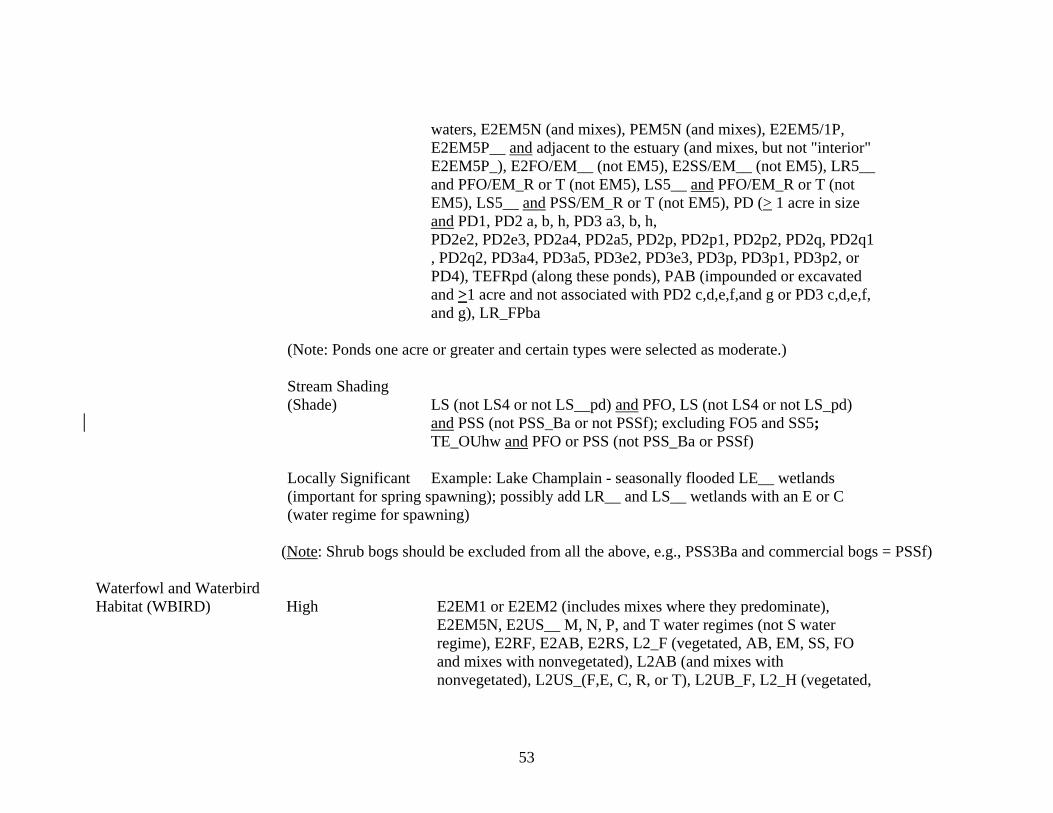
53
waters, E2EM5N (and mixes), PEM5N (and mixes), E2EM5/1P, E2EM5P__ and adjacent to the estuary (and mixes, but not "interior" E2EM5P_), E2FO/EM__ (not EM5), E2SS/EM__ (not EM5), LR5__ and PFO/EM_R or T (not EM5), LS5__ and PFO/EM_R or T (not EM5), LS5__ and PSS/EM_R or T (not EM5), PD (> 1 acre in size and PD1, PD2 a, b, h, PD3 a3, b, h, PD2e2, PD2e3, PD2a4, PD2a5, PD2p, PD2p1, PD2p2, PD2q, PD2q1, PD2q2, PD3a4, PD3a5, PD3e2, PD3e3, PD3p, PD3p1, PD3p2, or PD4), TEFRpd (along these ponds), PAB (impounded or excavated and >1 acre and not associated with PD2 c,d,e,f,and g or PD3 c,d,e,f, and g), LR_FPba
(Note: Ponds one acre or greater and certain types were selected as moderate.)
Stream Shading (Shade) LS (not LS4 or not LS__pd) and PFO, LS (not LS4 or not LS_pd)
and PSS (not PSS_Ba or not PSSf); excluding FO5 and SS5; TE_OUhw and PFO or PSS (not PSS_Ba or PSSf)
Locally Significant Example: Lake Champlain - seasonally flooded LE__ wetlands
(important for spring spawning); possibly add LR__ and LS__ wetlands with an E or C (water regime for spawning)
(Note: Shrub bogs should be excluded from all the above, e.g., PSS3Ba and commercial bogs = PSSf) Waterfowl and Waterbird Habitat (WBIRD) High E2EM1 or E2EM2 (includes mixes where they predominate),
E2EM5N, E2US__ M, N, P, and T water regimes (not S water regime), E2RF, E2AB, E2RS, L2_F (vegetated, AB, EM, SS, FO and mixes with nonvegetated), L2AB (and mixes with nonvegetated), L2US_(F,E, C, R, or T), L2UB_F, L2_H (vegetated,
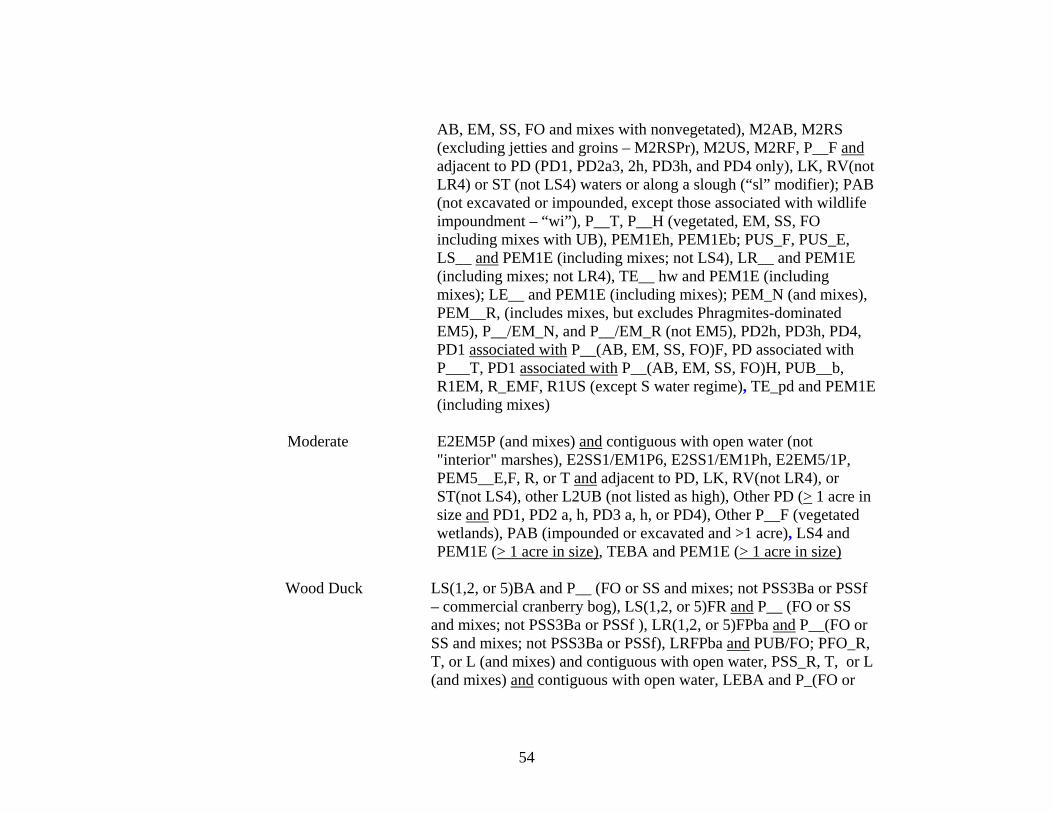
54
AB, EM, SS, FO and mixes with nonvegetated), M2AB, M2RS (excluding jetties and groins – M2RSPr), M2US, M2RF, P__F and adjacent to PD (PD1, PD2a3, 2h, PD3h, and PD4 only), LK, RV(not LR4) or ST (not LS4) waters or along a slough (“sl” modifier); PAB (not excavated or impounded, except those associated with wildlife impoundment – “wi”), P__T, P__H (vegetated, EM, SS, FO including mixes with UB), PEM1Eh, PEM1Eb; PUS_F, PUS_E, LS__ and PEM1E (including mixes; not LS4), LR__ and PEM1E (including mixes; not LR4), TE__ hw and PEM1E (including mixes); LE__ and PEM1E (including mixes); PEM_N (and mixes), PEM__R, (includes mixes, but excludes Phragmites-dominated EM5), P__/EM_N, and P__/EM_R (not EM5), PD2h, PD3h, PD4, PD1 associated with P__(AB, EM, SS, FO)F, PD associated with P___T, PD1 associated with P__(AB, EM, SS, FO)H, PUB__b, R1EM, R_EMF, R1US (except S water regime), TE_pd and PEM1E (including mixes)
Moderate E2EM5P (and mixes) and contiguous with open water (not
"interior" marshes), E2SS1/EM1P6, E2SS1/EM1Ph, E2EM5/1P, PEM5__E,F, R, or T and adjacent to PD, LK, RV(not LR4), or ST(not LS4), other L2UB (not listed as high), Other PD (> 1 acre in size and PD1, PD2 a, h, PD3 a, h, or PD4), Other P__F (vegetated wetlands), PAB (impounded or excavated and >1 acre), LS4 and PEM1E (> 1 acre in size), TEBA and PEM1E (> 1 acre in size)
Wood Duck LS(1,2, or 5)BA and P__ (FO or SS and mixes; not PSS3Ba or PSSf
– commercial cranberry bog), LS(1,2, or 5)FR and P__ (FO or SS and mixes; not PSS3Ba or PSSf ), LR(1,2, or 5)FPba and P__(FO or SS and mixes; not PSS3Ba or PSSf), LRFPba and PUB/FO; PFO_R, T, or L (and mixes) and contiguous with open water, PSS_R, T, or L (and mixes) and contiguous with open water, LEBA and P_(FO or
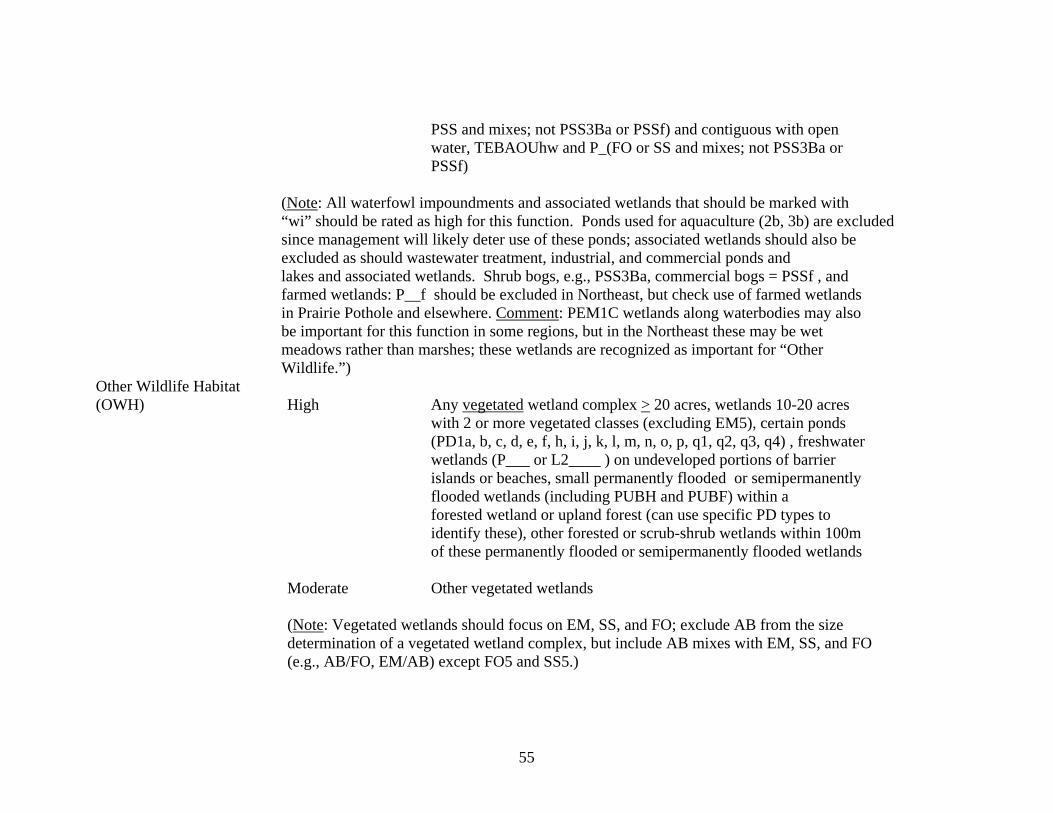
55
PSS and mixes; not PSS3Ba or PSSf) and contiguous with open water, TEBAOUhw and P_(FO or SS and mixes; not PSS3Ba or PSSf)
(Note: All waterfowl impoundments and associated wetlands that should be marked with “wi” should be rated as high for this function. Ponds used for aquaculture (2b, 3b) are excluded since management will likely deter use of these ponds; associated wetlands should also be excluded as should wastewater treatment, industrial, and commercial ponds and lakes and associated wetlands. Shrub bogs, e.g., PSS3Ba, commercial bogs = PSSf , and farmed wetlands: P__f should be excluded in Northeast, but check use of farmed wetlands in Prairie Pothole and elsewhere. Comment: PEM1C wetlands along waterbodies may also be important for this function in some regions, but in the Northeast these may be wet meadows rather than marshes; these wetlands are recognized as important for “Other Wildlife.”)
Other Wildlife Habitat (OWH) High Any vegetated wetland complex > 20 acres, wetlands 10-20 acres
with 2 or more vegetated classes (excluding EM5), certain ponds (PD1a, b, c, d, e, f, h, i, j, k, l, m, n, o, p, q1, q2, q3, q4) , freshwater wetlands (P___ or L2____ ) on undeveloped portions of barrier islands or beaches, small permanently flooded or semipermanently flooded wetlands (including PUBH and PUBF) within a forested wetland or upland forest (can use specific PD types to identify these), other forested or scrub-shrub wetlands within 100m of these permanently flooded or semipermanently flooded wetlands Moderate Other vegetated wetlands (Note: Vegetated wetlands should focus on EM, SS, and FO; exclude AB from the size determination of a vegetated wetland complex, but include AB mixes with EM, SS, and FO (e.g., AB/FO, EM/AB) except FO5 and SS5.)
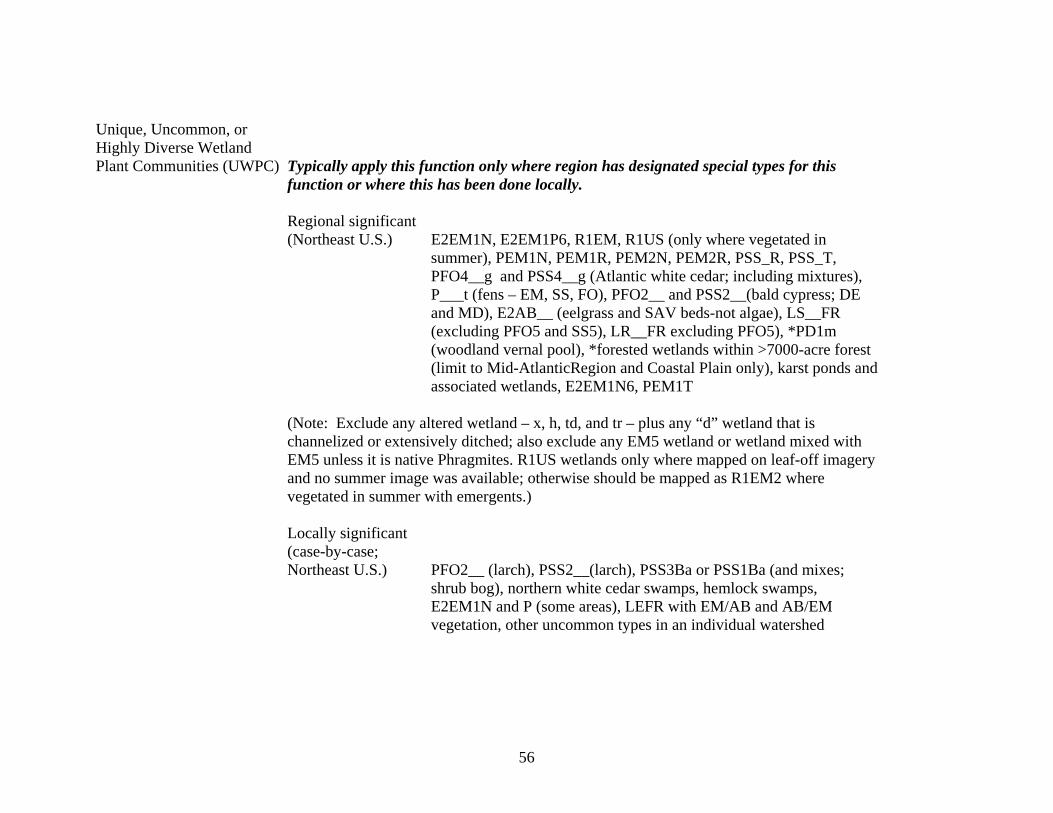
56
Unique, Uncommon, or Highly Diverse Wetland Plant Communities (UWPC) Typically apply this function only where region has designated special types for this
function or where this has been done locally. Regional significant
(Northeast U.S.) E2EM1N, E2EM1P6, R1EM, R1US (only where vegetated in summer), PEM1N, PEM1R, PEM2N, PEM2R, PSS_R, PSS_T, PFO4__g and PSS4__g (Atlantic white cedar; including mixtures), P___t (fens – EM, SS, FO), PFO2__ and PSS2__(bald cypress; DE and MD), E2AB__ (eelgrass and SAV beds-not algae), LS__FR (excluding PFO5 and SS5), LR__FR excluding PFO5), *PD1m (woodland vernal pool), *forested wetlands within >7000-acre forest (limit to Mid-AtlanticRegion and Coastal Plain only), karst ponds and associated wetlands, E2EM1N6, PEM1T
(Note: Exclude any altered wetland – x, h, td, and tr – plus any “d” wetland that is channelized or extensively ditched; also exclude any EM5 wetland or wetland mixed with
EM5 unless it is native Phragmites. R1US wetlands only where mapped on leaf-off imagery and no summer image was available; otherwise should be mapped as R1EM2 where vegetated in summer with emergents.)
Locally significant (case-by-case; Northeast U.S.) PFO2__ (larch), PSS2__(larch), PSS3Ba or PSS1Ba (and mixes;
shrub bog), northern white cedar swamps, hemlock swamps, E2EM1N and P (some areas), LEFR with EM/AB and AB/EM vegetation, other uncommon types in an individual watershed
57
APPENDIX B. Introduction to the NWI+ Web Mapper and Its Contents
(Note that only certain layers are available for Rhode Island: NWI Types, Landscape Types, Landform Types,
Water Flow Path Types, and Wetlands by each of 11 Functions)
58
An Introduction to the NWI+ Web Mapper and Its Contents (May 2014)
Introduction The NWI+ Web Mapper is an online mapping tool that allows users to display a collection of special project National Wetlands Inventory (NWI) data on different types of base maps. The mapper is an ESRI product while the wetlands data are produced by the U.S. Fish and Wildlife Service and its cooperators. The mapper was developed by Virginia Tech’s Conservation Management Institute (CMI, Blacksburg, VA) and is posted on the Association of State Wetland Managers website under the “Wetlands One-Stop Mapping” page (http://aswm.org/wetland-science/wetlands-one-stop-mapping). The following narrative serves as a guide for understanding what data are available and how to use the mapper. Keep in mind that due to technology changes, the actual mechanics of displaying the data may be subject to modification, yet this guide should still help you navigate the online mapper. Types of Data Displayed Besides showing wetland types classified according to the Cowardin et al. (1979) classification system which is the Service’s standard classification, the data include hydrogeomorphic classification (LLWW descriptors – landscape position, landform, water flow path, and waterbody type; Tiner 2003, 2011 and updates) as recommended by the Federal Geographic Data Committee (FGDC 2009) and a preliminary assessment of wetland functions at the landscape-level (up to 11 functions). For some projects, the location and type of potential wetland restoration sites and potential wetland areas (e.g., undeveloped hydric soils that were not mapped as NWI wetlands due to a lack of a recognizable wetland photo-signature) may also be displayed. Data Quality Assurance While the level of quality assurance should be high and consistent for the classification of NWI types (Cowardin et al. 1979), the other classifications have received varying levels of review. The name of the project area provides an indication of the amount of review performed. Specifically, those called “1st Approximation” received some review of the LLWW classifications but have not been reviewed for the output of predicted functions. Projects lacking such designation, however, have been reviewed and their findings presented in a report or series of reports (accessible via the “NWI+ Reports” reference located in the upper right corner of the mapper). The final results for all projects should be considered preliminary as extensive field review has not been performed for any project and field-verified assessments produce the best evaluation of a given wetland’s classification and its ability to perform a given function.
59
Format of the Mapper The mapper will open to a map of the United States with project areas outlined in red. If you place your pointer a project area, the title box will appear. Click on the title box to get the full title of the project area, then zoom into your area of interest. Above the map is a tool bar that includes several icons from left to right (each icon is described in the next section): “Browse”, “Remove Layer”, “Choose Basemap”, “Bookmarks”, “Map Contents”, “Show Legend Tool”, “Search”, “Measure”, and “Print”. To the right of these icons is a list of topics that will take you to various documents and websites such as “Intro to the Mapper” (report), “Wetlands One Stop” (ASWM website), “NWI” (the Service’s NWI national website), “Northeast NWI” (Region 5’s NWI website) , “NWI Legend” (document), “NWI+ Codes” (publication), “NWI+ Reports” (publications), and “CMI” (Virginia Tech’s CMI website). What the Icons Do “Browse” – allows you to add other geospatial data to the mapper. For example you could add other base maps and imagery from a pre-chosen list or add geospatial data from a website. “Remove Layer” – remove a layer that you’ve added. “Choose Basemap” – select the type of basemap you’d like to display the data on – maps or imagery. “Bookmarks” – provides a list of the project names where NWI+ data are available. “Map Contents” – perhaps the most important icon – clicking on this will produce a table of contents on the right side of the map. Boxes are located to the left of each data layer. Two boxes are marked as default (“NWI+ Footprints” shows the project areas while the “NWI+ Landscape” shows wetlands classified by landscape position). To view other data layers, click off the “NWI+ Landscape” checkmark, then click on the box of the topic of interest. A summary of each of the NWI+ data layers is in the next section. “Show Legend” – displays a series of legends related to the layers in map contents. You must click on the applicable legend to see the color pattern for the layer being displayed. “Search” – allows you to zoom into a particular address by clicking on “Place” and then typing the address in the box, or to search the web to find geospatial data to add to the mapper. For example, NWI data for the entire country can be added by clicking on “The Web” then typing in “national wetlands inventory” then click on the magnifying glass on
60
the right… the FWS wetlands web mapping service will be listed, then simply click on “Add” and the FWS NWI data will be added to the mapper for this session. The NWI data will be the first layer on the list and all its contents (data layers) will be active. The first NWI layer is “Wetlands Data” that will show the location/type of wetlands and deepwater habitats for the entire country, but you’ll need to zoom in to see the data. The default at the national level will show the status of the NWI; I’d suggest clicking off all the other NWI data layers until you are interested in viewing them. Throughout this mapper, the first box checked will take precedence over others checked. In other words, that data will overlie other data that are checked, so you’ll have to uncheck the boxes for data layers that are not of interest…that will remove them from view. “Measure” – allows you to measure length and area on the map (use the freehand polygon to draw an irregularly shaped polygon). “Print” – allows you to prepare a map of the data in view and either send it to your printer or to produce a pdf image for storing on your computer. You can also use the “Print Screen” key on your keyboard to do the same. This will allow you to print the legend alongside of the map just as the image you are viewing. Tip: You can use a Windows Snipping Tool found in the “Accessories” folder to clip a portion of whatever you are viewing on screen (on your main computer – open “All Programs” for list that contain the “Accessories” folder); this will create a picture of your area of interest (png document). The NWI+ Data Layers The following is a list of the potential data layers for a project area. Note that some projects (especially the 1st Approximations) do not have data for all the layers. The 1st Approximations have data for NWI types. LLWW types, and Functions but not for the other data layers. The default data layer (the first coming into view) should be the “NWI+ Landscape.” “NWI+ Footprints” – shows project areas where NWI+ data are available. “Wetland Codes” – places dots on the wetlands so that user can click on the dot to get the wetland classification by NWI type and by LLWW type. “NWI – Common Types” – shows mapped wetlands and deepwater habitats by Cowardin et al. types (color-coded types – legend can be viewed by first clicking on “Show Legend” icon on the toolbar on the top of the map and then by clicking on “NWI – Common Types” then on list of legends that pops up on the right of the map). “NWI+ Landscape” – shows mapped wetlands classified by landscape position (color-coded types – view legend following described above but clicking on applicable layer) “NWI+ Landform” – shows mapped wetlands classified by landform (color-coded types – view legend as described above)
61
“NWI+ WaterFlowPath” - shows mapped wetlands classified by water flow path (color-coded types – view legend as described above) “NWI+ RestType 1 SoilCodes” – should be viewed with “NWI+ Restoration Type1” – shows dots that when clicked on identify the soil type for this former wetland site (hydric soil but not wetland today). “NWI+ Restoration Type1” – shows former wetlands (based on hydric soils data) that have been developed but are in a land use that may be suitable for restoration; many are drained hydric soils that are now in agricultural use. A legend lists the major types of these former wetlands (color-coded to type). “NWI+ Restoration Type 2” – shows existing wetlands that have been altered in some way that has affected their natural functions. A legend indicates the nature of the restoration type. To view their classification and the nature of the alteration, check the box for “Wetland Codes” and then on the dot in the wetland of interest. The alterations include ditched (d), diking/impoundment (h), excavation (x) and farmed wetlands (f). Many are partly drained wetlands, while others are ponds created by excavating former vegetated wetlands or diking vegetated wetlands to create open water habitat and altering the hydrology of remaining marshes and swamps. “NWI+ P-WetAreas Codes” – should be viewed with “NWI+ P-WetAreas” – shows dots that when clicked on identify the soil type for these hydric soil areas that may support wetlands. “NWI+ P-WetAreas” – shows hydric soil areas (mapped by USDA Natural Resources Conservation Service) that are in “natural vegetation” but lacked an identifiable wetland photo-signature and were not mapped as wetlands by the NWI; given that they have not been developed it is quite possible that they may support wetlands to some degree. “______ Function” shows wetlands predicted to perform specific functions at significant levels (e.g., high or moderate): “BSS” (bank and shoreline stabilization, “CAR” (carbon sequestration, “CSS” (coastal storm surge detention), “FAIH” (fish and aquatic invertebrate habitat), NT (nutrient transformation), OWH (other wildlife habitat), SM (streamflow maintenance), SR (sediment and other particulate retention), SWD (surface water detention – for freshwater wetlands only), UWPC (uncommon or highly diverse wetland plant communities – based on NWI codes only), and WBIRD (waterfowl and waterbird habitat). To View the Legend for a Data Layer The legends do not automatically appear when you open a data layer. The legend will have to be turned on separately. First be sure you have only one data layer active. To view the legend for that layer, you will need to open the “Show Legend” function (middle of tool bar) and simply click on carat symbol to the left of the layer name, and a colored
62
coded legend will then come into view. Since the same color is used in different legends, it is essential to have the proper legend turned on.
Adding Other Data Layers to the Web Mapper
To increase the functionality of the mapper, you can easily add other GIS data to it. For this use the “Search” tool (magnifying glass) on the tool bar at the top of the mapper. Before using this tool, you may want to check off any marked box (NWI+ data layer) that can be seen when viewing “Map Contents.” By doing this only the base map or image will be visible on the mapper (i.e., all the NWI+ data layers are turned off). To obtain another GIS data layers simply click on the “Search” tool (the magnifying glass) on the tool bar above the map, then click on the ESRI online tab (middle tab) and type the name of a layer you wish to view in the space provided (e.g., NHD data, NWI wetlands, Presence of hydric soils), then click on the magnifying glass to the right of the line. This will produce a list of data sets related to that topic. Scroll down the list and choose the one you are interested in, then add it to the mapper by simply clicking on the word “Add” just to the right of the layer name. The layer will appear in the Map Contents window at the top of the list (i.e., when “Map Contents” is open), but the data may not be visible because of scale-dependency. Zoom in as necessary to view the data. A scale bar on the bottom of the map identifies the relative scale (linear dimensions). To view the legend, double-click on the name of the layer in “Map Contents” and on any other name that opens up below the layer name. To remove the layer, use the “Remove” icon on the toolbar. Using this function allows you to view NWI data across the country with other datasets. This is a valuable tool since you can simultaneously view NWI with NHD and hydric soil data! References Cowardin, L.M., V. Carter, F.C. Golet, and E.T. LaRoe. 1979. Classification of Wetlands and Deepwater Habitats of the United States. U.S. Fish and Wildlife Service, Washington, DC. FWS/OBS-79/31. http://nctc.fws.gov/resources/knowledge-resources/FWS-OBS/79_31.pdf Federal Geographic Data Committee (FGDC). 2009. Wetland Mapping Standard. FGDC-STD-015-2009. http://www.fgdc.gov/standards/projects/FGDC-standards-projects/wetlands-mapping/ Tiner, R.W. 2011. Dichotomous Keys and Mapping Codes for Wetland Landscape Position, Landform, Water Flow Path, and Waterbody Type Descriptors. Version 2.0. U.S. Fish and Wildlife Service, National Wetlands Inventory Program, Northeast Region, Hadley, MA. http://digitalmedia.fws.gov/cdm/ref/collection/document/id/1324

63
Tiner, R.W. Dichotomous Keys and Mapping Codes for Wetland Landscape Position, Landform, Water Flow Path, and Waterbody Type Descriptors. U.S. Fish and Wildlife Service, National Wetlands Inventory Program, Northeast Region, Hadley, MA. http://digitalmedia.fws.gov/cdm/ref/collection/document/id/1325 Comments on the Mapper or this Introduction can be directed to: Ralph Tiner ([email protected]) or Kevin McGuckin, CMI ([email protected]).