us equity market reality check - custprd.com reality check.pdf · us equity market reality check...
TRANSCRIPT
P a g e | 1 www.custprd.com
Hong Kong Tokyo
Salt Lake City
US Equity Market Reality Check
14th December 2015
Robert Rowland
Sodium Pentothal™ – helping separate fact from fantasy since 1934
What Investors Need to Know:
1. Currently there is a significant disconnect between analysts’ earnings estimates and
actual earnings. This level of divergence has only happened twice before in the last
25 years. LTM EPS have declined significantly compared to what analysts were
forecasting a year ago. However new earnings estimates for the NTM continue to rise.
2. Adjusted NIPA net profit data, which usually leads S&P EPS trends by 2 quarters,
turned negative in Q1 (Jan to March 2015) and deteriorated further in Q2 (April to June
2015). This is a yellow flag for S&P EPS.
3. Two-thirds of EPS growth over the last 10 years has come from share buybacks,
however share buybacks and dividends have exceeded Net Profits for the last 3
quarters as the corporate financing gap expands.
4. Investors leverage is also tapped out, with credit balances on margin accounts near
record low levels. Credit balance troughs precede market downturns by 3-6 months.
5. Volatility is likely to rise sharply over the next year as 10-2Yr treasury spreads shrink,
reducing market multiples.
P a g e | 2 www.custprd.com
Hong Kong Tokyo
Salt Lake City
Similar divergences
have been seen
before…
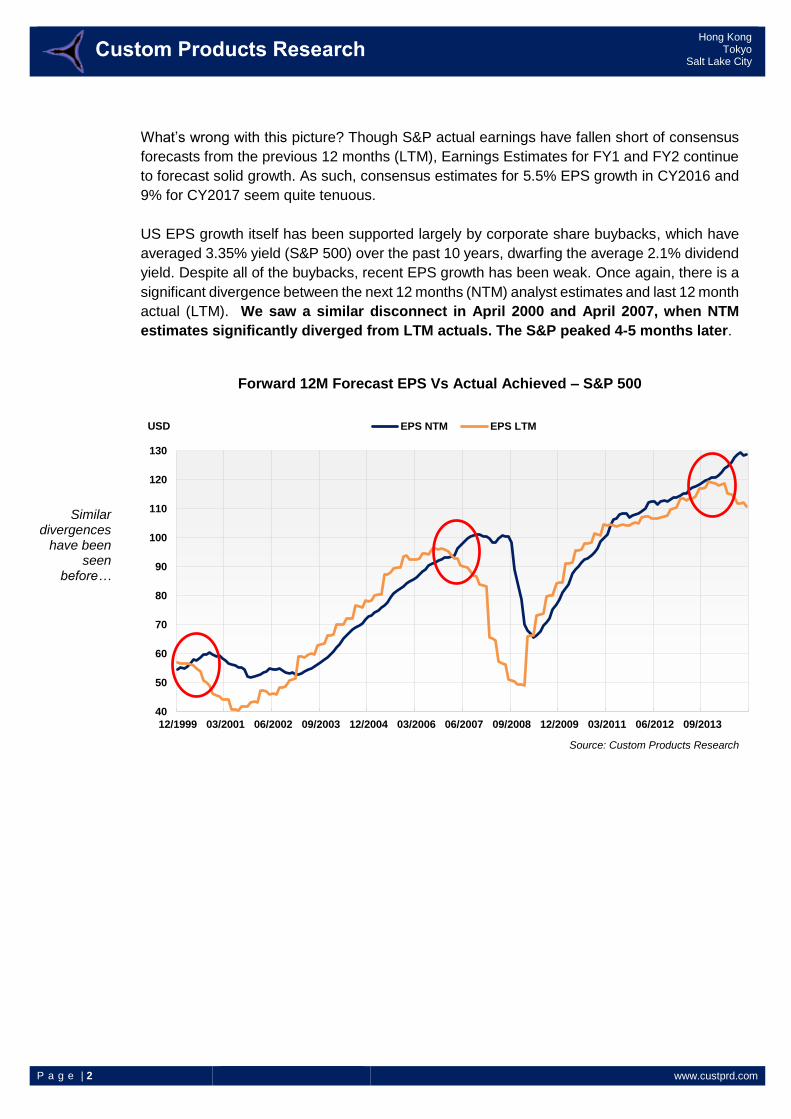
What’s wrong with this picture? Though S&P actual earnings have fallen short of consensus
forecasts from the previous 12 months (LTM), Earnings Estimates for FY1 and FY2 continue
to forecast solid growth. As such, consensus estimates for 5.5% EPS growth in CY2016 and
9% for CY2017 seem quite tenuous.
US EPS growth itself has been supported largely by corporate share buybacks, which have
averaged 3.35% yield (S&P 500) over the past 10 years, dwarfing the average 2.1% dividend
yield. Despite all of the buybacks, recent EPS growth has been weak. Once again, there is a
significant divergence between the next 12 months (NTM) analyst estimates and last 12 month
actual (LTM). We saw a similar disconnect in April 2000 and April 2007, when NTM
estimates significantly diverged from LTM actuals. The S&P peaked 4-5 months later.
Forward 12M Forecast EPS Vs Actual Achieved – S&P 500
Source: Custom Products Research
40
50
60
70
80
90
100
110
120
130
12/1999 03/2001 06/2002 09/2003 12/2004 03/2006 06/2007 09/2008 12/2009 03/2011 06/2012 09/2013
EPS NTM EPS LTMUSD
P a g e | 3 www.custprd.com
Hong Kong Tokyo
Salt Lake City
X
Multiples Continue up
but…
The Revisions
are not catching up
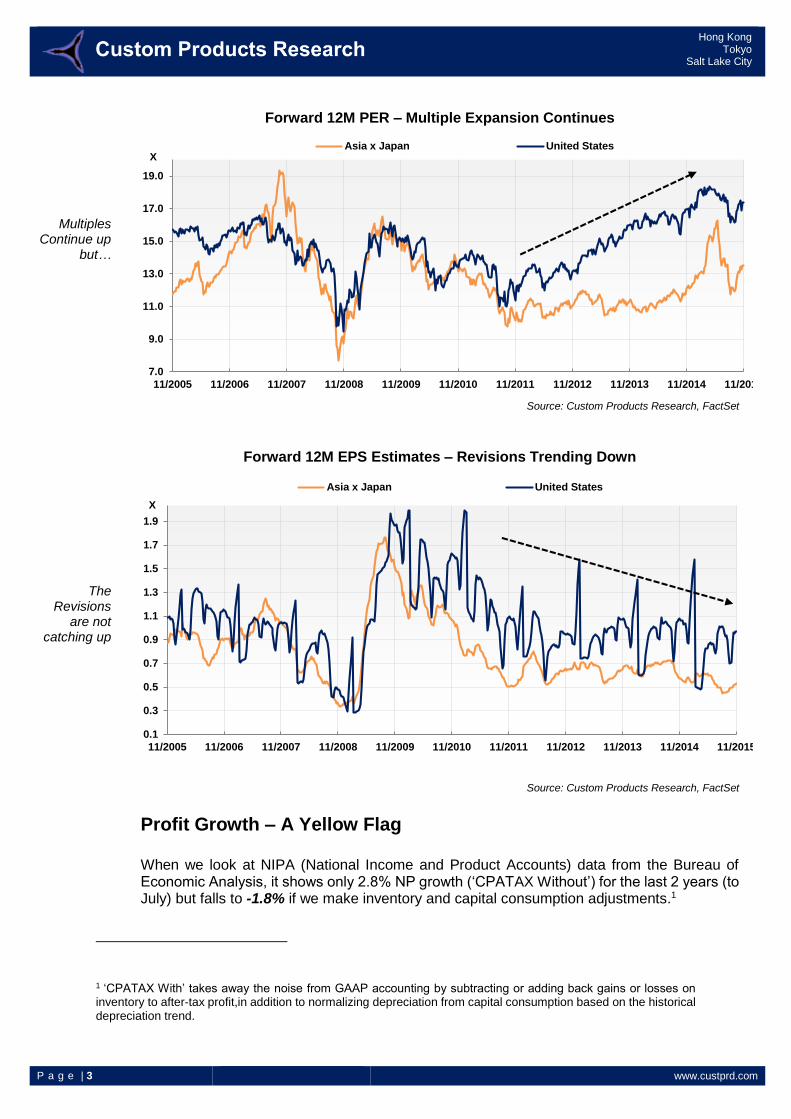
Forward 12M PER – Multiple Expansion Continues
Source: Custom Products Research, FactSet
Forward 12M EPS Estimates – Revisions Trending Down
Source: Custom Products Research, FactSet
Profit Growth – A Yellow Flag When we look at NIPA (National Income and Product Accounts) data from the Bureau of Economic Analysis, it shows only 2.8% NP growth (‘CPATAX Without’) for the last 2 years (to July) but falls to -1.8% if we make inventory and capital consumption adjustments.1
1 ‘CPATAX With’ takes away the noise from GAAP accounting by subtracting or adding back gains or losses on inventory to after-tax profit,in addition to normalizing depreciation from capital consumption based on the historical depreciation trend.
7.0
9.0
11.0
13.0
15.0
17.0
19.0
11/2005 11/2006 11/2007 11/2008 11/2009 11/2010 11/2011 11/2012 11/2013 11/2014 11/2015
Asia x Japan United States
0.1
0.3
0.5
0.7
0.9
1.1
1.3
1.5
1.7
1.9
11/2005 11/2006 11/2007 11/2008 11/2009 11/2010 11/2011 11/2012 11/2013 11/2014 11/2015
Asia x Japan United States
X
P a g e | 4 www.custprd.com
Hong Kong Tokyo
Salt Lake City
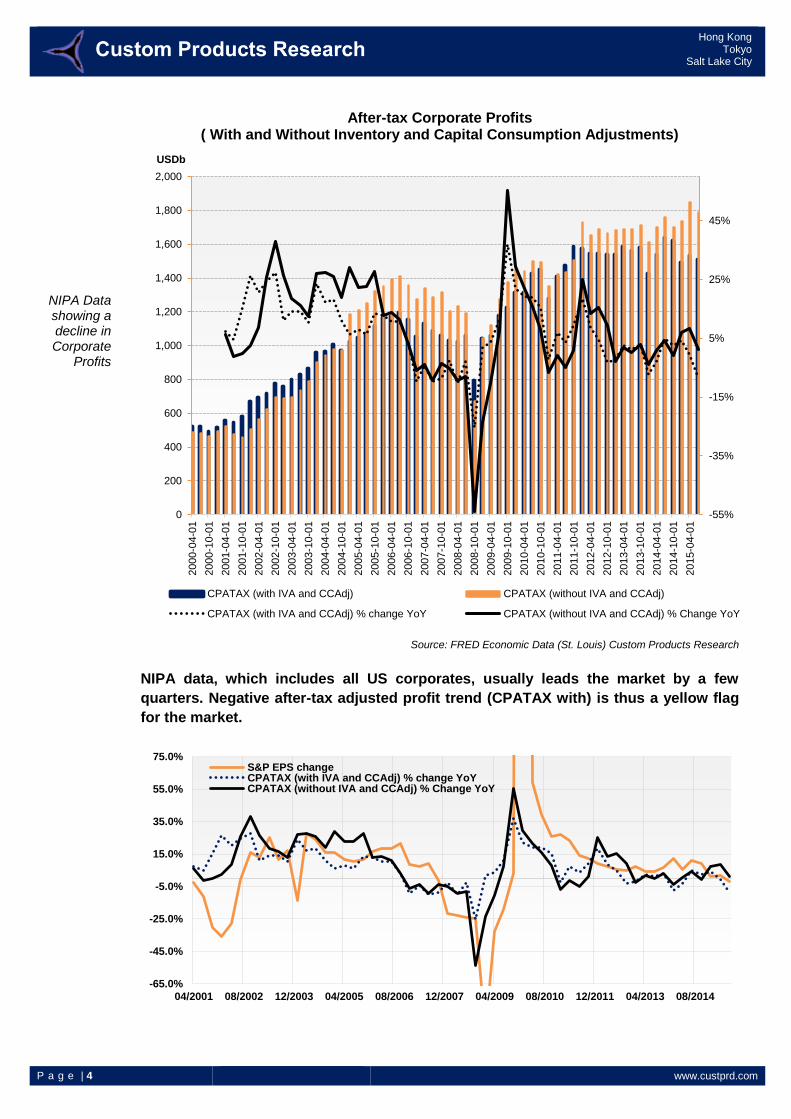
NIPA Data showing a decline in Corporate
Profits
After-tax Corporate Profits ( With and Without Inventory and Capital Consumption Adjustments)
Source: FRED Economic Data (St. Louis) Custom Products Research
NIPA data, which includes all US corporates, usually leads the market by a few
quarters. Negative after-tax adjusted profit trend (CPATAX with) is thus a yellow flag
for the market.
-55%
-35%
-15%
5%
25%
45%
0
200
400
600
800
1,000
1,200
1,400
1,600
1,800
2,000
2000-0
4-0
1
2000-1
0-0
1
2001-0
4-0
1
2001-1
0-0
1
2002-0
4-0
1
2002-1
0-0
1
2003-0
4-0
1
2003-1
0-0
1
2004-0
4-0
1
2004-1
0-0
1
2005-0
4-0
1
2005-1
0-0
1
2006-0
4-0
1
2006-1
0-0
1
2007-0
4-0
1
2007-1
0-0
1
2008-0
4-0
1
2008-1
0-0
1
2009-0
4-0
1
2009-1
0-0
1
2010-0
4-0
1
2010-1
0-0
1
2011-0
4-0
1
2011-1
0-0
1
2012-0
4-0
1
2012-1
0-0
1
2013-0
4-0
1
2013-1
0-0
1
2014-0
4-0
1
2014-1
0-0
1
2015-0
4-0
1
CPATAX (with IVA and CCAdj) CPATAX (without IVA and CCAdj)
CPATAX (with IVA and CCAdj) % change YoY CPATAX (without IVA and CCAdj) % Change YoY
-65.0%
-45.0%
-25.0%
-5.0%
15.0%
35.0%
55.0%
75.0%
04/2001 08/2002 12/2003 04/2005 08/2006 12/2007 04/2009 08/2010 12/2011 04/2013 08/2014
S&P EPS changeCPATAX (with IVA and CCAdj) % change YoYCPATAX (without IVA and CCAdj) % Change YoY
USDb
P a g e | 5 www.custprd.com
Hong Kong Tokyo
Salt Lake City
Market outlook is
not positive in a rising
rate environment
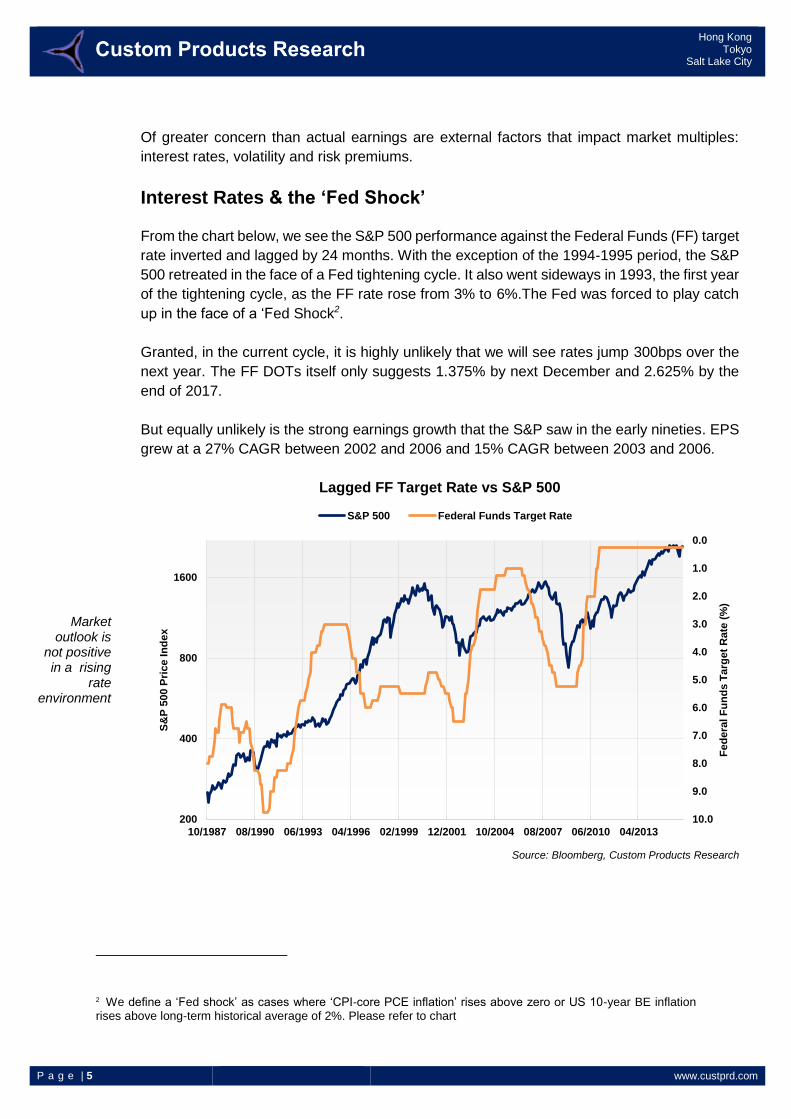
Of greater concern than actual earnings are external factors that impact market multiples:
interest rates, volatility and risk premiums.
Interest Rates & the ‘Fed Shock’
From the chart below, we see the S&P 500 performance against the Federal Funds (FF) target
rate inverted and lagged by 24 months. With the exception of the 1994-1995 period, the S&P
500 retreated in the face of a Fed tightening cycle. It also went sideways in 1993, the first year
of the tightening cycle, as the FF rate rose from 3% to 6%.The Fed was forced to play catch
up in the face of a ‘Fed Shock2.
Granted, in the current cycle, it is highly unlikely that we will see rates jump 300bps over the
next year. The FF DOTs itself only suggests 1.375% by next December and 2.625% by the
end of 2017.
But equally unlikely is the strong earnings growth that the S&P saw in the early nineties. EPS
grew at a 27% CAGR between 2002 and 2006 and 15% CAGR between 2003 and 2006.
Lagged FF Target Rate vs S&P 500
Source: Bloomberg, Custom Products Research
2 We define a ‘Fed shock’ as cases where ‘CPI-core PCE inflation’ rises above zero or US 10-year BE inflation rises above long-term historical average of 2%. Please refer to chart
0.0
1.0
2.0
3.0
4.0
5.0
6.0
7.0
8.0
9.0
10.0200
400
800
1600
10/1987 08/1990 06/1993 04/1996 02/1999 12/2001 10/2004 08/2007 06/2010 04/2013
Fe
dera
l F
un
ds T
arg
et
Rate
(%
)
S&
P 5
00 P
rice In
de
x
S&P 500 Federal Funds Target Rate
P a g e | 6 www.custprd.com
Hong Kong Tokyo
Salt Lake City
US Market may find it difficult to
support current levels
A ‘Shock’ could lower
the S&P 500 fair
value by 6.0% per
25bps
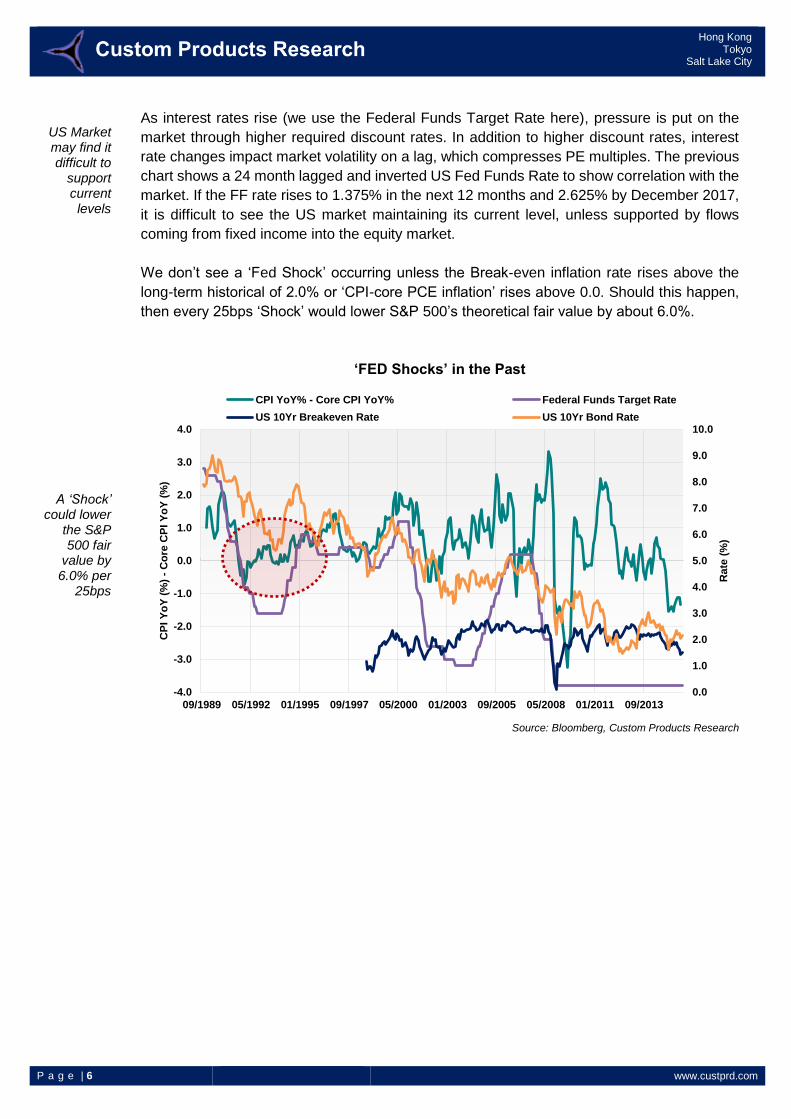
As interest rates rise (we use the Federal Funds Target Rate here), pressure is put on the
market through higher required discount rates. In addition to higher discount rates, interest
rate changes impact market volatility on a lag, which compresses PE multiples. The previous
chart shows a 24 month lagged and inverted US Fed Funds Rate to show correlation with the
market. If the FF rate rises to 1.375% in the next 12 months and 2.625% by December 2017,
it is difficult to see the US market maintaining its current level, unless supported by flows
coming from fixed income into the equity market.
We don’t see a ‘Fed Shock’ occurring unless the Break-even inflation rate rises above the
long-term historical of 2.0% or ‘CPI-core PCE inflation’ rises above 0.0. Should this happen,
then every 25bps ‘Shock’ would lower S&P 500’s theoretical fair value by about 6.0%.
‘FED Shocks’ in the Past
Source: Bloomberg, Custom Products Research
0.0
1.0
2.0
3.0
4.0
5.0
6.0
7.0
8.0
9.0
10.0
-4.0
-3.0
-2.0
-1.0
0.0
1.0
2.0
3.0
4.0
09/1989 05/1992 01/1995 09/1997 05/2000 01/2003 09/2005 05/2008 01/2011 09/2013
Rate
(%
)
CP
I Y
oY
(%
) -
Co
re C
PI Y
oY
(%
)
CPI YoY% - Core CPI YoY% Federal Funds Target Rate
US 10Yr Breakeven Rate US 10Yr Bond Rate
P a g e | 7 www.custprd.com
Hong Kong Tokyo
Salt Lake City
Increasing spreads
tend to lead a downfall in
the equity market
Widening financing
gap signals higher
volatility
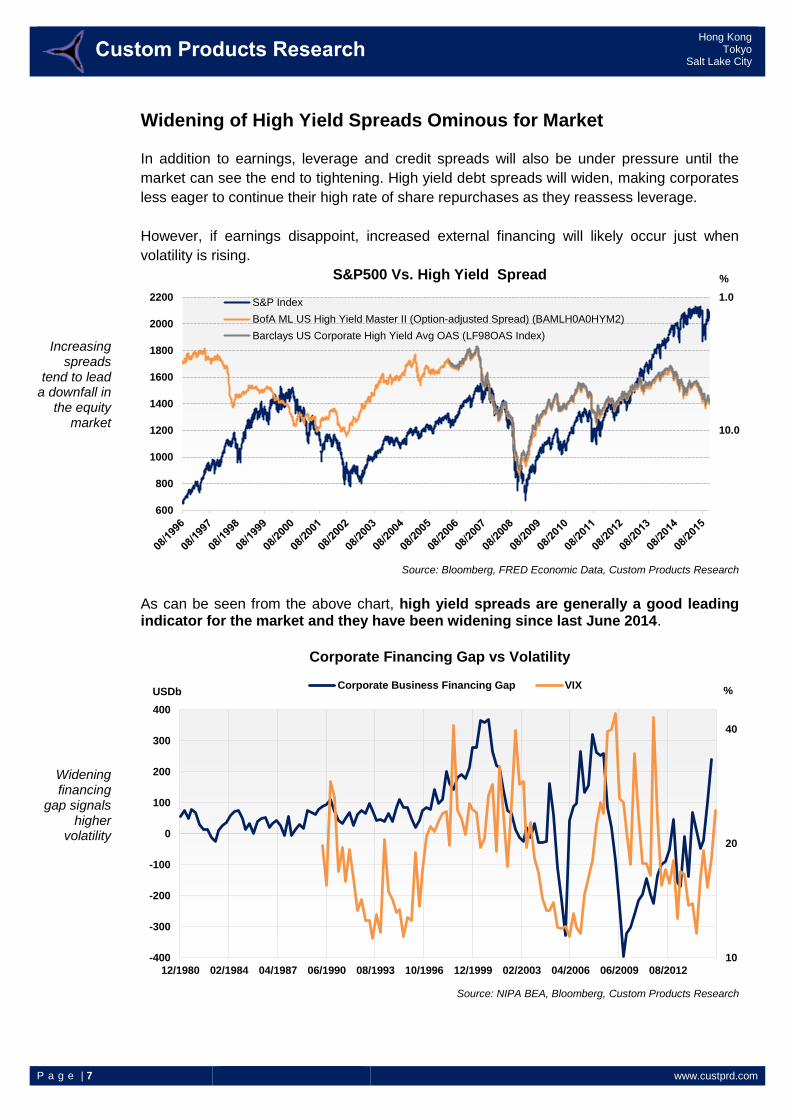
Widening of High Yield Spreads Ominous for Market
In addition to earnings, leverage and credit spreads will also be under pressure until the
market can see the end to tightening. High yield debt spreads will widen, making corporates
less eager to continue their high rate of share repurchases as they reassess leverage.
However, if earnings disappoint, increased external financing will likely occur just when
volatility is rising.
S&P500 Vs. High Yield Spread
Source: Bloomberg, FRED Economic Data, Custom Products Research
As can be seen from the above chart, high yield spreads are generally a good leading indicator for the market and they have been widening since last June 2014.
Corporate Financing Gap vs Volatility
Source: NIPA BEA, Bloomberg, Custom Products Research
1.0
10.0
600
800
1000
1200
1400
1600
1800
2000
2200S&P Index
BofA ML US High Yield Master II (Option-adjusted Spread) (BAMLH0A0HYM2)
Barclays US Corporate High Yield Avg OAS (LF98OAS Index)
10
20
40
-400
-300
-200
-100
0
100
200
300
400
12/1980 02/1984 04/1987 06/1990 08/1993 10/1996 12/1999 02/2003 04/2006 06/2009 08/2012
Corporate Business Financing Gap VIX
%
USDb %
P a g e | 8 www.custprd.com
Hong Kong Tokyo
Salt Lake City
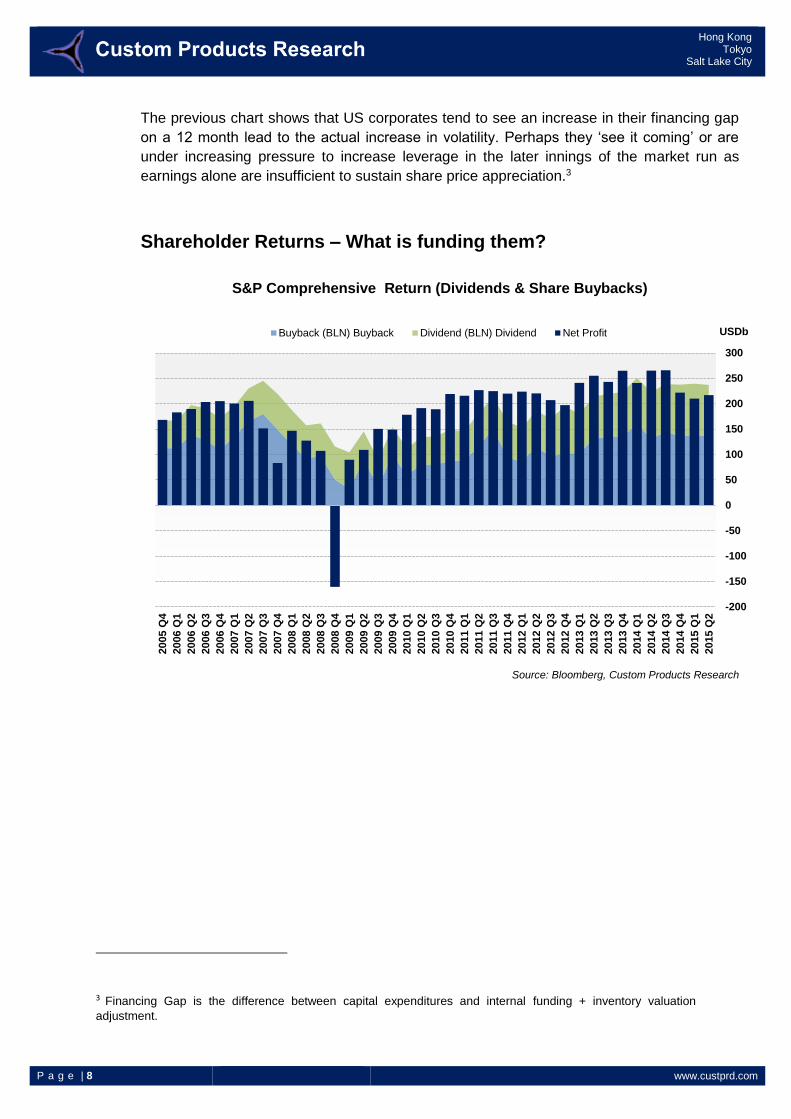
The previous chart shows that US corporates tend to see an increase in their financing gap
on a 12 month lead to the actual increase in volatility. Perhaps they ‘see it coming’ or are
under increasing pressure to increase leverage in the later innings of the market run as
earnings alone are insufficient to sustain share price appreciation.3
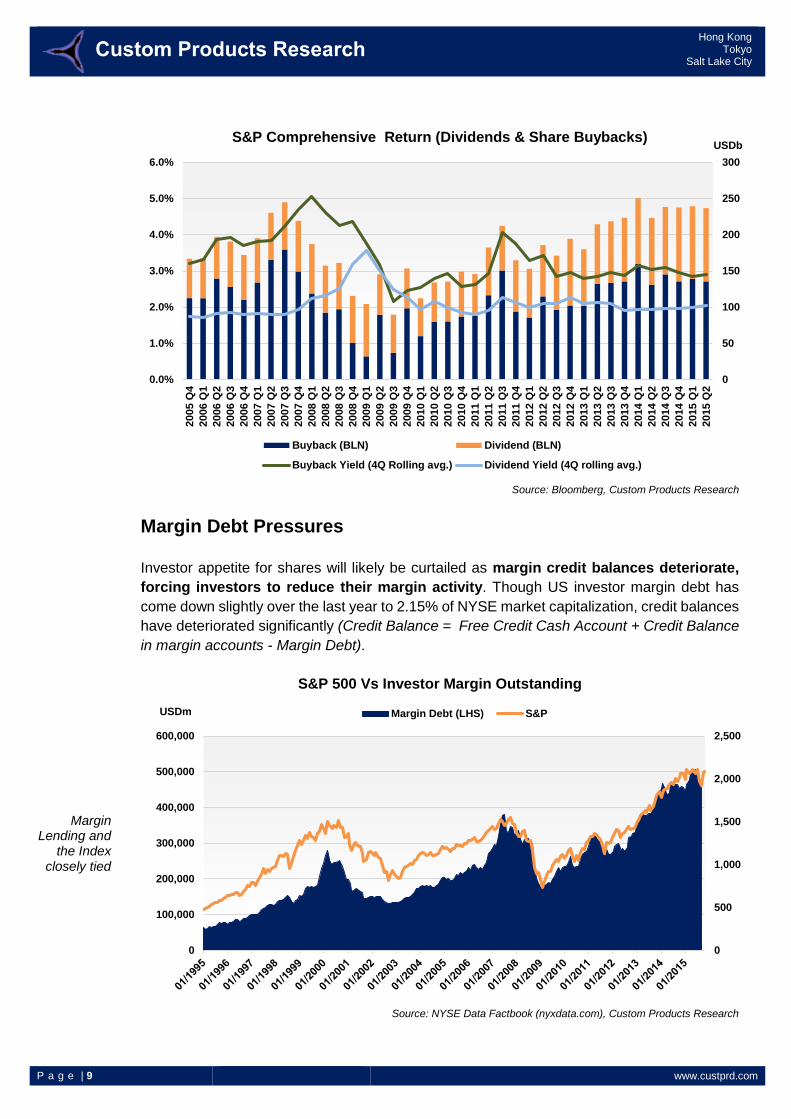
Shareholder Returns – What is funding them?
S&P Comprehensive Return (Dividends & Share Buybacks)
Source: Bloomberg, Custom Products Research
3 Financing Gap is the difference between capital expenditures and internal funding + inventory valuation
adjustment.
-200
-150
-100
-50
0
50
100
150
200
250
300
2015 Q
2
2015 Q
1
2014 Q
4
2014 Q
3
2014 Q
2
2014 Q
1
2013 Q
4
2013 Q
3
2013 Q
2
2013 Q
1
2012 Q
4
2012 Q
3
2012 Q
2
2012 Q
1
2011 Q
4
2011 Q
3
2011 Q
2
2011 Q
1
2010 Q
4
2010 Q
3
2010 Q
2
2010 Q
1
2009 Q
4
2009 Q
3
2009 Q
2
2009 Q
1
2008 Q
4
2008 Q
3
2008 Q
2
2008 Q
1
2007 Q
4
2007 Q
3
2007 Q
2
2007 Q
1
2006 Q
4
2006 Q
3
2006 Q
2
2006 Q
1
2005 Q
4
Buyback (BLN) Buyback Dividend (BLN) Dividend Net Profit USDb
P a g e | 9 www.custprd.com
Hong Kong Tokyo
Salt Lake City
Margin Lending and
the Index closely tied
S&P Comprehensive Return (Dividends & Share Buybacks)
Source: Bloomberg, Custom Products Research
Margin Debt Pressures
Investor appetite for shares will likely be curtailed as margin credit balances deteriorate,
forcing investors to reduce their margin activity. Though US investor margin debt has
come down slightly over the last year to 2.15% of NYSE market capitalization, credit balances
have deteriorated significantly (Credit Balance = Free Credit Cash Account + Credit Balance
in margin accounts - Margin Debt).
S&P 500 Vs Investor Margin Outstanding
Source: NYSE Data Factbook (nyxdata.com), Custom Products Research
0
50
100
150
200
250
300
0.0%
1.0%
2.0%
3.0%
4.0%
5.0%
6.0%
2005 Q
4
2006 Q
1
2006 Q
2
2006 Q
3
2006 Q
4
2007 Q
1
2007 Q
2
2007 Q
3
2007 Q
4
2008 Q
1
2008 Q
2
2008 Q
3
2008 Q
4
2009 Q
1
2009 Q
2
2009 Q
3
2009 Q
4
2010 Q
1
2010 Q
2
2010 Q
3
2010 Q
4
2011 Q
1
2011 Q
2
2011 Q
3
2011 Q
4
2012 Q
1
2012 Q
2
2012 Q
3
2012 Q
4
2013 Q
1
2013 Q
2
2013 Q
3
2013 Q
4
2014 Q
1
2014 Q
2
2014 Q
3
2014 Q
4
2015 Q
1
2015 Q
2
Buyback (BLN) Dividend (BLN)
Buyback Yield (4Q Rolling avg.) Dividend Yield (4Q rolling avg.)
0
500
1,000
1,500
2,000
2,500
0
100,000
200,000
300,000
400,000
500,000
600,000
Margin Debt (LHS) S&P
USDb
USDm
P a g e | 10 www.custprd.com
Hong Kong Tokyo
Salt Lake City
Earnings
Expectations a strong driver, but
recently multiple
expansion taking a
bigger slice
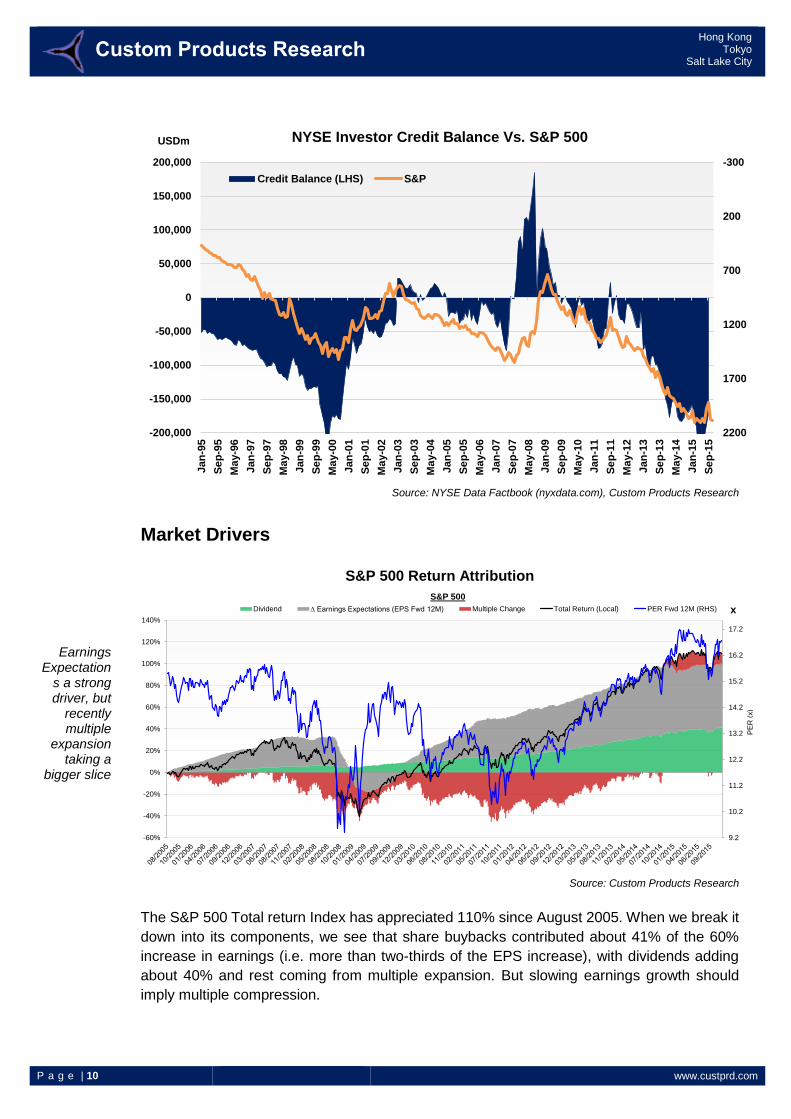
NYSE Investor Credit Balance Vs. S&P 500
Source: NYSE Data Factbook (nyxdata.com), Custom Products Research
Market Drivers
S&P 500 Return Attribution
Source: Custom Products Research
The S&P 500 Total return Index has appreciated 110% since August 2005. When we break it
down into its components, we see that share buybacks contributed about 41% of the 60%
increase in earnings (i.e. more than two-thirds of the EPS increase), with dividends adding
about 40% and rest coming from multiple expansion. But slowing earnings growth should
imply multiple compression.
-300
200
700
1200
1700
2200-200,000
-150,000
-100,000
-50,000
0
50,000
100,000
150,000
200,000
Jan
-95
Se
p-9
5
Ma
y-9
6
Jan
-97
Se
p-9
7
Ma
y-9
8
Jan
-99
Se
p-9
9
Ma
y-0
0
Jan
-01
Se
p-0
1
Ma
y-0
2
Jan
-03
Se
p-0
3
Ma
y-0
4
Jan
-05
Se
p-0
5
Ma
y-0
6
Jan
-07
Se
p-0
7
Ma
y-0
8
Jan
-09
Se
p-0
9
Ma
y-1
0
Jan
-11
Se
p-1
1
Ma
y-1
2
Jan
-13
Se
p-1
3
Ma
y-1
4
Jan
-15
Se
p-1
5
Credit Balance (LHS) S&P
9.2
10.2
11.2
12.2
13.2
14.2
15.2
16.2
17.2
-60%
-40%
-20%
0%
20%
40%
60%
80%
100%
120%
140%
PE
R (
x)
S&P 500
Currency Dividend ∆ Earnings Expectations (EPS Fwd 12M) Multiple Change Total Return (Local) PER Fwd 12M (RHS)
USDm
x
P a g e | 11 www.custprd.com
Hong Kong Tokyo
Salt Lake City
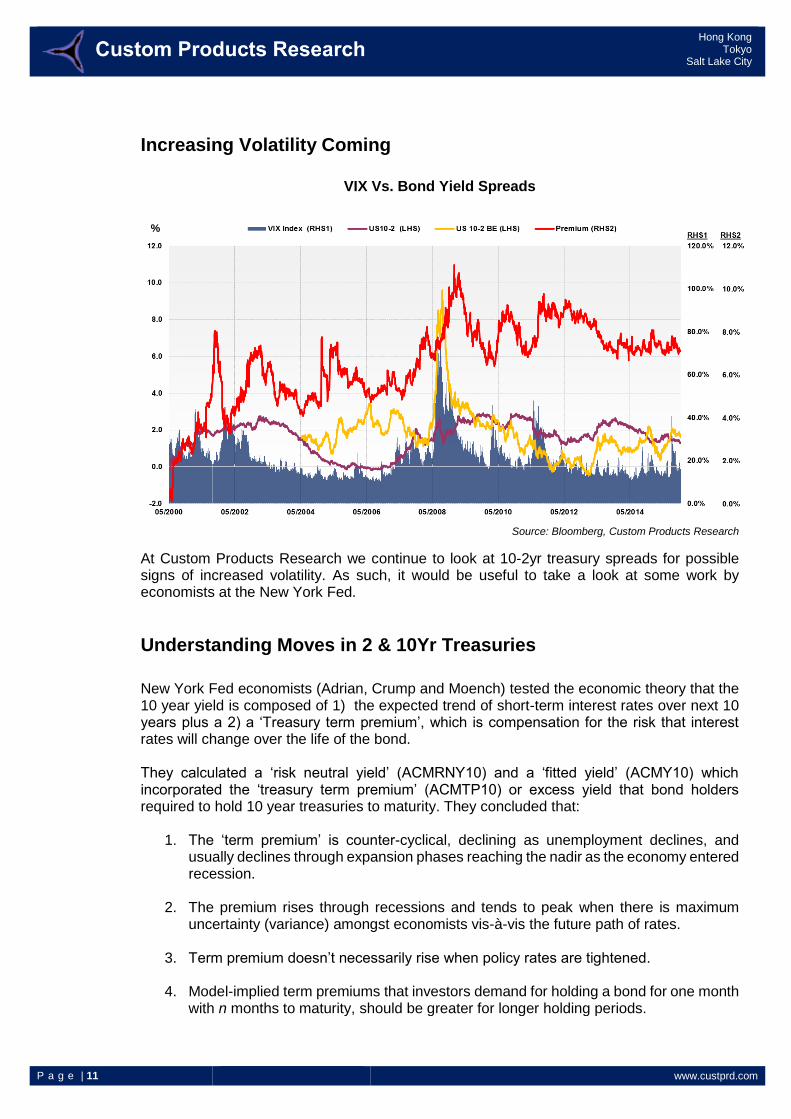
Increasing Volatility Coming
VIX Vs. Bond Yield Spreads
Source: Bloomberg, Custom Products Research
At Custom Products Research we continue to look at 10-2yr treasury spreads for possible signs of increased volatility. As such, it would be useful to take a look at some work by economists at the New York Fed.
Understanding Moves in 2 & 10Yr Treasuries
New York Fed economists (Adrian, Crump and Moench) tested the economic theory that the 10 year yield is composed of 1) the expected trend of short-term interest rates over next 10 years plus a 2) a ‘Treasury term premium’, which is compensation for the risk that interest rates will change over the life of the bond. They calculated a ‘risk neutral yield’ (ACMRNY10) and a ‘fitted yield’ (ACMY10) which incorporated the ‘treasury term premium’ (ACMTP10) or excess yield that bond holders required to hold 10 year treasuries to maturity. They concluded that:
1. The ‘term premium’ is counter-cyclical, declining as unemployment declines, and usually declines through expansion phases reaching the nadir as the economy entered recession.
2. The premium rises through recessions and tends to peak when there is maximum uncertainty (variance) amongst economists vis-à-vis the future path of rates.
3. Term premium doesn’t necessarily rise when policy rates are tightened.
4. Model-implied term premiums that investors demand for holding a bond for one month with n months to maturity, should be greater for longer holding periods.
%
P a g e | 12 www.custprd.com
Hong Kong Tokyo
Salt Lake City
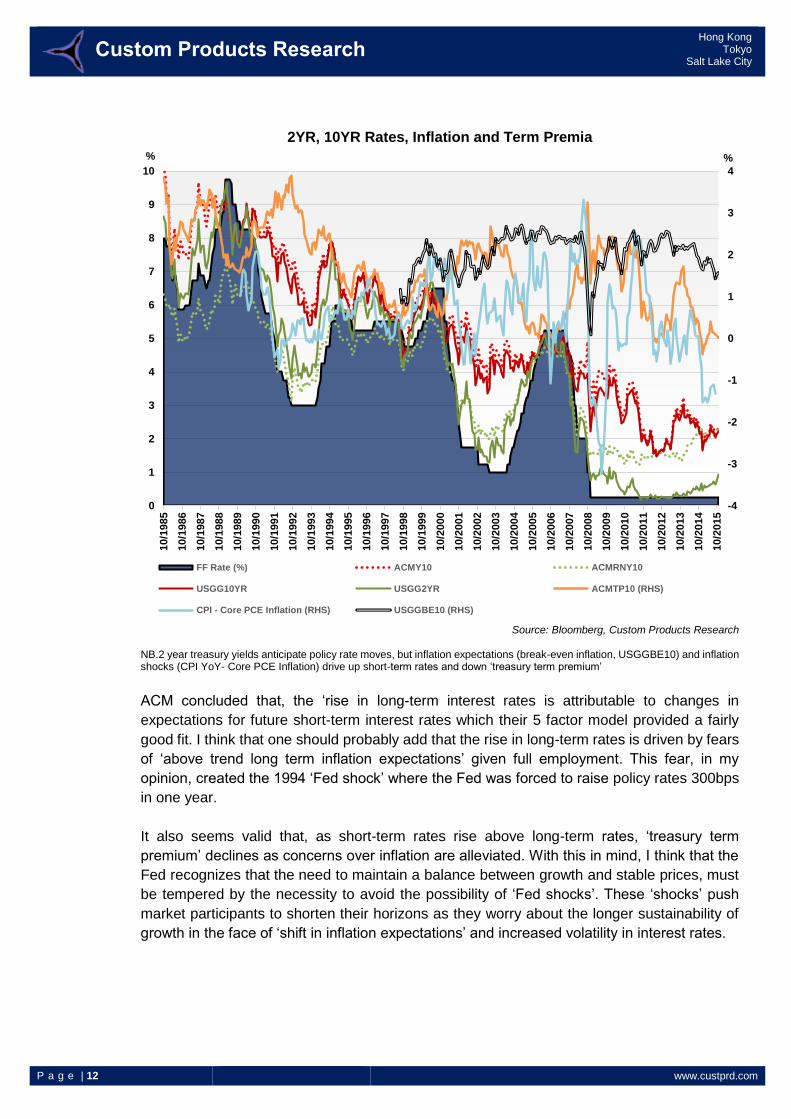
2YR, 10YR Rates, Inflation and Term Premia
Source: Bloomberg, Custom Products Research
NB.2 year treasury yields anticipate policy rate moves, but inflation expectations (break-even inflation, USGGBE10) and inflation shocks (CPI YoY- Core PCE Inflation) drive up short-term rates and down ‘treasury term premium’
ACM concluded that, the ‘rise in long-term interest rates is attributable to changes in
expectations for future short-term interest rates which their 5 factor model provided a fairly
good fit. I think that one should probably add that the rise in long-term rates is driven by fears
of ‘above trend long term inflation expectations’ given full employment. This fear, in my
opinion, created the 1994 ‘Fed shock’ where the Fed was forced to raise policy rates 300bps
in one year.
It also seems valid that, as short-term rates rise above long-term rates, ‘treasury term
premium’ declines as concerns over inflation are alleviated. With this in mind, I think that the
Fed recognizes that the need to maintain a balance between growth and stable prices, must
be tempered by the necessity to avoid the possibility of ‘Fed shocks’. These ‘shocks’ push
market participants to shorten their horizons as they worry about the longer sustainability of
growth in the face of ‘shift in inflation expectations’ and increased volatility in interest rates.
-4
-3
-2
-1
0
1
2
3
4
0
1
2
3
4
5
6
7
8
9
1010/1
985
10/1
986
10/1
987
10/1
988
10/1
989
10/1
990
10/1
991
10/1
992
10/1
993
10/1
994
10/1
995
10/1
996
10/1
997
10/1
998
10/1
999
10/2
000
10/2
001
10/2
002
10/2
003
10/2
004
10/2
005
10/2
006
10/2
007
10/2
008
10/2
009
10/2
010
10/2
011
10/2
012
10/2
013
10/2
014
10/2
015
FF Rate (%) ACMY10 ACMRNY10
USGG10YR USGG2YR ACMTP10 (RHS)
CPI - Core PCE Inflation (RHS) USGGBE10 (RHS)
% %
P a g e | 13 www.custprd.com
Hong Kong Tokyo
Salt Lake City
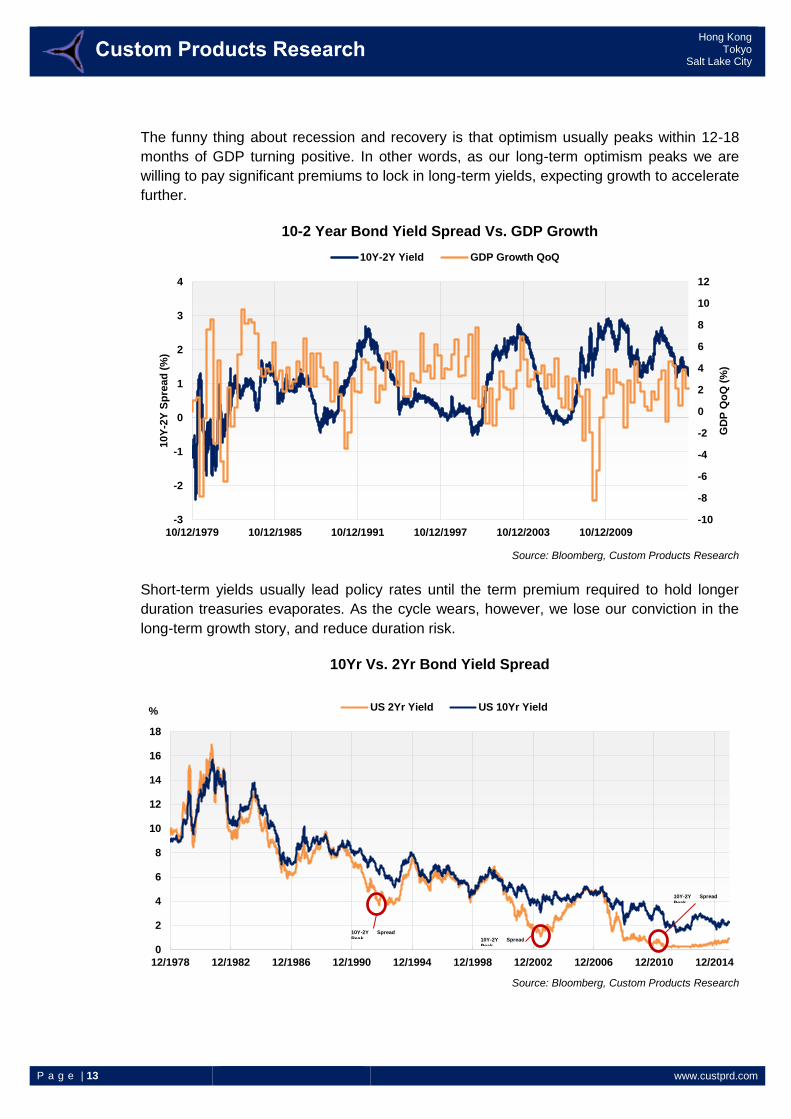
The funny thing about recession and recovery is that optimism usually peaks within 12-18
months of GDP turning positive. In other words, as our long-term optimism peaks we are
willing to pay significant premiums to lock in long-term yields, expecting growth to accelerate
further.
10-2 Year Bond Yield Spread Vs. GDP Growth
Source: Bloomberg, Custom Products Research
Short-term yields usually lead policy rates until the term premium required to hold longer
duration treasuries evaporates. As the cycle wears, however, we lose our conviction in the
long-term growth story, and reduce duration risk.
10Yr Vs. 2Yr Bond Yield Spread
Source: Bloomberg, Custom Products Research
-10
-8
-6
-4
-2
0
2
4
6
8
10
12
-3
-2
-1
0
1
2
3
4
10/12/1979 10/12/1985 10/12/1991 10/12/1997 10/12/2003 10/12/2009
GD
P Q
oQ
(%
)
10Y
-2Y
Sp
read
(%
)
10Y-2Y Yield GDP Growth QoQ
0
2
4
6
8
10
12
14
16
18
12/1978 12/1982 12/1986 12/1990 12/1994 12/1998 12/2002 12/2006 12/2010 12/2014
US 2Yr Yield US 10Yr Yield
10Y-2Y Spread Peak 10Y-2Y Spread
Peak
10Y-2Y Spread
Peak
%
P a g e | 14 www.custprd.com
Hong Kong Tokyo
Salt Lake City
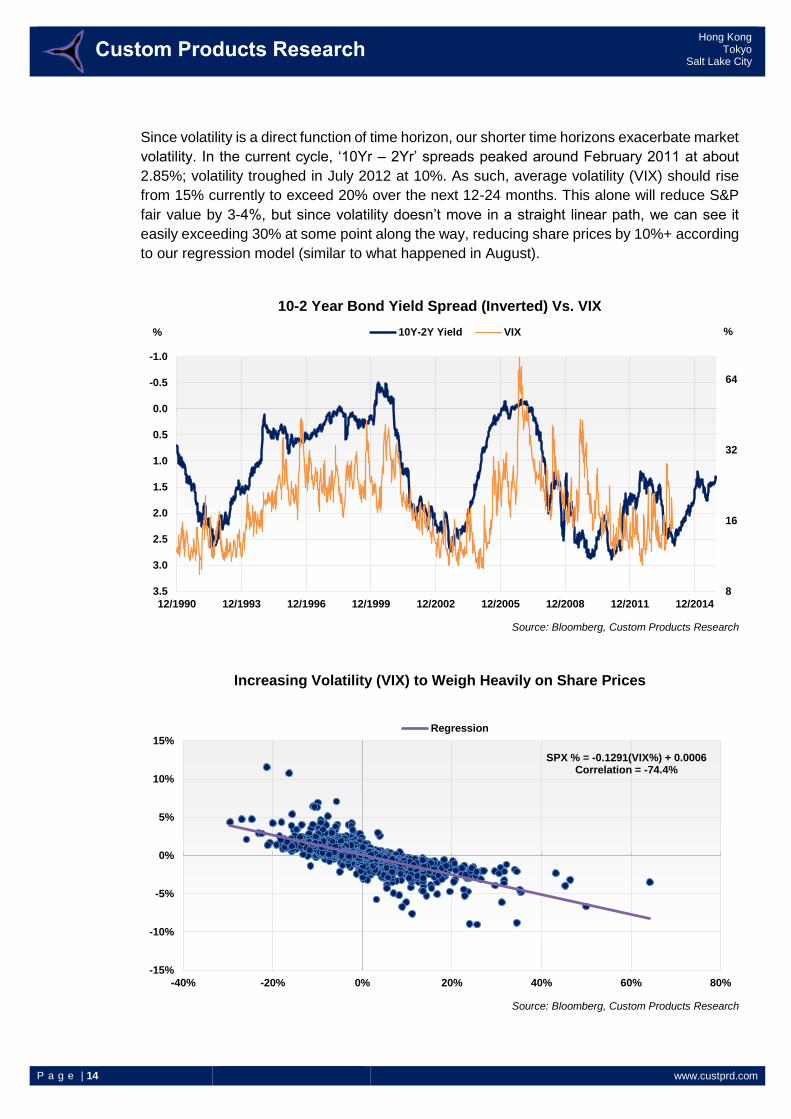
Since volatility is a direct function of time horizon, our shorter time horizons exacerbate market
volatility. In the current cycle, ‘10Yr – 2Yr’ spreads peaked around February 2011 at about
2.85%; volatility troughed in July 2012 at 10%. As such, average volatility (VIX) should rise
from 15% currently to exceed 20% over the next 12-24 months. This alone will reduce S&P
fair value by 3-4%, but since volatility doesn’t move in a straight linear path, we can see it
easily exceeding 30% at some point along the way, reducing share prices by 10%+ according
to our regression model (similar to what happened in August).
10-2 Year Bond Yield Spread (Inverted) Vs. VIX
Source: Bloomberg, Custom Products Research
Increasing Volatility (VIX) to Weigh Heavily on Share Prices
Source: Bloomberg, Custom Products Research
8
16
32
64
-1.0
-0.5
0.0
0.5
1.0
1.5
2.0
2.5
3.0
3.5
12/1990 12/1993 12/1996 12/1999 12/2002 12/2005 12/2008 12/2011 12/2014
10Y-2Y Yield VIX
SPX % = -0.1291(VIX%) + 0.0006Correlation = -74.4%
-15%
-10%
-5%
0%
5%
10%
15%
-40% -20% 0% 20% 40% 60% 80%
Regression
% %
P a g e | 15 www.custprd.com
Hong Kong Tokyo
Salt Lake City
I remember a lunch meeting with the Director of Research at the Federal Reserve in the
summer of 1999. Inflation had started to creep up from a low of 1.6% at the beginning of the
year, to over 2% by the summer and eventually reached 3.8% in the spring of 2000. The bond
market had gotten ahead of the Fed, with 10yr treasury rates rising from 4.7% in Jan to 6.5%
in June. “How are you looking at interest rates and how does it play into your investment
decisions”, he asked. I responded that I wasn’t really focused on the interest rate environment,
which seemed reasonable as a tech analyst with the internet bubble, strong software,
semiconductor and SPE equipment demand. Technology stock OP was growing at 25% and
another 50bp hike in the FF rate didn’t seem like such a big deal.
After the meeting, however, I regretted my flip response and only in the subsequent years
started to appreciate what an increase of FF rates from 5% to 6.5% could do to theoretical fair
values for stocks.
In the case of the S&P, analyst 3-yr EPS CAGR estimates (for the 3 years) to FY ’02 was
about 9.5%. If the risk free rate, 10 year treasuries, rose from 5.5% to 6% on back of a hike
in the FF rate, then theoretical S&P fair value would have fallen from about $1,750 to $1,710.
If a hike in short-term rates then lifted volatility, such that the equity risk premium rose 100bps,
then theoretical fair value would fall to about $1,140.
In addition, earnings started to disappoint toward the end of 2000, such that earnings actually
started to decline (as opposed to the 9.5% consensus growth estimates). By this time, the
Fed was frantically lowering policy rates which were basically offset by rising risk premiums
from declining earnings and uncertainty about the direction of GDP. The market didn’t start to
recover until early 2003, when earnings were beating expectations and the 475bps cut in the
FF rate in 2001 had started to take effect.
Obviously, the market today is nowhere near the overblown valuations of 1999 and growth
expectations not nearly as rosy, but the lesson is relevant nonetheless.
P a g e | 16 www.custprd.com
Hong Kong Tokyo
Salt Lake City
VIX & Z-Score
Source: Bloomberg, Custom Products Research
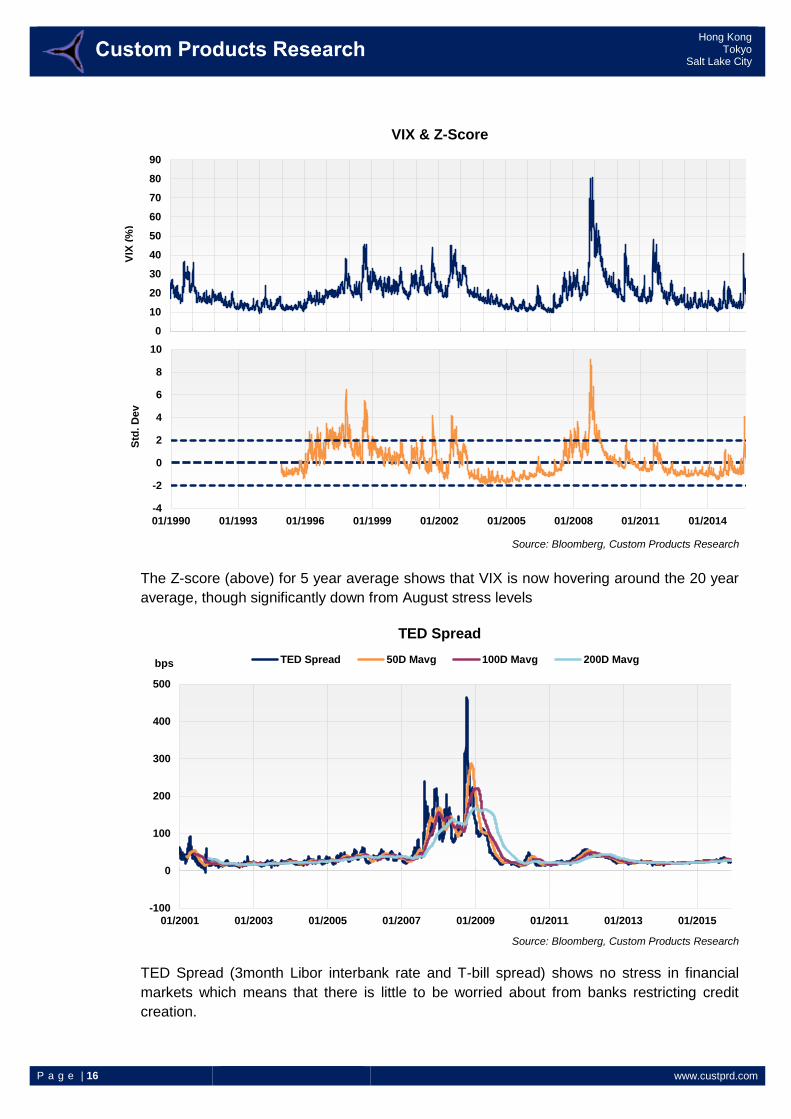
The Z-score (above) for 5 year average shows that VIX is now hovering around the 20 year
average, though significantly down from August stress levels
TED Spread
Source: Bloomberg, Custom Products Research
TED Spread (3month Libor interbank rate and T-bill spread) shows no stress in financial
markets which means that there is little to be worried about from banks restricting credit
creation.
-100
0
100
200
300
400
500
01/2001 01/2003 01/2005 01/2007 01/2009 01/2011 01/2013 01/2015
TED Spread 50D Mavg 100D Mavg 200D Mavg
0
10
20
30
40
50
60
70
80
90
-4
-2
0
2
4
6
8
10
01/1990 01/1993 01/1996 01/1999 01/2002 01/2005 01/2008 01/2011 01/2014
VIX
(%
) S
td. D
ev
bps
P a g e | 17 www.custprd.com
Hong Kong Tokyo
Salt Lake City
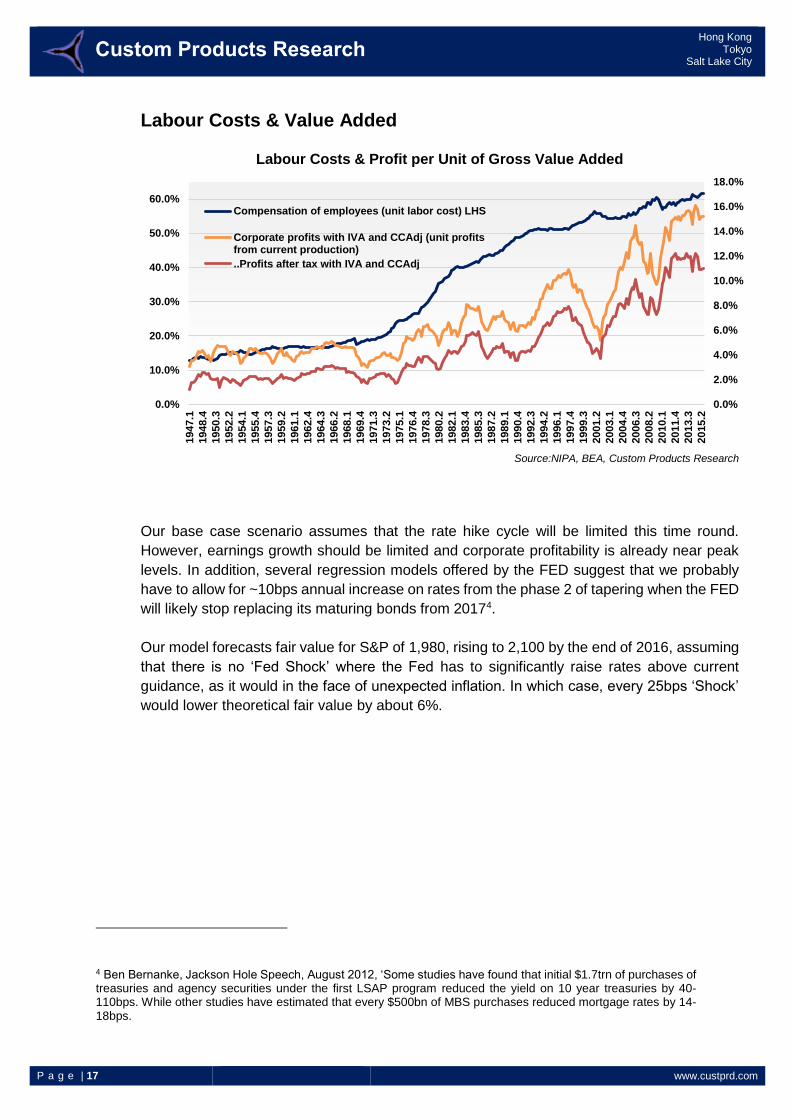
Labour Costs & Value Added
Labour Costs & Profit per Unit of Gross Value Added
Source:NIPA, BEA, Custom Products Research
Our base case scenario assumes that the rate hike cycle will be limited this time round.
However, earnings growth should be limited and corporate profitability is already near peak
levels. In addition, several regression models offered by the FED suggest that we probably
have to allow for ~10bps annual increase on rates from the phase 2 of tapering when the FED
will likely stop replacing its maturing bonds from 20174.
Our model forecasts fair value for S&P of 1,980, rising to 2,100 by the end of 2016, assuming
that there is no ‘Fed Shock’ where the Fed has to significantly raise rates above current
guidance, as it would in the face of unexpected inflation. In which case, every 25bps ‘Shock’
would lower theoretical fair value by about 6%.
4 Ben Bernanke, Jackson Hole Speech, August 2012, ‘Some studies have found that initial $1.7trn of purchases of treasuries and agency securities under the first LSAP program reduced the yield on 10 year treasuries by 40-110bps. While other studies have estimated that every $500bn of MBS purchases reduced mortgage rates by 14-18bps.
0.0%
2.0%
4.0%
6.0%
8.0%
10.0%
12.0%
14.0%
16.0%
18.0%
0.0%
10.0%
20.0%
30.0%
40.0%
50.0%
60.0%1947.1
1948.4
1950.3
1952.2
1954.1
1955.4
1957.3
1959.2
1961.1
1962.4
1964.3
1966.2
1968.1
1969.4
1971.3
1973.2
1975.1
1976.4
1978.3
1980.2
1982.1
1983.4
1985.3
1987.2
1989.1
1990.4
1992.3
1994.2
1996.1
1997.4
1999.3
2001.2
2003.1
2004.4
2006.3
2008.2
2010.1
2011.4
2013.3
2015.2
Compensation of employees (unit labor cost) LHS
Corporate profits with IVA and CCAdj (unit profitsfrom current production)
..Profits after tax with IVA and CCAdj
P a g e | 18 www.custprd.com
Hong Kong Tokyo
Salt Lake City
)
Important Disclosures:
This material was prepared for you and is for your information and use only. This material should only be distributed to other members of that organization on a need to know basis and should not be distributed or disseminated to any other person or entity.
This material is for information purposes only and it should not be regarded as an offer to sell or as a solicitation of an offer to buy the securities or other instruments mentioned in it. This material is based on current public information that Custom Products Group Limited ("Custom Products") considers reliable, but we make no representation that it is accurate or complete, and it should not be relied on as such. No investment opinion or advice is provided, intended, or solicited. Custom Products offers no warranty, either expressed or implied, regarding the veracity of data or interpretations of data included in this report. This material is provided with the understanding that Custom Products is not acting in a fiduciary capacity. Opinions expressed herein reflect the opinion of Custom Products and are subject to change without notice.
The products mentioned in this document may not be eligible for sale in some states or countries, and they may not be suitable for all types of investors. The value of and the income produced by products may fluctuate, so that an investor may get back less than they invested. Value and income may be adversely affected by exchange rates, interest rates, or other factors. Past performance is not necessarily indicative of future results. If a product is income producing, part of the capital invested may be used to pay that income. © 2015 Custom Products Group Limited. All rights reserved.
Hong Kong 15/F Langham Place 8 Argyle Street Mong Kok, Kowloon Hong Kong S.A.R.
Tokyo 17/F Roppongi Hills North Tower 6-2-31 Roppongi, Minato-ku, Tokyo Japan 106-0032
Office Locations
Hong Kong Simon Rigney
+852-3958-2394 (HK) +81-3-5786-3712 (Tokyo) [email protected]
Tokyo Robert Rowland
+81-3-5786-3711 [email protected]
Michael Newman
+81-3-5786-3713 [email protected]
Contacts
Salt Lake City Patrick Hansen
+852-8191-6925 (HK) +1-801-230-4796 (SLC) [email protected]
Salt Lake City 299 South Main Street Suite 1300 Salt Lake City, UT United States, 84111