us energy revolution faqs
TRANSCRIPT
7/27/2019 Us Energy Revolution Faqs
http://slidepdf.com/reader/full/us-energy-revolution-faqs 1/7
1 market insights
nsightsMarket
All examples in this report are hypothetical
interpretations o situations and are used or
explanation purposes only. The views in this report
reect solely those o the authors and not necessarily
those o CME Group or its afliated institutions.
This report and the inormation herein should not beconsidered investment advice or the results o actual
market experience.
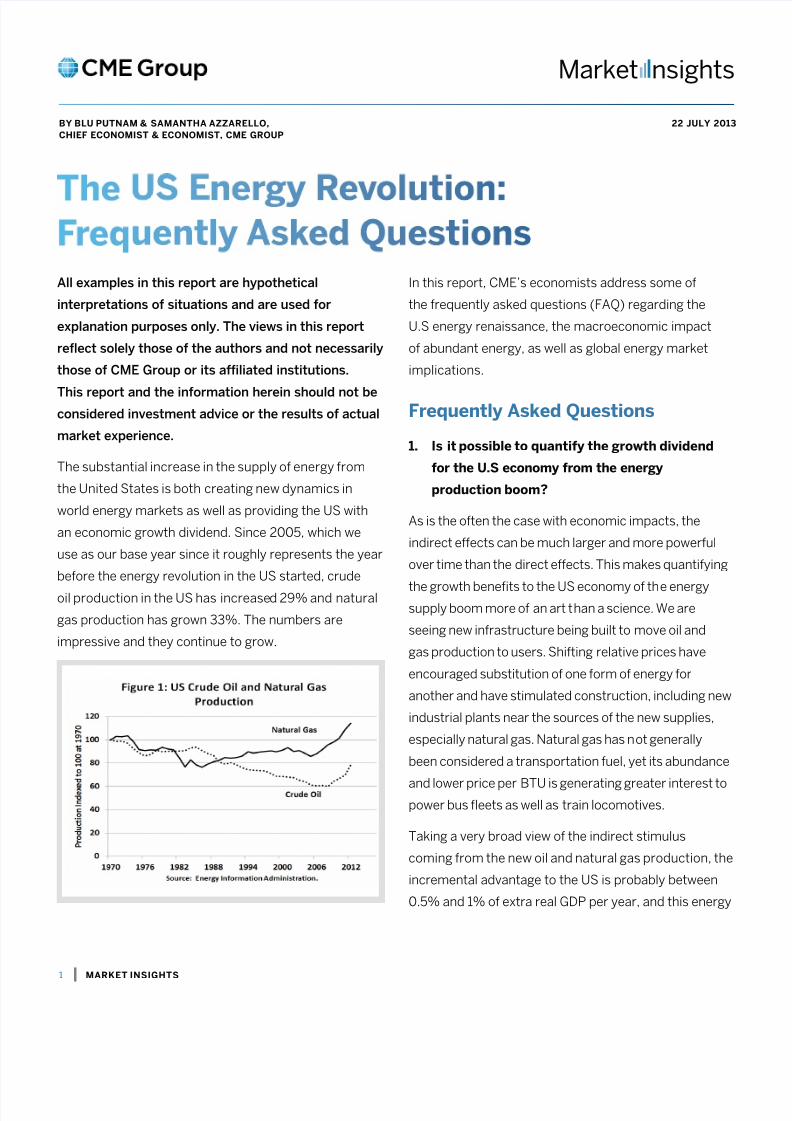
The substantial increase in the supply of energy from
the United States is both creating new dynamics in
world energy markets as well as providing the US with
an economic growth dividend. Since 2005, which we
use as our base year since it roughly represents the year
before the energy revolution in the US started, crude
oil production in the US has increased 29% and natural
gas production has grown 33%. The numbers are
impressive and they continue to grow.
In this report, CME’s economists address some of
the frequently asked questions (FAQ) regarding the
U.S energy renaissance, the macroeconomic impact
of abundant energy, as well as global energy market
implications.
Frequently Asked Questions
1. Is it possible to quantify the growth dividend
for the U.S econoy fro the energy
production boo?
As is the often the case with economic impacts, the
indirect effects can be much larger and more powerful
over time than the direct effects. This makes quantifying
the growth benets to the US economy of the energysupply boom more of an art than a science. We are
seeing new infrastructure being built to move oil and
gas production to users. Shifting relative prices have
encouraged substitution of one form of energy for
another and have stimulated construction, including new
industrial plants near the sources of the new supplies,
especially natural gas. Natural gas has not generally
been considered a transportation fuel, yet its abundance
and lower price per BTU is generating greater interest topower bus eets as well as train locomotives.
Taking a very broad view of the indirect stimulus
coming from the new oil and natural gas production, the
incremental advantage to the US is probably between
0.5% and 1% of extra real GDP per year, and this energy
22 JU 2013B BU PUTAm & SAmATA AzzARE,
CIEF ECmIST & ECmIST, CmE GRUP

7/27/2019 Us Energy Revolution Faqs
http://slidepdf.com/reader/full/us-energy-revolution-faqs 2/7

7/27/2019 Us Energy Revolution Faqs
http://slidepdf.com/reader/full/us-energy-revolution-faqs 3/7
JULY 22, 2013
3 market insights
3. ow has the US energy production booipacted trends in consuption?
Consumption trends have been quite interesting. US
oil consumption has actually been declining during the
last ve or six years just as oil production has increased.
The opposite pattern has occurred with natural gas,
with consumption rising more or less in tandem with
increased production. The reasons have to do with
relative prices and environmental issues. As noted in the
previous Q&A, compared to crude oil, natural gas is now
much cheaper in terms of a BTU of energy. Natural gas
is also a cleaner burning fuel than coal. Because of the
relative price difference in favor of natural gas, there has
been a tendency to consume the additional natural gas
domestically, at the expense of crude oil where possible.
In the electrical power generation industry, cleaner
burning natural gas has been aggressively substituted
for coal.
4. ow has the increased US energy production
affected trade patterns?
As might be expected, the primary initial impact of
rising US energy production on import and exports
was to lower crude oil imports into the US. Since the
additional natural gas production has largely been
consumed domestically, partly at the expense of coal
consumption for electrical power generation, exports
of coal also have increased rather sharply. Indeed, coal
exports were up over 100% in 2012 compared to 2007.

7/27/2019 Us Energy Revolution Faqs
http://slidepdf.com/reader/full/us-energy-revolution-faqs 4/7
JULY 22, 2013
4 market insights
5. What are the prospects for US energy
independence and how do regulatory issues
ipact the discussion?
US energy independence may be a fun political topic,
but energy independence is not particularly close
at hand. And, since it will be much more efcient to
continue to import certain energy supplies, what is
at stake is the US energy import/export gap, which
certainly has narrowed considerably. Moreover, for geo-
politics, it is the crude oil import-export balance thatmatters most. In terms of oil, the US is nowhere near
the point where exports would equal imports. Domestic
production would have to nearly double to achieve net
import/export neutrality, and that assumes continued
declines in domestic oil consumption.
Moreover, there are three regulatory issues that loom
large in the discussion of US energy independence.
First, there is the question of whether the section of
the Keystone pipeline to bring crude oil from northern
Canada to the US and ultimately the Gulf Coast will
be approved and built. Second, there are a variety of
restrictions on the export of liqueed natural gas (LNG)
although some permits are being issued to convert
import facilities to export facilities. And third, there is
the Jones Act that regulates the use of foreign ships
used in exporting domestic products. All of these issues
are contentious and complicated. In general the LNG
export restrictions and the Jones Act work to limit US
exports. This has the potential to make global pricing
less efcient while providing some security benets
from lowering the dependence on non-US energy
sources. The Keystone pipeline from Canada is a hot
button political issue in both the US and Canada. The
trade-off is jobs in the US from building the pipeline
relative to concerns about the environmental impact
from the source of the oil and its production methods in
the north of Canada. Canada appears committed to nd
alternative ways to move its oil to market, should the US
not approve the construction of the pipeline, but this is
not a given. An alternative pipeline exclusively in Canada
would also face environmental opposition. Rail transport
is more expensive than pipelines (once they are built),
although the relative safety record is up for debate. For
the most part, these are long-term issues, and as they
play-out we will incorporate them into our analysis.
6. The WTI-Brent spread receives intense focus in
the energy counity. ow has the US energy
boo ipacted the Brent-WTI spread?
There are two primary issues for the Brent-WTI
spread. First, there is the relative supply issue. US
WTI and related crude oil production is increasing. UK
and Norwegian crude oil production from the North
Sea (Brent) is declining. As earlier, we focus on the
period from 2005, which roughly dates when the US
energy revolution began. New crude oil supplies in the
US, however, did not unambiguously overwhelm the
distribution system until early 2011. Also, one cannot
forget, as well, that oil production is increasing in
7/27/2019 Us Energy Revolution Faqs
http://slidepdf.com/reader/full/us-energy-revolution-faqs 5/7
JULY 22, 2013
5 market insights
the Middle East (Iraq and Libya are back online), the
Russian Federation, and China. Oil is a global market.
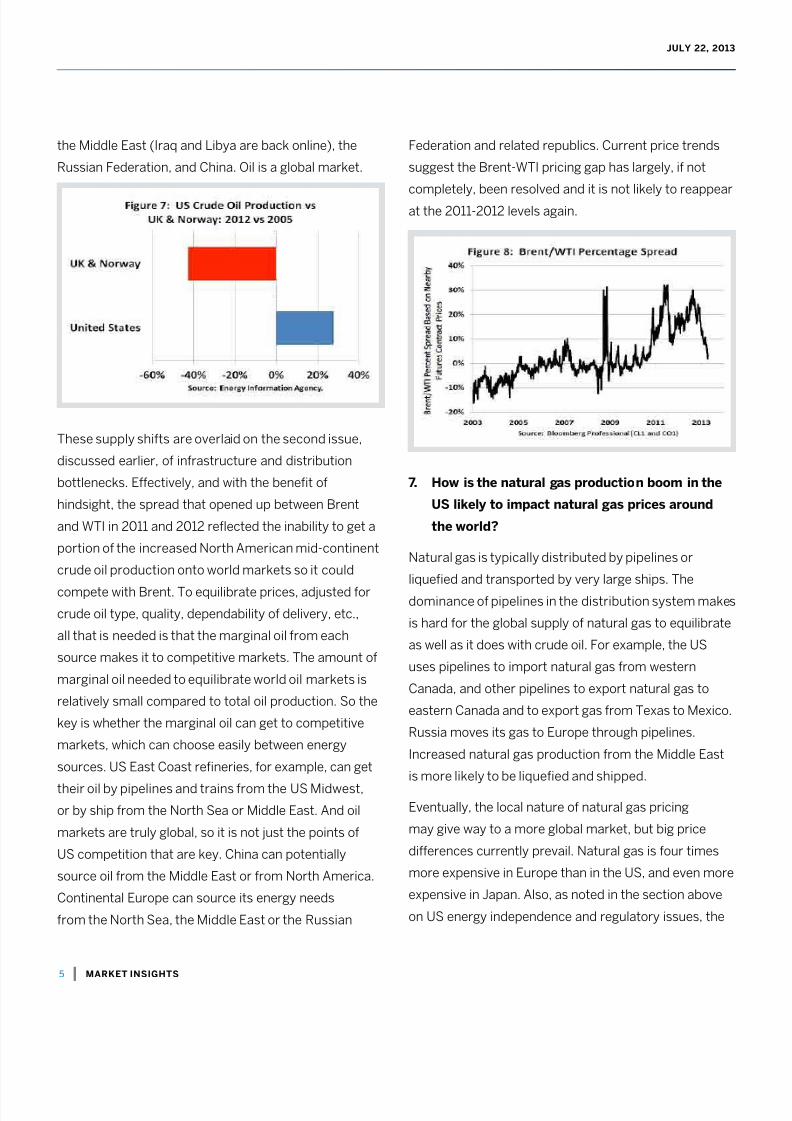
These supply shifts are overlaid on the second issue,
discussed earlier, of infrastructure and distribution
bottlenecks. Effectively, and with the benet of
hindsight, the spread that opened up between Brent
and WTI in 2011 and 2012 reected the inability to get a
portion of the increased North American mid-continent
crude oil production onto world markets so it could
compete with Brent. To equilibrate prices, adjusted for
crude oil type, quality, dependability of delivery, etc.,
all that is needed is that the marginal oil from each
source makes it to competitive markets. The amount of
marginal oil needed to equilibrate world oil markets is
relatively small compared to total oil production. So the
key is whether the marginal oil can get to competitive
markets, which can choose easily between energy
sources. US East Coast reneries, for example, can get
their oil by pipelines and trains from the US Midwest,
or by ship from the North Sea or Middle East. And oil
markets are truly global, so it is not just the points of
US competition that are key. China can potentially
source oil from the Middle East or from North America.
Continental Europe can source its energy needs
from the North Sea, the Middle East or the Russian
Federation and related republics. Current price trends
suggest the Brent-WTI pricing gap has largely, if not
completely, been resolved and it is not likely to reappear
at the 2011-2012 levels again.
7. ow is the natural gas production boo in the
US likely to ipact natural gas prices around
the world?
Natural gas is typically distributed by pipelines or
liqueed and transported by very large ships. The
dominance of pipelines in the distribution system makes
is hard for the global supply of natural gas to equilibrate
as well as it does with crude oil. For example, the US
uses pipelines to import natural gas from western
Canada, and other pipelines to export natural gas to
eastern Canada and to export gas from Texas to Mexico.
Russia moves its gas to Europe through pipelines.
Increased natural gas production from the Middle East
is more likely to be liqueed and shipped.
Eventually, the local nature of natural gas pricing
may give way to a more global market, but big price
differences currently prevail. Natural gas is four times
more expensive in Europe than in the US, and even more
expensive in Japan. Also, as noted in the section above
on US energy independence and regulatory issues, the

7/27/2019 Us Energy Revolution Faqs
http://slidepdf.com/reader/full/us-energy-revolution-faqs 6/7
JULY 22, 2013
6 market insights
US has a number of important constraints preventing
large scale exports of natural gas from the US.
In Europe, there is a pricing battle that is developing,more from non-US sources. Russia’s Gazprom typically
prices natural gas as a spread to Brent in its long-term
contracts. Norway’s Statoil is experimenting with
more exible natural gas contracts not tied to Brent.
As sources from all over the world compete to provide
liqueed natural gas to Europe (i.e., from the Middle
East, increased gas production from Norway, as well as
US), the Europe-US natural gas price gap should narrow.
The Russian government gets a huge percentage of itsrevenue from energy taxes and fees, so it is intricately
involved in the natural gas pricing debate. The process
of getting the marginal natural gas to competitive
market points, however, will take decades rather than
years, until liqueed natural gas becomes a viable
option in a number of local markets, making the whole
pricing process more globally integrated.
8. With ore energy production in orth Aerica,
is it possible that the arket ipact of geo-
political disruptions becoe less iportant?
One of the hard to quantify implications of the US and
Canadian energy boom is whether it makes global oil
markets less susceptible to large price shocks from
geo-political events. Our perspective is that an increased
supply from sources that are considered more stable
should lessen the shock effect from a geo-political
disturbance, say, emanating from the Middle East. Wedo not want, however, to overstate this case. As we have
argued in previous Q&A, what matters in terms of setting
global market prices are the competition points for the
marginal supply and demand of oil. A disturbance in
Egypt, which is not a major producer of oil, is not going to
have the impact of a disturbance in Iraq or Iran. Indeed,
the continued ability of Saudi Arabia to serve as a buffer
producer probably will have more long-term impact on
the impact of geo-politics on global oil pricing than the
increased US supply. And, in the long-run, the shifts in
demand, with China drawing ever more heavily on Middle
East oil, while the US becomes less reliant on this source,
may well have political dimensions that are at this stage
very hard to decipher.
9. as there been an ipact on US ination fro
the energy boo?
The increased production of both crude oil and natural
gas in the US probably has contributed to the subdued
ination rates of the past few years, although the depth
of the nancial recession was far and away a more
important factor. For our analysis, we need to go back
to the discussion of the BTU pricing gap, the Brent-WTI
spread, and the building out of the US distribution
infrastructure. To the extent that energy sources are
not priced on world markets, then US ination has
been slowed due to the increased supplies to a greater
extent than might otherwise have been the case. As
the Brent-WTI spread disappears and the BTU pricing
gap between natural gas and oil narrows, the ination
benet is reduced, and it was probably relatively small
to begin with in terms of the whole of the US economy.
One area, though, where natural gas has impacted
specic prices, if not general ination is in the electrical
power sector. Natural gas is generally used by manyelectrical power producers as the marginal fuel. Our
analysis has found that the relationship between natural
gas prices and power prices has been changing since
approximately 2008. Gas prices have been having
increasing inuence on power prices, and this trend is

7/27/2019 Us Energy Revolution Faqs
http://slidepdf.com/reader/full/us-energy-revolution-faqs 7/7
JULY 22, 2013
7 market insights
CME Group is a trademark of CME Group Inc. The Globe Logo, CME, Chicago Mercantile Exchange and Globex are trademarks of Chicago Mercantile.
Exchange Inc. CBOT and the Chicago Board of Trade are trademarks of the Board of Trade of the City of Chicago, Inc. New York Mercantile Exchange and NYMEX are
registered trademarks of the New York Mercantile Exchange, Inc. COMEX is a trademark of Commodity Exchange, Inc.
The information within this brochure has been compiled by CME Group for general purposes only. CME Group assumes no responsibility for any errors or omissions.
Although every attempt has been made to ensure the accuracy of the information within this brochure. Additionally, all examples in this brochure are hypothetical
situations, used for explanation purposes only, and should not be considered investment advice or the results of actual market experience.
Copyright © 2013 CME Group. All rights reserved.
All examples in this report are hypothetical interpretations of situations and are used for explanation
purposes only. The views in this report reect solely those of the authors and not necessarily those of
CME Group or its afliated institutions. This report and the information herein should not be considered
investment advice or the results of actual market experience.
only getting stronger. Hence, uctuations in natural gas
prices can impact electrical power rates to consumers,
with a lag and with considerable slippage given the
regulatory processes that help to set electricity rates.
Keep in mind, though, that power production in the U.S is
extremely regional – with different load proles, seasonal
trends and generation capacity in different regions (or
ISO – Independent System Operator) of the country.