u.s. department of commerce weather...
TRANSCRIPT
U.S. DEPARTMENT OF COMMERCE
WEATHER BUREAU
TECHNICAL PAPER NO. 43
Rainfall-Frequency Atlas
of the Hawaiian Islands
for Areas to 200 Square Miles., Durations to 24 Hours.,
and Return Periods from 1 to 100 Years
U.S. DEPARTMENT OF COMMERCE LUTHER H. HoDGES, Secretary
WEATHER BUREAU F. W. REICHELDERFER. Chief
TECHNICAL PAPER NO. 43
Rainfall-Frequency Atlas of the Hawaiian Islands
for Areas to 200 Square Miles, Durations to 24 Hours,
and Return Periods from 1 to 100 Years Prepared by
Cooperative Studies Section
Hydrologic Services Division
U.S. Weather Bureau for
Engineering Division
Soil Conservation Service
U.S. Department of Agriculture
WASHINGTON, D.C.
1962
For oale by the Superintendent of Documento, U.S. Government Printing Office, Waobington 25, D.C. • • • • • • - - • • - • • • Price 40 cento
CONTENTS Pa&'e
1. Introduction-------------------------------------------------------------------------------------- 1 2. RainfallRe~me----------------------------------------------------------------------------------- 1 3. Rain gage Distribution______________________________________________________________________________ 2 4. Basic Data _______________________________________________________________________________ --------- 2
5. Frequency Jlnalysis-------------------------------------------------------------------------------- 3 6. Isopluvial Maps __ -------- ____ -------- _____________________ ------- ______________________ ----------- 4 7. Depth-Area Relationships _________________________________________________________________ -_________ 5
8. Seasonal Variation--------------------------------------------------------------------------------- 5 9. Probable Maximum Precipitation ___________________________________________________ - ______ --- ___ --__ 8
References------------------------------------------------------------------------------------------- 8
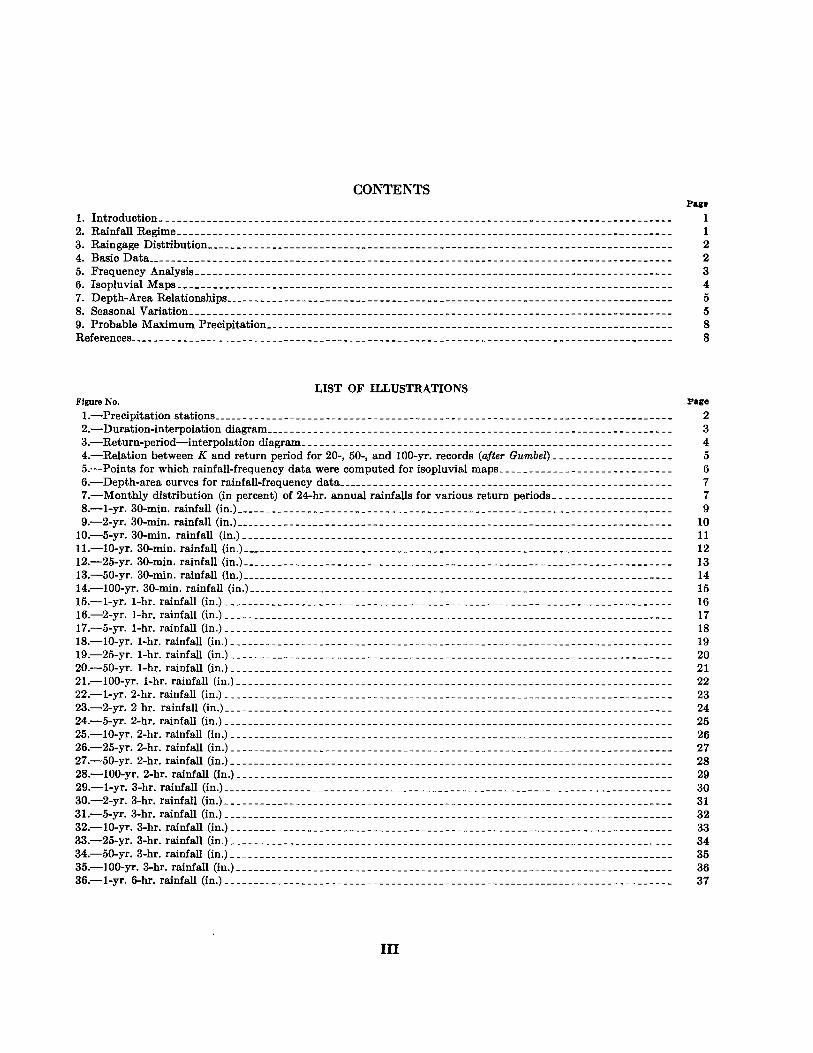
LIST OF ILLUSTRATIONS Figure No. Page 1.-Precipitation stations_____ _ _ _ _ _ _ _ _ _ _ _ _ _ _ _ _ _ _ _ _ _ _ _ _ _ _ _ _ _ _ _ _ _ _ _ _ _ _ _ _ _ _ _ _ _ _ _ _ _ _ _ _ _ _ _ _ _ _ _ _ _ _ _ _ _ _ _ _ _ _ _ _ 2 2.-Duration-interpolation diagram ________________________________________________ . _ _ _ _ _ _ _ _ _ _ _ _ _ _ _ _ _ _ _ 3 3.-Return-period-interpolation diagram______________________________________________________________ 4 4.-Relation between K and return period for 20-, 50-, and 100-yr. records (after Gumbel)____________________ 5 5.-Points for which rainfall-frequency data were computed for isopluvial maps_____________________________ 6 6.-Depth-area curves for rainfall-frequency data ______________________________________________ -----_____ 7 7.-Monthly distribution (in percent) of 24-hr. annual rainfalls for various return periods____________________ 7 8.-1-yr. 30-min. rainfall (in.)_________________________________________________________________________ 9 9.-2-yr. 30-rnin. rainfall (in.)_________________________________________________________________________ 10
10.-5-yr. 30-rnin. rainfall (in.) _________________________________________________________________ ------- 11 11.-10-yr. 30-min. rainfall (in.)________________________________________________________________________ 12 12.-25-yr. 30-rnin. rainfall (in.)________________________________________________________________________ 13 13.-50-yr. 30-rnin. rainfall (in.)________________________________________________________________________ 14 14.-100-yr. 30-rnin. rainfall (in.) _______ -------_________________________________________________________ 15 15.-1-yr. 1-hr. rainfall (in.)___________________________________________________________________________ 16 16.-2-yr. 1-hr. rainfall (in.)___________________________________________________________________________ 17 17.-5-yr. 1-hr. rainfall (in.)___________________________________________________________________________ 18 18.-10-yr. 1-hr. rainfall (in.)__________________________________________________________________________ 19 19.-25-yr. 1-hr. rainfall (in.)__________________________________________________________________________ 20 20.-50-yr. 1-hr. rainfall (in.)__________________________________________________________________________ 21 21.-100-yr. 1-hr. rainfall (in.) ____________________________________________________________ ------------- 22
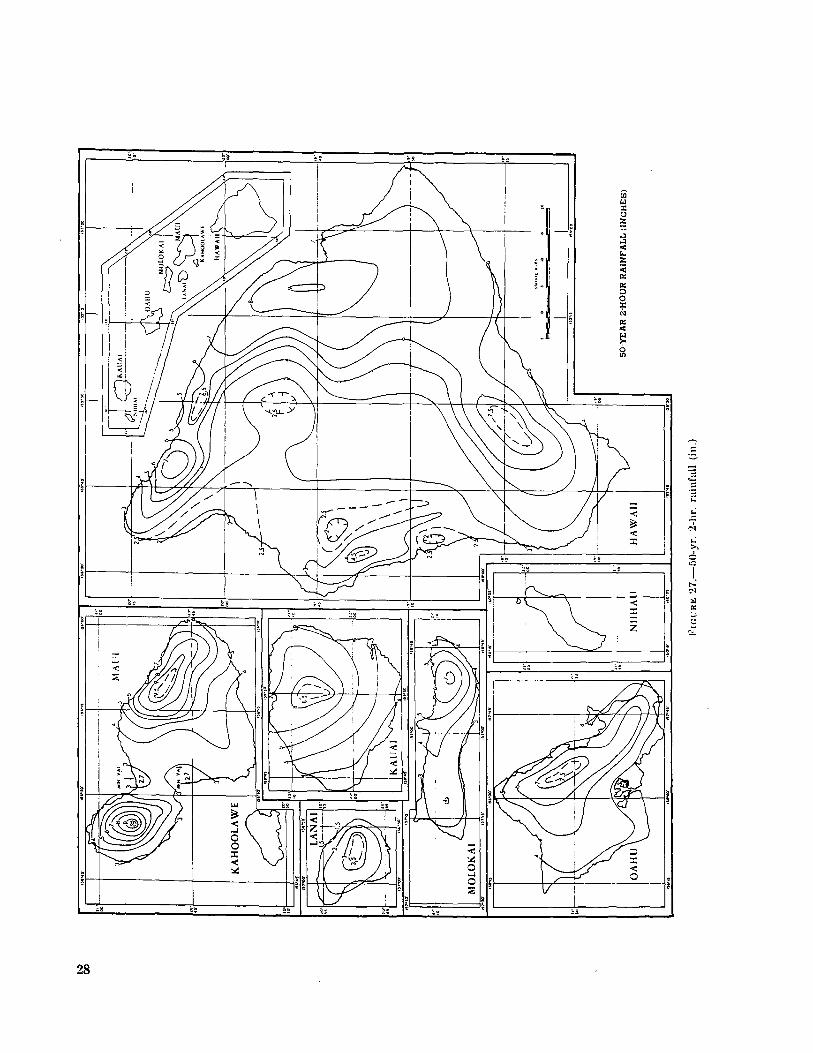
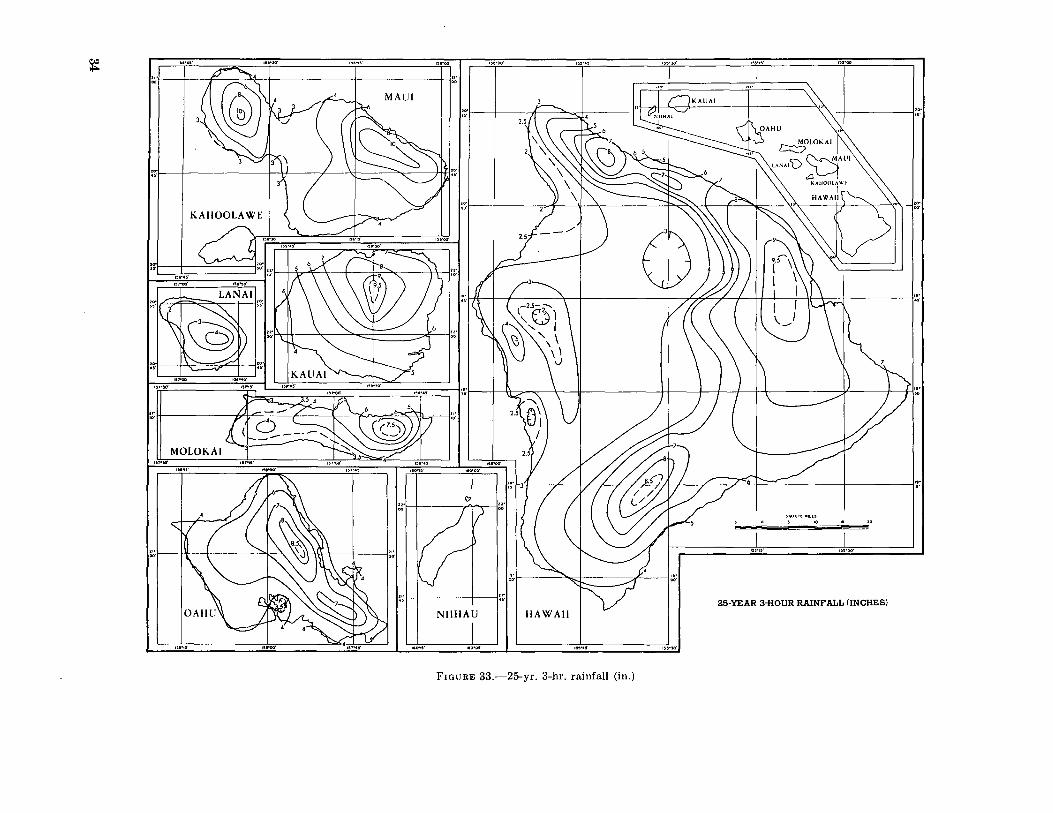
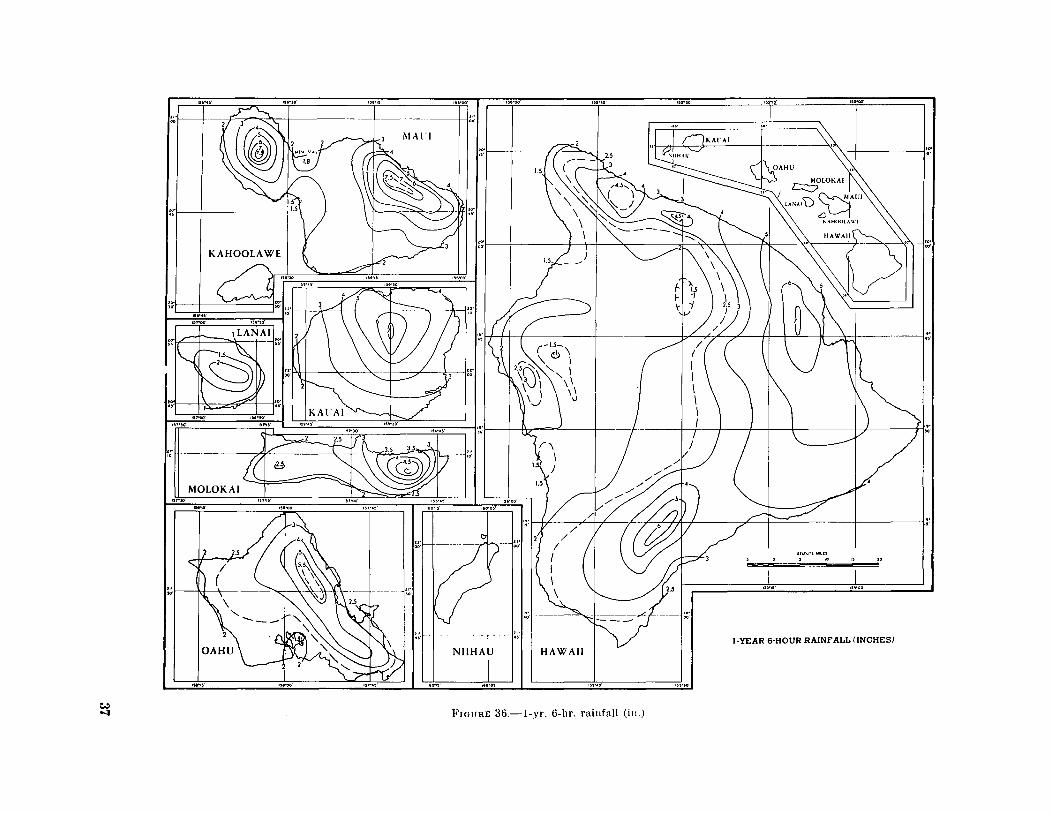
22.-1-yr. 2-hr. rainfall (in.)--------------------------------------------------------------------------- 23 23.-2-yr. 2 hr. rainfall (in.)___________________________________________________________________________ 24 24.-5-yr. 2-hr. rainfall (in.)___________________________________________________________________________ 25 25.-10-yr. 2-hr. rainfall (in.)__________________________________________________________________________ 26 26.-25-yr. 2-hr. rainfall (in.)__________________________________________________________________________ 27 27.-50-yr. 2-hr. rainfall (in.)__________________________________________________________________________ 28 28.-100-yr. 2-hr. rainfall (in.)_________________________________________________________________________ 29 29.-1-yr. 3-hr. rainfall (in.)___________________________________________________________________________ 30 30.-2-yr. 3-hr. rainfall (in.)___________________________________________________________________________ 31 31.-5-yr. 3-hr. rainfall (in.)___________________________________________________________________________ 32 32.-10-yr. 3-hr. rainfall (in.)__________________________________________________________________________ 33 33.-25-yr. 3-hr. rainfall (in.)__________________________________________________________________________ 34 34.-50-yr. 3-hr. rainfall (in.)__________________________________________________________________________ 35 35.-1 00-yr. 3-hr. rainfall (in.)_________________________________________________________________________ 36 36.-1-yr. 6-hr. rainfall (in.)___________________________________________________________________________ 37
III
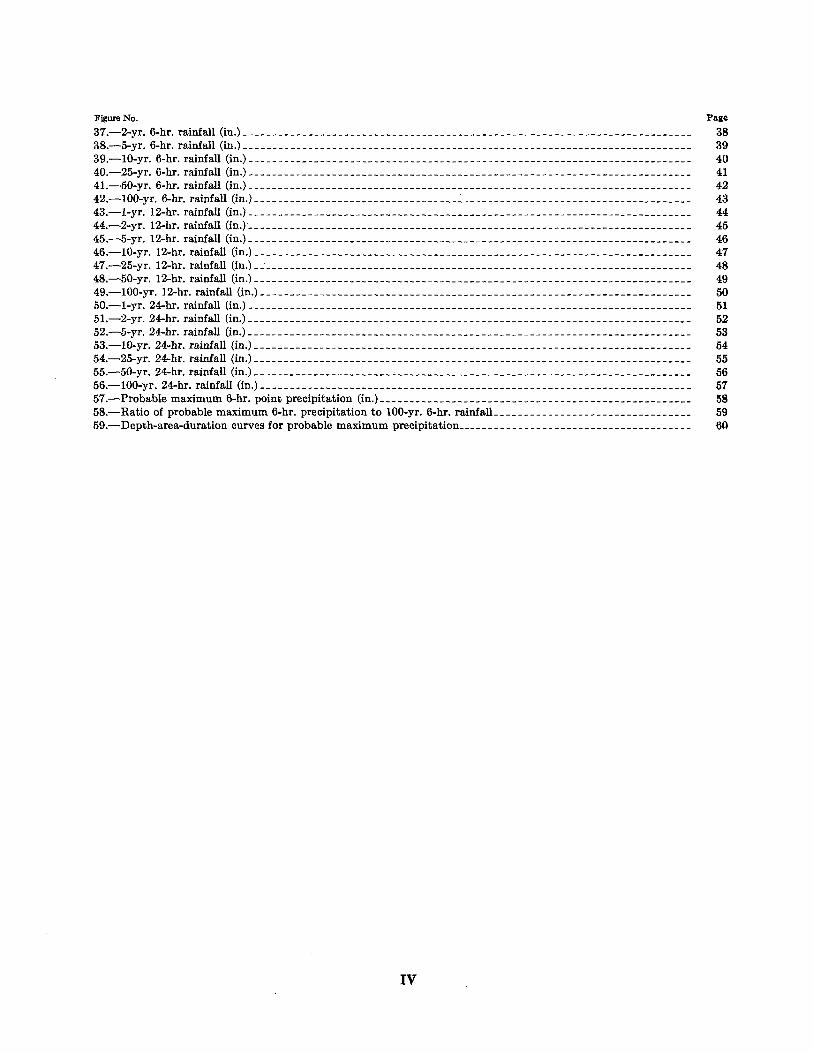
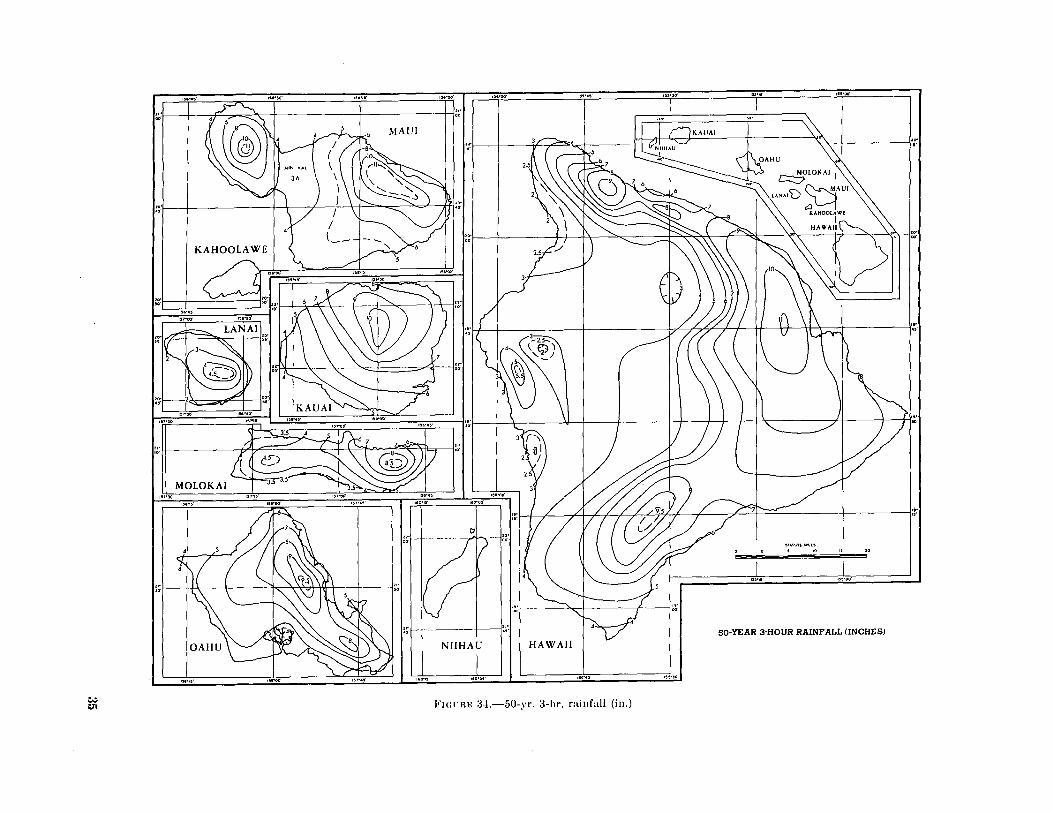
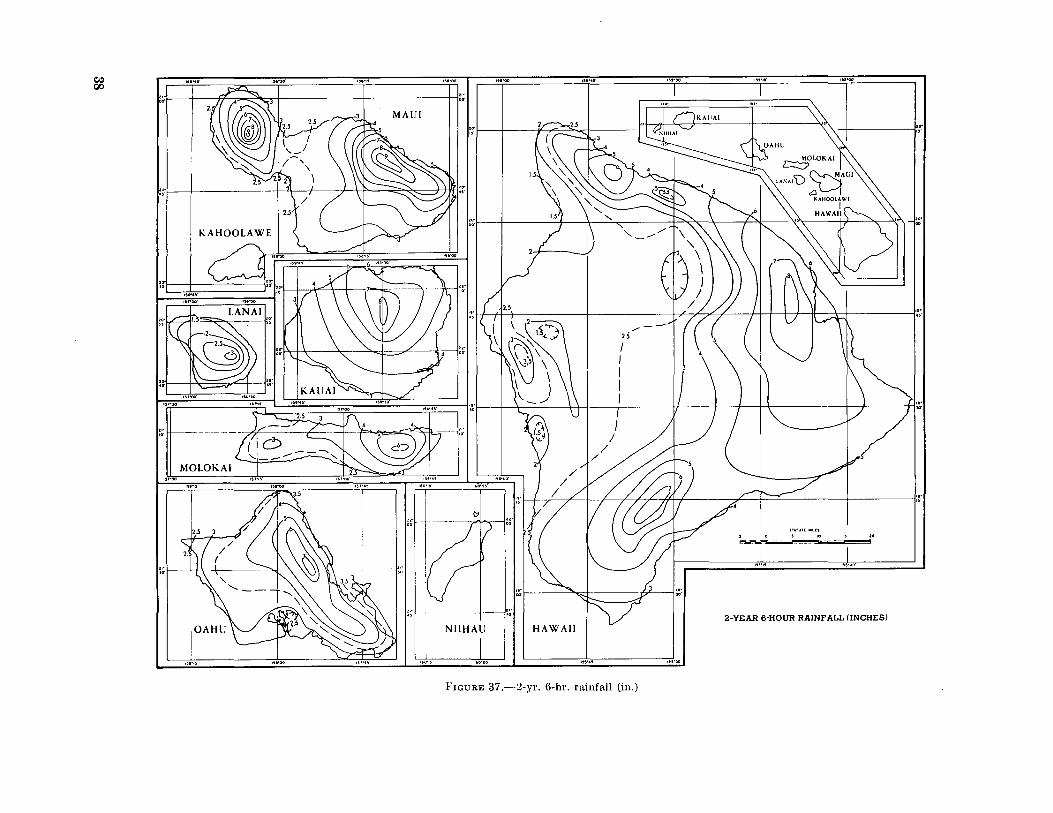
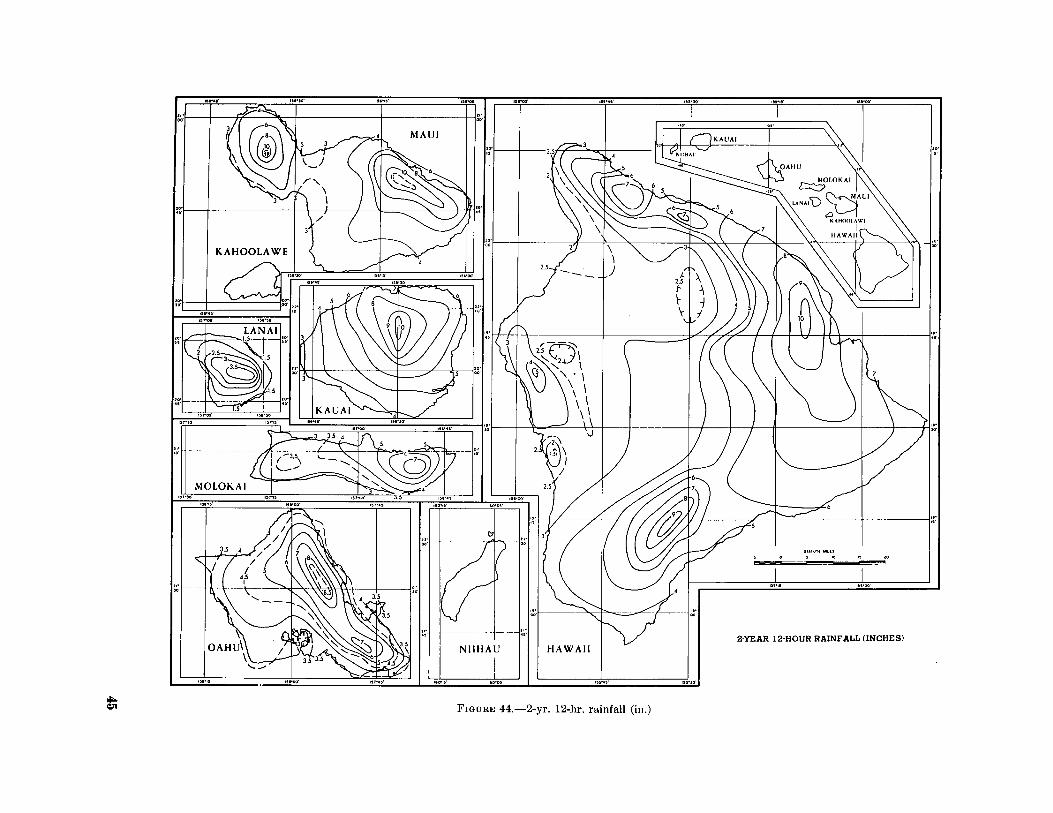
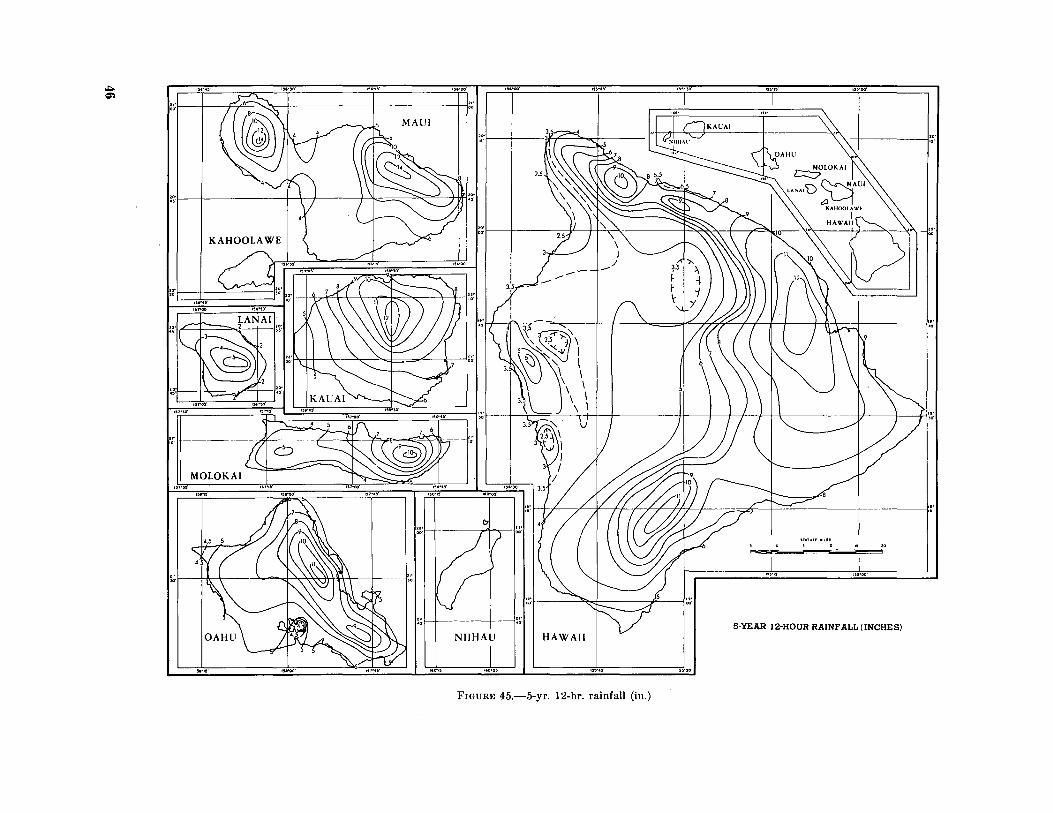
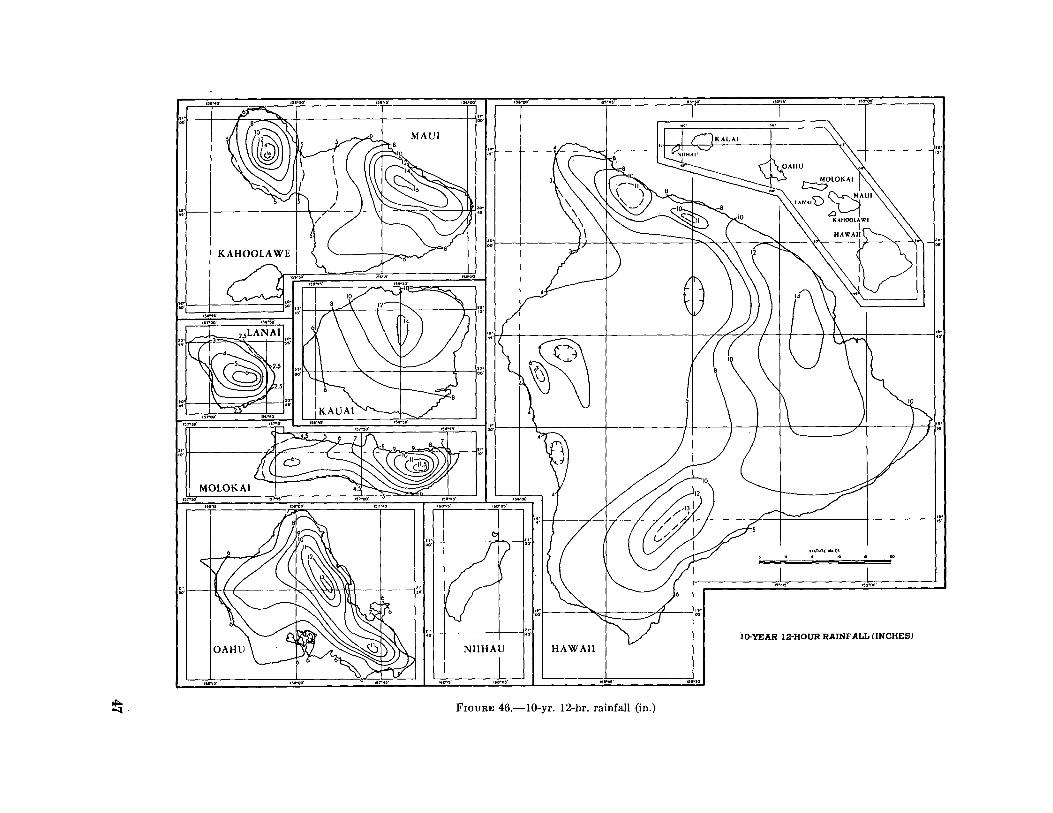
Figure No. PaKe 37.-2-yr. 6-hr. rainfall (in.) ______________________________________________________________ ----_________ 38 38.-5-yr. 6-hr. rainfall (in.) ______________________________________________________ ----_________________ 39 39.-10-yr. 6-hr. rainfall (in.) _______ -------- ______ ---- ____________________ -----_-_-_--- _____ ------_____ 40 40.-25-yr. 6-hr. rainfall (in.)__________________________________________________________________________ 41 41.-50-yr. 6-hr. rainfall (in.) ___________________________________________________________ ----___________ 42 42.-100-yr. 6-hr. rainfall (in.) ______________ ----- _______________ ~---___________________________________ 43 43.-1-yr. 12-hr. rainfall (in.)__________________________________________________________________________ 44 44.-2-yr. 12-hr. rainfall (in.)__________________________________________________________________________ 45 45.-5-yr. 12-hr. rainfall (in.) __________ -------- _____________________________________ ------------------_ 46 46.-10-yr. 12-hr. rainfall (in.) ___________________ ---- _______________________________ ------------------- 47 47.-25-yr. 12-hr. rainfall (in.) __ . ______________________________________________________ ---- __ ----_------ 48 48.-50-yr. 12-hr. rainfall (in.) ____________________________________________________________ ---------____ 49 49.-100-yr. 12-hr. rainfall (in.) ____ --- _____________________________________________________ ------------ 50 50.-1-yr. 24-hr. rainfall (in.)- ______________________________________________________________ ----------- 51 51.-2-yr. 24-hr. rainfall (in.)__________________________________________________________________________ 52 52.-5-yr. 24-hr. rainfall (in.) __________ ------ ____________________________________________ -------------- 53 53.-10-yr. 24-hr. rainfall (in.)_________________________________________________________________________ 54 54.-25-yr. 24-hr. rainfall (in.)_________________________________________________________________________ 55 55.-50-yr. 24-hr. rainfall (in.)_________________________________________________________________________ 56 56.-100-yr. 24-hr. rainfall (in.)________________________________________________________________________ 57 57.-Probable maximum 6-hr. point precipitation (in.) _______________ --------- _______________ ---------____ 58 58.-Ratio of probable maximum 6-hr. precipitation to 100-yr. 6-hr. rainfalL________________________________ 59 59.-Depth-area-duration curves for probable maximum precipitation_______________________________________ 60
IV

RAINFALL-FREQUENCY ATLAS OF THE HAWAIIAN ISLANDS
for Areas to 200 Square Miles, Durations to 24 Hours, and Return Periods from l to 100 Years
1. INTRODUCTION
Authority. This report was prepared for the Soil Conservation Service to provide rainfall criteria for planning and design purposes in connection with its Watershed Protection and Flood Prevention Program (authorization: P.L. 566, 83d Congress, and as amended).
Accuracy of results. The rainfall-frequency data presented in this report are believed to be as accurate as available basic data and current statistical procedures permit. As time passes more data will become available through increases in length of record and probably in density of station networks. Better network planning may also be expected. More reliable estimates of rainfall-frequency data may be possible in the near future, say 10 years from now.
Acknowledgments. The project was under the general supervision of J. L. H. Paulhus, Chief of the Cooperative Studies Section of the Hydrologic Services Division, W. E. Hiatt, Chief. D. M. Hershfield directed the statistical investigations required for determining the rainfall-frequency data. J. F. Miller and L. L. Weiss investigated the meteorological aspects of the problem. D. I. Blumenstock, former Pacific Area Climatologist, Honolulu, provided some very useful information on the rainfall regimes of the Hawaiian Islands and some unpublished pertinent manuscripts. M. J. Brown, present Pacific Area Climatologist, and S. Price reviewed the manuscript and made several pertinent suggestions. W. E. Miller and N. S. Foat supervised the collection and processing of basic data. Drafting was supervised by C. W. Gardner. Coordination with the Soil Conservation Service was maintained through H. 0. Ogrosky, Chief, Hydrology Branch. Engineering Division.
2. RAINFALL REGIME
Knowledge of the geographic features of the Hawaiian Islands is required in order to understand the characteristics of their rainfall. The major islands of the Hawaiian chain are: Hawaii, Maui, Oahu, Kauai, Molokai, Kahoolawe, Lanai, and Niihau. These islands are located in the midPacific in the area 19°-22° N., 155°-160° W. This location places the islands in the northeast trade-wind belt on the southern side of the semipermanent Pacific High cell. Their precipitation regimes are greatly influenced by the temperature inversion (increase of temperature with altitude) characteristic of the trade-wind belt.
The trade-wind inversion is formed by broadscale subsidence of air from high altitudes in the eastern extremities of subtropical Highs. The descent of the subsiding air is halted by the lowlevel maritime air flowing equatorward. The inversion marks the boundary between the two strata, which flow horizontally in the same direction. The height of the base of the inversion may vary from about 1,000 to over 8,000 ft. above sea level. The air layer below the inversion is moist and contains a great deal of cloudiness (trade-wind cumulus). Above the inversion the air is warm and very dry. In order for heavy rains to occur over the islands the inversion must be very high or it must be destroyed.
The trade winds are the prevailing weather influence in all seasons. Frequent heavy showers are characteristic of the windward districts. In general, the 6-month period November-April has more rain than May-october. Monthly rainfall amounts may show a phenomenal range, and the amounts for a few days occasionally exceed the annual normals.
Another important precipitation factor is the topography of the islands. The topography
1

ranges from the relatively uniform elevation changes on the island of Hawaii to the irregular, rough, much dissected surface of Kauai. The highest elevations are on Hawaii, where Mauna Kea and Mauna Loa rise to nearly 14,000 ft. Mt. Haleakala on Maui is 10,025 ft. high; Kawaikini Peak on Kauai, 5,170ft.; and Mt. Kaala on Oahu, 4,025 ft. Over half of the total area of the islands lies within 5 mi. of the shores. Onefourth of the area is above 4,500 ft.; and slightly over one-fourth is below 1,000 ft., which is where most of the population lives.
3. RAIN GAGE DISTRIBUTION
There are reported to be about 1300 rain gages on the islands. Most gages are privately owned and operated. No provision was made in the past for analysis or publication of records from such
gages. Most gages are located at the lower elevations where most of the population is concentrated. About 90 percent of the gages are in areas of light to moderate rainfall, hence they tend to yield somewhat biased samplings. A complete and detailed history of Hawaiian rainfall stations has been published [1]. Few stations are equipped with recording gages. A large number of the nonrecording gages are read only after each storm, semiweekly, weekly, biweekly, monthly, or seasonally. Figure 1 shows the distribution of rainfall stations, both active and discontinued, with at least 5 years of record.
4.- BASIC DATA
Station data. Table 1 groups the number of daily precipitation stations on each island by length of record as of 1959, the last complete
PRECIPITATION STATIONS
L£G£ND
•D•ri,(Uo....,..,,_
FIGURE 1.-Precipitation stations
2
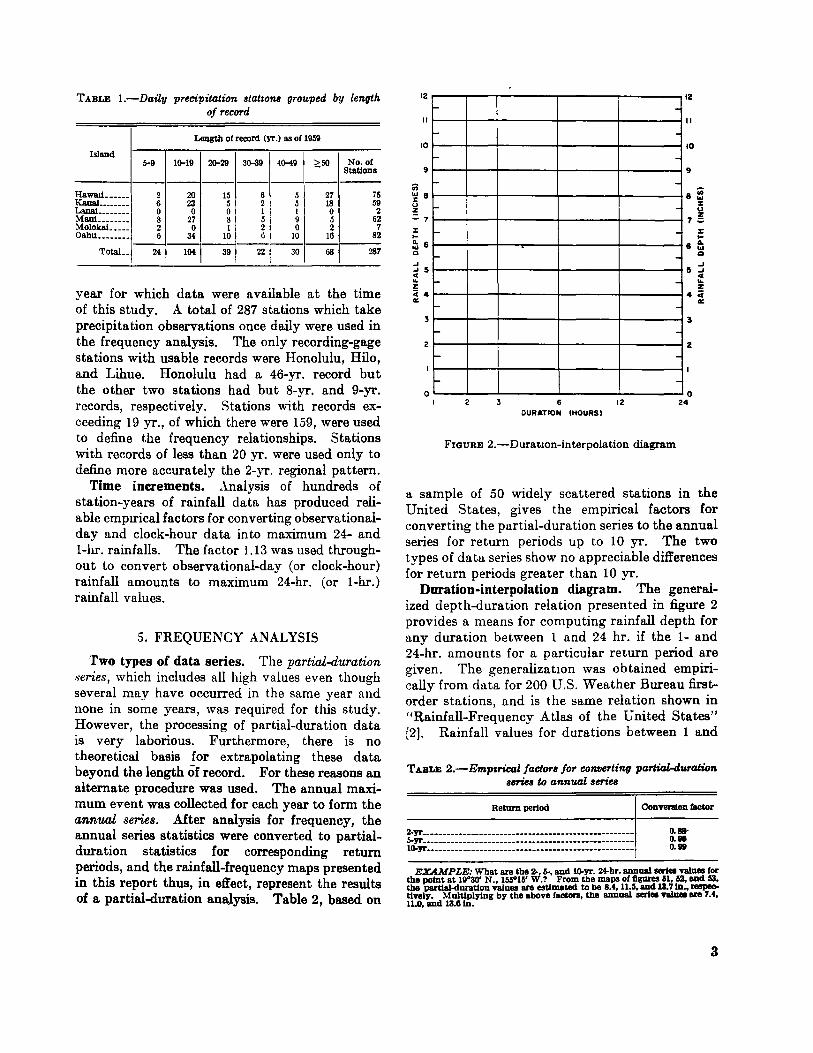
TABLE I.-Daily precipitation statzom grouped by length of record
Length of record (yr.) as of 1959
Island 1G-19 20-29 3G-39 No. of
Stations 4Q-491 ----1--I-------·1---1---HaWIIli______ 2 20 15 6 5 27 75 Kaual________ 6 23 5 2 5 18 59
~".:1:======= ~ 2~ ~ ~ ~ ~ 6~ MolokaL____ 2 0 1 2 0 2 7 Oahu________ 6 34 10 6 __ 10 ___ 1_6 ___ s2
Total __ --2-4j1Mj--a-9 ---z2 30 68 287
vear for which data were available at the time ;f this study. A total of 287 stations which take precipitation observations once daily were used in the frequency analysis. The only recording-gage stations with usable records were Honolulu, Hilo, and Lihue. Honolulu had a 46-yr. record but the other two stations had but 8-yr. and 9-yr. records, respectively. Stations with records exceeding 19 yr., of which there were 159, were used to define the frequency relationships. Stations with records of less than 20 yr. were used only to define more accurately the 2-yr. regional pattern.
Time increments. Analysis of hundreds of station-years of rainfall data has produced reliable emprrical factors for converting observationalday and clock-hour data into maximum 24- and 1-hr. rainfalls. The factor 1.13 was used throughout to convert observational-day (or clock-hour) rainfall amounts to maximum 24-hr. (or 1-hr.) rainfall values.
5. FREQUENCY ANALYSIS
Two types of data series. The partial-duration series, which includes all high values even though several mav have occurred in the same year and none in so~e years, was required for this study. However, the processing of partial-duration data is very laborious. Furthermore, there is no theoretical basis for extrapolating these data beyond the length of record. For these reasons an alternate procedure was used. The annual maximum event was collected for each year to form the annual series. After analysis for frequency, the annual series statistics were converted to partialduration statistics for corresponding return periods, and the rainfall-frequency maps presented in this report thus, in effect, represent the results of a partial-duration analysis. Table 2, based on
12
II
10
9
;;; ']! a u z = 7 I: ... ~ 6 Q
...
... 5 4 .. z 4 4 0:
3
2
I
0
f..
1-
f..
f..
1-
1-
f..
-
-
-
-
I 2
I
I 0
9
8 ~ :z: u z
7= :z: ...
6 :; Q
_, 5 _,
4 ... z 4 c
0:
3
2
0 2 3 6
DURATION (HOURS) 12 24
FIGURE 2.-Duratlon-interpolation diagram
a sample of 50 widely scattered stations in the United States, gives the empirical factors for converting the partial-duration series to the annual series for return periods up to 10 yr. The two types of data series show no appreciable differences for return periods greater than 10 yr.
Duration-interpolation diagram. The generalized depth-duration relation presented in figure 2 provides a means for computing rainfall depth for any duration between 1 and 24 hr. if the .1- and 24-hr. amounts for a particular return penod are given. The generalizatiOn was obtained empirically from data for 200 U.S. Weather.Bureau firs.torder stations, and is the same relatiOn shown m "Rainfall-Frequency Atlas of the United States" [2]. Rainfall values for durations between 1 and
TABLE 2.-Empzrical factor• for converting partial-duration seriu to annual seriea
., ________________ ::.:: ..................... ! c..-:-t~::::::::::::::::::::::::::::::::::::::::::::::::::: 0. 811
EXAMPLE: What are tbe 2-, b-, and 10-yr. 24-br. annual sertea valuea Cor the point at 19"30' N., 155"16' W.? From the maps of flgnres 61, 62, and 113, the ~tlal-duratlon valuea are estimated to be 8.4, 11.5, and 13.71n., respeco ttve1y. Mnltlpl:ytng by the above CactorB, the annual sertea va1uea are 7.4, 11.0, and 13.8 ln.
3
15
14
13
12
I
10
:X: 8 1-0. w 0
6
5
4
3
2
I
0
1-
1-
1-1-
1-
-
t-
f--
1-
1-
1-
1-
1-1--f--1-
1-1--
1-
f--1-1-
1-
----
---
-
--
-
-----
I
I 4
I
I 2
I
I 0
8 :X: 1-0. w 0
7
6
5
4
0 2 5 10 25 50 100
RETURN PERIOD IN YEARS, PARTIAL-DURATION SERIES
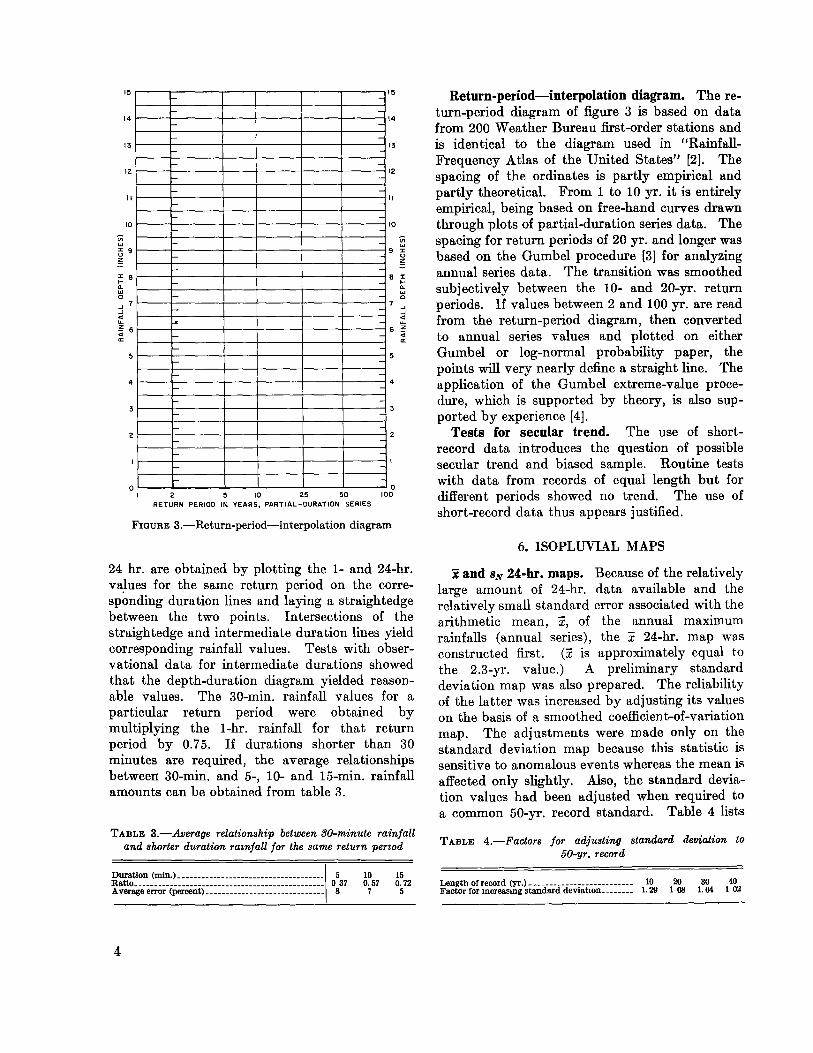
FIGURE 3.-Return-period-interpolation diagram
24 hr. are obtained by plotting the 1- and 24-hr. values for the same return period on the corresponding duration lines and laying a straightedge between the two points. Intersections of the straightedge and intermediate duration lines yield corresponding rainfall values. Tests with observational data for intermediate durations showed that the depth-duration diagram yielded reasonable values. The 30-min. rainfall values for a particular return period were obtained by multiplying the 1-hr. rainfall for that return period by 0.75. If durations shorter than 30 minutes are required, the average relationships between 30-min. and 5-, 10- and 15-min. rainfall amounts can be obtained from table 3.
TABLE 3.-Average relationship between 30-minute rainfall and shorter duration ramfall for the same return penod
R~~~~5~~>-~~~~~~~~~~~~==~=====~~~=~=~==========\ o 5 37
Average error (percent>------------------------------ 8
4
10 0.57
7
15 0. 72
5
Return-period-interpolation diagram. Thereturn-period diagram of figure 3 is based on data from 200 Weather Bureau first-order stations and is identical to the diagram used in "RainfallFrequency Atlas of the United States" [2]. The spacing of the ordinates is partly empirical and partly theoretical. From 1 to 10 yr. it is entirely empirical, being based on free-hand curves drawn through plots of partial-duration series data. The spacing for return periods of 20 yr. and longer was based on the Gumbel procedure [3] for analyzing annual series data. The transition was smoothed subjectively between the 10- and 20-yr. return periods. If values between 2 and 100 yr. are read from the return-period diagram, then converted to annual series values and plotted on either Gumbel or log-normal probability paper, the points will very nearly define a straight line. The application of the Gumbel extreme-value procedure, which is supported by theory, is also supported by experience [4].
Tests for secular trend. The use of shortrecord data introduces the question of possible secular trend and biased sample. Routine tests with data from records of equal length but for different periods showed no trend. The use of short-record data thus appears justified.
6. ISOPLUVIAL MAPS
x and siV 24-hr. maps. Because of the relatively large amount of 24-hr. data available and the relatively small standard error associated with the arithmetic mean, x, of the annual maximum rainfalls (annual series), the x 24-hr. map was constructed first. (x is approximately equal to the 2.3-yr. value.) A preliminary standard deviation map was also prepared. The reliability of the latter was increased by adjusting its values on the basis of a smoothed coefficient-of-variation map. The adjustments were made only on the standard deviation map because this statistic is sensitive to anomalous events whereas the mean is affected only slightly. Also, the standard deviation values had been adjusted when required to a common 50-yr. record standard. Table 4 lists
TABLE 4.-Factors for adjusting standard deviation to 50-yr. record
Length of record (yr.>-------------------------- 10 20 30 40 FactorformcreasmgstandarddeviatlOn ________ 1.211 108 1.04 102

the empirical adjustment factors determined from 200 24-hr. precipitation stations in the United States.
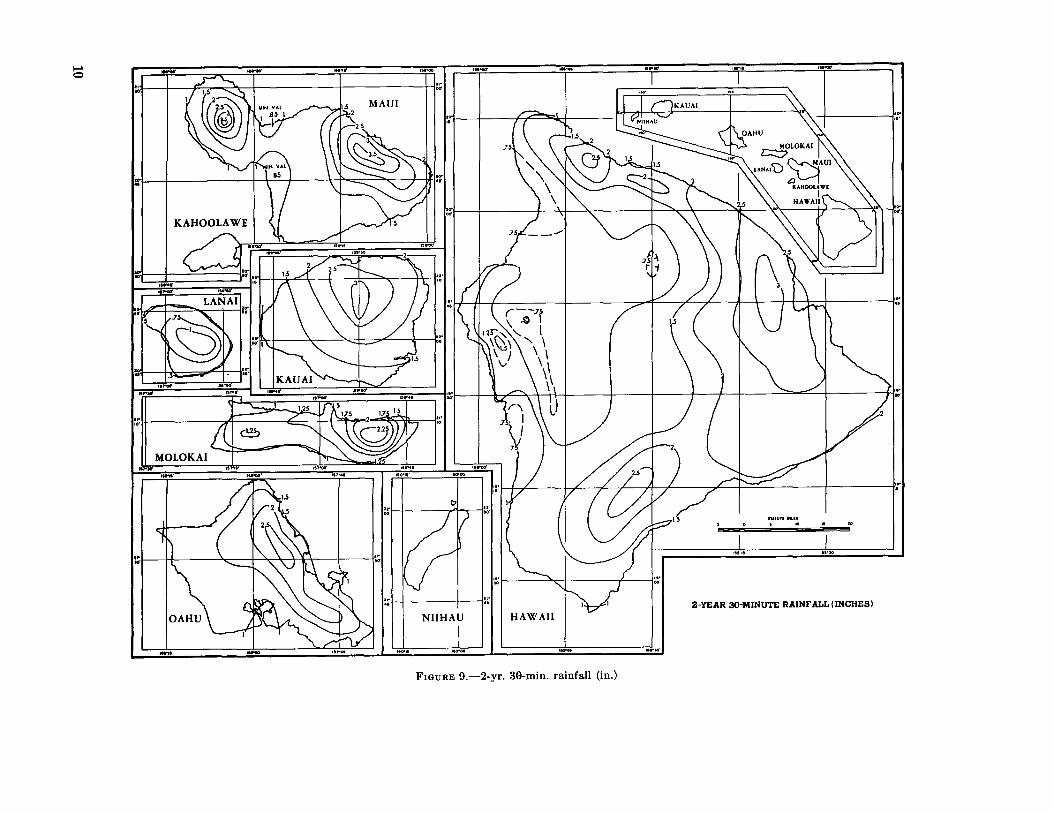
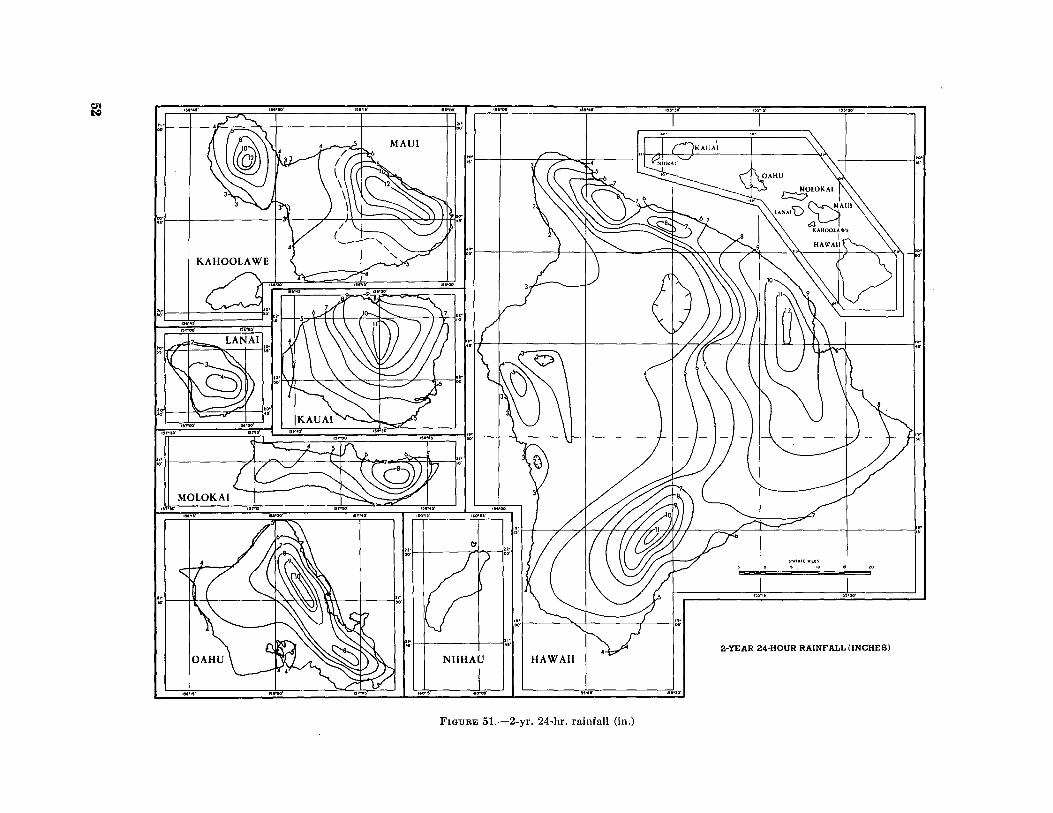
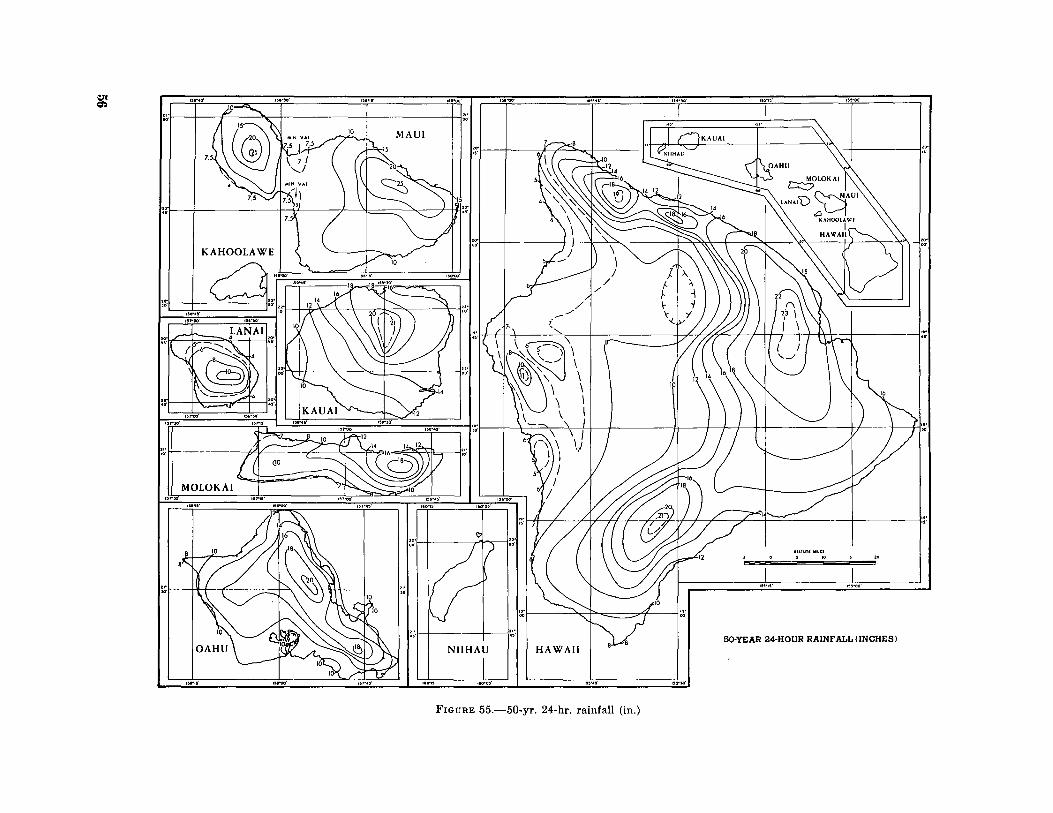
2-yr. and 100-yr. 24-hr. maps (figs. 51 and 56). The values shown on the 2-yr. map are for the partial-duration series and are approximately 7 percent greater than those of the x map. The smoothed 100-yr. map is based on a combination of values from the x and sN maps, i.e., x100=x+ KsN. By the Gumbel procedure the 100-yr. value is approximately the sum of the mean plus 3.5 standard deviations (fig. 4).
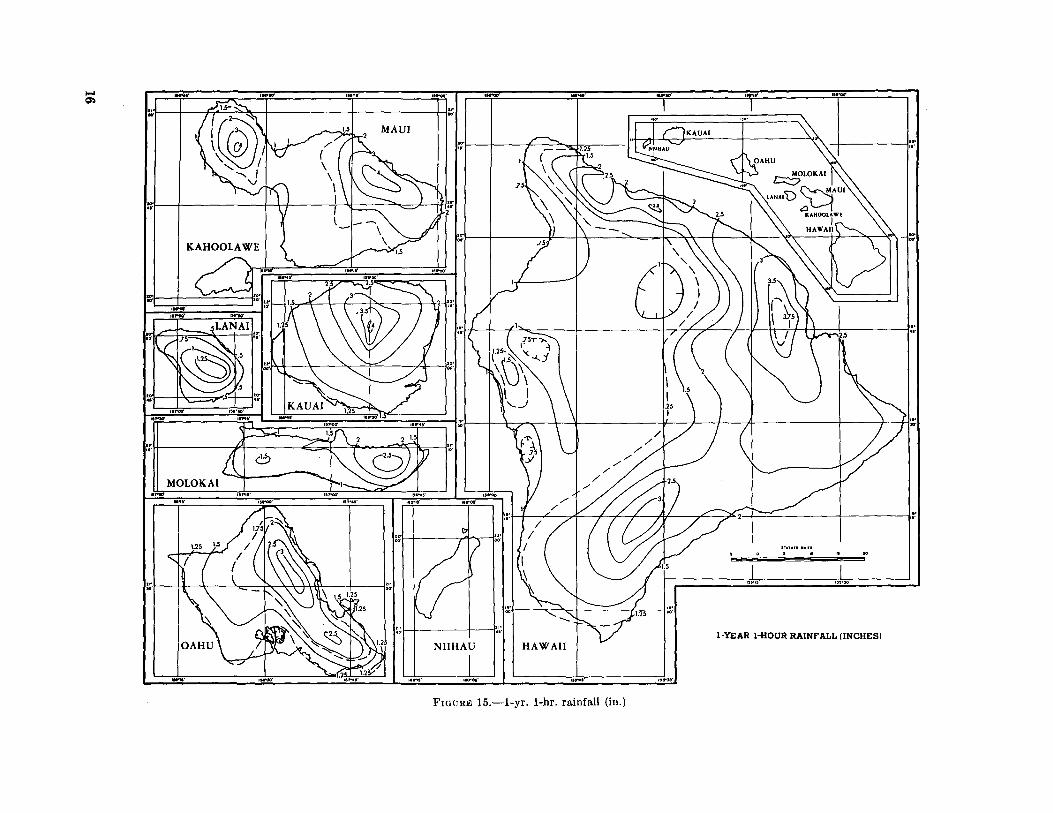
2-yr. and 100-yr. 1-hr. maps (figs. 16 and 21). An average 2-yr. 1-hr. to 2-yr. 24-hr. ratio of 0.36, based on three recording-gage stations, was applied to the x 24-hr. map to obtain the x 1-hr. map. The values shown on the 2-yr. map are for the partial-duration series and are approximately 7 percent greater than those of the x map. The coefficient of variation of the 1-hr. data was found to have an average value of 0.33. Multiplying the mean, x, of the annual maximum values by 0.33 yielded values of the standard deviation, sN. The 100-yr. 1-hr. map was then determined by adding 3.5 times the standard deviation to the mean annual maxima, or x100=x+3.5 sN.
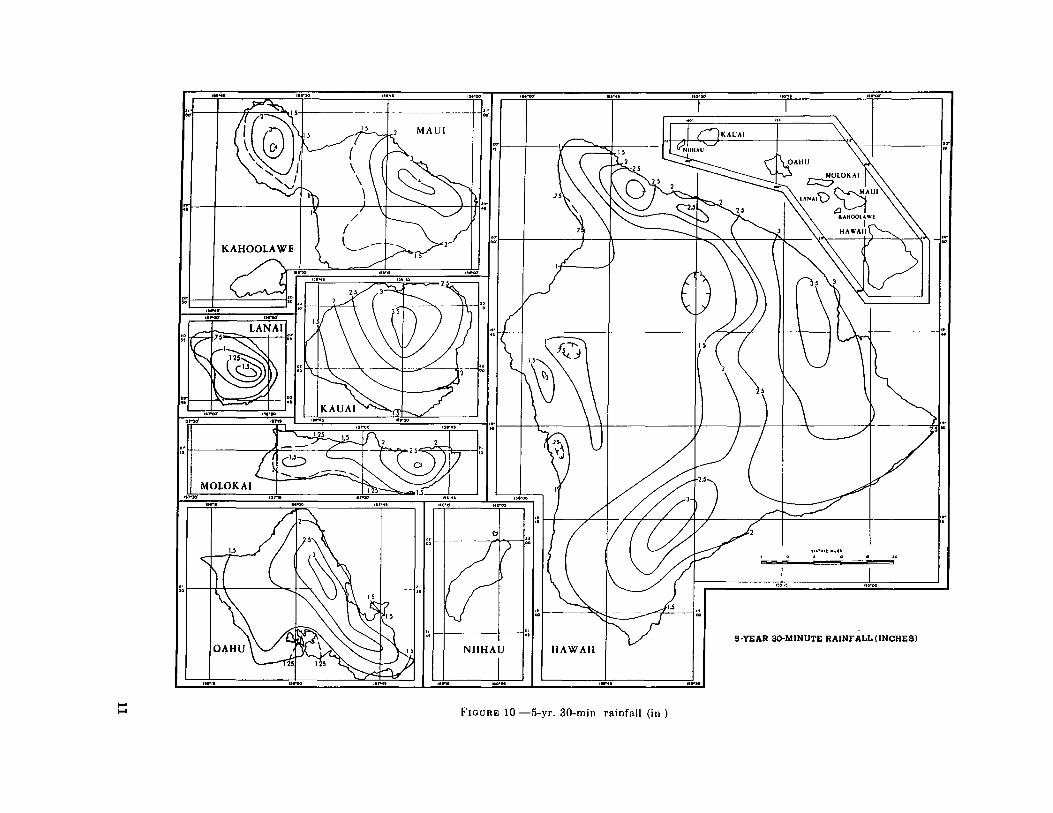
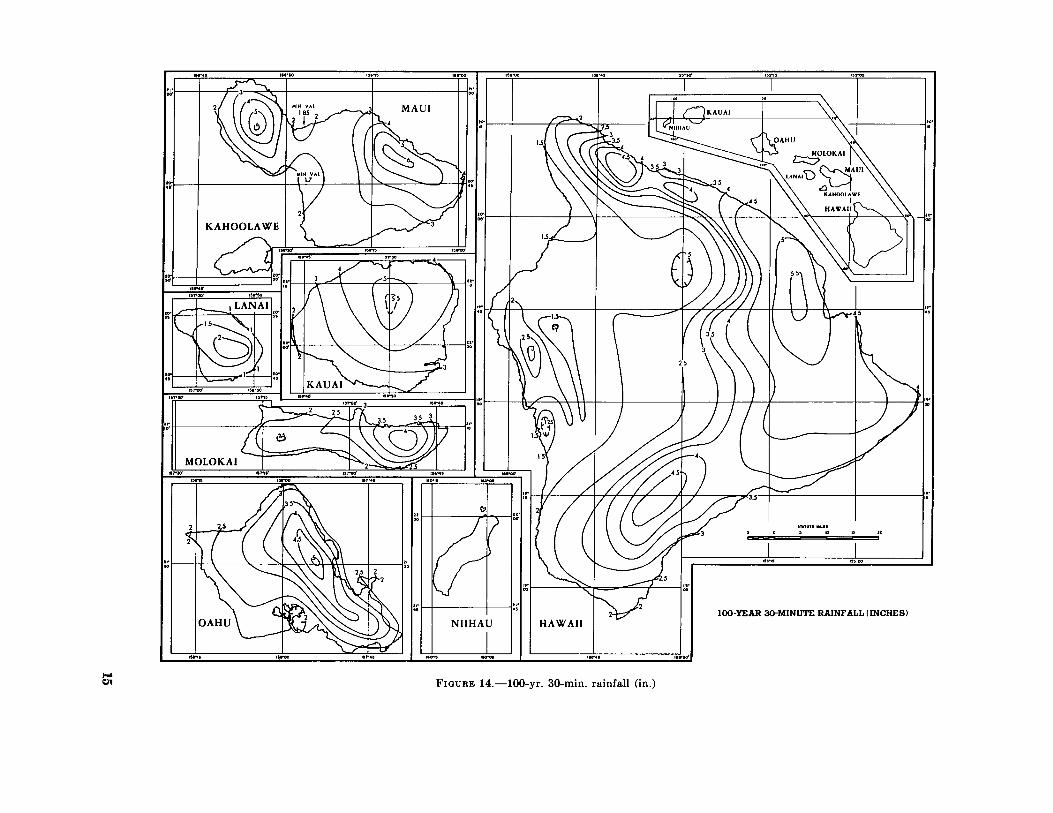
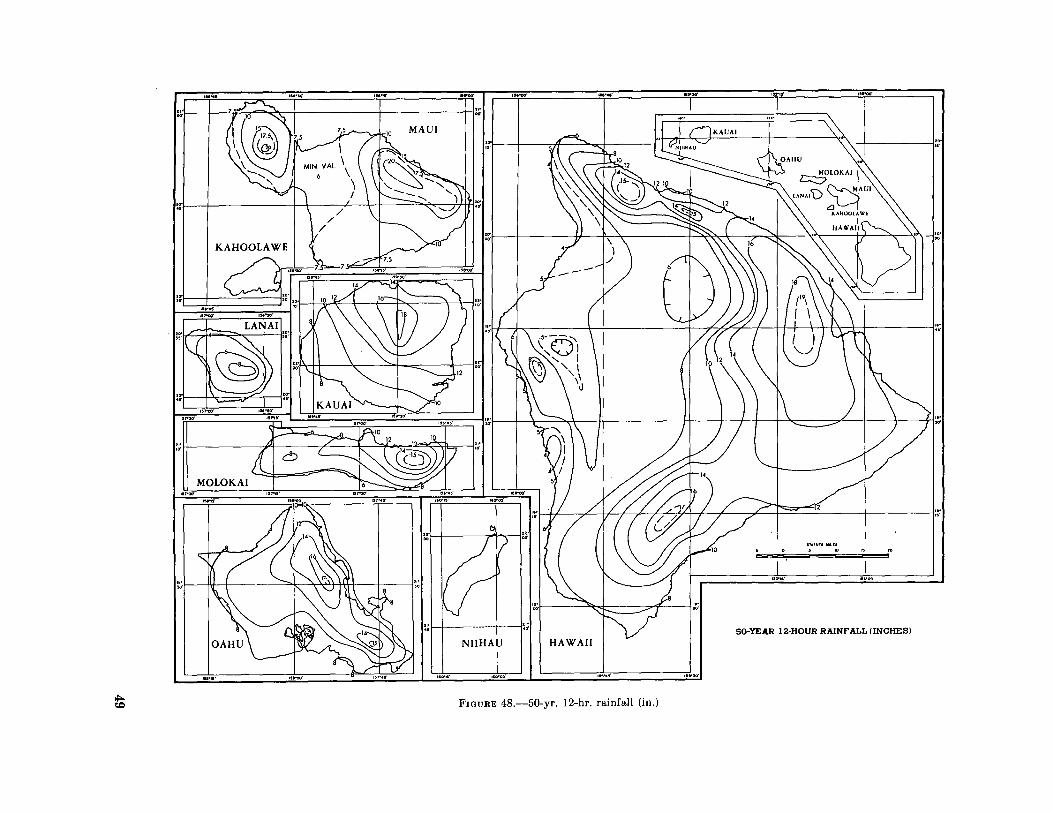
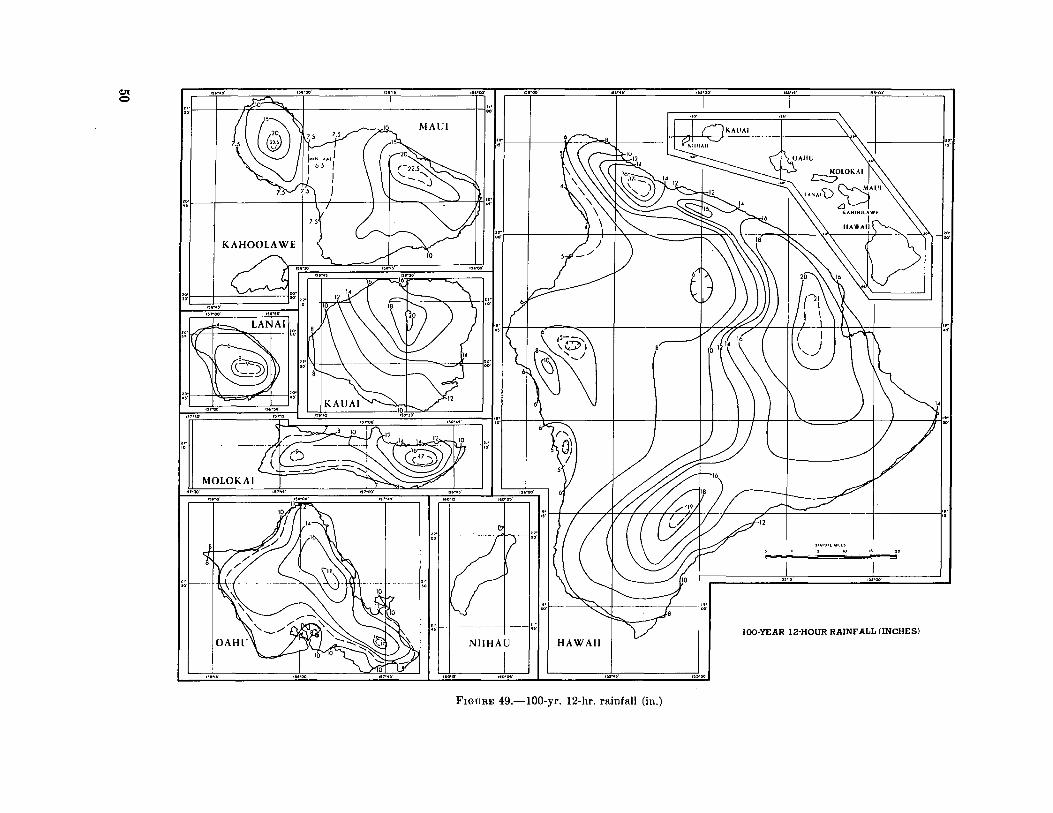
Additional isopluvial maps. The 2-yr. 1-hr., 2-yr. 24-hr., 100-yr. 1-hr. and 100-yr. 24-hr. maps were then used in conjunction with the duration and return-period relations of figures 2 and 3 to obtain 38 isopluvial maps for intermediate durations and return periods. The computations were made by a digital computer. Values were computed for and plotted on the grid of figure 5, and the isopluvials were then drawn with reference to these grid values. The seven 30-min. maps were developed from the relationship 0. 7 5 times the values on the 1-hr. maps for corresponding return periods. The 49 rainfall-frequency maps are presented at the end of the text (figs. 8 to 56).
7. DEPTH-AREA RELATIONSHIPS
There are two basic types of depth-area relationships: (1) storm-centered relations, and (2) geographically-fixed relations. Storm-centered relations are developed from rainfall data in storm centers. The frequency-derived, geographicallyfixed, depth-area curves of figure 6 are based on different parts of different storms instead of on. the highest amounts surrounding the storm cen-
656887 0--62-2
;;; II:
"" "' ~ 0 0 ii: "' .. z ~ .. "' II:
2 4 5 6 K
FIGURE 4.-Relation between K and return period for 20-, 50-, and 100-yr. records (after Gumbel)
ters. Since the area is geographically-fixed, its rainfall stations measure rainfall sometimes near the storm center, sometimes on the outer edges, and sometimes in between the two. The averaging process results in the geographically-fixed curves being flatter than storm-centered curves. This is understandable considering that such curves are steeper near the centers of storms. Each type of curve is appropriate for its respective application-the storm-centered for PMP and the geographically-fixed for frequency data.
The depth-area curves of figure 6 are based on data from 20 dense raingage networks and are identical with those of Weather Bureau Technical Paper No. 29 seri~s [5]. The ordinates of the 24-hr. curve, for example, are conveniently expressed as ratios (in percent) whose numerator is the average of the 2-yr. 24-hr. point values in the area.
8. SEASONAL VARIATION
The use of annual maxima (annual series) or n-maximum events for n years of record (partialduration series) for frequency analyses has been discussed. Obviously, some months contribute more events to these series than do other months, and some months may not contribute at all. As a
5
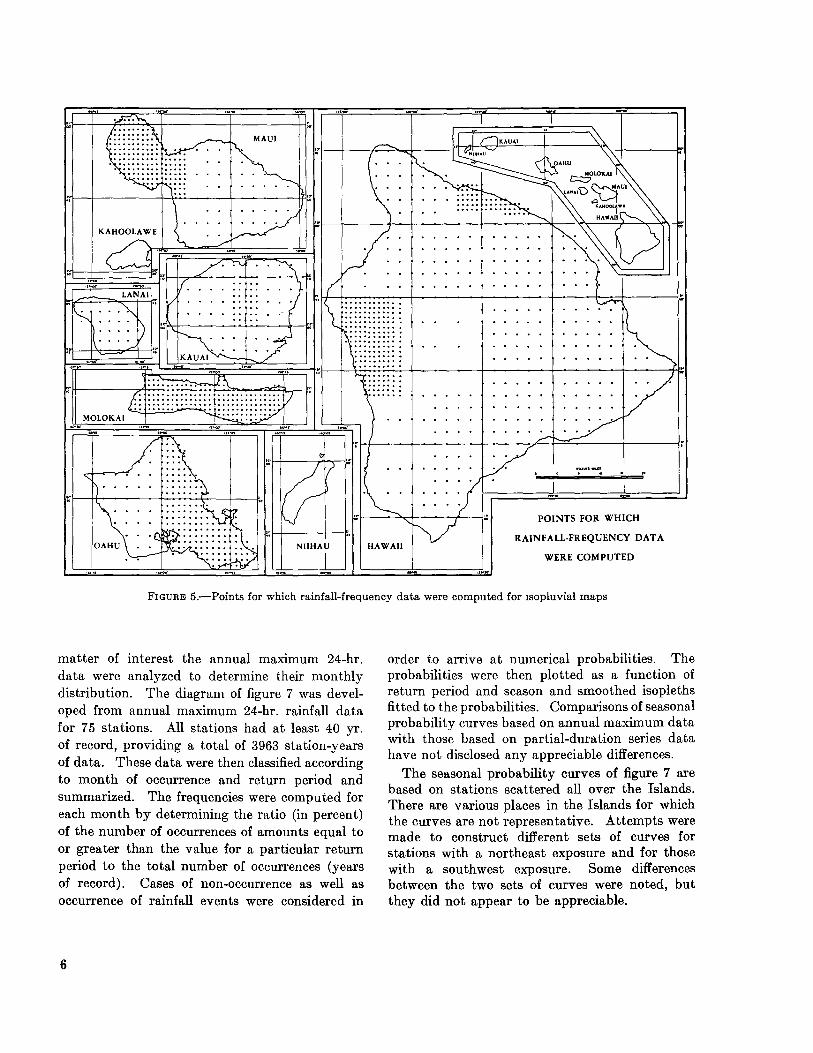
FIGURE 5.-Points for which rainfall-frequency data were computed for 1sopluvial maps
matter of interest the ::tnnual maximum 24-hr. data were analyzed to determine their monthly distribution. The diagram of figure 7 was developed from annual maximum 24-hr. rainfall data for 75 stations. All stations had at least 40 yr. of record, providing a total of 3963 station-years of data. These data were then classified according to month of occurrence and return period and summarized. The frequencies were computed for each month by determining the ratio (in percent) of the number of occurrences of amounts equal to or greater than the value for a particular return period to the total number of occurrences (years of record). Cases of non-occurrence as well as occurrence of rainfall events were considered in
6
order to arrive at numerical probabilities. The probabilities were then plotted as a function of return period and season and smoothed isopleths fitted to the probabilities. Comparisons of seasonal probability curves based on annual maximum data with those based on partial-duration series data have not disclosed any appreciable differences.
The seasonal probability curves of figure 7 are based on stations scattered all over the Islands. There are various places in the Islands for which the curves are not representative. Attempts were made to construct different sets of curves for stations with a northeast exposure and for those with a southwest exposure. Some differences between the two sets of curves were noted, but they did not appear to be appreciable.

..J
..J <( ..... ~ <(
a: 1-~ 0 a. ..... 0
1-z I&J (.) a: I&J a.
100
a
~0
40
30
25
20
~ 10 w ~
4
I
100
90
80
70
60
50~----._~--~--~_.--~~--~--~_.--~~--_. __ ._~--~--~_.--J 0 40 60 80 100 120 140 160 180 200
ARE A (Square Miles)
15
FIGURE 6.-Depth-area curves for rainfall-frequency data
I tAS~N1L PRIOBAIBILIJY I OF INTENSE 24-HOUR RAINFALL
f ~
~ \ _\ ) \ v \ l \ v \ 1\ I I
\ \ I /_
\ I"-) t '\... / \ \\ I I v
\ \ ["-... r-J I \. I 51 l ·-
1"'-.. Vlf\ ~
""' / r / ~6
/
FIGURE 7.-Monthly distribution (in percent) of 24-hr. annual maximum ramfalls for vanous return periods EXAMPLE: Determme the probability of occurrence
of a 5-yr. 24-hr. rainfall for the months November through March. From figure 7, the probabilities for each month are interpolated to be 2, 3, 3.5, 2.5, and 3 percent, respectively. In other words, the probability of occurrence of a 5-yr. 24-hr. rainfall in November of any year is 2 percent; December, 3 percent; January, 3.5 percent; etc.
t'-.. / 15 F M A M A S 0 N 0

9. PROBABLE MAXIMUM PRECIPITATION (PMP)
The main purpose of PMP estimates is to provide complete-safety design criteria in cases where failure of a structure would be disastrous. Estimates of 6-hr. PMP are presented in figure 57. These estimates, taken from Hydrometeorological Report No. 39 [6], are based on a purely meteorological approach.
Ratio of 6-hr. PMP to 100-yr. 6-hr. point rainfall. The ratio of PMP to the 100-yr. rainfall provides a rough index of the geographic consistency and relative probability of the PMP estimates. In the United States the ratio for 6-hr. rainfall has been found [2] to range generally from 2 to 9. The low ratios are usually found in the wetter regions where the occurrence of highintensity rainfalls is relatively common. The highest ratios are usually found in arid or semi-arid regions where high-intensity rainfalls are possible, but the probability of their occurrence is extremely low. This trend is found in the Hawaiian Islands. The ratio map of figure 58 shows the relative magnitude of the PMP estimates to be of the right order. The ratios range from about 1.5 to 7, the lowest ratios being on the windward slopes of Hawaii.
Depth-area curves. The PMP estimates of figure 57 are for point rainfall. These point values can be reduced for size of area by means of the depth-area curves of figure 59, which are merely another form of those presented in Hydrometeorological Report No. 39. These curves differ from those of figure 6 in that the former are stormcentered whereas the latter are geographically-
8
fixed relations (see section on depth-area relationships above). The curves of figure 6 should be applied only to rainfall-frequency data, and those of figure 59, only to PMP estimates.
The two sets of depth-area curves show different rates of reduction for size of area. Extrapolation of the curves to appreciably larger areas than shown, and application to the respective index maps, would lead to PMP estimates smaller than the 100-yr. rainfall, patently unreasonable. Such extrapolation is not intended, and the depth-area relations are considered reliable over the ranges of area for which depicted. The largest natural watershed in the Islands suitable for development is abput 100 sq. mi., most watersheds being much smaller. These areas are well within the critical limits, and no unusual problems are involved.
REFERENCES
1. U.S. Weather Bureau, "A Key to Climatologic Observations m Hawaii," Key to Meteorological Records Documentation No. 1.11, 1961, 118 pp.
2. D. M. Hershfield, "Rainfall Frequency Atlas of the United States," Technical Paper No. 4-0, U.S. Weather Bureau, May 1961, 115 pp.
3. E. J. Gumbel, Statistics of Extremes, Columbia University Press, New York, 1958, 375 pp.
4. D. M. Hershfield and M. A. Kohler, "An Empirical Appraisal of the Gumbel Extreme-Value Procedure," Journal of Geophystcal Research, vol. 65, No. 6, June 1960, pp. 1737-1746.
5. U.S. Weather Bureau, "Rainfall Intensity-Frequency Regime, Part !-The Ohio Valley," Techmcal Paper No. 29, June 1957, 44 pp.
6. U.S. Weather Bureau, "Probable Maximum Precipitation Estimates for the Hawa11an Islands," Hydrometeorologtcal Report No. 39, (to be published).

cc
15''00'
~1 T A· 1 I --. ... II 151"00'
~------------4~
~ 1 ) 1~ ~k~-r ~\11
I r1 I l fL /II 0 )4 I" .W-t-- ---; r \
} .L = Jt:U:A~~x : 'J J'~:~ \J jJ ) I( ~ 'jJ ,~1:::
.sr30'
~I ll\ \"----1
~\1 II I
l'(74llfJ1177>'V I I·
1~11~:
HAWAII
FIGURE 8.-1-yr. 30-min. ra.infall (in.)
u•rur,-.n . .
I-YEAR 30-MlNUTE RAINFALL(INCHES)
~ Q
.. ...
1...,...-
I ~-J: :11 I~· HAWAII
11r10'
FIGURE 9.-2-yr. 3G-min. rainfall (in.)
n.nuu-.n . ~
2-YEAR 30-MINUTE RAINFALL(INCHES)
1-' 1-'
~I 4 )R0J =// )1~\"rk
zoo: ..
. .. IS?-JO'
~;11 ~~-~~~
~1 ll', '--~
.. .. --+-----!!~
NIIHAU HAWAII
1 fr:ff II \ )l1{ I'
/4:"11 ~ I I' 7 / 7 t:'
II&TUTlllll.ll , .
5-YEAR 30-MINUTE RAINFALL(INCHESl
FIGURE 10 -5-yr. 30-min rainfall (in )

~ •is•Ciit
'"1 I .. IF·'=- ..._ I . / """"" I
::.-1 I .... ! ,__....,I ' ~r.
!f.l---+------1--\---,r---+--P'""--.::=--=--ttf
,,~ ...
':;:JI /L .... -
~·I II \ ""r;;:: ',\\\~\\ I I'
'~I I J J I . "- t " " ' "k: "-~" :tl " '~" "" \ """'" \\" '\\ \ II
I I A \ . • /. '• I I :/ /' :>'' / A I I I \ I ~~·.:
u· 11• 45' 4S'
NIIHAU
I I / J_...... / /' 7/ /II 7 ,(, I----- I ~::~
+----~-+----f----1::.:
HAWAII
IIATUTIMILII .
10-YEAR 30-MINUTE RAINFALL(INCHESJ
FrGURE 11.-10-yr. 30-min. rainfall (in.)

I-' CA:I
~I II \ '"'"" F'-, '' \) \ 'l\ \ l l
!81"00'
- . . -+-------l:t
::: 14' '.I '\ I '2', \ I '--l '-1-', I ) ", '{'\
r++--r-~-----~~--------r-~~~~~-~r-~r--~+-\-~,_ _____ _,~
L uv 7/ I ,c / / 7 .. ,, b' ,' 7, ~ I I 1::-
::;.1 '<'I ---? I~
f-+------r----1:~·
NIIHAU HAWAII
FIGURE 12.-25-yr. 30-min rainfall (in )
U.&IUUYILII .
29-YEAR 30-MINUTE RAINFALL CINCHES)

~
1~:1---+--· -4------------~:~
1~1 I J 1\ >... ::::1: ...... ?" ... \ I "l ~' I) ', 't'\
1/ I .,-==-, I I///'// 1/ \ \ 1\ _.I ~~~·
..... ....... I 11\.J\UJ\1 ~':=:-=±---.L I 11rold ,,.,.,,. ....,.II' ••rso·
II d'~ #0 .,7_ 'i4'' I \:,: ~
:.1 1¥ \: ' .... ::1''"\:'d\'.t\ I I~
11i:i"ol'
()
::1 I r"l ' 1:
• w • • NIIHAU
160"01'
I I ,' 74 i, 1/ 7/ l I 7r I -- I 1:::
::-1 ', "...,.. I t., 1Z
HAWAII
........ .... 10'
lf.t.TUTI.._U . . is5•oo'
60-YEAR 30-MINUTE RAINFALL (INCHES)
FIGURE 13.-50-yr. 30-min. rainfall (in.)
.... C1
~:"I I /,~ cocl?'i -t-------1~:'
!:"f-- I I \I ", 4'- "'""""' \ I "~ ¥, I ,J ", '{'\ ,,,. "'
I' 'I ' I I I I _, <- ;:::::::::::::: f 7'7/'/ I II \ ) t\:;::;:;;:;~5 I~;
25
"""' ...... I jii..J\U/\1 ~ :---:=t---.,L I 'iTO' 'd~ IIP4&' •&7"00' 3 •srsa Ul'"41 ~·1 I A 7c ', \
11 \ I I II / / / V I I II' ') -- 1-..
C;> ~I I r1 , 1:
~I II \ ', "k ', \'J\ \\ '• I I
~I '<I ..............- l 1~·
:~H----+--f
NIIHAU HAWAII
FIGURE 14.-100-yr. 30-min. rainfall (in.)
-- :r
narun-.u ' .
100-YEAR 30-MINUTE RAINFALL (INCHES)
~ Q)
....... IH"'I'
...
:;•
II ~-,u~ f· II MOLOKAl '--'-I . ===:-±-~~ I
ll'rKJI ISMI' 157"'00' "1"45'
I ·r· ?f:s ... i ...
~-1 1\\ \~~~~.J~ I
·- ......
0 l~l OKAUAI l "\~ I 1:::
lct I 11Ft)~ \.v~~' '1: . ('~( ~ ~
I '!:::?- ---- ]'.25 ,. f"-----/ I , ... :- "l.
HAW All
~I l:r IT.t.H/TIIIOI.ll , .
I-YEAR I-HOUR RAINFALL (INCHES)
FIGURE 15.-1-yr. 1-hr. rainfall (in.)

'""" ~
~1 I ~,2--~~t-------------4-------------~,
~~--~------r---~~~~~----~ ~------------~~
~I I I 11 I \ ==-...... )lfl
:~1 I 75 I 't ', .......... 1-....'\\ ( "k \F', I) '-, '{'\
~ ,..
..,..,. ·~· .. · I 111.1\UI\l ~ ~/ I liTo' ·:;··I .,.....,. 15l'"Oo' 15rso· 1&1"45' ':,~I I ' .... \ \ \ I I ~ J I r I J Jl•
--.: I .-.. - I I \ \ \ \ ' I 7 :
:dl ~ f -"' ~ =r ('---,Q;25~ ~ 1:
til ~:1 I r'l ' 1:
::;.1 I /\ '-== F', \,\ \\ n I B
:~·t-+------------t---_J:
NIIHAU
I V / I / / / / /Y / 7°-" 1..__.- I 1:::
:::1 "-?-"' I ~,.., 1~:
HAWAII
I IPSO'
Sf&TUU •ll.ll
'
2-YEAR I-HOUR RAINFALL (INCHES)
FIGURE 16.--2-yr. 1-hr. rainfall (in.)

~ 00
·j T ~l .I MAUl li
-II ~))~ ,...~
~1 11& ~lli±
~~1 I ~-<
~11 )~~t~~
1~1~:
.-sr10'
~I !:::
U~tuu ltiLU
' .
S-YEAR I-HOUR RAINFALL CINCHES)
FIGURE 17.-5-yr. 1-hr. raiufBII (iu.)

.... ~
::;.1 II \ '......: 1",\,\ \ w, I
~::1 / , ..?5-ic I _ ~ --+-------l~::
I I / /I / / / 71/ 7 I L - I 1:;:
,,. ,,.
- -----t----1~~:
10-YEAR I-HOUR RAINFALL (INCHES) HAWAII
FIGURE 18.-10-yr. 1-hr. rainfall (in.)

N =
... ...
.....
Gl (JKAUAI l ~~
, ... "'
tt65i ~rr:Ptl D Gi , I,
IIPIO'
FIGURE 19.-25-yr. 1-hr. rainfall (in.)
ITAIUUIII&.II .
29-YEAR 1-HOUR RAINFALL(lNCHESl

"' on
"' 00 00 .... 0 I "' i ....
N ....
1611"41°
T'' 1~ - I MAUl II:~ :~I I V*'~_, +---------~~.':
·II ~~J~I ·~ ,.,-+----
ld (~'\ I 1'+11( u ~ I· ~rL~~~~~ .. I·IIY~j~l 'J ))I 1 ))
I -~ cr~ I": ~ I _, ..., " \"I I '
~1 It\ "'i<\~~\~ d: 1 llfV!Lb~l I·
~1 ~ --:! 1~: I I I 1:~·
NIIHAU HAWAII
FIGURE 20.-50-yr. 1-hr. rainfall (in.)
IIATUUIIR.II , .
SO-YEAR !-HOUR RAINFALL (INCHES)

~
~I ~))~ ..\ I
·~ ...
I 1~::
.. . ...
t1/P~ I· SIUUT(IIIlll , .
~I ~ 'd~~ \ ;t I
I~ I~: 100-YEAR I-HOUR RAINFALL (INCHES)
HAWAII
FIGURE 21.-100-yr. 1-hr. rainfall (in.)

~ ~
~:-1 I :V ~., -1-------i~::
~~-1 I f 'I I " -............ 1, ", \ ( 'l "I., ~d-, I ) ""...... '.:.."\
1/ I / 1'. I / // / ..f \ '< l ll L I 1~;.
,,... , ... ,. I 1"-"'U/>1 - JT:':t---,/ I Ti3
0' '\{''! 15
..
45
• •sr-oo· '''"'o' •W45' ~~·I I \ -.....,.. '\ \ \ I J J I 1 J1 I J J j' """ I ...,....? I · ' I ' :
::;1 II\
r·--, 7./ 17/ / / ;// //1/ :;/ :;/ ',) 1 --- 1:::
', ", t----- 00'
NIIHAU HAWAII
FIGURE 22.-1-yr. 2-hr. rainfall (in.)
STATUTE Wr\.[1 , ,,
I-YEAR 2-HOUR RAINFALL (INCHES)

~ :~:1 I r· ~ I I ··· oo·
... "'
:~:1 I \?=:::::::;:£"'F' .. I •n•so'
~;:f 64----
,,.,.,.
~~· 1-----W---\--
MAUl ~::-1 .. v ~ .... ...~_ -l--------1~::
J \1 =:......----= J IPJ
"' ~~·
I! I I / "!, ==1 //Y' / I I I I I I l J 1~·.:
I.A' /' I///// 7"ll/ / :;/-·I~ I 1:::
I ~21-...::: ___... q --1:,:,:
NIIHAU HAWAII
FIGURE 23.-2-yr. 2-hr. rainfall (in.)
surun '"LU
'
2-YEAR 2-HOUR RAINFALL (INCHES)

~ ~
., 'l'~l l· :~ MAUl
l0"1 ...
~d 1 ~:i25 , . ...
II/I) ~ ~rr1 u~ ·1:
:::1 lit " I~~ J. I··· ---;J ~-
ISI"ID'
FIGURE 24.-5-yr. 2-hr. rainfall (in.)
ST.TUIIIIILU . "
5-YEAR 2-HOUR RAINFALL (INCHES)
... ...

N Q)
~:: ?'-/---"'"-... t----- --j-------J~so:
/ /' / II I I I \ __ I I~;
"""' ""'~ I 11\./\U/\1 -~ I 151"')0' 151'"15' •er .. e' """so·
II (jO ~ ., " "[o!5~ •se··u·
II /I - ::: C;l
~~:~ ~~:
~I II\ \ ',1 ', 'd \'<\ + ::;1 "'"f--==:;:;-.c-( 1:.:.:
!~- -+--1!~·-
NIIHAU HAWAII
FIGURE 25.-10-yr. 2-hr. rainfall (in.)
STiroTIJT( llllU
'
10-YEAR 2-HOUR RAINFALL (INCHES)
1:-:1 ""-1
HAWAII
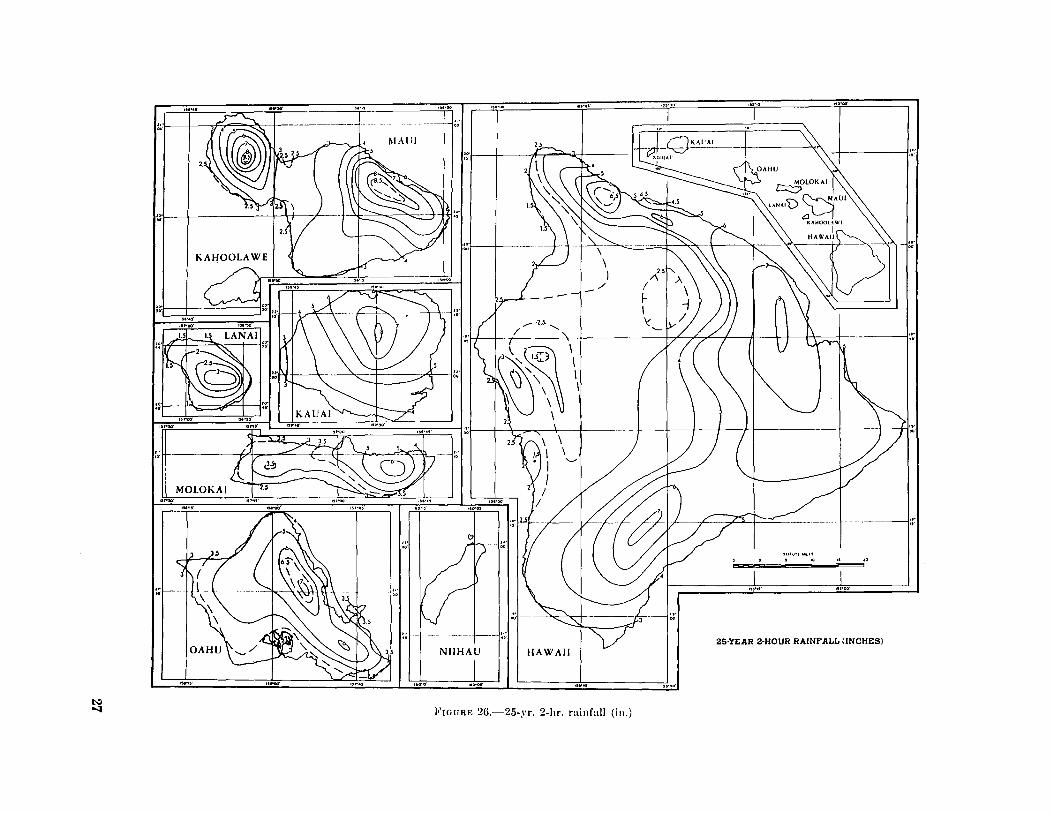
FIGURE 26.-25-_l'r. 2-hr. rainfall (in.)
!UI\ITI ""II .
, . ..
~-----------j:::
25-YEAR 2-HOUR RAINFALL CINCHES)
...: ' N
28

~ ~
~·r---r---;T---=~~r.----- -+-------!~:.-
Ill I 7,c= '-, I I /' A/ / I II I I \( :03 . ', ~~·;.
I ,,.!00 .J.,. I I I 11\./\U/\I v ~z-· I I ·~1'10' •51"15' 15i"•'' •n•so· II :;:d:l.._., "~'~, ,, . .,. ,·.~1 I \ \ I I I I \ I I I I I l l II
I I 1/ Jt' 11 / 7/ A I ( ::~
oo'·l '-1 ;;;r~'"' 1:::
·H :~·.
NIIHAU HAWAII
FIGURE 28.-100-yr. 2-hr. rainfall (in.)
HATUTliiii.U
'
100-YEAR 2-HOUR RAINFALL (INCHES)

~
·! T ?§. :J MAUl I
'20" ...
,.~! I E:>:-~1.75 ~~· -- -?
1~:-t----+---
-+--------l~;.·
,. . ...
11/f~_>r- I I· STATUTlllll.[S
' .
~I ~\ ~'~J: I-YEAR 3-HOUR RAINFALL (INCHES)
FiGURE 29.-1-yr. 3-hr. rainfall (in.)

~ I-'
--+--@r" 1 MAl/1 11:~ :~I I f?="={
., . ..
:~~~
... .,.
... ...
I ~i t 1 .. · :J ~-
FwiTRE 30.-2-yr. 3-hr. rainfall (in.)
".&TI.ITliiii~U
' .
'------""i:r
2-YEAR 3-HOUR RAINFALL (INCHES)

~ ,,.., -- 00
H"
" ..
i\IAUI
:;·II ~,i<t?Zitftr
·~ " ---1--------l::
lhf_ I , - -T#fil CJ)~ I"
l/W~ ~I I J7~~::
~
ST.O.fUTlWILU
' "
S·YEAR 3-HOUR RAINFALL (INCHES)
FIGURE 31.-5-yr 3-hr. ramfall (in)

~ ~
~:.1 I ., "I ,.c:v ;c I -t--------j~::
:IJ I < I 1///'/ /II I I II \__1 1·:;
1~1"30' 157"«1 ·~·:1(1' I jKAUAI .....,~
II ~l"l5' 15r45' ~ I d'~ '""00' 15t"50'
t 0 - "'j". I ·,~~~11 ---I\~0_'\\tj• tl-il-~-+~ --}l-f'-1/!__1~\ =----~--l:JJ , 1 1 " /1 I I
:;;1 ll I \
:1 I / /f I / / .t /A I ~s ~ ... ...
.f-------''-<-f·-----+-- ~:
-1-------·---+--1:~:
NIIHAU HAWAII
FIGURE 32.-10-yr. 3-hr. rainfall (in.)
STAIU1[111U5
'
10-YEAR 3-HOUR RAINFALL (INCHES)
~ ,. ,.. ,. .. .,. ;r:s .... ,.. I ,, ...
A - '1 ,. MAUl
I I Nl'\' 1 R9 ::: ~~ I ""'
~;:1 I 1:::-J,
·111'~~
~--------l~:.·
... .,.
(;W$~1 I, ~~~~:
STATUHIIIIUS
' .
25-YEAR 3-HOUR RAINFALL (INCHES) NIIHAU HAWAII
FIGURE 33.-25-yr. 3-hr. rainfall (in.)
~ ~
::,~1 I .F ..... ......_-......_ I I I I
~::1 I V ~,.>s;~""-+1---- -+--------1~:;
~~I I I I I I I I=:.....___ -..... I 1TI I 7 \ .............: 1
~~,-~ --~-~~~~----J
.s1·so· 1Sl"''5' .sr•s ~~r)o· \ \ 1 1 1 , I ,.,!.,. ,J., S:! I 11\./\U/\1 v~/ : I II <if;: "~' .......~~~ I ' ' I I I ) } ) I I \: j I ) II
1'i A I........ I I
:;:II t;.'l/--~-- <..: 1 I '-i M ~ I ( n~
"'I I'' I " '' "i, '\\\)\ \\f \ I I
1-+----+-----1:~:
I f / /1 // ///B-4/ / ;/- 'I~ I 1::~
HAWAII
~Tt,l\11, "II.U
'
50-YEAR 3-HOUR RAINFALL (INCHES)
Fwt·R~> :34.-50-yr. 3-hr. raiufall (iu.)

~ Q')
, . ...
,. ,.
-l---------~~::
]!/ ~9?// ~ I I' {/ .~/;;;: STATUT( .. IlU
' "
IOD-YEAR 3-HOUR RAINFALL (INCHES) HAWAII
FHHJRB 35.-100-yr. 3-hr. rainfall (in.)
~
"""
:~·f---+----
,. ,.
,, . ...
oo·
-- - ~ -·!~'.
NIIHAU HAWAII
FIGURE 36.-1-yr. 6-hr. rainfall (in.)
5TAI ... T(WOL[S
' .,
I-YEAR 6-HOUR RAINFALL (INCHES)
~ 00
,, . ...
MAUl
"' 00
II 2~ ~: ~3 -1------------,;~
~~~ --1 ,.---Will D111 r,
2-YEAR 6-HOUR RAINFALL (INCHES)
FIGURE 37.---:!-yr. 6-hr. rainfall (in.)
... ...

~
•1 r J3iT =:1 MAUl II"
11 ~~ )~~ .. ~ 7
•... 15,.30'
off A:~r~f •s7•w
~I 1\\ 'i~l\ l I
'""'''
:~I I f::::l. --1-------lf:
41)~ ·~ .,..
1~1 ~1tu~ r
YA'lf7~1 i'
~~~~:
IS'"IS'
IT,t.IUU.,._U .
6-YEAR 6-HOUR RAINFALL l!NCHESJ
FIGURE 38.-5-yr. 6-hr. rainfall (in.)

~ ~1 I f',, ~ I I I~
MAUl ::,-1 ~{,c--....,.1 -t--------1:::
:::1 I I \ I \ I "--- ------::;:-- -=::J HI
·~ ,.
~~:JI 7.Jt,C::
1,.,.-,o-
~I I f.c ( ...,k '\:'0x',\ '\T I I
~~I I 1 l ",'......,._ ~,\ ( "k \t~\ I ,J ", '{0\
:13"{7/ 7!h///~~IJIJ 7~ I h:
::.1 >, f- ==:=:;r ,.......-- / 1~:
IIATUtlii._U
' .
;.f-----+---- :;:1 I I '\ r I I 10-YEAR 6-HOUR RAINFALL CINCHES)
NIIHAU I I I HAW All
FIGURE 39.-10-yr. 6-hr. rainfall (in.)

.... ....
15t"OO'
~~--~------f----=~~~------- --+-------------l:,o:
I J ! I I \ I I // / A I ! H ;J;J 1'.,
""M ,,..,. I 11\.AUAI ~~/. I '"''" "~'· •or.,· "~"· "'I I \ \ I I I I / I I II ~.4 .,7"0~.,. .wo· JD' ...... :::;> ;;: ' i r I I ) II
~.1 1.\ ~
--+----1~;:
NIIHAU
,,o•os'
{ /1 / / /'/ I / / ?c:-8 1---...,--- I ----J:::
---.<----1 ~:
'"""'' ,,,.JD"
SIAIUU III~U
' .
25-YEAR 6-HOUR RAINFALL (INCHES)
FrGURE 40.-25-yr. 6-hr. rainfall (in.)

42
.... >. I
0 0.0
I

t
15to00'
::.1 I ft".n--~ I I I 1:~
MAUl
~:;1 I V ,,........., .... I
::: \ I :---.. ...;;::--~ J Ill
·~' ...
,, . .,.
::;.~-f-#--f-
1M'15'
- / \ .. ---t\-~'~--1:;:
1&0"0~'
r1 \ ~~~:
oo·f------"-.~-
f..-+- :;:
NIIHAU HAWAII
JtO•oD'
FIGURI!; 42.-100-yr. 6-hr. rainfall (in.)
-+-------j~:.·
-- II' ) ~~·
100-YEAR 6-HOUR RAINFALL (INCHES)
155'10'

t ,:d 1 rr:.::::.....'-.1 1 --t-1:~
MAUl
:d I I V / \I =:----::::::: J lrl
·~ ,.
:~1 I\, ,L"'I I
:.::1 y,. _,.-,;;-..,.., . -+--------1~::
W-A ,; I I />j/ / II I lv J ~ ::2JJ 1~;
.. ~· ,,..,. I ji\./\U/U -~ I ,,... "M' .. ~.,, . .. •. , "'I I \ - \ \ I ' I I J I I l I I fl' jj ~~ 'lc IS7~ JS6j4S' I so· C_.c \ J J / J
~~~:1 ~
"' ,.
NIIHAU
I ( / -1 I / ~-?'11 I .c p---c I ~:: '7 117 IJJ 7.'
HAWAII
HAhJTl•ILU
' .
I-YEAR IZ-HOUR RAINFALL (INCHES)
FIGURE 43.-1-yr. 12-hr. rainfall (in.)
~ 1:11
:::f---+--: --t-------1~50:
2.5 --
11 '1' I ====f" l A I - - //77 / I fl I 'J llJ;;:;c:-;l ,~;
,,..,. ,_, ,,..,. I 11\.1\U/\I -~ I IH'JO" ,,,...,. 151r45" . 151rSO" ···I I l: ~ \ \ I I I I I R I II (f ~ " , ,. . ,,1~ '"j" 1 so· ' • r r , J II
, .. ,.
!~_ ...... _ .. _______ _
NIIHAU
I
,,. ... HAWAII
FIGURE 44.-2-yr. 12-hr. rainfall (in.)
-------1:::
2·YEAR 12-HOUR RAINFALL (INCHES)
~ ~ ~---;:::~-~ALII II
o5J'iit
~1 ll ( ' -~1't-rx
-+-------~~r
ld - I O~(Qm I· ) \ 'l ""'- (9".
·v;~AJJ~ I ,
l~dl~:
HAWAII
ST&TUI( IIIli!
' "
5-YEAR 12-HOUR RAINFALL (INCHES)
FIGURE 45.-5-yr. 12-hr. rainfall (in.)
!1
A/" "":"> ~ ' ·~1 I r---- · .,. -1------....,~::
:::1 I Jj 1\ -=r==- ,", \ ?"-<* ""' I >1 0," \:"\
1/ I I I//'/'/ If ll\ I 1~·;
I i .,,..,. L> ,J.~- S:i I IKJ\UJ\1 ~ ~/ : I IS7"lD' IS'I"'S' _ 1!1-!1' l!lr">' _ • II (fl.., 4 t " •sr;oc:_ '"'j45 , 1 ~~:I--+---+----+------+J--+-+----I---\--------,1.-J.---...).._+-l:
::;.1--+++-+---
~~ ·--~--- . ~--1:>
NIIHAU
II /1/ ///·:7'1/ :,;/ 1- I 1:r
,-~1--..4--.--.l''' ~ ~~ 1-
HAWAII
H•lU1(1111LU , .
Io-YEAR 12-HOUR RAINFALL CINCHES)
FIGURE 46.-10-yr. 12-hr. rainfall (in.)

~ 00
lO" y ,,...-- "-=""'CI ,. -t-------1~:.-
:::1 l I . , -....., I ~ ... \ 7 <-L \i.~, I) ', 'Z"'
------------/
./
,5· -.... I 1/ 0.c/ / I I \ i l I \ I ~;. I J i I r ', 7
I i ,,.;,. 3~ I' 1""/\U/\1 -~a./ ~I ~5?-JO' ISJ015" 15_,. . 15t"SO' .. •• , I \) \ I I \ +--J'---+-+---f-,-'~---
11 a;:::::Ls .._ '""oo__. 0
'";~' . so· 1 1 •
:;-.1-----AA-
NIIHAU HAWAII
FIGURE 47.-25-yr. 12-hr. rainfall (in.)
.•. ~
25-YEAR 12-HOUR RAINFALL (INCHES)
.. . ...
,;:.. ~
161"41'
~::1 I .IT '-'""I -+-------1::.·
~I I li ~- ', I"'~' \ 7 -<-l '\~, I) ...... , \~
'""' ,,..... I IKAUAI "~L'" I 15~!d 15JOII' 151"45. 1511"50. I II ~ "M" ,, . .,. ~· I 'c::-:-..,\ II I I I ' I I ' , I ) II .. I .A 10 I I - I ----==------
~-1 1'.1 I
110'05°
C.l ::,:1 I r'i ' 1:
~~.~----+----r
NIIHAU
11o•o5·
I 1/ /' 1/ / I I / VI / / 7 7" / r 7 7L 1- ... I
~I ~-l 7-t' 1::.:
HAWAII
IT .. lUI(IIIlU
' .
SO-YEAR 12-HOUR RAINFALL (INCHES)
FIGURE 48.-50-yr. 12-hr. rainfall (in.)
1::~
1:11 c:>
:::1 I Y ;;?-Jl.d---- --+--------1~::
.,,~· .... ,. I ji\.1\Ul\1 ~~
Tiso· 'd~ ·~r•s' ,,•oo· ,,.,o· •wn· ·,~:J \:::---:.: J , J J J I I I ' ./ I J J 7_ 1.-. 1 1 I I ~ I 1.
C>
NIIHAU
... .,.
HAWAII
FIGURE 49.-100-yr. 12-hr. rainfall (in.)
STAIUI( .. ILIS
' . --f :;:
IOO·YEAR 12-HOUR RAINFALL (INCHES)

<:11
"""
111"41'
!:.~--~------~-r~~gr~-------- --+-------------1~::
, . ...
·1 / /'1 : I ; ; ; 1 rv 'Ill\- Ill Z ~;
IS7•JO' 11'"'1' llr41' 11rs~ I ,,!,.,. ,,;.,. : II 11\./\U/\1 -~ : I II d ~ .. ''I~ "'j41' I ~~r---t---.:~~=---~,-c,__ __________ -f---+----+------+----l-t--JI:--------------+----1---------t~~
~·I I 'k ........ ......,..._ I'" \~\ \', \\', \ I I;
110'01'
c:>: ~:1 I r~ ' 1:
~~ 21" - -NIIHAU
••o·oo·
1· I /' 7r / /7/ ,'$"3'/A/ =--- ...,I :;7
+----_,'<::""t-- ---~f----j ~7
HAWAII
STATVTI .. II.U
' .
I-YEAR Z4-HOUR RAINFALL (INCHES)
FIGURE 50.-1-yr. 24-hr. rainfall (in.)
f!J
,. 145'
151'00'
FIGURE 51.-2-yr. 24-hr. rainfall (in.)
SU.1ult WllU
'' .
2-YEAR 24-HOUR RAINFALL(INCHESl

~
~~-r-------t---¥----=:>....""~---- --t-------1~::
~~:1 I ~ i I 1\ I ........ ,",.. \ ,~L . .., \{~\ I 7 1 ", \{~
1/ I I I / ~ I I I I I II '<- I ~~~-
~ ~ .~ ,,..,. 2.5~ I III..J\UJ\1 -~/ I
151"'!0' 15,..5' 1511".5' ''t-SO' ot• II a:~ ''j~ 151j•'· I so·f--+-\----------j-----------jft----+-+-----j-+--------h,!-----+-t-f
:.;.J I 1\ l f 'k ',\'~, \\\\\'. I --j
I I 7/ !1/ I 1/ 7,....:?74 :::
~· to '~:
NIIHAU HAWAII
FIGURE 52.-5-yr. 24-hr. rainfall (in.)
5UTUUIIILU .
S-YEAR 24-HOUR RAINFALL !INCHES)

~ :1 I Jt~l I II:~
::.1 I V;.~b,l --+-------1~:.·
:~1 I J) I'>" ...---i--.\ \ ~&· ~\ ~'
:I' I ·- --. I y~f lfi i)l:W 1:.: { I ·-'
I ,.,!.. - 3r ,J.,.. I I IKAUAJ~/ I
·ir ·~ .. ~ .. · ..... ..~ .. · ....... ~1 1 lk - \j 1 1 1 1 ' ' 1\ JJ J 11 • • • - I...., I I ' I I \
... I H ~" I " \~ ~' 'B I 10'\: r , ~1\
~~·1-t----+--i:
NIIHAU
·I f / f / / / L77 v I ~ I I"' · 7 7 I 7 / 7 71 T / 7".
::;1 :'\.'I l 1:.::
HAWAII
ITATUT[IIIIlU
'
10-YEAR 24-HOUR RAINFALL (INCHES)
FIGURE 53.-10-yr. 24-hr. rainfall (in.)

' ' , ~ I ::;I I H (' I" ''~<,~ \' I
g:
......
~:.-1 I f r=2::::sta -4------------~~
:::1 I .Jl I\ =:........~~\ / ')l y., I) =:.., "{~
w ~ . -NIIHAU
-~·
:1 I / 7r // / 7s:"-~~~ V I 7~, I..._,- I 1:::
:·1 'x:l ,',. 1~:
HAWAII
ITATUU .. Il.U . ~
25-YEAR 24-HOUR RAINFALL (INCHES)
FIGURE 54.-25-yr. 24-hr. rainfall (in.)
~ =
~I I~ I -tc
r c:> I ~::1 I ,.r 7 ""C -+--------1~::
:I // // 7/ !,L 71// 7~~~~)1 1/ I 7/ 7L 'i------ I 1:::
~·I "' 1' o;;:::;::::::: :____;;;;?<? ---l~:
1-+----+---+~~:
NIIHAU HAWAII
FIGURE 55.-50-yr. 24-hr. rainfall (in.)
STATUI( lllll.U , .
SD-YEAR 24-HOUR RAINFALL(INCHES)

::;.1 l'l: l E ....---....1'-,\x\d\ \','• I I
~
15S•oo'
.. --1-------i~~:
:~1 . J' I I ' \ >- ===--- k "'''~\\ \ ..,. -2l "<.~, I ? ", '<."\
:1 l Ao\ _ ', I Jr/r77fC ;r I l I r -· \ l\ \ _ I ~~·;.
~·I "0....,.1 - l.. 1:::
f-+----+---1:~:
NIIHAU HAWAII
FIGURE 56.-100-yr. 24-hr. rainfall (in.)
SIATUT(IIILU , . -----1:::
100-YEAR 24-HOUR RAINFALL (INCHES)

Con 00
II_.IUiliiii .. U
~-......!. -- , 10
PROBABLE MAXIMUM 6-HOUR PRECIPITATION HAWAII
FIGURE 57.-Probable maximum 6-hr. point precipitation (in.)

~
....... IM"OO' ( IN"OO'
d I ~I I Tl .... (\_ ·~ ... ~.,J. ~~-+------1::-
: ·~
~~~~~~..:. ,,..
160'1!1' -- ,,. ,,.
C1 ~~~ sr.o.run 1111\.U
s 0 ' 10 ~ ~0
::;.f--++-i-----'\---'..---+-----'6'----1---1 ,,.,,. '"'00'
::;. RATIO OF
:~: II PROBABLE MAXIMUM 6-HOUR PRECIPITATION NIIHAU HAW All I TO 100-YEAR 6-HOUR RAINFALL
FIGURE 58.-Ratio of probable maximum 6-hr. precipitation to 100-yr. 6-hr. rainfall (figs. 57 and 42).

z 0 1-<( 1-a.. u LLJ 0::: a.. 1-z 0 a.. 0::: :::> 0 :I:
I (0
::E :::> ::E X <(
::E LLJ ..J (Il <( (Il
0 0::: a.. u.. 0
1-
180
160
140
120
100
80
60
40
z 20 LLJ u 0::: LLJ a..
I I I I I I I I I I
- -~ '
"' !'----r---- -1--.. r---~4-Hour -...... r---- I
"' r---~-Hour -r--....
~ -....... r----
!'---- r---to-- 12-Hour -t-- I
~ r----9-Ho~r 1'---
6-HoL
-r---t---
~ -r---- ....
............... t---'3-Hour
1- I -j"'-...._
2-Hour
r--- I
~ !-Hour -
t---30-MinJte
1- -I I I I I I _l _l I I
20 40 60 80 100 120 140 160 180 200 AREA (Square Miles)
FIGURE 59.-Depth-area-duration curves for probable maximum precipitation (fig. 57).
EXAMPLE: Determine hourly increments of 12-hr. PMP for a 30-sq. mi. watershed located on Oahu at 21 °30' N., 158°00' W. Figure 57 indicates a 6-hr. point PMP of 24 in. for that location. For 30 sq. mi., figure 59 yields reduction factors for 1, 2, 3, 6, 9, and 12 hr. of 36, 52, 64, 88, 106, and 119 percent, respectively. Multiplying 24 in. by these factors yields 8.6, 12.5, 15.4, 21.1, 25.5, and 28.5 in. Plot these amounts against their respective durations to obtain the depthduration curve of PMP for 30 sq. mi. Hourly increments of PMP read from this curve would be 8.6, 3.9, 2.9, 2.2, 1.8, 1.7, 1.6, 1.5, 1.3, 1.2, 1.0, and 0.8 in.
60 U. S. GOVERNMENT PRINTING OFFICE : 1962 0 - 656887