u.s. department of agriculture - esri/media/files/pdfs/library/bestpractices/agriculture.pdf · gis...
TRANSCRIPT

GIS Best Practices
U.S. Department of Agriculture
August 2006

Table of Contents
i
What Is GIS? 1
GIS for the United States Department of Agriculture 3
USDA Uses GIS in Its Common Computing Environment 5
Safeguarding Animal Health More Effectively 9
USDA Web Soil Survey Supports Public Access to 13Volumes of Data
U.S. Forest Service and BLM Collaborate in Land Management 19
USDA GIS Applications 23
GIS Education at USDA 27
GIS Applications of Interest to the USDA 31
USDA/ESRI Contact Information 43

GIS BEST PRACTICES 1 WWW.ESRI.COM/AGRICULTURE
What Is GIS?Making decisions based on geography is basic to human thinking. Where shall we go, what will it be like, and what shall we do when we get there are applied to the simple event of going to the store or to the major event of launching a bathysphere into the ocean’s depths. By understanding geography and people's relationship to location, we can make informed decisions about the way we live on our planet. A geographic information system (GIS) is a technological tool for comprehending geography and making intelligent decisions.
GIS organizes geographic data so that a person reading a map can select data necessary for a specifi c project or task. A thematic map has a table of contents that allows the reader to add layers of information to a basemap of real-world locations. For example, a social analyst might use the basemap of Eugene, Oregon, and select datasets from the U.S. Census Bureau to add data layers to a map that shows residents’ education levels, ages, and employment status. With an ability to combine a variety of datasets in an infi nite number of ways, GIS is a useful tool for nearly every fi eld of knowledge from archaeology to zoology.
A good GIS program is able to process geographic data from a variety of sources and integrate it into a map project. Many countries have an abundance of geographic data for analysis, and governments often make GIS datasets publicly available. Map fi le databases often come included with GIS packages; others can be obtained from both commercial vendors and government agencies. Some data is gathered in the fi eld by global positioning units that attach a location coordinate (latitude and longitude) to a feature such as a pump station.
GIS maps are interactive. On the computer screen, map users can scan a GIS map in any direction, zoom in or out, and change the nature of the information contained in the map. They can choose whether to see the roads, how many roads to see, and how roads should be depicted. Then they can select what other items they wish to view alongside these roads such as storm drains, gas lines, rare plants, or hospitals. Some GIS programs are designed to perform sophisticated calculations for tracking storms or predicting erosion patterns. GIS applications can be embedded into common activities such as verifying an address.
From routinely performing work-related tasks to scientifi cally exploring the complexities of our world, GIS gives people the geographic advantage to become more productive, more aware, and more responsive citizens of planet Earth.

GIS BEST PRACTICES WWW.ESRI.COM/AGRICULTURE3
GIS for the United States Department of AgricultureThe United States Department of Agriculture (USDA) generates large volumes of agricultural data, most of which contains geographic information. For years, the USDA has relied on ESRI’s GIS software to leverage this data to make intelligent maps for assessing land use, analyzing a multitude of agricultural projects, and providing the public with a clear understanding of the nation’s farmlands.
The ability of GIS to communicate complex concepts helps people to better understand regionwide and site-specifi c agricultural issues. The USDA’s data storehouses are immense. ESRI’s GIS technology supports the advanced levels of interoperability required by the USDA that help people access and use the right data for the right map. The USDA uses the rich functionality of ArcGIS software for geospatial analysis such as predictive modeling for risk assessment, thematic layers for crop yield analysis, and multivariable correlative analysis for environmental impact assessment. The ArcGIS infrastructure provides the foundation for distributing interactive mapping on the Internet so that many people can use USDA’s data for many purposes.
The benefi ts of using GIS in agricultural government include the following:
Work effi ciency
Revenue generation and cost recovery
Improved accuracy
Task automation
Access to government data
Time and cost savings
Decision-making support
Resource management
Enhancement of public participation
Collaboration between departments

GIS BEST PRACTICES WWW.ESRI.COM/AGRICULTURE5
USDA Uses GIS in Its Common Computing EnvironmentThe United States Department of Agriculture (USDA) Farm Services Agency (FSA), the Natural Resources Conservation Service (NRCS), and Rural Development Agencies are colocated to provide one-stop shopping for their customers. These county-based agencies are commonly referred to as the Field Service Center (FSC) agencies. Beginning in the mid-1990s, FSC began a business process to develop shared business applications and implement a shared common computing system called the Common Computing Environment (CCE). As part of this initiative, in 2002, GIS data was migrated to a shared server in 2,850 county offi ces, and in 2003, USDA’s geodata warehouse was integrated into the enterprise system. This warehouse and the Geodata Gateway were implemented to deliver data to these shared servers and also serve e-government applications that make it possible for customers to complete some transactions from their homes or businesses.
Before the implementation of the geodata warehouse and Geodata Gateway, Field Service Center’s data management was disconnected with all data held at the local level. Data distribution was by means of a tape or CD-ROM. Processes were manual and time consuming, staff members bore a heavy workload, and it was impossible to keep data up to date. Today, data is still locally maintained, but enterprise GIS has made data management easier. Data can be ordered by means of the Geodata Gateway Web site and delivered via CDs or FTP download.
The process of establishing a nationally shared geospatial data system at the USDA’s Field Service Center followed a defi ned plan. ESRI provided day-to-day support for the project implementation. First, a directory structure for storing geospatial data was established to facilitate data categorization. Then, the GIS team worked to standardize the fi le-naming conventions for the geospatial data to provide consistency. Next, the team migrated geospatial data at the service centers to the servers. This was done both manually and using data migration tools

JULY 2006 U.S. DEPARTMENT OF AGRICULTURE6
Field Service Center agencies' GIS Web applications provide land usersaccess to soil, water, and climate, plants, farm fi eld boundaries, and other data.
The Field Service Center implemented new standards so that geospatial data could be automatically distributed from the Geodata Gateway, FSA’s Aerial Photography Field Offi ce, and the NRCS National Cartography and Geospatial Center. The standards also allow for automatic refresh of geospatial data when newer GIS software versions become available. Finally, data standardization aids the development of future applications that access geospatial data. ArcGIS supports USDA’s robust data warehouses. The interoperability standards make it possible for various datasets and system types to work together.
This geodata warehouse and the Geodata Gateway are part of the national spatial data infrastructure and geodata.gov and provide access to Field Service Center databases on soil, water and climate, plants, farm fi eld boundaries, and other subjects. Web sites within the NRCS

GIS BEST PRACTICES WWW.ESRI.COM/AGRICULTURE7
node are either GIS related or contain data, documentation, or models that may be useful to GIS users.
The CCE has centralized static, local, and volatile data. GIS Web applications built on ArcIMS are used where appropriate to distribute GIS functionality.
The Field Service Center has released a family of automated tools for employees working with land users. These tools, built on ArcGIS, will help staff work with land users to spatially analyze their land information. The staff member inputs information into GIS about the land user’s intent for a given property such as a 160-acre row crop land fi eld, 20,000 acres of range land, a small truck farm, or even a pony pasture. By using these tools, the staff member and land user can consider conservation needs and resource availability and restrictions.
Benefi ts of the Field Service Center GIS and geodata warehouse implementations are exemplifi ed by the USDA Kansas NRCS. Because of an increase in workload, Kansas NRCS was compelled to migrate from hard-copy to digital data capture, analysis, and reporting through GIS. This supported its Environmental Quality Incentives Program (EQIP). Natural resource geospatial data was processed and distributed to 104 county fi eld offi ces. Each EQIP application was assessed with GIS using application evaluation criteria set forth in program policy. Following evaluation of all applications, data was transferred to a centralized location and merged into a statewide dataset to further manage and analyze EQIP. The transition to a digital automated process of evaluating EQIP applications saved Kansas NRCS more than 11,000 hours and increased county-and statewide consistency.
(Reprinted from the Summer 2005 issue of Federal GIS Connections newsletter.)

GIS BEST PRACTICES WWW.ESRI.COM/AGRICULTURE9
Safeguarding Animal Health More EffectivelyAnimal identifi cation programs in the United States date back more than 100 years. In the late 1800s and early 1900s, ownership of large animals was verifi ed by branding or ear notching. Later, individual animal identifi cation systems, maintained using ear tags, tattoos, and other methods, were needed for registration and record keeping. These identifi cation systems were subsequently expanded for use in tracing the movement of infected animals during disease outbreaks and as part of disease eradication programs.
Efforts to expand and enhance animal identifi cation and tracking in the United States are now driven by additional and more pressing issues—possible homeland security threats to the food supply; the need for coordination with emergency management programs; consumer concerns about food safety; and the challenges of disease surveillance and response in an era of global trade.
Dr. Leslie Cole, a staff veterinarian with the Oklahoma Department of Agriculture,Food, and Forestry, Animal Industry Services, enters premises data using a GPS unit.

JULY 2006 U.S. DEPARTMENT OF AGRICULTURE10
In 2004, the United States Department of Agriculture (USDA) Animal and Plant Health Inspection Service (APHIS) announced the National Animal Identifi cation System (NAIS). The difference with this plan is that it proposes to comprehensively identify and track the movements of farm animals and some other kinds of animals in a way that is well documented and allows for a complete trace back in a very short period of time—48 hours. This more robust requirement is part of homeland security efforts but also has benefi ts for responding to and managing naturally occurring disease outbreaks.
USDA has entered into cooperative agreements with state and tribal governments to implement a national animal identifi cation system. This system will provide offi cials with the information necessary to safeguard the national food supply from attack by terrorists or natural disease outbreaks. NAIS offers a unique opportunity to develop a system that protects animal health while protecting the public.
The system’s goal of identifying animals and premises that have been exposed to disease within 48 hours of the outbreak report requires registering animal premises, gathering animal identifi cation data, and tracking animals through the system.
GIS BEST PRACTICES WWW.ESRI.COM/AGRICULTURE11
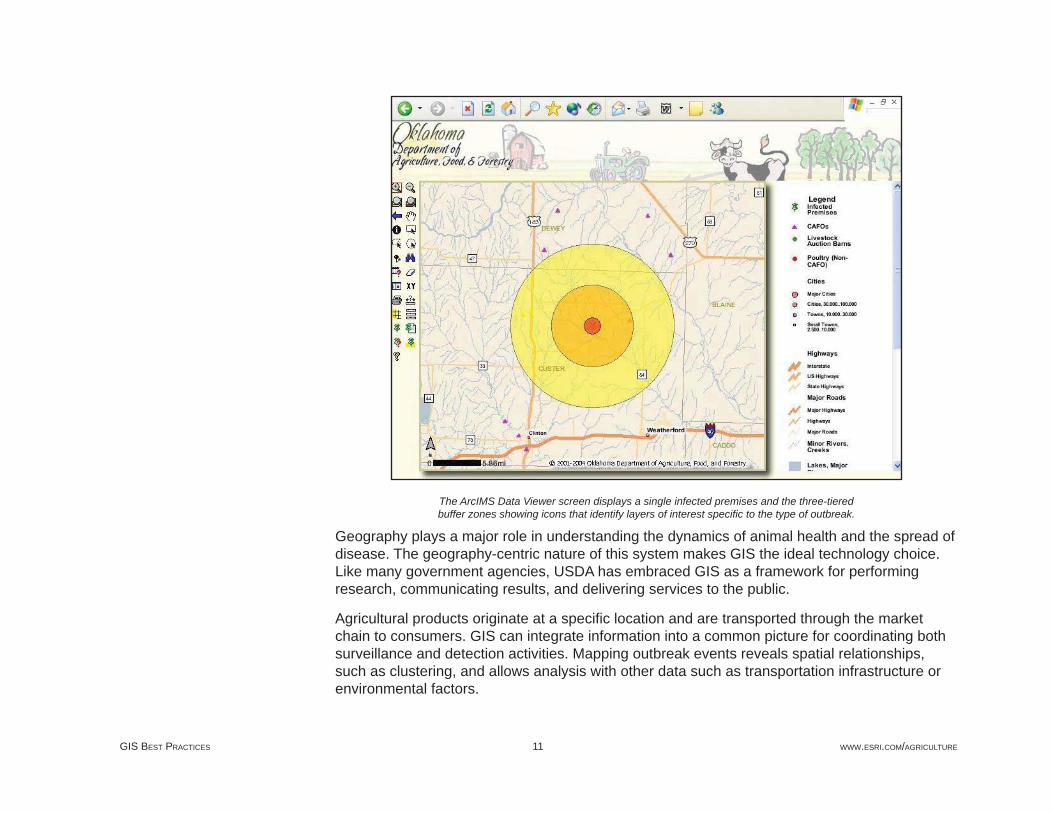
The ArcIMS Data Viewer screen displays a single infected premises and the three-tieredbuffer zones showing icons that identify layers of interest specifi c to the type of outbreak.
Geography plays a major role in understanding the dynamics of animal health and the spread of disease. The geography-centric nature of this system makes GIS the ideal technology choice. Like many government agencies, USDA has embraced GIS as a framework for performing research, communicating results, and delivering services to the public.
Agricultural products originate at a specifi c location and are transported through the market chain to consumers. GIS can integrate information into a common picture for coordinating both surveillance and detection activities. Mapping outbreak events reveals spatial relationships, such as clustering, and allows analysis with other data such as transportation infrastructure or environmental factors.

JULY 2006 U.S. DEPARTMENT OF AGRICULTURE12
The fi rst step in implementing a national animal identifi cation system is identifying and registering premises associated with the animal agriculture industry. Identifying premises where animals mingle must be established before animal movement can be tracked. Currently, more than 90,000 animal premises have been assigned unique premises identifi cation numbers.
During a disease outbreak, animal health authorities can easily access premises location data from a GIS and investigations can progress rapidly and effi ciently. In addition, mobile GIS aids in rapid reporting and updating of information from the fi eld so outbreak trends can be identifi ed.
Through NAIS, tribal, state, and local governments are developing innovative approaches that take advantage of GIS technology to control, eradicate, monitor, and survey animal diseases. The Oklahoma Department of Agriculture, Food and Forestry (ODAFF), Animal Industry Services is implementing a NAIS premises identifi cation program using GIS.
ODAFF’s program, developed with authorized ESRI consultant and reseller Strategic Consulting International, inventories infrastructures critical to animal agriculture, allows identifi cation of infected premises, and profi les potential disease outbreaks. ODAFF’s ArcIMS site can generate buffer zones surrounding an infected premises and quickly identify critical infrastructure data within these buffer zones. This program makes data readily accessible and supports fi eld response capability in the face of an animal emergency.
(Reprinted from the October–December 2005 issue of ArcUser magazine.)
GIS BEST PRACTICES WWW.ESRI.COM/AGRICULTURE13
USDA Web Soil Survey Supports Public Access to Volumes of DataThe National Cooperative Soil Survey, which began more than a century ago, is now accessible via a GIS-enabled Web site.
The soil survey is an inventory of the nation’s soil resources that is designed to help land managers determine the crops and management practices most suitable for soils on their land parcel. Authorized by Congress in 1896 and placed under the auspices of the U.S. Department of Agriculture (USDA), survey fi eld operations began in 1899. Today, the survey has identifi ed more than 300 soil properties, and by using digital imagery for overlaying data on data, it offers a tool for in-depth soil suitability analysis. GIS helps soil survey data seekers identify the best way to protect soil and water quality, as well as identify how land parcels are suited for specifi ed land uses. GIS has been an important addition to the survey, adding capabilities of data access, analysis, spatial display, and now a high volume of distribution.
In August 2005, the USDA Natural Resources Conservation Service (NRCS) launched the Web Soil Survey on the Internet. The Web Soil Survey helps USDA meet two of the U.S. president’s management agenda items: to eliminate paperwork and to make government services accessible to more people. Prior to the Web Soil Survey going live on the Internet, soil survey maps and data were printed and bound into soil survey books that were free to the public at local USDA Service Centers, NRCS fi eld offi ces, and public libraries. People would obtain the county’s entire soil survey book, then have to fl ip through it to fi nd specifi c information. Now soil survey users can connect to the Internet, select a land parcel anywhere in the country, access the survey database, see the specifi ed parcel on a map, generate soil interpretations, and download or print a PDF fi le.

JULY 2006 U.S. DEPARTMENT OF AGRICULTURE14
Online users select a plant community and assess the suitability and limitationsof a specifi ed ecological site. They can read about the specifi c details and view a map.
Ken Harward, Web Soil Survey project manager, says, “The Web Soil Survey is saving a lot of USDA staff time. In the past, county offi ce staff would spend an hour or two working with individual clients. Our customers now see the Web Soil Survey site as self-service technology that they access at their business, residence, or public kiosk. This frees agents to allocate customer service time to those who truly need it.”
The Web Soil Survey project was initiated by NRCS’ West Texas Telecommunications project and Information Technology Center teams. They began the project by coordinating with federal, state, and local representatives to develop a list of business requirements from which they built a plan for the Web site. The main goal was to meet the needs and levels of the Web site’s users.
GIS BEST PRACTICES WWW.ESRI.COM/AGRICULTURE15
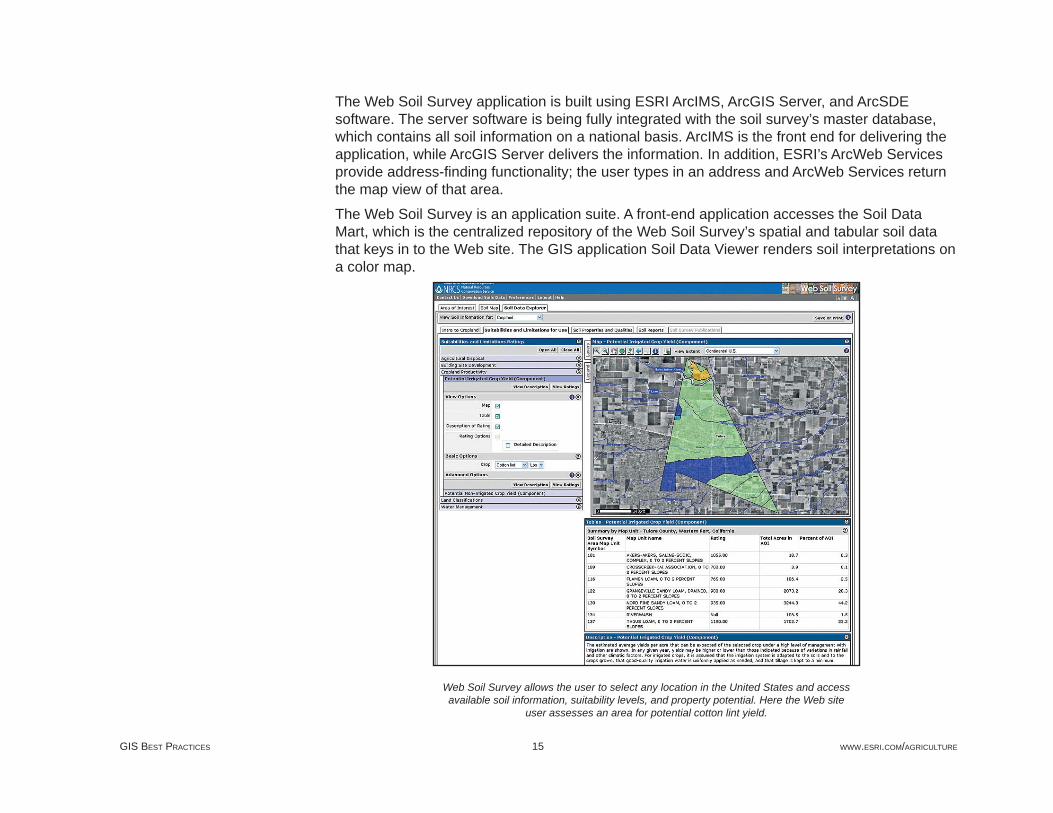
The Web Soil Survey application is built using ESRI ArcIMS, ArcGIS Server, and ArcSDE software. The server software is being fully integrated with the soil survey’s master database, which contains all soil information on a national basis. ArcIMS is the front end for delivering the application, while ArcGIS Server delivers the information. In addition, ESRI’s ArcWeb Services provide address-fi nding functionality; the user types in an address and ArcWeb Services return the map view of that area.
The Web Soil Survey is an application suite. A front-end application accesses the Soil Data Mart, which is the centralized repository of the Web Soil Survey’s spatial and tabular soil data that keys in to the Web site. The GIS application Soil Data Viewer renders soil interpretations on a color map.
Web Soil Survey allows the user to select any location in the United States and accessavailable soil information, suitability levels, and property potential. Here the Web site
user assesses an area for potential cotton lint yield.
JULY 2006 U.S. DEPARTMENT OF AGRICULTURE16
Because the Web site provides single-point access, the user can access available historical and current soil survey data. Traditional publications created during the past years are available as PDFs for viewing or downloading for selected areas. On the interactive GIS map, the user can outline an area of interest (from 3 to 10,000 acres) and select a usage option. The application provides suitability levels of the area for the selected land use.
The Soil Data Mart is the authoritative soil survey data source. It ensures that users will get a consistent view of the data whether from the county offi ce, the state offi ce, or the Web. A transactional database is routinely maintained by soil scientists throughout the United States who keep the data up to date for every county in the nation. Earlier dataset versions are maintained in the warehouse and made available for other analyses, such as temporal comparisons. NRCS also employs various Web services for access to plant information, ecological site data, and local county offi ces’ maps and information.
The soil survey is a collaborative effort requiring a set of standards to support data integration. Jim Fortner, USDA soil scientist at the National Soil Survey Center, explains, “The National Cooperative Soil Survey program is a collection of federal agencies, state partners, and local partners. A standard data model is established for collecting data. We are working with these agencies to collect site data. NRCS manages the soil survey database for all partners.”
The Web Soil Survey offers approximately 50 national standard interpretations. Users can select interpretations, such as installing a septic tank or sewage lagoon, building a house, or determining production potential of different types of crops. For example, a farmer considering purchasing a farm from a choice of three options wants to evaluate which farm will best suit his needs. Using the Web Soil Survey, he locates each farm on an interactive map and selects an interpretation, such as cotton lint, and the application accesses the database soil types to indicate which farm would be most productive. The information includes the criteria used to generate the interpretation, a breakdown of all the different soil components within the interpretations, and the suitability and limiting factors. A color-coded spatial representation gives the farmer an idea of the selected properties’ levels of suitability: Suited, Some Limitations, and Not Suited.
Other rating interpretations are land applications for different wastewaters, including water treatment plants; different land applications methods; productivity of cropland, rangeland, and forestland; and suitability for different recreational developments, such as paths and trails, campsites, and picnic grounds. Sanitary facility site interpretations include landfi ll and the material for covering the landfi ll. Urban interpretations help city and county offi cials manage

GIS BEST PRACTICES WWW.ESRI.COM/AGRICULTURE17
development. A user considering building a house can fi nd information that may lead to reinforcing a building’s foundation. Other interpretations are useful for road construction, tax assessment, and a number of other user needs.
Adding new functionalities to the Web Soil Survey project is a constant endeavor. Dennis Williamson, state GIS specialist for NRCS Texas, explains, “Eventually, USDA customers will be able to log in to their USDA case fi les and drop in information, such as property boundaries, for quick access to information about selected properties in their fi les.”
Other enhancements on the immediate horizon are adding a scale bar and a tool to zoom to a stated scale. Some states use the Public Land Survey System, based on township, section, and range, so a function will be added to apply these defi nitions for navigating the map.
The Web Soil Survey is the beginning of a new era for NRCS and delivery of soil survey information. The feedback on the site has been extremely favorable. The Web Soil Survey administrators have already received a great number of compliments from Web site users. One enthusiastic Web site visitor exclaims, “The Web Soil Survey may be the greatest program that the federal government has ever provided!”
(Reprinted from the Winter 2005/2006 issue of ArcNews magazine.)

GIS BEST PRACTICES WWW.ESRI.COM/AGRICULTURE19
U.S. Forest Service and BLM Collaborate in Land ManagementUsing E-Gov for Planning and NEPA
The forests of Southern California experience some of the heaviest use of any public land in the United States today. Intense recreational use, growing urbanization, and the need to restore and maintain native species habitat are some of the land management challenges faced by the U.S. Forest Service in the Angeles, Cleveland, Los Padres, and San Bernardino national forests. Recently, the Southern California forests published draft forest plans to provide forestwide strategic direction as well as a draft environmental impact statement (DEIS) that describes the environmental analysis and conclusion of the forest plans. In the plans, the Forest Service recommends an increase in both wilderness-designated areas and off-road vehicle access. For these forests, this could mean approximately 100,000 additional acres are available to be congressionally designated as wilderness and other land zones to accommodate a range of recreation opportunities.

JULY 2006 U.S. DEPARTMENT OF AGRICULTURE20
An interactive Web site supports community input.
On May 14, 2004, the plans were posted for the public to review and comment on the proposed land use allocations in Southern California’s national forests. Aligning itself with federal legislation, such as the Government Paperwork Reduction Act, the President’s Management Agenda, Clinger Cohen Act, and the E-Gov Initiative, the Southern California Plan Revisions Team that assembled to revise the Southern California plans has volunteered to participate with the Bureau of Land Management (BLM) in the development and use of the ePlanning system.
ePlanning is a Department of the Interior project, developed by ESRI’s Professional Services Division and managed by the BLM, that establishes a new mechanism for creating, managing, and publishing within the land management process. Based on ArcGIS technology, ePlanning encourages participative and collaborative land use planning and focuses on managing and publishing text and map-based planning information. Land use planning content is inherently geographic and provides a good opportunity to develop a new ArcGIS attribute by building tools

GIS BEST PRACTICES WWW.ESRI.COM/AGRICULTURE21
that allow land planning text to be managed using relational database technology where text-based decisions are tied to points on the ground in GIS.
ePlanning allows users to simultaneously create and manage the basic publication elements (text, graphics, tables, maps, etc.). In addition, using ePlanning provides the fl exibility to combine the elements in different formats for different outputs (Web and paper), link text to geography (spatial data), and link public comments to text and spatial data.
BLM uses the ePlanning Web site for publishing land use content.
Because ePlanning is Web based, the Southern California Plan Revisions Team can access the system from any Internet-connected computer. This advantage allows team members to see changes in real time and reduces travel costs to internal Forest Service meetings. The four Forest Service plans are available for review at www.fs.fed.us/r5/scfpr on the Web. Public

JULY 2006 U.S. DEPARTMENT OF AGRICULTURE22
comments on the plans will help the Forest Service develop the fi nal forest plans, which will guide all natural resource management activities in the four forests for the next 10 to 15 years.
BLM is currently seeking federal agencies as partners for development, testing, and implementation of ePlanning technology, with the goal of governmentwide implementation.
(Reprinted from the Fall 2004 issue of Federal GIS Connections newsletter.)
GIS BEST PRACTICES WWW.ESRI.COM/AGRICULTURE23
USDA GIS ApplicationsRegional analysts for the Production Estimates and Crop Assessment Division (PECAD) of the U.S. Department of Agriculture Foreign Agricultural Service use GIS to collect market intelligence and forecast reliable global production numbers for grains, oilseeds, and cotton. The agency is responsible for global crop condition assessments and estimates of area, yield, and production for these crops and reporting on conditions affecting food security in the world. With GIS, analysts can make use of data from many sources—satellite data, input databases, climate data, crop models, and data extraction routines for yield and area estimates.
PECAD has made data model results and ancillary data more accessible through the use of ArcIMS. The Crop Explorer Web application features near real-time global crop condition information based on the satellite imagery and weather data processed by PECAD. The Web mapping application uses ColdFusion, Java, ArcIMS, SQL Server, and ArcSDE to manage and store the geospatial data.
The Customer Service Toolkit (CST), a collection of software tools, was developed by the Natural Resources Conservation Service (NRCS) for USDA fi eld employees who work with the public. Using CST, these fi eld employees provide information to farmers and ranchers that promotes land conservation. Partner agencies that provide conservation planning and resource assessment information also use CST. The ArcView extension included in CST supplies mapping and access to geospatial datasets such as orthoimagery, soils, and conservation themes. Ongoing enhancements to CST add new data sources and functionality.
The goal of the Geospatial Data Gateway is to “deliver data to anyone, anywhere, anytime.” The Gateway eliminates time-consuming searches of multiple Web sites by providing a single access point for resource data. Data can be located by geographic area using a map interface or latitude and longitude coordinates. Data is delivered in formats that are compatible with commerical and service center applications.
(Reprinted from the April–June 2004 issue of ArcUser magazine.)
Production Estimates and Crop Assessment Division of the Foreign Agricultural
Service
Natural Resources Conservation Service
Customer Service Toolkit
Geospatial Data Gateway
JULY 2006 U.S. DEPARTMENT OF AGRICULTURE24
Major fi re seasons in the years 2000 and 2002 in the western United States have raised public demand for more effective wildfi re management. Political attention instigated an interagency National Fire Plan that calls for more aggressive treatment of fuels and additional fi refi ghting capabilities. GIS is part of that plan.
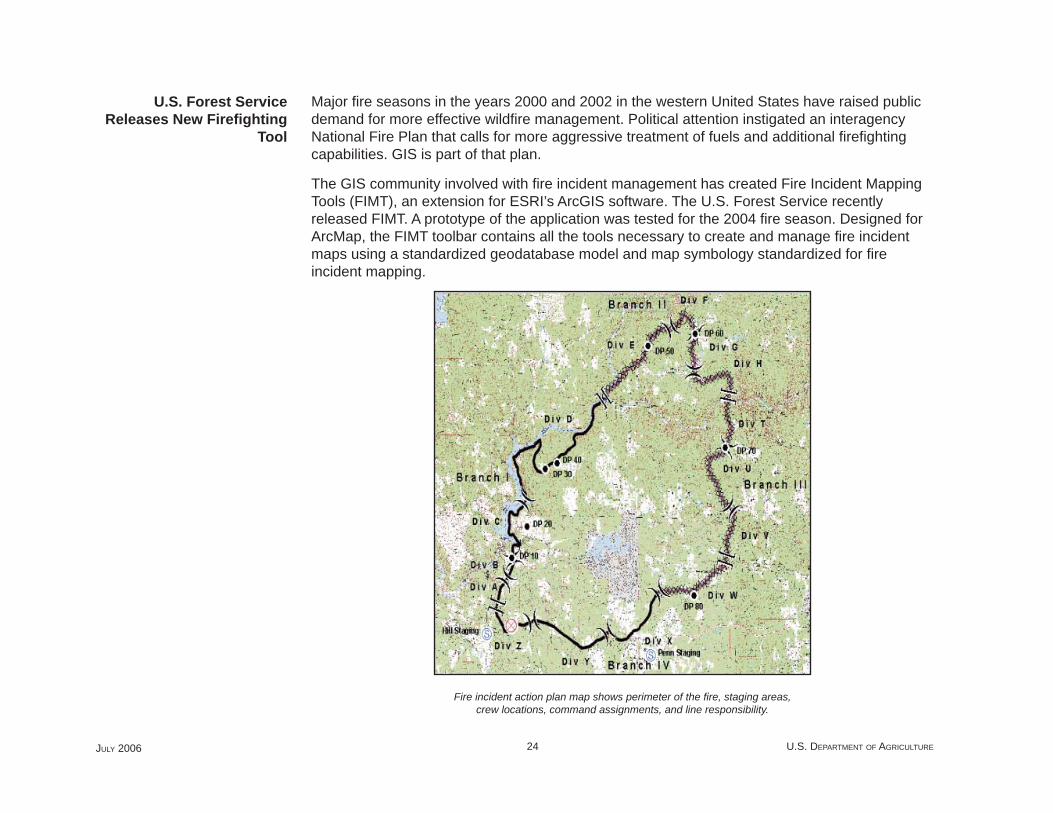
The GIS community involved with fi re incident management has created Fire Incident Mapping Tools (FIMT), an extension for ESRI’s ArcGIS software. The U.S. Forest Service recently released FIMT. A prototype of the application was tested for the 2004 fi re season. Designed for ArcMap, the FIMT toolbar contains all the tools necessary to create and manage fi re incident maps using a standardized geodatabase model and map symbology standardized for fi re incident mapping.
Fire incident action plan map shows perimeter of the fi re, staging areas,crew locations, command assignments, and line responsibility.
U.S. Forest Service Releases New Firefi ghting
Tool

GIS BEST PRACTICES WWW.ESRI.COM/AGRICULTURE25
FIMT is based on the well-established Incident Command System (ICS). Those who have worked with ICS will notice the familiarity of terminology, processes, and symbols of FIMT because its design uses ICS as a standard.
The FIMT application provides fi re GIS technicians the ArcMap tools needed to produce data that supports fi re incident mapping. As a component to the FIMT tools, a standardized geodatabase model was developed to store fi re incident features. It provides a consistent framework for all fi re GIS personnel using FIMT. The standardized geodatabase model provides easier uploading and processing of fi re perimeter information at a national level.
The FIMT toolbar includes buttons and tools for depicting fi re perimeters, management designations and command assignments, fi re points, and fi re lines. The fi re perimeters are managed using several feature classes that work together through the FIMT tools. These feature classes act as a collection of objects that are used to represent the outer perimeter of a fi re, the assignment of portions of the perimeter to individual crews on the ground, and point locations that indicate command assignments and line responsibility.
Fire points are used to represent point locations such as drop points, spot fi res, staging area, hazards, and many other features using accepted standardized symbology. Point locations are input into the database using heads-up digitizing and from latitude/longitude locations received from the fi eld and from aircraft. Fire lines show the current status of the fi re perimeter, planned and existing defensible fi rebreaks, and other linear features that must be managed by crews on the ground.
FIMT archives and generates fi re progression maps, which provide a historical representation of the incident and support postfi re restoration projects.
Prototype implementation during the 2004 fi re season has shown that FIMT combined with ArcGIS is a powerful tool for managing fi re incident data.
(Reprinted from the Winter 2005 issue of Federal GIS Connections newsletter.)

GIS BEST PRACTICES WWW.ESRI.COM/AGRICULTURE27
GIS Education at USDAThe Graduate School, USDA has been offering career-related and continuing education courses to professionals and federal, state, and local employees throughout the country for more than 80 years. With its national reach and considerable experience providing professional education, The Graduate School, USDA provides an ideal venue for this GIS program.
The Graduate School, USDA will begin offering the Professional Certifi cate in GIS beginning in March 2005. Global View will be partnering with The Graduate School, USDA and other academic institutions in key cities across the United States to offer this unique and effective program nationwide. Global View is a geospatial technologies fi rm that provides consulting services to government agencies. In addition, it provides GIS guidance on program development and marketing, instructor selection, and course and curriculum creation.
Designed by GIS professionals, the Professional Certifi cate in GIS provides a fundamental yet practical understanding of geospatial technologies. This certifi cate program has been designed for busy professionals needing a thorough understanding of GIS technologies. The program consists of core courses that address knowledge central to GIS and a range of elective courses that focus on specifi c uses, techniques, and integrative aspects of GIS. As GIS and related technologies are increasingly integrated into organizations and become an extension to more traditional enterprise architecture, a variety of workers are fi nding themselves exposed to new technological tools and concepts.
The Professional Certifi cate program, as developed, is not exclusively academic. Courses in this program do cover fundamental concepts and theories, but they are offered in a “need-to-know” fashion in order to provide context to GIS tools and techniques. The focus of this program is to provide professionals with the knowledge and techniques required to perform their jobs. Practical, hands-on experience is the goal.
USDA Graduate School Offers Professional
Certifi cate in GIS

JULY 2006 U.S. DEPARTMENT OF AGRICULTURE28
All participants take a selection of core courses that provide the foundation and context for GIS. These courses address the key components of the technology. Included is a technical software course using ArcGIS by ESRI, wherein students are introduced to the software by means of hands-on exercises. Additional important topics include spatial data and database issues, cartographic principles, and how to approach GIS projects. Elective courses help participants focus on topics or application areas relevant to their professional needs. Two primary categories of elective courses are Tools and Techniques, focusing on advanced technology topics and Application Areas and is geared toward specifi c industry GIS applications. Application Areas courses incorporate case studies as well as pertinent hands-on exercises. The Professional Certifi cate in GIS is granted at the conclusion of six core and two elective courses.
Global View is in discussions with other institutions as well, with a goal of bringing the Professional Certifi cate program to 20 key cities and regions during the next year.
(Reprinted from the Winter 2005 issue of Federal GIS Connections newsletter.)
The United States Department of Agriculture Service Center Agency (USDA–SCA) recently implemented a formal training program with ESRI that will provide streamlined access to ESRI’s geographic information system (GIS) training curriculum.
USDA–SCA GIS users from the USDA Natural Resources Conservation Service (NRCS), Farm Service Agency (FSA), and Rural Development (RD) agency will take part in the training that will help them provide high-quality data and services to their clients in rural communities throughout the United States and its territories. The three agencies are stewards of spatial and tabular data used by America’s farmers and rural communities.
“The USDA–SCA has been working with ESRI to implement GIS technologies across its state and fi eld offi ces for several years,” said Dennis Lytle, associate chief information offi cer for the NRCS and GIS team lead for the SCA. Lytle has led the GIS deployment effort since its inception.
“Implementation of this ESRI training program is part of the USDA–SCA’s dedication to the success of its GIS staff in providing accurate and timely data and services products to meet clients’ needs,” added Lytle.
USDA's Service Center Agency Implements
Training Strategy With ESRI Educational Services

GIS BEST PRACTICES WWW.ESRI.COM/AGRICULTURE29
After conducting an initial training needs analysis in collaboration with key USDA–SCA managers in 2002, the ESRI–Denver regional offi ce developed a curriculum plan that included a mix of ESRI catalog courses and a modifi ed introductory ArcGIS course tailored to meet USDA–SCA’s common work fl ow and data requirements. To serve a large number of USDA–SCA personnel throughout the United States, ESRI–Denver provided a training plan enabling NRCS, FSA, and RD personnel to attend training classes near their home offi ces. ESRI training centers and the NRCS’ National Cartography and Geospatial Center in Fort Worth, Texas, were used to facilitate course needs.
“We are pleased with the fl exibility and attention to detail that ESRI has provided over the last two years since we instituted this comprehensive training program,” said Boris de Souza, USDA–SCA GIS team training leader.
“The challenges associated with providing GIS training specifi c to the client’s needs in locations across the country were minor when you consider the positive feedback received after the introductory training delivery in Phase One,” said ESRI–Denver’s training manager, John Young. “Our course development team did a great job and we are excited about moving forward with Phase Two in 2004.”
More than 300 USDA–SCA staff members from 50 state and fi eld offi ces received training during the fi rst phase. Due to this success, ESRI will provide an update to the fi rst phase’s modifi ed introductory course to include ArcGIS 9 functionality this coming fall. Additional courses covering ArcGIS topics, geodatabases, ArcSDE, ArcIMS, and ArcObjects as well as training for between 350 to 400 additional USDA personnel will be offered in Phase Two.
(Reprinted from ESRI Press Release, June 7, 2004.)

GIS BEST PRACTICES WWW.ESRI.COM/AGRICULTURE31
GIS Applications of Interest to the USDAWorkTrack, a time and location tracking system from ESRI partner Aligo, has recently been added to the GSA Federal Technology Schedule. With WorkTrack, federal agencies can access real-time data by using mobile GPS technology to track and locate employees in the fi eld.
To locate an employee, WorkTrack uses the GPS capability in cell phones. Employees use their cell phones as a time card to enter their shift information, job, and task or cost codes through a simple Web-based application. Managers, dispatch operators, or offi ce personnel can view an employee’s job status and location via the Internet. WorkTrack can also locate the closest employee. This information is presented on a map accessed through ESRI ArcWeb Services.
WorkTrack map shows location of mobile workforce.
WorkTrack Tool for Federal Agencies

JULY 2006 U.S. DEPARTMENT OF AGRICULTURE32
(Reprinted from the Spring 2005 issue of Federal GIS Connections newsletter.)
As geospatial interest spreads, 4-H leaders see great possibilities for youth to help themselves and their communities through local geospatial research projects. “4-H community mapping projects will assist young people to build their science and technology knowledge, personal outlook, and work skills and aspirations,” says Tom Tate, national program leader with theU.S. Department of Agriculture (USDA). “At the same time, through these geographic projects youth and adults can improve decision making capacity in their communities and help strengthen local economic, social, and environmental well being.”
For more than 100 years, 4-H has been teaching leadership, citizenship, and life skills to young people. 4-H is a community of nearly seven million members and more than 600,000 adult volunteers across the United States. The organization is administered nationally by the Cooperative State Research, Education, and Extension Service (CSREES), USDA, and at the state/local level by land grant universities and the system of county 4-H agents. These organizations and program collaborators, such as ESRI, are working to help youth make a difference in the world.
Technology has always been a key aspect of 4-H. Today, thesetechnologies include computers, the Internet, and geospatial tools.
Community Services Merging With GIS
Technology
GIS BEST PRACTICES WWW.ESRI.COM/AGRICULTURE33
Technology has always been a key aspect of the organization’s vision of youth development. Throughout its history, 4-H has helped advance agricultural research and innovative technologies. Today, these technologies include computers, the Internet, and geospatial tools and processes that are promoted by the National 4-H Youth Technology Leadership Team, the National 4-H GIS/GPS Technology Program, and the National GIS/GPS Technology Integration Team. 4-H teams involved with technology, composed of youth members and adult mentors, teach through training programs, conferences, and projects. A team’s focus is driven by the needs of the community, and these teams work with local offi cials on projects that benefi t all citizens.
4-H clubs and their coordinating organizations have found the growing pervasiveness of GPS has offered a great starting point for work with geospatial technologies. At Iowa State University (ISU), a cooperative program between ISU Extension 4-H Youth Development and the Iowa Space Grant Consortium includes extensive use of GPS and is now making a natural transition to GIS. The same process is going on in Washington County, Oregon, where 4-H Extension helps 4-Hers build geographic skills from orienteering to GPS to GIS.
GIS users can and do play a crucial role in ensuring the success of 4-H technology efforts by serving as mentors and community research collaborators. “Most youth in our technology program are familiar with computers, the Internet, and slide show demonstrations, but there is so much more,” says Kevin Kesler, a community development 4-H and youth advisor from Utah State University. “When youth learn about GPS and GIS, they are eager to know more but it can be diffi cult to fi nd people who already know GIS and can help teach.”
Kesler, like many other 4-H technology team leaders, has been introducing GIS and GPS technology to communities. Currently, he leads a core group of 4-H youth that will create community teams once they complete their training. Each group will work closely with different county organizations and departments to create projects that introduce the power of technology. In some cases, the groups will work with county GIS personnel to create specifi c projects or help with existing ones. “When GIS users come forward to help with this effort, they help the youth as well as their entire community,” says Kesler. “The marriage between the GIS community and 4-H clubs is a union that will lead to incredible things.”
To aid 4-H, ESRI created the GIS Program for U.S. 4-H in cooperation with National 4-H headquarters to support geospatial outreach, education, and community efforts by fostering the integration of GIS in U.S. 4-H clubs. A portion of the ESRI initiative is a 2004 grant program for

JULY 2006 U.S. DEPARTMENT OF AGRICULTURE34
up to 100 U.S. clubs. Grant recipients, to be announced in April, will receive a club license of GIS software, data, and support.
(Reprinted from the April–June 2004 issue of ArcUser magazine.)
Editor’s note: This article describes a project undertaken by investigators at the University of Nebraska, Lincoln. Its goal is the development of a hydrological drought index that can be used for drought monitoring and mitigation support for the Great Plains region of the United States. The data for this index is being developed using an approach called Intelligent Joint Evolution of Data and Information (IJEDI) and is being made available online through an interactive Web site, the IJEDI WebCenter for Hydroinformatics.
Mapping Hydrological Drought in the Great Plains
By Jing Zhang, Ashok Samal,Leen-Kiat Soh, andWilliam J. Waltman
GIS BEST PRACTICES WWW.ESRI.COM/AGRICULTURE35
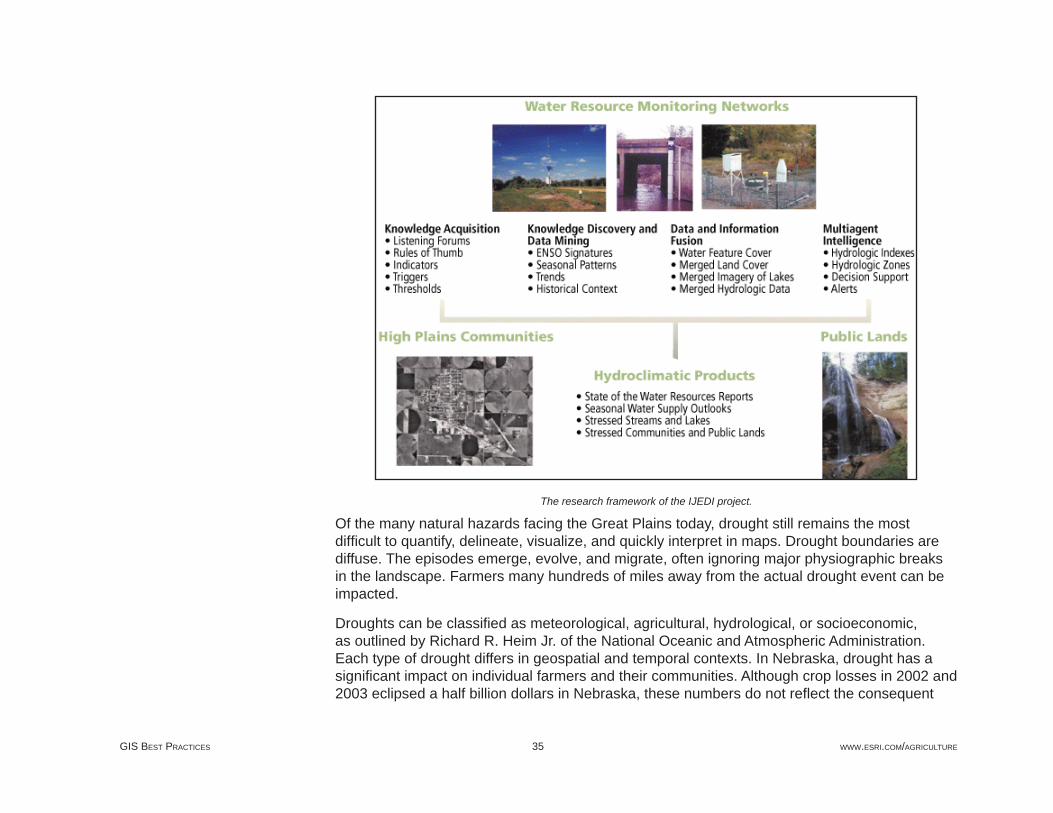
The research framework of the IJEDI project.
Of the many natural hazards facing the Great Plains today, drought still remains the most diffi cult to quantify, delineate, visualize, and quickly interpret in maps. Drought boundaries are diffuse. The episodes emerge, evolve, and migrate, often ignoring major physiographic breaks in the landscape. Farmers many hundreds of miles away from the actual drought event can be impacted.
Droughts can be classifi ed as meteorological, agricultural, hydrological, or socioeconomic, as outlined by Richard R. Heim Jr. of the National Oceanic and Atmospheric Administration. Each type of drought differs in geospatial and temporal contexts. In Nebraska, drought has a signifi cant impact on individual farmers and their communities. Although crop losses in 2002 and 2003 eclipsed a half billion dollars in Nebraska, these numbers do not refl ect the consequent

JULY 2006 U.S. DEPARTMENT OF AGRICULTURE36
impacts on animal production, food processing, tourism, recreation, and local community water supplies.
Often, mapping drought means mapping the fl ow and history of water on the landscape. Data on the many types of drought and their characteristics is available from multiple sources. Federal or state agencies often maintain independent geospatial databases for environmental monitoring. This forces the public to query multiple Web sites to obtain data from stream fl ow gauges, weather stations, and groundwater wells. As a consequence, users cannot conveniently integrate these related drought parameters and monitoring network data into information for mitigation and emergency response.
As Internet-based water information resources grow dramatically, integrating, customizing, accessing, and analyzing multiple environmental monitoring networks and synthesizing the daily measurements in new visualizations and interpretations of drought events are critical components of emergency response systems for the United States Department of Agriculture (USDA), National Weather Service (NWS), and United States Geological Survey (USGS). New Web-based GIS tools are needed to capture and integrate this data.
For Nebraska farmers and federal policy makers, the authors are developing a suite of drought index tools and new visualizations using ESRI software to describe the geography of water and the temporal and geospatial context of drought events and to derive new hydrologic interpretations that characterize the behavior and trends of streams and water basins.
Water is a strategic resource to Nebraska’s agriculture and its rural communities. Nebraska ranks second in the nation in total irrigated croplands with more than eight million acres. Nearly 86 percent of irrigated acres rely on groundwater and the remaining 14 percent represent surface water irrigation.
Despite the reliance on groundwater resources, the hydrologic unit concept described in a 1987 USGS report, Hydrologic Unit Maps, by P.R. Seaber, F. Paul Kapinos, and G.L. Knapp, is still a useful framework for comparing stream behavior, irrigation, cropping systems, and land use and land cover as well as describing drought vulnerability. [The hydrologic unit concept divides and subdivides the United States into successively smaller areas-region, subregion, accounting unit, and cataloging unit-that are denoted by Hydrologic Unit Codes (HUCs). HUCs uniquely identify each area and consist of two to eight digits based on the four levels of classifi cation in the hydrologic unit system.] In Nebraska, there are 69 hydrologic units delineated at the eight-digit level.
Geographic Scope

GIS BEST PRACTICES WWW.ESRI.COM/AGRICULTURE37
The starting point for the project’s analysis is a set of water basins. Each water basin has unique hydrological characteristics. It is represented by a set of distinct parameters and has a set of surface water (SW), groundwater (GW), and weather stations that measure different aspects of the hydrological state of the basin. This allowed authors to perform comprehensive knowledge discovery and data mining analyses on the data for each basin.
By combining statistical analyses and domain expertise, the project’s goal was to identify useful patterns and distinct trends. The authors wanted to fi nd rules that would describe each water basin uniquely, indicate the quality of data within a water basin, and allow the classifi cation of water basins into groups with similar hydrologic behavior. The GIS layers shown inFigure 1 were used to relate observations, patterns, cause-and-effect links, norms, and outliers with roads, streams, lakes, and counties.
Figure 1: Flow diagram illustrating hydrologic datasets in IJEDI project.
The Geospatial Framework of IJEDI

JULY 2006 U.S. DEPARTMENT OF AGRICULTURE38
The project draws on many national geospatial datasets to provide ancillary characteristics for hydrologic units, public lands, and communities. These datasets include the State Soil Geographic (STATSGO) Database for Nebraska (USDA/Natural Resources Conservation Service, 1994), the National Elevation Dataset (USGS/Earth Resources Observation System, 1999), the Cropland Data Layer of USDA’s National Agricultural Statistics Service (USDA/National Agricultural Statistics Service, 2002), and U.S. Census TIGER 2000 Data. These datasets vary in scale, resolution, extent, and format.
For hydrological data, stream fl ow, groundwater level, and precipitation measurements are representative data sources for each water basin. The hydrological information for surface water and groundwater is obtained from the USGS Water Resources of the United States Web site. The USGS National Elevation Dataset was used for topographic data and translations into shaded relief, aspect, slope, and terrain parameters for 8-digit HUCs.
Data came from the SW, GW, NWS, and High Plains Regional Climate Center’s Automated Weather Data Network (AWDN) stations. However, only stations that had more than 30 years of continuous data were used in this study. For precipitation, all 274 NWS and 46 AWDN stations in Nebraska were used. For the stream fl ow and groundwater level, only 124 of 274 SW and74 of 166 GW stations were used.
Datasets
GIS BEST PRACTICES WWW.ESRI.COM/AGRICULTURE39
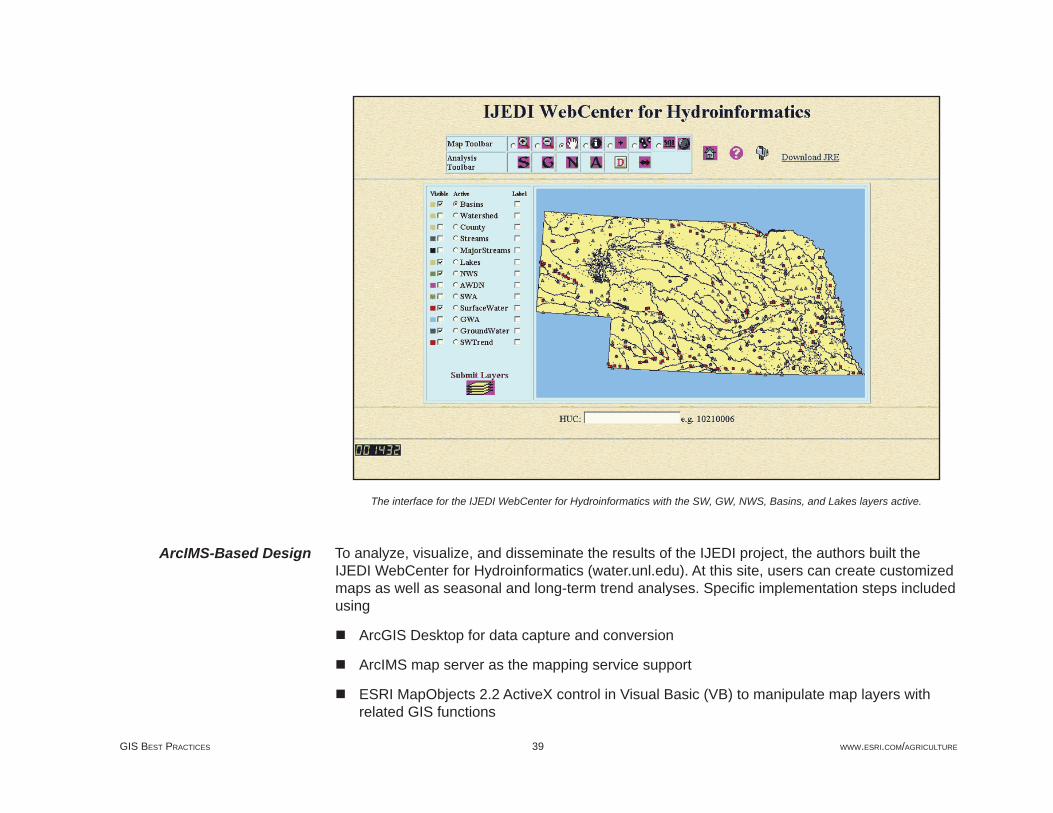
The interface for the IJEDI WebCenter for Hydroinformatics with the SW, GW, NWS, Basins, and Lakes layers active.
To analyze, visualize, and disseminate the results of the IJEDI project, the authors built the IJEDI WebCenter for Hydroinformatics (water.unl.edu). At this site, users can create customized maps as well as seasonal and long-term trend analyses. Specifi c implementation steps included using
ArcGIS Desktop for data capture and conversion
ArcIMS map server as the mapping service support
ESRI MapObjects 2.2 ActiveX control in Visual Basic (VB) to manipulate map layers with related GIS functions
ArcIMS-Based Design

JULY 2006 U.S. DEPARTMENT OF AGRICULTURE40
ESRI WebLink ActiveX control embedded in VB to handle image transition between the server program and the Internet
Microsoft Chart and/or Java applets to plot charts
Internet-based programming languages, such as Active Server Pages, HTML, VBScript, JavaScript, and CGI, to capture user activities and invoke corresponding functions
To use MapObjects to generate and display maps on the Web required a Web server program. Microsoft Internet Information Services was used. Given the amount of data and security issues, the client-requested strategy was adopted. The client inputs a request, indicates a map function, and manipulates a map on the Web page. ArcIMS processes the client requests and passes them to the VB/MapObjects program running on the server. Subsequently, the VB/MapObjects program parses each request and invokes a function that generates a bitmap. The WebLink control embedded in the VB/MapObjects program converts the bitmap to a JPEG fi le, which is displayed on an HTML Web page.
This implementation strategy runs faster because it does not require the program to be loaded and unloaded from the server memory for each request. Incorporating the WebLink into the VB/MapObjects program was key to the use of MapObjects IMS in the design and implementing online communication and data handling features.
The IJEDI WebCenter for Hydroinformatics currently has 12 digital coverages-basins (8-digit HUCs) and watersheds (4-digit HUCs). It also has TIGER 1:100,000-scale county boundaries, major streams, and streams; NWS and AWDN data; USGS stream gauge data; and USGS groundwater monitoring well data.
The site is not a pure GIS-based application. It combines GIS tools, the Internet, and object-oriented programming. TheWebCenter includes a Map Toolbar that provides basic functions such as zoom in, zoom out, and pan and feature identifi cation (e.g., a surface water station). The Analysis Toolbar provides customized graphs for user requests and allows for compare-and-contrast visual analyses. The Identify function retrieves information (e.g., name, location, chart) for a specifi c region or item on the map.

GIS BEST PRACTICES WWW.ESRI.COM/AGRICULTURE41
The Add Sites function acts as a multisite selector. When the active layer is a point feature layer, such as stream gauges, the user can use this function to successively select points on the active layer and request a graph that combines the measurements of these sites or stations.
The Analysis Toolbar is used primarily for visualizing SW, GW, NWS, and AWDN datasets using graphing routines. Online, real-time graph charting functions can be invoked for visualizing a single station’s data, data for multiple stations, or all the data for a water basin. Additional functionality, such as text-based queries, clustering driven search, station-based similarity queries, and stream gauge animation, is being developed.
Understanding hydrological processes in a geographic area is a diffi cult task. Information related to these processes is stored in a variety of datasets that measure different aspects. Surface water, groundwater, aboveground climate, and geomorphology all provide a component view of the overall hydrological cycle that characterizes a region. Integration of information from these diverse, but related, sources is an essential step in understanding the hydrological processes.
This GIS-based tool can be used to analyze and visualize information from a variety of hydrological datasets. The IJEDI WebCenter for Hydroinformatics provides users with analysis based on individual stations or at the water basin level. Currently, it provides graphing and visualization tools that make the identifi cation of trend and patterns in a landscape easier. By designing new analysis tools, this project will assist in decision support through the use of hydrological information.
Acknowledgment: This work is sponsored by a National Science Foundation Information Technology Research grant (ITRF#IIS-0219970). The authors would like to thank the United States Geological Survey, United States Department of Agriculture, High Plains Regional Climate Center, and National Drought Mitigation Center for support in domain knowledge and expertise. The authors would also like to thank Marcus Tooze and Andy Rutledge at GIS Workshop, Inc., for their support.
Heim, Richard R. Jr., “A Review of Twentieth-Century Drought Indices,” U.S. Bulletin of the American Meteorological Society, Vol. 83: pp.1149-1165, August 2002.
Special Functionality
Summary
References—In Print

JULY 2006 U.S. DEPARTMENT OF AGRICULTURE42
Ralston, B.A., Developing GIS Solutions with MapObjects and Visual Basic, Onword Press,326 pp., 2001.
Seaber, P.R., F.P. Kapinos, and G.L. Knapp (1987). “Hydrologic Unit Maps,” U.S. Geological Survey, Water-Supply Paper 2294, 63 pp., 1987.
United States Department of Agriculture, Soil Conservation Service, State Soil Geographic Database (STATSGO) User’s Guide, Miscellaneous Publication No. 1492, National Soil Survey Center, Lincoln, Nebraska, 1994.
USGS EROS, National Elevation Dataset Fact Sheet 148-99, Earth Resources Observation Systems Data Center, Sioux Falls, South Dakota, 1999.
United States Census Bureau TIGER, TIGER/Line, and TIGER-related products(www.census.gov/geo/www/tiger/index.html).
United States Department of Agriculture, National Agricultural Statistics Service, National Research and Development Division, Cropland Data Layer for Nebraska Web page(www.nass.usda.gov/research/Cropland/SARSla.htm).
(Reprinted from the October–December 2004 issue of ArcUser magazine.)
References—Online

GIS BEST PRACTICES WWW.ESRI.COM/AGRICULTURE43
USDA/ESRI Contact Information
Name Address Phone/FaxOrders Customer Service
Peggy NapoleonESRI380 New York St.Redlands, CA 92373-8100
Phone: 888-377-4575, ext. 1993Fax: 909-793-4801
Orders/Sales Associate
Customer ServiceAndrea Soltess
ESRI8620 Westwood Center Dr.Vienna, VA 22182-2214
Phone: 703-506-9515, ext. 8144Fax: 703-506-9514
Contract Issues Jody Ferrao ESRI380 New York St.Redlands, CA 92373-8100
Phone: 909-793-2853, ext. 2286Fax: 909-307-3074
Forest Service Bentley Patterson ESRIOne International CourtBroomfi eld, CO 80021-3200
Phone: 303-449-7779, ext. 8251Fax: 303-449-8830
NRCS, FSA, RD, and Conservation
Anne Taylor ESRIOne International CourtBroomfi eld, CO 80021-3200
Phone: 303-250-7568ext. 8276Fax: 303-449-8830
Other Agencies Matt Bechdol ESRI3944 State Road 327Auburn, IN 46706
Phone: 317-459-5387
Federal Training Development Coordinator
John Young ESRIOne International CourtBroomfi eld, CO 80021-3200
Phone: 303-449-7779, ext. 8261Fax: 303-449-8830
ESRI Points of Contact

JULY 2006 U.S. DEPARTMENT OF AGRICULTURE44
Name Phone/FaxContract Issues Scott Wolz
Contracting Offi cer (Interim)Phone: 202-720-1894Fax: 202-720-4529
Technical Issues Steve WebberContracting Offi cer's Tech. Representative
Phone: 970-295-5420Fax: 970-295-5414
Forest Service Technical Issues
Ron GendreauContracting Offi cer's Tech. Representative
Phone: 703-605-4607Fax: 703-605-5108
Agency Primary Contact Address Phone/FaxNRCS, FSA, RD, Conservation Districts
Stephen WebberUSDA, NRCS
2150 Centre Ave.Bldg. A, Rm. No. 229Fort Collins, CO 80526-1891
Phone: 970-295-5420Fax: 970-295-5414
Forest Service Joe ErwinUSDA, FS
RPE-8001621 N. Kent StreetArlington, VA 22209
Phone: 703-605-4574Fax: 703-605-5108
ARS, ERS, NASS, CSREES
John UnekisUSDA-ARS
Agricultural Research Service, OCIOBeltsville, MD 20705
Phone: 301-504-1746
APHIS, AMS, GIPSA
Blaine CrussellUSDA, APHIS
2150 Centre Ave., Bldg. BFort Collins, CO 80526-1891
Phone: 970-494-7100Fax: 970-494-7050
FAS, OCFO, OCIO, FNS, CNPP, OIG, OC, RMA, OGC, OCE, DA*
Bob BaldwinUSDA, FAS
FAS-CMP-PECAD, Rm. 4631S1400 Independence Ave. SWWashington, D.C. 20250
Phone: 202-720-1860Fax: 202-720-1295
USDA Contracting Points of Contact
USDA Agencywide Site License Central Support
(ACS) and Keycode Points of Contact

GIS BEST PRACTICES WWW.ESRI.COM/AGRICULTURE45
Agency Primary Contact Address Phone/FaxFSIS Katherine Hogye USDA, FSIS
Room 4871-South1400 Independence Ave. SWWasington, D.C. 20250-3700
Phone: 202-720-2878Fax: 202-720-3984
*Includes Offi ces of Operations, Human Resources Management, Procurement and Property Management, Civil Rights, Small Disadvantaged Business Utilization, Ethics, Outreach, and Administrative Law Judges and the Board of Contract Appeals.

G21424Copyright © 2006 ESRIAll rights reserved.Printed in the United States of America.
The information contained in this document is the exclusive property of ESRI. This work is protected under United States copyright law and other international copyright treaties and conventions. No part of this work may be reproduced or transmitted in any form or by any means, electronic or mechanical, including photocopying and recording, or by any information storage or retrieval system, except as expressly permitted in writing by ESRI. All requests should be sent to Attention: Contracts and Legal Services Manager, ESRI, 380 New York Street, Redlands, CA 92373-8100, USA.
The information contained in this document is subject to change without notice.
U.S. GOVERNMENT RESTRICTED/LIMITED RIGHTSAny software, documentation, and/or data delivered hereunder is subject to the terms of the License Agreement. In no event shall the U.S. Government acquire greater than RESTRICTED/LIMITED RIGHTS. At a minimum, use, duplication, or disclosure by the U.S. Government is subject to restric-tions as set forth in FAR §52.227-14 Alternates I, II, and III (JUN 1987); FAR §52.227-19 (JUN 1987) and/or FAR §12.211/12.212 (Commercial Technical Data/Computer Software); and DFARS §252.227-7015 (NOV 1995) (Technical Data) and/or DFARS §227.7202 (Computer Software), as applicable. Contractor/Manufacturer is ESRI, 380 New York Street, Redlands, CA 92373-8100, USA.
@esri.com, 3D Analyst, ACORN, ADF, AML, ArcAtlas, ArcCAD, ArcCatalog, ArcCOGO, ArcData, ArcDoc, ArcEdit, ArcEditor, ArcEurope, ArcExplorer, ArcExpress, ArcGIS, ArcGlobe, ArcGrid, ArcIMS, ARC/INFO, ArcInfo, ArcInfo Librarian, ArcInfo—Professional GIS, ArcInfo—The World’s GIS, ArcLocation, ArcLogistics, ArcMap, ArcNetwork, ArcNews, ArcObjects, ArcOpen, ArcPad, ArcPlot, ArcPress, ArcQuest, ArcReader, ArcScan, ArcScene, ArcSchool, ArcSDE, ArcSdl, ArcSketch, ArcStorm, ArcSurvey, ArcTIN, ArcToolbox, ArcTools, ArcUSA, ArcUser, ArcView, ArcVoyager, ArcWatch, ArcWeb, ArcWorld, ArcXML, Atlas GIS, AtlasWare, Avenue, Business Analyst Online, BusinessMAP, Community, CommunityInfo, Data Automation Kit, Database Integrator, DBI Kit, EDN, ESRI, ESRI—Team GIS, ESRI—The GIS Company, ESRI—The GIS People, ESRI—The GIS Software Leader, FormEdit, Geographic Design System, ESRI BIS, Geography Matters, Geography Network, GIS by ESRI, GIS Day, GIS for Everyone, GISData Server, JTX, MapBeans, MapCafé, MapData, MapObjects, Maplex, MapStudio, ModelBuilder, MOLE, NetEngine, PC ARC/INFO, PC ARCPLOT, PC ARCSHELL, PC DATA CONVERSION, PC STARTER KIT, PC TABLES, PC ARCEDIT, PC NETWORK, PC OVERLAY, PLTS, Rent-a-Tech, RouteMAP, SDE, Site·Reporter, SML, Sourcebook·America, Spatial Database Engine, StreetEditor, StreetMap, Tapestry, the ARC/INFO logo, the ArcAtlas logo, the ArcCAD logo, the ArcCAD WorkBench logo, the ArcCOGO logo, the ArcData logo, the ArcData Online logo, the ArcEdit logo, the ArcEurope logo, the ArcExplorer logo, the ArcExpress logo, the ArcGIS logo, the ArcGIS Explorer logo, the ArcGrid logo, the ArcIMS logo, the ArcInfo logo, the ArcLogistics Route logo, the ArcNetwork logo, the ArcPad logo, the ArcPlot logo, the ArcPress for ArcView logo, the ArcPress logo, the ArcScan logo, the ArcScene logo, the ArcSDE CAD Client logo, the ArcSDE logo, the ArcStorm logo, the ArcTIN logo, the ArcTools logo, the ArcUSA logo, the ArcView 3D Analyst logo, the ArcView Business Analyst logo, the ArcView Data Publisher logo, the ArcView GIS logo, the ArcView Image Analysis logo, the ArcView Internet Map Server logo, the ArcView logo, the ArcView Network Analyst logo, the ArcView Spatial Analyst logo, the ArcView StreetMap 2000 logo, the ArcView StreetMap logo, the ArcView Tracking Analyst logo, the ArcWorld logo, the Atlas GIS logo, the Avenue logo, the BusinessMAP logo, the Community logo, the Data Automation Kit logo, the Digital Chart of the World logo, the ESRI Data logo, the ESRI globe logo, the ESRI Press logo, the Geography Network logo, the MapCafé logo, the MapObjects Internet Map Server logo, the MapObjects logo, the MOLE logo, the NetEngine logo, the PC ARC/INFO logo, the Production Line Tool Set logo, the RouteMAP IMS logo, the RouteMAP logo, the SDE logo, The World’s Leading Desktop GIS, Water Writes, www.esri.com, www.esribis.com, www.geographynetwork.com, www.gis.com, www.gisday.com, and Your Personal Geographic Information System are trademarks, registered trademarks, or service marks of ESRI in the United States, the European Community, or certain other jurisdictions.
Other companies and products mentioned in the ESRI Web site may be trademarks or registered trademarks of their respective trademark owners.

ESRI • 380 New York Street • Redlands, CA 92373-8100 • 909-793-2853 • FAX 909-793-5953 • www.esri.com
Since 1969, ESRI has been giving customers around
the world the power to think and plan geographically.
The market leader in geographic information system
(GIS) solutions, ESRI software is used in more than
300,000 organizations worldwide including each
of the 200 largest cities in the United States, most
national governments, more than two-thirds of Fortune
500 companies, and more than 5,000 colleges and
universities. ESRI applications, running on more than one
million desktops and thousands of Web and enterprise
servers, provide the backbone for the world’s mapping
and spatial analysis. ESRI is the only vendor that provides
complete technical solutions for desktop, mobile, server,
and Internet platforms. Visit us at www.esri.com.