u.s. coast guard research and development center · u.s. coast guard research and development...
TRANSCRIPT

U.S. Coast Guard Research and Development Center1082 Shennecossett Road, Groton, CT 06340-6096
Report No. CG-D-05-03
Cape Henry Lighthouse Fuel Cell Evaluation
This document is available to the U.S. public through theNational Technical Information Service, Springfield, VA 22161
Prepared for:
U.S. Department of Homeland SecurityUnited States Coast Guard
Systems (G-S)Washington, DC 20593-0001
FINAL REPORTMarch 2003
Report Documentation Page Form ApprovedOMB No. 0704-0188
Public reporting burden for the collection of information is estimated to average 1 hour per response, including the time for reviewing instructions, searching existing data sources, gathering andmaintaining the data needed, and completing and reviewing the collection of information. Send comments regarding this burden estimate or any other aspect of this collection of information,including suggestions for reducing this burden, to Washington Headquarters Services, Directorate for Information Operations and Reports, 1215 Jefferson Davis Highway, Suite 1204, ArlingtonVA 22202-4302. Respondents should be aware that notwithstanding any other provision of law, no person shall be subject to a penalty for failing to comply with a collection of information if itdoes not display a currently valid OMB control number.
1. REPORT DATE 00 MAR 2003
2. REPORT TYPE N/A
3. DATES COVERED -
4. TITLE AND SUBTITLE Cape Henry Lighthouse Fuel Cell Evaluation
5a. CONTRACT NUMBER N00014-02-C-0269
5b. GRANT NUMBER
5c. PROGRAM ELEMENT NUMBER
6. AUTHOR(S) 5d. PROJECT NUMBER
5e. TASK NUMBER
5f. WORK UNIT NUMBER
7. PERFORMING ORGANIZATION NAME(S) AND ADDRESS(ES) U.S. Coast Guard Research and Development Center, 1082Shennecossett Rd., Groton, CT 06340-6096
8. PERFORMING ORGANIZATION REPORT NUMBER
9. SPONSORING/MONITORING AGENCY NAME(S) AND ADDRESS(ES) 10. SPONSOR/MONITOR’S ACRONYM(S)
11. SPONSOR/MONITOR’S REPORT NUMBER(S)
12. DISTRIBUTION/AVAILABILITY STATEMENT Approved for public release, distribution unlimited
13. SUPPLEMENTARY NOTES The original document contains color images.
14. ABSTRACT
15. SUBJECT TERMS
16. SECURITY CLASSIFICATION OF: 17. LIMITATIONOF ABSTRACT
UU
18. NUMBEROF PAGES
47
19a. NAME OFRESPONSIBLE PERSON
a. REPORT unclassified
b. ABSTRACT unclassified
c. THIS PAGE unclassified
Standard Form 298 (Rev. 8-98) Prescribed by ANSI Std Z39-18

i i
N O T I C E
This document is disseminated under the sponsorship ofthe Department of Homeland Security in the interest ofinformation exchange. The United States Governmentassumes no liability for its contents or use thereof.
The United States Government does not endorseproducts or manufacturers. Trade or manufacturers’names appear herein solely because they are consideredessential to the object of this report.
This report does not constitute a standard, specification,or regulation.
Marc B. Mandler, Ph.D.Technical DirectorUnited States Coast GuardResearch & Development Center1082 Shennecossett RoadGroton, CT 06340-6096

iii
Technical Report Documentation Page1. Report No.
CG-D-05-032. Government Accession Number 3. Recipient’s Catalog No.
5. Report Date
March 20034. Title and Subtitle
Cape Henry Lighthouse Fuel Cell Evaluation6. Performing Organization Code
Project No. 9010
7. Author(s)
Robert C. Desruisseau, Walter B. Lincoln, and Dr. Stephen J. Allen8. Performing Organization Report No.
R&DC 44510. Work Unit No. (TRAIS)9. Performing Organization Name and Address
U.S. Coast GuardResearch and Development Center1082 Shennecossett RoadGroton, CT 06340-6096
11. Contract or Grant No.
DTCG32-01-N-R0001113. Type of Report & Period Covered
Final Report12. Sponsoring Organization Name and Address
U.S. Department of Homeland SecurityUnited States Coast GuardSystems (G-S)Washington, DC 20593-0001
14. Sponsoring Agency Code
Commandant (G- SEC)U.S. Coast Guard HeadquartersWashington, DC 20593-0001
15. Supplementary Notes
The R&D Center's technical point of contact is Mr. Robert Desruisseau, (860) 441-2660,email: [email protected]. Abstract (MAXIMUM 200 WORDS)
The U.S. Coast Guard (USCG) operates several hundred remote communications stations, radio navigation stations,weather stations and aids to navigation stations. Often these sites draw power from aging, inefficient power sourcesor unreliable underwater power lines, which are costly to repair and frequently out-of-service. Some of these sitesare in environmentally sensitive areas, and in many instances, historical restrictions limit the use of solar panels. Inthe past few years, low power fuel cell systems have emerged as a potential option in the suite of remote powertechnologies. Fuel cells are highly efficient, environmentally benign devices that combine hydrogen and oxygen tocreate electric power.
In order to assess the potential of fuel cells in an operational marine environment, the USCG Research andDevelopment Center conducted a demonstration at the Cape Henry Lighthouse in Virginia Beach, VA. The CapeHenry installation used a three-kW direct methanol fuel cell. Placed in operation in March 2002, the system ran forapproximately six months. Performance data such as fuel consumption, power output, and reliability were collectedand compared with conventional technology. An evaluation of costs, safety, training, fuel logistics, etc., wasconducted to assess the potential for future use of fuel cells at other Coast Guard operational sites. Results of thisdemonstration were mixed. Several problems with fuel supply and overheating were experienced. It was concludedthat fuel cell systems were not ready for unattended remote operation at Coast Guard sites. However, the technologyhas significant promise and should be closely monitored by the USCG as manufacturers introduce more reliablesystems.
17. Key Words
fuel cell, lighthouse, alternative energy
18. Distribution Statement
This document is available to the U.S. publicthrough the National Technical Information Service,Springfield, VA 22161
19. Security Class (This Report)
UNCLASSIFIED20. Security Class (This Page)
UNCLASSIFIED21. No of Pages
4822. Price
Form DOT F 1700.7 (8/72) Reproduction of form and completed page is authorized.

iv
ACKNOWLEDGEMENTS
Thanks to MK1 Joeseph Baird, Group Hampton Roads Engineering; CWO Barry Disbrow, ELCBaltimore, MD; Ms. Jennifer Hunt, Mr. Bill Keil, and Mr. Otto Olsen of Fuel Cell Energy; and Mr.Samuel J. Hartman, Post Operations Officer, U.S. Army Fort Story.

v
EXECUTIVE SUMMARY
Responding to the U.S. Coast Guard’s need for clean, reliable and economic electric power atseveral hundred remote sites, the U.S. Coast Guard Research and Development (R&D) Centerundertook an evaluation of low-power fuel cell systems. At the time that this project was initiatedin early 2000, several fuel cell manufacturers had demonstrated prototype systems primarily forresidential applications. These systems ran on either natural gas or methanol, and provided apower output of 3-7 kilowatts, which is typical of a residential load, and roughly the power load ofmany Coast Guard remote sites. The R&D Center’s objective was to evaluate whether theseemerging fuel cell technologies could provide a superior product within the existing Coast Guardsuite of power technologies (i.e., diesel generators, solar, wind, submerged cables).
In early 2002, with partial support from the Department of Energy, the Coast Guard R&D Centercontracted with Fuel Cell Energy (FCE), Inc. of Danbury, CT, to install a three-kW directmethanol fuel cell at the Cape Henry Lighthouse located at U.S. Army Fort Story in VirginiaBeach, VA. This site was selected as an operational site because it closely replicated that of aremote site, i.e., the oil building that would house the fuel cell and ancillary equipment had noelectricity, heat or running water. The building was close to the ocean and it was logisticallysupportable during the prototype demonstration for fuel deliveries and servicing. In order tomaintain continuous navigational lighting, the fuel cell system powered a separate lightingsystem identical to that of the adjacent lighthouse. The prototype system was operated for aperiod of approximately six months during which technical performance data, including fuelconsumption, power availability, and stack temperatures, were recorded. Operationalperformance data such as installation costs, fuel costs, training, and safety were also evaluatedduring this period.
Safety emerged as an important and time-consuming issue for this project because the fuel, amixture of methanol and water, had not been used by the Army and was not included in theirhandling systems. A preliminary hazard analysis was completed at the R&D Center to identifythe most likely causes of catastrophic failure. This analysis and the engineering of the fueldelivery/handling system for the fuel cell resolved the safety concerns.
Results from this fuel cell demonstration were mixed. On the negative side, the initial cost of thefuel cell was many times higher than that of a comparably-sized diesel generator. The fuel cellwas also considerably larger and heavier. The cost per BTU of the methanol/water fuel mixturewas higher than that of diesel fuel (partly due to the small quantities used); a greater fuel volumeis required for equivalent energy. Several problems with fuel supply were initially experienced,causing the fuel cell to shut down day after day during the first few weeks of operation. In twoinstances, equipment overheated and caused shutdowns. Operator error caused the system toshut down twice. There was only one occurrence of an internal failure to the fuel cell and thatwas with the fuel injector. Once recognized, each problem could be easily fixed. The systemshutdowns caused the system to be off for 14 percent of the time. These problemsdemonstrated that, for the chosen system, overall reliability was insufficient for actual CoastGuard operational requirements.
On the positive side, the system efficiency for the total running time of 4090 hours wascalculated to be 37.2 percent. The highest efficiency calculated was 39.6 percent. Forcomparison, a small diesel generator in the five-kW range would have efficiencies around 20percent, while a diesel generator in the 300-kW range might approach 39 percent. An additionalaspect relating to the fuel cell efficiency is that, throughout the entire test, the building washeated by the fuel cell exhaust (temperature 120 ºC), which was vented to the outside. If thiswaste heat could be recovered productively, a conservative estimate would add five to tenpercent to the overall efficiency, bringing it up to 43 percent. Once the system problems wereidentified and corrected, the system achieved reliable power output. The fuel cell component ofthe overall system ran flawlessly. The system was safe, and maintenance was not beyond the

vi
level of a trained technician. The fuel cell produces fewer harmful emissions than a dieselgenerator.
Overall, the fuel cell system offered significant potential. As manufacturers commercialize fuelcell products, the Coast Guard should continue to monitor their progress. It is anticipated that,over the next few years, fuel cell power systems will become less expensive and more reliable.When the technology is fully developed, the Coast Guard should re-evaluate adding fuel cells toits existing power options.
vii
TABLE OF CONTENTSPage
1 Background . . . . . . . . . . . . . . . . . . . . . . . . . . . . . . . . . . . . . . . . . . . . . . . . . . . . . . . . . . . . . . . . . . . . . . . . . . . . . . . . . . . . . . . . . . . . . . . . . .1
1.1 Remote Power Need . . . . . . . . . . . . . . . . . . . . . . . . . . . . . . . . . . . . . . . . . . . . . . . . . . . . . . . . . . . . . . . . . . . . . . . . . . . . . . .11.2 Fuel Cell Technology . . . . . . . . . . . . . . . . . . . . . . . . . . . . . . . . . . . . . . . . . . . . . . . . . . . . . . . . . . . . . . . . . . . . . . . . . . . . . . .11.3 Overall Project Objective . . . . . . . . . . . . . . . . . . . . . . . . . . . . . . . . . . . . . . . . . . . . . . . . . . . . . . . . . . . . . . . . . . . . . . . . . .1
1.4 Need for Prototype Demonstration . . . . . . . . . . . . . . . . . . . . . . . . . . . . . . . . . . . . . . . . . . . . . . . . . . . . . . . . . . . . . .11.4.1 DOE-NETL Partnership . . . . . . . . . . . . . . . . . . . . . . . . . . . . . . . . . . . . . . . . . . . . . . . . . . . . . . . . . . . . . . . . . .11.4.2 Prototype Evaluation . . . . . . . . . . . . . . . . . . . . . . . . . . . . . . . . . . . . . . . . . . . . . . . . . . . . . . . . . . . . . . . . . . . . .2
1.4.3 Technology Selection. . . . . . . . . . . . . . . . . . . . . . . . . . . . . . . . . . . . . . . . . . . . . . . . . . . . . . . . . . . . . . . . . . . . .22 Description of Cape Henry Fuel Cell Demonstration . . . . . . . . . . . . . . . . . . . . . . . . . . . . . . . . . . . . . . . . . . . . . . . .2
2.1 Site Description. . . . . . . . . . . . . . . . . . . . . . . . . . . . . . . . . . . . . . . . . . . . . . . . . . . . . . . . . . . . . . . . . . . . . . . . . . . . . . . . . . . . . .22.2 Overall System Description . . . . . . . . . . . . . . . . . . . . . . . . . . . . . . . . . . . . . . . . . . . . . . . . . . . . . . . . . . . . . . . . . . . . . . .4
2.2.1 System Costs . . . . . . . . . . . . . . . . . . . . . . . . . . . . . . . . . . . . . . . . . . . . . . . . . . . . . . . . . . . . . . . . . . . . . . . . . . . . . .52.2.2 Startup Safety Issues . . . . . . . . . . . . . . . . . . . . . . . . . . . . . . . . . . . . . . . . . . . . . . . . . . . . . . . . . . . . . . . . . . . . .52.2.3 System Startup Operation . . . . . . . . . . . . . . . . . . . . . . . . . . . . . . . . . . . . . . . . . . . . . . . . . . . . . . . . . . . . . . .6
2.2.4 Air/Fuel Operation. . . . . . . . . . . . . . . . . . . . . . . . . . . . . . . . . . . . . . . . . . . . . . . . . . . . . . . . . . . . . . . . . . . . . . . . .63 Six-Month Operational Experience. . . . . . . . . . . . . . . . . . . . . . . . . . . . . . . . . . . . . . . . . . . . . . . . . . . . . . . . . . . . . . . . . . . . . .8
3.1 Operation . . . . . . . . . . . . . . . . . . . . . . . . . . . . . . . . . . . . . . . . . . . . . . . . . . . . . . . . . . . . . . . . . . . . . . . . . . . . . . . . . . . . . . . . . . . . .83.2 System Problems and Outages . . . . . . . . . . . . . . . . . . . . . . . . . . . . . . . . . . . . . . . . . . . . . . . . . . . . . . . . . . . . . . . . 12
3.3 System Performance . . . . . . . . . . . . . . . . . . . . . . . . . . . . . . . . . . . . . . . . . . . . . . . . . . . . . . . . . . . . . . . . . . . . . . . . . . . . . 133.3.1 Efficiency Calculations . . . . . . . . . . . . . . . . . . . . . . . . . . . . . . . . . . . . . . . . . . . . . . . . . . . . . . . . . . . . . . . . . 13
4 Conclusions . . . . . . . . . . . . . . . . . . . . . . . . . . . . . . . . . . . . . . . . . . . . . . . . . . . . . . . . . . . . . . . . . . . . . . . . . . . . . . . . . . . . . . . . . . . . . . . . 15
5 Recommendation . . . . . . . . . . . . . . . . . . . . . . . . . . . . . . . . . . . . . . . . . . . . . . . . . . . . . . . . . . . . . . . . . . . . . . . . . . . . . . . . . . . . . . . . . 16
6 Additional Research / Information. . . . . . . . . . . . . . . . . . . . . . . . . . . . . . . . . . . . . . . . . . . . . . . . . . . . . . . . . . . . . . . . . . . . . 16
7 REFERENCES .. . . . . . . . . . . . . . . . . . . . . . . . . . . . . . . . . . . . . . . . . . . . . . . . . . . . . . . . . . . . . . . . . . . . . . . . . . . . . . . . . . . . . . . . . . . 16
APPENDIX A . . . . . . . . . . . . . . . . . . . . . . . . . . . . . . . . . . . . . . . . . . . . . . . . . . . . . . . . . . . . . . . . . . . . . . . . . . . . . . . . . . . . . . . . . . . . . . . . . . .A-1
A.1 Potential Applications for Fuel Cell Power Systems . . . . . . . . . . . . . . . . . . . . . . . . . . . . . . . . . . . . . .A-1A.1.1 Aids-to-Navigation (ATON) Stations . . . . . . . . . . . . . . . . . . . . . . . . . . . . . . . . . . . . . . . . . . . . . . .A-1
A.1.2 National Distress and Response System (NDRS). . . . . . . . . . . . . . . . . . . . . . . . . . . . . . .A-1A.1.3 LORAN and Radio Navigation Stations . . . . . . . . . . . . . . . . . . . . . . . . . . . . . . . . . . . . . . . . . . . .A-1A.1.4 Differential GPS Stations . . . . . . . . . . . . . . . . . . . . . . . . . . . . . . . . . . . . . . . . . . . . . . . . . . . . . . . . . . . . .A-2
A.1.5 Marine Weather Stations . . . . . . . . . . . . . . . . . . . . . . . . . . . . . . . . . . . . . . . . . . . . . . . . . . . . . . . . . . . . .A-2APPENDIX B . . . . . . . . . . . . . . . . . . . . . . . . . . . . . . . . . . . . . . . . . . . . . . . . . . . . . . . . . . . . . . . . . . . . . . . . . . . . . . . . . . . . . . . . . . . . . . . . . . .B-1
B.1 CHRONOLOGY of FACTORY TESTS .. . . . . . . . . . . . . . . . . . . . . . . . . . . . . . . . . . . . . . . . . . . . . . . . . . . . . .B-1B.1.1 Five-Day Factory Test #1. . . . . . . . . . . . . . . . . . . . . . . . . . . . . . . . . . . . . . . . . . . . . . . . . . . . . . . . . . . . .B-1
B.1.2 Five-Day Factory Test #2. . . . . . . . . . . . . . . . . . . . . . . . . . . . . . . . . . . . . . . . . . . . . . . . . . . . . . . . . . . . .B-1B.1.3 Five-Day Factory Test #3. . . . . . . . . . . . . . . . . . . . . . . . . . . . . . . . . . . . . . . . . . . . . . . . . . . . . . . . . . . . .B-1B.1.4 Five-Day Factory Test #4. . . . . . . . . . . . . . . . . . . . . . . . . . . . . . . . . . . . . . . . . . . . . . . . . . . . . . . . . . . . .B-1
B.1.5 Five-Day On Site Compliance Test . . . . . . . . . . . . . . . . . . . . . . . . . . . . . . . . . . . . . . . . . . . . . . . . .B-2

viii
Page
APPENDIX C. . . . . . . . . . . . . . . . . . . . . . . . . . . . . . . . . . . . . . . . . . . . . . . . . . . . . . . . . . . . . . . . . . . . . . . . . . . . . . . . . . . . . . . . . . . . . . . . . . .C-1
C.1 IMPLEMENTATION ISSUES.. . . . . . . . . . . . . . . . . . . . . . . . . . . . . . . . . . . . . . . . . . . . . . . . . . . . . . . . . . . . . . . . . .C-1
C.1.1 Cape Henry Site Pre-Installation Safety Issues . . . . . . . . . . . . . . . . . . . . . . . . . . . . . . . . .C-1C.1.2 Startup Procedure: . . . . . . . . . . . . . . . . . . . . . . . . . . . . . . . . . . . . . . . . . . . . . . . . . . . . . . . . . . . . . . . . . . . . .C-2C.1.3 Fuel Related Items . . . . . . . . . . . . . . . . . . . . . . . . . . . . . . . . . . . . . . . . . . . . . . . . . . . . . . . . . . . . . . . . . . . . .C-2
C.1.4 Normal Fuel Cell Operation Releases and Byproducts . . . . . . . . . . . . . . . . . . . . . . . .C-3C.1.5 Spill Prevention and Safety Systems . . . . . . . . . . . . . . . . . . . . . . . . . . . . . . . . . . . . . . . . . . . . . .C-3C.1.6 Responsibilities of Hazardous Materials . . . . . . . . . . . . . . . . . . . . . . . . . . . . . . . . . . . . . . . . . .C-5
C.2 MSDS Methanol 47 percent, Water 53 percent Mixed by weight. . . . . . . . . . . . . . . . . . . . . .C-5APPENDIX D. . . . . . . . . . . . . . . . . . . . . . . . . . . . . . . . . . . . . . . . . . . . . . . . . . . . . . . . . . . . . . . . . . . . . . . . . . . . . . . . . . . . . . . . . . . . . . . . . . .D-1
D.1 System Operation . . . . . . . . . . . . . . . . . . . . . . . . . . . . . . . . . . . . . . . . . . . . . . . . . . . . . . . . . . . . . . . . . . . . . . . . . . . . . . . .D-1D.1.1 System Startup . . . . . . . . . . . . . . . . . . . . . . . . . . . . . . . . . . . . . . . . . . . . . . . . . . . . . . . . . . . . . . . . . . . . . . . . .D-1
D.1.2 PLC Control About 610 °C. . . . . . . . . . . . . . . . . . . . . . . . . . . . . . . . . . . . . . . . . . . . . . . . . . . . . . . . . . . .D-1APPENDIX E . . . . . . . . . . . . . . . . . . . . . . . . . . . . . . . . . . . . . . . . . . . . . . . . . . . . . . . . . . . . . . . . . . . . . . . . . . . . . . . . . . . . . . . . . . . . . . . . . . .E-1
E.1 System Start-Up Problems and Power Outages . . . . . . . . . . . . . . . . . . . . . . . . . . . . . . . . . . . . . . . . . . .E-1E.1.1 Air Bubbles in Fuel Line . . . . . . . . . . . . . . . . . . . . . . . . . . . . . . . . . . . . . . . . . . . . . . . . . . . . . . . . . . . . . .E-1
E.1.2 UPS Problem.. . . . . . . . . . . . . . . . . . . . . . . . . . . . . . . . . . . . . . . . . . . . . . . . . . . . . . . . . . . . . . . . . . . . . . . . . . .E-2E.1.3 PLC problem .. . . . . . . . . . . . . . . . . . . . . . . . . . . . . . . . . . . . . . . . . . . . . . . . . . . . . . . . . . . . . . . . . . . . . . . . . . .E-2E.1.4 The Fuel Injector Problem.. . . . . . . . . . . . . . . . . . . . . . . . . . . . . . . . . . . . . . . . . . . . . . . . . . . . . . . . . . .E-3
E.1.5 Operator Error. . . . . . . . . . . . . . . . . . . . . . . . . . . . . . . . . . . . . . . . . . . . . . . . . . . . . . . . . . . . . . . . . . . . . . . . . . .E-3E.1.6 Computer Problems. . . . . . . . . . . . . . . . . . . . . . . . . . . . . . . . . . . . . . . . . . . . . . . . . . . . . . . . . . . . . . . . . . . .E-3
APPENDIX F . . . . . . . . . . . . . . . . . . . . . . . . . . . . . . . . . . . . . . . . . . . . . . . . . . . . . . . . . . . . . . . . . . . . . . . . . . . . . . . . . . . . . . . . . . . . . . . . . . . F-1
F.1 Economic Analysis of Life Cycle Cost for USCG Remote Site Fuel Cell PowerSystems . . . . . . . . . . . . . . . . . . . . . . . . . . . . . . . . . . . . . . . . . . . . . . . . . . . . . . . . . . . . . . . . . . . . . . . . . . . . . . . . . . . . . . . . . . . . F-1
APPENDIX G.. . . . . . . . . . . . . . . . . . . . . . . . . . . . . . . . . . . . . . . . . . . . . . . . . . . . . . . . . . . . . . . . . . . . . . . . . . . . . . . . . . . . . . . . . . . . . . . . . G-1
G.1 Fuel Accounting to the U.S. Army for the Cape Henry Fuel Cell Project . . . . . . . . . . . . G-1

ix
LIST OF FIGURES
Figure 1. Cape Henry site drawing. . . . . . . . . . . . . . . . . . . . . . . . . . . . . . . . . . . . . . . . . . . . . . . . . . . . . . . . . . . . . . . . . . . . . . . . . . . . 3
Figure 2. Cape Henry test site with fuel tank. . . . . . . . . . . . . . . . . . . . . . . . . . . . . . . . . . . . . . . . . . . . . . . . . . . . . . . . . . . . . . . 3
Figure 3. System Schematic of Fuel Cell Installation . . . . . . . . . . . . . . . . . . . . . . . . . . . . . . . . . . . . . . . . . . . . . . . . . . . . . 4
Figure 4. Block diagram of fuel cell. . . . . . . . . . . . . . . . . . . . . . . . . . . . . . . . . . . . . . . . . . . . . . . . . . . . . . . . . . . . . . . . . . . . . . . . . . . 7
Figure 5. Fuel cell stack. . . . . . . . . . . . . . . . . . . . . . . . . . . . . . . . . . . . . . . . . . . . . . . . . . . . . . . . . . . . . . . . . . . . . . . . . . . . . . . . . . . . . . . . . 7
Figure 6. The fuel cell and 1000 watt lamp in the oil building. . . . . . . . . . . . . . . . . . . . . . . . . . . . . . . . . . . . . . . . . . . 8
Figure 7. Fuel cell temperatures during startup. . . . . . . . . . . . . . . . . . . . . . . . . . . . . . . . . . . . . . . . . . . . . . . . . . . . . . . . . . . . 9
Figure 8. Cell trends during normal operation. . . . . . . . . . . . . . . . . . . . . . . . . . . . . . . . . . . . . . . . . . . . . . . . . . . . . . . . . . . . .10
Figure 9. Sample plot of status screen used for diagnostics. . . . . . . . . . . . . . . . . . . . . . . . . . . . . . . . . . . . . . . . . . .11
Figure 10. Main menu screen used for diagnostics. . . . . . . . . . . . . . . . . . . . . . . . . . . . . . . . . . . . . . . . . . . . . . . . . . . . . . . .12
Figure 11. Low temperature shutdown plot. . . . . . . . . . . . . . . . . . . . . . . . . . . . . . . . . . . . . . . . . . . . . . . . . . . . . . . . . . . . . . . . . .13
LIST OF TABLES
Table 1. Wattage of devices powered by fuel cell system. . . . . . . . . . . . . . . . . . . . . . . . . . . . . . . . . . . . . . . . . . . . . . . .14
Table 2. Efficiency conversions and calculations. . . . . . . . . . . . . . . . . . . . . . . . . . . . . . . . . . . . . . . . . . . . . . . . . . . . . . . . . . .14
Table 3. Efficiency Calculation Results . . . . . . . . . . . . . . . . . . . . . . . . . . . . . . . . . . . . . . . . . . . . . . . . . . . . . . . . . . . . . . . . . . . . . . .15
Table 4. ATON Power Sources from the ATONIS Database. . . . . . . . . . . . . . . . . . . . . . . . . . . . . . . . . . . . . . . . . . . A-1
Table 5. Average Daily Emissions . . . . . . . . . . . . . . . . . . . . . . . . . . . . . . . . . . . . . . . . . . . . . . . . . . . . . . . . . . . . . . . . . . . . . . . . . . . C-3
ABBREVIATIONS/ACRONYMS
A ampere AC alternating current
ATON aids to navigation DAS data acquisition system
DC direct current DOE Department of Energy
FCE Fuel Cell Energy K 1000
KW kilowatt PLC programmable logic controller
R&D research & development UPS uninterruptible power supply
USCG United States Coast Guard V volt
W watt

1
1 Background
1.1 Remote Power Need
There is a need at all Coast Guard facilities for clean, reliable and economic electric power. Thisneed is especially critical at the several hundred unattended remote sites, which includecommunications stations, weather stations, lighthouses, and lighted structures with audiblesound signals. Reliable power is critical since its loss may result in marine or aviation accidents.Appendix A describes many of the Coast Guard potential applications for small fuel cells. Manyof these sites now rely on submerged cables, diesel generators, batteries, solar panels, windturbines or thermoelectric generators. These technologies have proven to be mature systemsthat have fulfilled the Coast Guard’s power needs, yet for each technology there are advantagesand disadvantages. An overview of the limitations of existing power sources for Coast Guardremote sites is contained in a “Systems Times” article (Lincoln, 1999).
Furthermore, many of these structures are located in environmentally sensitive coastal areas andmust conform to stringent historic, esthetic and zoning restrictions. At this time, there is noperfect electric power source with present technology. Issues of high capital cost, high operationand maintenance costs, reliability, and environmental benevolence, are all considerations inselecting the appropriate power source for remote site applications.
1.2 Fuel Cell Technology
Fuel cells are intrinsically simple electrochemical devices that combine hydrogen and oxygen tocreate electric power and water. Unlike diesel engines, they produce little pollution. Anotherfeature is that they can achieve electric energy conversion efficiencies well in excess ofconventional internal combustion engines. In recent years, several fuel cell manufacturers haveintroduced prototype devices that are intended to meet the low power (3-5 kW) residentialmarket. These devices typically draw the hydrogen from a fuel source such as natural gas(mostly CH3) or methanol (CH3OH). Many systems are at the advanced prototype stage and arebeing demonstrated in real-world applications. A full description of such installations can befound in the most recent 2000 Fuel Cell Seminar Abstracts, (2000 Fuel Cell Seminar).
1.3 Overall Project Objective
Over the past few years, the Coast Guard Research and Development Center has conductedseveral studies to evaluate the potential of fuel cell technology to support Coast Guard missions.In 1998, the R&D Center received a Request for R&D Support from the Assistant Commandant ofSystems (G-S) to assess the performance and costs associated with fuel cells systems. (LetterCOMDT (G-SEC), 1998) The project objective was to evaluate the potential benefits of fuel cellsfor electric power generation, and to evaluate the feasibility of installation in various applicationsthroughout the Coast Guard. Larger fuel cells (over 200 kW) are the subject of an ongoingdemonstration project at Air Station Cape Cod and will be reported on under separate cover.The demonstration described in this report covers low-power, remote applications.
1.4 Need for Prototype Demonstration
1.4.1 DOE-NETL Partnership
The decision was made in early 1999 to collaborate with the Department of Energy’s NationalEnergy Technology Laboratory (DOE-NETL) to support our evaluation of the potential of fuel celltechnology for low power remote applications. DOE-NETL has extensive experience withdeveloping fuel cells and readily agreed to work with the R&D Center. In November 1999, theUSCG R&D program signed a Memorandum of Agreement with DOE-NETL, and they providedresources, helping to develop alternative energy systems for the Coast Guard prototypeevaluation.

2
1.4.2 Prototype Evaluation
Based upon discussions with DOE-NETL and CG personnel at the April 2000 Short Range Aidsto Navigation Conference, it was decided that a prototype installation/demonstration at anoperational site would afford the best opportunity to evaluate the potential of fuel cells in theCoast Guard environment. Issues such as initial cost, operation and maintenance cost, safety,and training were considered to be as important as technical performance. Many optimisticclaims by fuel cell proponents were based upon laboratory studies in which environmentalfactors were eliminated. Only in the real-world setting could a fuel cell system be evaluated.
After review of available sites, the Cape Henry Lighthouse located on the U.S. Army’s Fort StoryProperty in Virginia Beach, VA, was selected as a suitable location for the prototypedemonstration. Factors that were considered included the large variations in temperature andhumidity expected in Virginia, the ability to provide fuel truck access to the site, the ease ofaccessing the site by R&D personnel, and the fact that there were on-site Coast Guardpersonnel.
1.4.3 Technology Selection
Fuel cells are classified by the type of their electrolyte (Hirschenhofet, 1994). Our collaborationwith DOE-NETL showed that the most likely fuel cells to fulfill Coast Guard remote low powerrequirements were either Polymer-Electrolyte-Membrane (PEM) or Molten-Carbonate (MC).These were better-developed systems and several manufacturers were producing prototypes.Other fuel cell technologies were either too expensive, used pure hydrogen as a fuel, or were notas well developed. The use of pure hydrogen presented significant safety issues and hydrogenwas not readily available in inexpensive quantities. Consequently, only fuels that were readilyavailable such as natural gas, propane or alcohols were considered.
In early 2000 in response to a R&D Center RFP, Fuel Cell Energy, Inc. (now FCE Inc.) fromDanbury, CT, was selected to provide a three kW direct methanol fuel cell based upon its MCproprietary technology. During this six-month evaluation period the fuel cell, provided by FCE,powered a parallel, duplicate lighting system to the Cape Henry Lighthouse.
2 Description of Cape Henry Fuel Cell Demonstration
2.1 Site Description
The Cape Henry site was chosen for a number of reasons. A site was required that was close tothe ocean to represent the marine environment, similar to that of a remote lighthouse site. Thesite also had to include a building that could be used to house all the equipment required. Thisstructure could not have any heat, electricity, or water in it. Further, the site had to beaccessible by truck for fuel deliveries and servicing. Cape Henry was chosen because it fit therequirements exactly. The old fuel building, 90 feet from the active lighthouse, that years beforewas used for oil and then later acetylene storage, was chosen to house this new state of the artpower system. Figure 1 shows the site diagram with the ocean to the North.
To prepare the site for the installation, a telephone line was installed to the building. This linewould provide the electronic access to the site for monitoring by the USCG R&D Center and FuelCell Energy personnel. A deck was constructed to hold the 500-gallon fuel tank, and because itis a historical site the front door was replaced with a new door where holes were cut forventilation and for a window. Once the installation of the fuel tank was completed, a fence wasbuilt around the deck with two doors for access and refueling. Figure 2 shows the fuel buildinghousing the fuel cell with the fuel tank and deck as installed.

3
Figure 1. Cape Henry site drawing.
Figure 2. Cape Henry test site with fuel tank.
Oil House
90 Feet
N
Oil House
90 Feet
N

4
2.2 Overall System Description
The fuel cell was installed at the Cape Henry site and started operation on 23 February 2002.This date constituted the start of a five-day onsite acceptance test. The five-day factory testswere previously completed and a record of those tests can be found in Appendix B.
The fuel cell is a direct methanol type of molten carbonate fuel cell. Figure 3 shows a schematicdiagram of the fuel cell and balance of plant systems. The fuel cell has a footprint of 3 ft. x 4 ft.and is 3 feet high and weighs approximately 1,200 pounds. The maximum power output of thesystem is approximately three kW. The output voltage of the fuel cell is nominally 36 volts DC.The fuel cell has three moving parts, an air blower which provides air (oxygen) to the system, afuel pump to pressurize and pump the fuel into the system and a fuel injector. The systemrequires three gas cylinders for operation, one each of hydrogen, carbon dioxide, and nitrogen.The hydrogen and carbon dioxide were used on startup. It was later determined that the systemcould be just as easily started on the methanol/water fuel mixture, and the hydrogen and carbondioxide were removed. To automatically purge the system, the nitrogen was used at shutdown.These gas cylinders were kept inside the building with the operating fuel cell.
Figure 3. System Schematic of Fuel Cell Installation.

5
An inverter manufactured by Trace Engineering was used to convert the DC power to 115 VACpower. As a safety control, the inverter, a four kW series SW inverter, was programmed for lowvoltage cutout of the system.
The electrical load consists of a standard 1000-Watt tungsten light bulb, a Coast Guard dual bulblamp changer and a Coast Guard Audio-Visual Controller, which controls the lamp flashingsequence. Additional loads consist of the electronic controls, computer and various vent fans.
The system also utilizes a Programmable Logic Controller system (PLC), which takestemperature data from the fuel cell sensors and issues commands to the fuel injector, for bothcontrol and shutdown of the system.
An industrial computer was used to take data from the PLC system and display the data in ausable form. This computer was the remote gateway into the system using the dedicatedtelephone line.
The installed fuel tank was manufactured by Highland Tank of Stoystown, PA. The tank, a 500-gallon above ground vertical, lined steel, double wall, type I-360 tank, meets the UL 142standards for fuel tanks. The tank was air-pressure tested by USCG personnel prior to actualoperation.
2.2.1 System Costs
To properly assess the total cost of this fuel cell system, all aspects of the installation andoperation must be considered. The cost of the original contract for this project was $100K. Thiscost included the five-day factory testing, and the on-site setup and the five-day on-site test,which included travel for FCE personnel and the first fuel delivery of 500 gallons. In support ofthis project, FCE used no less than an additional 35 staff-days on site. The USCG incurredtravel expenses in the order of $16K, and an additional $8.8K for the fuel to be mixed anddelivered to the site. Total costs for this project by the USCG and FCE are much more than theoriginal $100K contract. It should be noted that these costs are development expenses. Sincethis demonstration terminated without proceeding to a commercial unit, there are no data onproduction unit costs. If this unit were brought to commercialization, it can be understood thatthe total cost would be that of the original contract or purchase price plus the cost of the fuelconsumed, without the additional costs necessitated by a prototype system.
2.2.2 Startup Safety Issues
Prior to the experiment, USCG project personnel met with the U.S. Army Safety andEnvironmental office representatives from Fort Eustis. Although the USCG owns the property onwhich the Cape Henry Lighthouse resides, the property is located in the middle of the U.S. ArmyFort Story. Safety issues became of prime importance because the USCG was going to transferthe property over to the U.S. Army in the near future. The USCG would however, retainownership of the aid to navigation (ATON), and associated equipment, and would retainunrestricted right of ingress/egress to maintain or to add or relocate any ATON in order to aidnavigation. The safety officer at the parent U.S. Army command at Fort Eustis oversees all safetyissues for Fort Story. R&D personnel, the Ft. Story Fire Department Station Chief, Ft. EustisSafety Officer representative and the Coast Guard Group Engineering Officer attended safetymeetings for this test. There were many issues of concern with the fuel, fuel storage andhandling system for the fuel cell. The fuel used (47 percent methanol and 53 percent water),being foreign to the Army, was of great concern. Issues raised were concerns about themaximum amount of fuel on station at any given time, refueling, spill prevention techniques, andfuel accounting at the end of the test. All safety issues were met prior to the start of the test. Acomplete description of these can be found in Appendix C, including a Material Safety DataSheet (MSDS) for the fuel mixture.

6
2.2.3 System Startup Operation
The fuel cell start up time is approximately 36 hours. The system is heated up with an externalpower source, in this case a 5-kW gas generator, which powers the two built-in 750-wattelectrical heaters. To prevent stack damage, the fuel cell stack must be brought up slowly, at 25°C per hour from room temperature to 390 °C. This heating can continue overnight automaticallyusing a temperature controller. It is also important that the fuel cell stack never exceeds a 50 °Ctemperature difference from one side of the stack to the other. Once the temperature reaches390 °C, the methanol/water fuel mixture can be added. Once the liquid fuel is added, the systemmust be monitored continuously until the temperature across the entire stack is above 490 °C.Again, the fuel cell should be brought up to temperature at a rate not exceeding 25 °C per hourand should not exceed a temperature difference across the stack of more than 50 °C. There areno temperature shutdown safeguards in place during this part of the heating process. To limitfuel flow, the stack must be controlled by manually adjusting the fuel using the fuel knob on theflow meter. This part of the process could be automatically controlled or remotely controlled ifsafeguards were in place. These are typical problems associated with a prototype system.
Once 500 °C is reached, the system can be switched from ‘startup’ to ‘automatic.’ The systemwill run continuously as long as fuel is fed to the system, and does not reach the low (500 °C), orhi (680 °C) temperature shut down points.
The Programmable Logic Control system controls the fuel to the system. The set pointtemperature for this system is 610 °C. This is the temperature around which the control systemwill control the fuel. Below this temperature the controller tries to add fuel slowly until thistemperature is reached. Above this temperature the fuel is cut back to a predetermined fuel flowas set in the system. A more concise description of the startup and the specific control functionsthat occur when the burner temperature falls below the 610 °C threshold can be found inAppendix D.
2.2.4 Air/Fuel Operation
Figure 4 is a Block diagram of the fuel cell. This system includes three moving parts, the airblower, the fuel pump and the fuel injector. The air blower furnishes oxygen to the system, thefuel pump supplies fuel to the fuel cell stack; H-1 and H-2 are heat exchangers. An aqueousmixture of methanol is pumped to the stack anodes through internal heat exchangers. Residualfuel from the stack anodes reacts with excess air over a catalytic oxidizer and flows through thecathodes of the stack. The stack exhaust gas exits the unit through several heat exchangersused to preheat the incoming reactant streams.
A manual air control valve is provided for bypassing the air heat exchanger during start-up. Afuel pump and an air blower, both powered by 115 VAC supplied by the inverter, deliver thereactants to the unit. An automotive type fuel injector is utilized to modulate the fuel rate inaccordance with load and ambient temperature. In the run mode, the operation is completelyautomatic. The fuel cell stack generates approximately 36 volts DC. The DC power is suppliedto a four kW inverter, which supplies AC power to the pumps, blowers, and to the computer andcontrol equipment. Any interruption of this AC power stops all operation of the fuel cell andshuts down the system. Figure 5 shows a picture of the internal stack without any controlelectronics hooked up. Figure 6 shows a picture of the fuel cell within its enclosure and 1000Watt lamp in the building.

7
Figure 4. Block diagram of fuel cell.
Figure 5. Fuel cell stack.
Exhaust Out
Fuel Cell Stack
StackBurner
AirBlower
Air In
H-1H-2
FuelInjector
Fuel PumpFuel In
Fuel Mixture in to Stack

8
Figure 6. The fuel cell and 1000 watt lamp in the oil building.
3 Six-Month Operational Experience
3.1 Operation
During the five-day on-site test, various temperatures were monitored using an automated dataacquisition system (DAS). The main temperature monitored during normal operation is the burnertemperature, shown in green on figure 7. Control of the fuel cell, once automatic operation hasbegun, centers on a burner temperature of 610 °C. The automatic control system keeps theburner temperature at or about 610 °C by adjusting fuel flow through the fuel injector. Figure 7shows the format of the computer ‘Cell Trends’ screen available on site and remotely. Thescreen is a plot of time vs temperature.
9
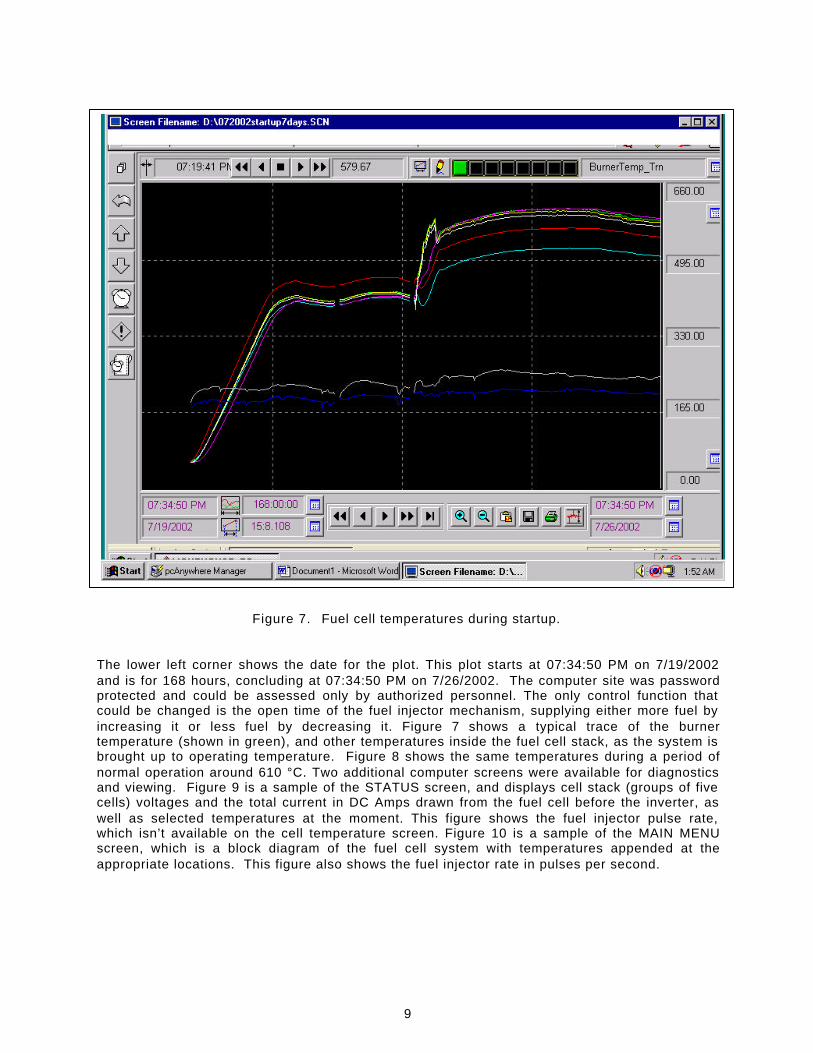
Figure 7. Fuel cell temperatures during startup.
The lower left corner shows the date for the plot. This plot starts at 07:34:50 PM on 7/19/2002and is for 168 hours, concluding at 07:34:50 PM on 7/26/2002. The computer site was passwordprotected and could be assessed only by authorized personnel. The only control function thatcould be changed is the open time of the fuel injector mechanism, supplying either more fuel byincreasing it or less fuel by decreasing it. Figure 7 shows a typical trace of the burnertemperature (shown in green), and other temperatures inside the fuel cell stack, as the system isbrought up to operating temperature. Figure 8 shows the same temperatures during a period ofnormal operation around 610 °C. Two additional computer screens were available for diagnosticsand viewing. Figure 9 is a sample of the STATUS screen, and displays cell stack (groups of fivecells) voltages and the total current in DC Amps drawn from the fuel cell before the inverter, aswell as selected temperatures at the moment. This figure shows the fuel injector pulse rate,which isn’t available on the cell temperature screen. Figure 10 is a sample of the MAIN MENUscreen, which is a block diagram of the fuel cell system with temperatures appended at theappropriate locations. This figure also shows the fuel injector rate in pulses per second.

10
Figure 8. Cell trends during normal operation.

11
Figure 9. Sample plot of status screen used for diagnostics.

12
Figure 10. Main menu screen used for diagnostics.
3.2 System Problems and Outages
During the six-month operation of this test system, many outages were experienced. Initiallythere were multiple problems with the fuel mixture and bubbles within the fuel lines created bythe daily heating and cooling of the fuel lines from the storage tank to the fuel cell. In one case,the UPS overheated and shut down due to heat buildup in the building. One of theProgrammable Logic Controllers overheated and caused a shut down of the system. One failurewas caused by a fuel injector failure in the system. There were two instances of operator errors.All of these failures were overcome and corrected; many were growing pains of a prototypesystem of new technology. A complete description of these failures can be found in Appendix E.Figure 11 is a screen print showing a low temperature system failure, like that of the fuel injectorfailure. In all cases, the remote DAS enabled both FCE and the USCG to diagnose problemsand expedite corrective action.

13
Figure 11. Low temperature shutdown plot.
3.3 System Performance
While the fuel cell started in February, the system suffered start up problems early and the“Official” start date was moved to March 18, 2002. The system ran unattended, except forrefueling every 2–3 weeks, or when problems occurred, until September 9, 2002, when a fuelinjector failure occurred. This failure was nine days prior to what would have been the end of thesix-month test period. It was decided at this juncture to terminate the test rather than repair thefuel injector and restart the test. During the test period, the system operated for 4090.4 hours,and consumed 2,887.8 gallons of the methanol water fuel mixture. Based on 4,752 hours in thesix-plus month period, this system was available and producing power 86 percent of the time.
3.3.1 Efficiency Calculations
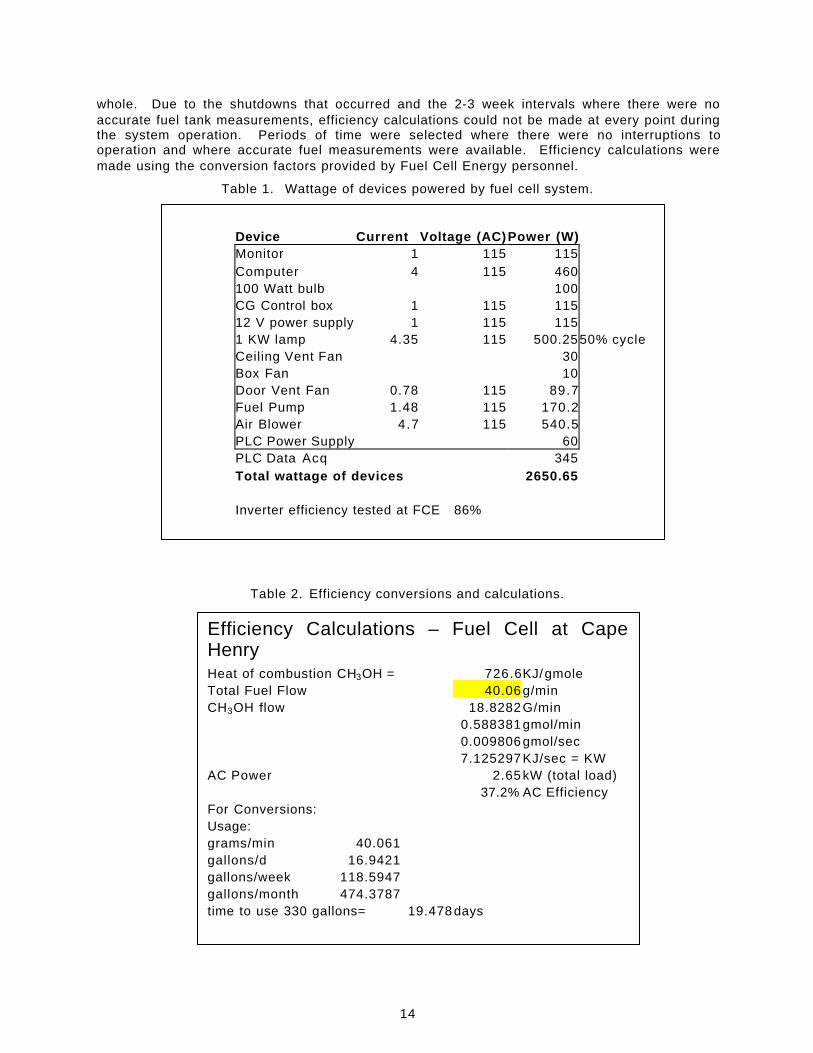
The efficiency of the fuel cell system was of paramount importance. Fuel cells are promoted asmuch more efficient than other electrical generating equipment. Table 1 lists all the devicespowered by the 115 VAC power supplied by the fuel cell through the inverter and table 2 lists theconversion factors. The total wattage was used to calculate the efficiencies of the system as a
14
whole. Due to the shutdowns that occurred and the 2-3 week intervals where there were noaccurate fuel tank measurements, efficiency calculations could not be made at every point duringthe system operation. Periods of time were selected where there were no interruptions tooperation and where accurate fuel measurements were available. Efficiency calculations weremade using the conversion factors provided by Fuel Cell Energy personnel.
Table 1. Wattage of devices powered by fuel cell system.
Table 2. Efficiency conversions and calculations.
Device Current Voltage (AC)Power (W)Monitor 1 115 115Computer 4 115 460100 Watt bulb 100CG Control box 1 115 11512 V power supply 1 115 1151 KW lamp 4.35 115 500.25 50% cycleCeiling Vent Fan 30Box Fan 10Door Vent Fan 0.78 115 89.7Fuel Pump 1.48 115 170.2Air Blower 4.7 115 540.5PLC Power Supply 60PLC Data Acq 345Total wattage of devices 2650.65
Inverter efficiency tested at FCE 86%
Efficiency Calculations – Fuel Cell at CapeHenryHeat of combustion CH3OH = 726.6KJ/gmoleTotal Fuel Flow 40.06 g/minCH3OH flow 18.8282 G/min
0.588381 gmol/min0.009806 gmol/sec7.125297 KJ/sec = KW
AC Power 2.65 kW (total load)37.2% AC Efficiency
For Conversions:Usage:grams/min 40.061gallons/d 16.9421gallons/week 118.5947gallons/month 474.3787time to use 330 gallons= 19.478 days

15
Using the total wattages from table 1 and the conversion factors from table 2, the fuel use perday was calculated where exact data were available. Using the results, the value of fuel used ingrams/minute was calculated. That value was used to compute the overall efficiency of theentire system. The efficiency calculation shown in table 3 is for the overall efficiency, 4090.4hours and 2,887.1 gallons of fuel used. The following efficiencies were calculated.
Table 3. Efficiency Calculation Results.
Start Date End Date Fuel Use Gallons/Day
Fuel UseGrams/Minute
Efficiency Percent
2/24/02 2/27/02 16.535 39.1 38.1
3/8/02 3/9/02 16.21 38.34 38.9
5/9/02 5/28/02 16.64 39.35 37.9
6/18/02 7/08/02 15.91 37.63 39.6
8/13/02 8/27/02 16.36 38.7 38.5
4090.4hours
2,887.1 gallons 16.94 40.06 37.2
The peak efficiency calculated was 39.6 percent and the overall efficiency calculated was 37.2percent. For comparison, small diesel generators sized in the 5-kW range are about 20 percentefficient, while diesel generators in the 300 kW size are about 39 percent efficient. The systemefficiencies of this fuel cell were good, but there are two conditions that were not included inderiving the efficiency rate; the fuel used to warm up the fuel cell system is not accounted forand the byproduct of heating the building was also not included. While there were no data tosupport calculations for the heating of the building, we could presume an increase in theefficiency of 5–10 percent to the total if we were able to recover the waste heat productively.
The test ran for approximately 198 days, translating to 4,752 hours. The fuel cell hour meterstarted at zero hours. The hour meter is only on when the fuel cell is up to normal operatingtemperature and the inverter is switched on and producing AC electricity. At the end of the testthe hour meter had recorded 4090.4 hours. The difference between the actual time from the startto the end of the test and the hours logged by the hour meter for actual fuel cell time generatingelectricity translates roughly to 661 hours or 27.5 days. This indicates that the system was shutdown, warming up or waiting for restart for 27.5 days during that 6.4-month period. Once thesystem shut down, there was normally less than a two-day period before a restart was inprogress. In the beginning when the fuel bubble problem was occurring, the system had shutdown for 4-5 days in a row until the problem was solved. During this period restarts occurredeach morning, and the latent heat shortened the restart appreciably. Fourteen percent of the timethe system was shut down.
4 Conclusions
Over the three-year period from 1999 to 2002, the R&D Center investigated low power remotefuel cell technology. It was determined that fuel cell development for actual field applications is inits infancy. Fuel cells in the three to five kW-size that are fueled by more common liquid fuelsare still in an R&D stage of development. During this demonstration of an engineeringdevelopmental system, the performance consistently improved as problems with the ancillaryequipment were solved. The system operated successfully for extended periods, and wascapable of remote unmanned operation while being monitored with remote technical support.

16
Fuel cells of this size and fuel type are a few years away from becoming commercial items thatcan be installed and maintained at a site without skilled technical support. This was ademonstration of a prototype fuel cell and is not necessarily indicative of what may happen witha follow-on demonstration at another site. It should not be considered as a valid reliability test ofa production or commercial system. Much experience was gained regarding the technology,operation, maintenance and logistics of a field application at a remote site.
In the future, fuel cell power may match USCG needs. It has the potential to provide reliablepower to remote sites where other alternative off-grid energy sources are not available. Whenthe fuel cell industry is successful in commercializing reformers to convert diesel fuel, gasoline orkerosene into useable hydrogen for fuel cell applications, then fuel cells will interface well withpresent Coast Guard logistics. Several fuel cell manufacturers are conducting similardemonstrations for communications towers, parks, and residences where access to grid power isproblematic. The capital cost for installation of a commercial fuel cell power system (once theyare produced in quantity) should be competitive with diesel systems.
5 Recommendation
The Coast Guard needs to maintain an active role in continuously monitoring and evaluating fuelcell power technology for its remote sites. This is a rapidly changing field and great benefits canbe gained by evaluating these systems when they are commercially available. The Research andDevelopment Program within the U.S. Coast Guard is in the best position to conduct thisevaluation.
6 Additional Research / Information
Appendix F includes a brief “Economic Analysis of Life Cycle Cost for USCG Remote Site FuelCell Power Systems.”
Appendix G includes a “Fuel Accounting to the US Army for the Cape Henry Fuel Cell Project.”
7 REFERENCES
2000 Fuel Cell Seminar (Oct 30 – Nov 2,2000). Fuel Cells Powering the 21st Century(Abstract Publication). Portland, Oregon.
Commandant (G-SEC) letter dated (March 1998). Request for R&D support entitled “ShoreFacility Fuel Cell Demonstration.”
Hirschenhofer, Stqauffer, Engleman, (1994). Fuel Cells a Handbook (Report No. 94/1006).Morgantown, WV: Department of Energy, Materials and Energy Technology Center.
Lincoln, Walter (1999). A New Power System for the New Century. System Times, p. 59-62.

A-1
APPENDIX A
A.1 Potential Applications for Fuel Cell Power Systems
A.1.1 Aids-to-Navigation (ATON) Stations
The Coast Guard operates over 1,000 aids-to-navigation structures and lighthouses that arepowered by commercial utilities and/or diesel generators. All of these stations are unattendedand many are in remote areas with unreliable power sources such as grounded submarinecables. Other considerations such as cost, protection of the environment, historical sitepreservation, and access to an electrical utility may affect power availability.
Table 4. ATON Power Sources from the ATONIS Database.
Solar / battery 15,247
Battery only 177
Primary diesel generator 1
Commercial utility 978
Commercial utility & diesel generator backup 67
Ocean wave 5
Shore power cables are expensive to replace and are likely candidates for alternative power.Several Coast Guard lighthouses, such as Miah Maull in Delaware Bay and Sequin Island inMaine, are on commercial power via submarine cables that have become grounded.Replacement costs for these cables can be as high as $300,000. Alternative power sourcesrequire huge solar arrays and/or wind generators with reduced capability that may beunacceptable to local mariners and historical preservation groups. These sites , along with the 68other sites with diesel generators (primary and secondary), should be considered for directconversion to fuel cell power depending upon the condition of their existing power systems. Theneed to deliver fuel to sites formerly powered by electric utilities may meet with some resistancefrom operational personnel.
A.1.2 National Distress and Response System (NDRS)
The NDRS Database lists 275 VHF-FM High Site short-range coastal communication stationsthroughout the U.S., and many stations are currently being improved through the NDRSModernization Project. Part of this project is to upgrade the present power plant that consists ofineffective hybrid battery/PV system/propane diesel systems. Many of these sites are located onislands in remote areas that may be inaccessible part of the year such as Alaska, and fuel cellsmay be considered as an alternative power source for applications in austere climates. The fuelcell system would run continuously and thereby provide its own waste heat, whereas PV systemsare low in power, require huge arrays and are ineffective for much of the year due to shortdaylight hours in higher latitudes. Three Alaska sites have been identified as possible candidatesfor installation of fuel cell power: Cape Gull, Sitkinak Dome, and Marmot Island.
A.1.3 LORAN and Radio Navigation Stations
The Coast Guard operates several LORAN stations in remote areas. These stations are under arecapitalization program that includes station upgrading to solid-state electronics, automation, ora reduction in manning. These stations require a variety of sizes of power systems, ranging froma few kilowatts for monitoring sites to several hundred for a major transmitter site. The mainrequirements are clean, noise-free premium power for the sensitive time-based electronics and a

A-2
reliable, uninterruptible power source. LORAN sites are potential locations to evaluate the long-term reliability of fuel cell power systems.
A.1.4 Differential GPS Stations
Currently, there are about 60 maritime DGPS sites in the United States. Many of these sites areon or near fragile wetlands, and petroleum powered generators were not installed because of theenvironmental concerns. Remote, unreliable and environmentally sensitive DGPS sites can beprovided with electrical power systems that are more efficient, environmentally clean, and morereliable with less maintenance costs. Small fuel cell power systems have the potential to offer amore efficient, environmentally clean, more reliable and less costly source of power. Some ofthese sites need backup power, and alternatives such as the fuel cell technology provideadvantages over traditional diesel generators and are more environmentally acceptable. Fuelcells can also provide a secondary and uninterruptible power supply in the event of failure ordamage to the primary power source
A.1.5 Marine Weather Stations
The Coast Guard supports sites in coastal waters for the National Weather Service through theNational Data Buoy Center in Bay St. Louis, MS. The system consists of 54 Rohn Tower sites incoastal areas and offshore buoy sites. There are 12 large navigational buoys that replacedlightships and ocean weather stations and about 60 smaller three-meter and six-meter buoys thatobserve and report weather observations. The present buoy power systems provide about 50Watt-hours per day, and it is desirable to increase the capacity to transmit more frequent event-driven weather observations and support more sensors. Additionally, an active anti-foulingsystem can keep the hull clean for longer periods and also requires additional electrical power.More solar panels cannot be used with these buoys due to stability and wind age restrictions.Fuel cell power systems could replace the batteries, and can offer extended periods of relativelymaintenance-free operation with increased capability.

B-1
APPENDIX B
B.1 CHRONOLOGY of FACTORY TESTS
B.1.1 Five-Day Factory Test #1
The first factory five-day test was scheduled to start on April 16, 2001 in the new FCE plant inTorrington, CT. This test coincided with a plant dedication by the Governor of the State ofConnecticut, on April 17t h. The fuel cell was started on the morning of the 16t h and ran until themorning of April 19th. During this time various changes were made to the control functions of thecontrol system. The Governor visited and dedicated the new manufacturing facility on April 18t h.When we arrived on the 19th the fuel cell had shut down. A quick restart demonstrated that thesystem had shut down as a result of a small fuel leak in one of the manifolds. This test wasscratched and the fault had to be corrected.
Once the fuel cell was taken apart and the manifolds were inspected, new thermocouples wereinstalled to sense this situation if it ever recurred. During this period, it was determined that anew stack should be built so that the Coast Guard would start with a completely new system andnew safeguards were proposed for the system. Additional programming changes to the controlprogram were also instituted during this period. The physical plates that make up this fuel cellstack are much smaller then the plates manufactured at the Torrington facility for the 250 kW fuelcell power plants. In order to make a new stack, certain welding and manufacturing functionshad to be sent out and completed by hand by subcontractors. This caused a substantial delay inthe proposed start date at Cape Henry.
B.1.2 Five-Day Factory Test #2
The second factory test was scheduled to start on December 6, 2001 at the Danbury, CT, FCEfacility where all the test equipment was housed. The system was started on electrical heaterson December 5th. On December 6th, the fuel (methanol and water) was started into the systemat 0900, the system was heated on the mixture and at 1444 the load (USCG 1000 watt flashinglamp and associated equipment), were powered up and running. At 1500 the load was turned offdue to a low voltage indication, and the stack was allowed to cool down for further inspection, asa precautionary measure. The inspection revealed no carbon build up in the manifold, and noimmediate problems. It was thought that some of the cells maybe flooded with electrolyte andthat may have caused the low voltage. A new five-day test was scheduled for January 10, 2001.
B.1.3 Five-Day Factory Test #3
The third factory test, at the Danbury, CT, facility commenced on 10 January 2001, when theelectrical heaters were turned on. At 0940 on the January 12th, fuel was added and heatingcontinued. At 1641 the inverter was turned on using only the housekeeping load and the lampwas off. Shortly it became evident that the automatic temperature control was causing largetemperature swings in the burner temperature. The fuel injector control settings were adjustedfor on time and frequency but were not adequately controlling the system. The system was againshut down on December 13, 2001. It was obvious that the control system, which monitorsvarious temperatures within the fuel cell and issued commands to the fuel injector for heat andload were not optimized at this point. It should be noted that this is a prototype system and FuelCell Energy did not have many hours prior to this contract operating this system. When it wason, it had always been under the scrutiny of the project personnel and had only been run for aday at a time, in spite of the long warm up. Since the system was being used in a laboratorysetting, automatic control functions were only honed for that use.
B.1.4 Five-Day Factory Test #4
The fourth test at the Danbury laboratory commenced on January 22, 2002. The fuel cellcontrolling software had been reprogrammed and tested; in fact, the fuel cell had been runningfor 400 hours prior to this test. It was agreed that the fuel cell would be put on heaters prior to

B-2
our arrival and was warmed up to 410 °C. At 0910 on the 22nd, fuel was started and heatingcontinued until the entire fuel cell stack reached 550 °C. At 1305 the inverter was turned on andthe fuel cell was allowed to run with this housekeeping load to stabilize the system. At 1331 theload (1000 watt flashing lamp and equipment), was connected and switched to automatic control.At 1337 on 22 January 2002 the 5-day test was started.
The temperature around which the system controls the fuel is 610 °C, the ‘set point’. During thetest, the burner temperature fluctuated between 600 °C and 612 °C, which is a normal range.During the five-day test, an additional load of 700 watts at 115 VAC was added to simulate whatwould happen when the fuel transfer pump was energized for refueling at the Cape Henry site.The fuel cell generated the additional load with no negative effects to the system. At 1039 on 28January 2002 the test was successfully completed and the fuel cell was shut down.
B.1.5 Five-Day On Site Compliance Test
USCG personnel prepared the Cape Henry site by running a telephone line into the building, anda deck was built outside the building to support the 500-gallon fuel tank. The tank was deliveredand pressure tested to check the double wall containment. It should be noted that the building isconsidered a historic site so no permanent changes could be made to the structure.
The installation started on February 19, 2002. The fuel cell and equipment were transported tosite by truck by Fuel Cell Energy. The installation personnel included four people from Fuel CellEnergy and one person from the USCG R&DC. The U.S. Army was on hand with a forklift andpersonnel to lift the 1,200 lb. fuel cell off the truck and insert it into the building through thedoorway. The doorway molding and door were removed. A new door was built to fit so additionalventing of the building could be accomplished.
The fuel lines were hooked up to the fuel tank and the first delivery of 500 gallons of the fuelmixture (methanol 47 percent by wt., deionized water 53 percent by wt.) was delivered in two250-gallon totes. Emergency response personnel and equipment from the Ft. Story firedepartment were on hand to observe and as a precautionary measure, as well as a SafetyOfficer’s representative from Ft. Eustis. The fuel cell electrical heaters were energized using anauxiliary gas generator outside the building. The generator was also used to power lights andtools during the installation.
On February 23, 2002 the fuel cell was started. A new mechanical hour meter was installed intothe control panel and set to 0.0 hours so there would be no mistakes made with operating hoursduring the test. At 1735 on February 23, 2002 the load was turned on and the system wasoperating autonomously.
On February 26th, the system exhibited peculiar patterns in the burner temperature. The problemwas perceived to be a fuel pump problem and the fuel pump was replaced while the system wasrunning. On March 2, 2002, the five-day on site test was considered a success.
All personnel from Fuel Cell Energy left on 3 March 2002, and the R&DC representative stayedto monitor the system one more week.
C-1
APPENDIX C
C.1 IMPLEMENTATION ISSUES
C.1.1 Cape Henry Site Pre-Installation Safety Issues
The Cape Henry Lighthouse site was chosen because of its proximity to the ocean which is about200 yards and because it offered a small building that could replicate and be treated as a remotesite; an optimum site representative of the typical Coast Guard marine environment. Thebuilding chosen was the original fuel storage building for the lighthouse. The building is 10 x 15ft, made of double wall brick with a wood roof, and has no heat, electricity or water, has naturalventilation and was accessible by road for refueling.
Although the U.S. Coast Guard (USCG) owns the property on which the Cape Henry Lighthouseresides, the property is located in the middle of the U.S. Army Fort Story. The USCG would,however, retain ownership of the aid to navigation (ATON), and associated equipment, wouldretain unrestricted right of ingress/egress to maintain and/or to add or relocate any ATON inorder to aid navigation. Safety issues became of prime importance in setting up this site for thefuel cell project. The safety officer at the parent U.S. Army at Fort Eustis oversees all safetyissues for the Fort Story. R&D personnel, the Ft. Story Fire department Station Chief, Ft. EustisSafety officer representative and the Coast Guard Group Engineering Officer attended safetymeetings for this test. The following issues were of concern.
1) Review what the system consists of, how the system will work, do a quick walk-through ofthe proposed site and confirm the maximum amount of methanol (and any other hazmat)on hand in any given day.
2) Discuss fuel, fueling and set up a data collection system so that the USCG/fuel celloperators can provide info as to how much methanol is used each day that the system isoperated.
3) Determine what fuel/exhaust releases would occur during normal operations andcalculate how much is released to each respective media including by-products.
4) Discuss spill prevention techniques and ensure a system is in place where the fuel cellowner/operator understands installation policy regarding spill/leak responserequirements. When will the system be operational?
5) It is the responsibility of the U.S. Coast Guard to prevent spills and leaks of methanol thatmay affect U.S. Army property as well as the health and safety of its soldiers, employeesand dependents. Furthermore, our installation policy requires the immediate notificationof the Fort Story Fire & Emergency Services Division (422-7456) should a release occur(as directed by the U.S. Army Transportation Center Integrated Contingency Plan and theFort Eustis/Story Hazardous Materials & Waste Management Standing OperatingProcedures). Additionally, the U.S. Coast Guard is responsible for any clean-up/remediation (to include disposal of waste) and associated costs. All wastes generated bythis operation must be disposed of through the Fort Story Hazardous Waste AccumulationSite in accordance through the Fort Eustis/Story Hazardous Materials & WasteManagement Standing Operating Procedures.
Items 1, 2, & 3 are based on Fort Story’s requirements to document and report (if deemednecessary) the use of a chemical “Toxic Chemical Release Inventory” as required by theEmergency Planning and Community Right to Know Act.
A walk-through was conducted with the Fort Eustis Safety Officer representative, the FortStory fire station Chief and employees before and during the installation of the fuel cell. Thefire station chief and employees were also present during the first fueling to witness ourhandling of the fuel.

C-2
C.1.2 Startup Procedure:
The main power switch was placed in the “startup” position; the blower, fuel pump and fuelinjector were turned off on the PLC front panel.
The fuel cell is warmed up using the two built-in 750-watt electrical heaters. These heaters mustbe powered by an external source; in this case a five kW gas generator was used. Thiscomplete warm-up from a cold condition takes about 36 hours. These electrical heaters arecontrolled by an external controller, which is set to warm the fuel cell up at a rate of 25 °C/hour.
At 390 °C, the fuel mixture is introduced by turning on the blower, the fuel pump and the fuelinjector. The fuel injector switch is set to manual. The fuel rate knob on the fuel flow metercontrols the fuel injector in manual control.
Three temperatures are monitored during this final warm-up process, the burner temperature,and thermocouples labeled #18k and #190. The fuel cell must be warmed up at a rate not toexceed 25 °C/hour and not to exceed a temperature differential across the fuel cell of more than50 °C. to avoid excessive thermal expansion. These temperatures are controlled by the fuel flow,and regulated by the knob on the flow meter. The system cannot be left unattended during thispart of the warm-up.
At 500 °C, the inverter can be turned on to generate AC power; however, thermocouples #18kand #190, which are on either ends of the fuel cell stack, must both be above 490 °C for this tooccur. The main power switch previously set to “startup” controls the power from the generatorand or the fuel cell inverter. At the 500 °C point the system can be switched from generatorpower to the fuel cell inverter power by switching from startup to run. The fuel injector must beswitched to automatic control using the switch on the PLC panel, and the fuel rate knob on thefuel meter must be opened all the way so it no longer restricts fuel flow. The fuel cell system isnow in automatic control. The fuel cell system (computer, PLC, fuel pump and blower) ispowered by the AC electricity supplied by the inverter. As long as fuel is fed to the system, it willcontinue to generate power. The external generator can now be turned off. The USCG lamp andlamp assembly are powered up by a switch inside the audiovisual controller box, and the entiresystem is operational and running independently.
C.1.3 Fuel Related Items
The fuel used in this test is a mixture of 47 percent methanol by weight with the balance 53percent deionized water. The specific gravity of the mixed fuel is required to be 0.921 at 25 °C.Although this fuel is mostly water it must still be treated as a hazardous material. The MaterialSafety Data Sheet for the fuel mixture can be found at the end of this section. As a note ofreference, one gallon of diesel fuel includes the same number of BTUs as approximately 2.25gallons of pure methanol.
The fuel was delivered premixed in 250-gallon totes, and was supplied by CHEMSOLVE ofRoanoke, VA. The fuel connection to the tote consists of a flexible hose and camlock fitting.The fuel was pumped off the truck using an electric fuel pump powered by the fuel cell, and hardplumbed into the fuel tank using a ¾ inch stainless steel pipe. The fuel hose has a cam-locktype fitting which mates with the tote fitting so there is no drip or fuel loss; it is piped directly intothe tank. All tank openings are on the top of the tank. The fuel tank is fitted with a leakdetection float system within the double-wall which will show any small volume leaks from theinside main tank through the double-wall safety wall. The tank is painted white to help preventheating in the summer months. A larger opening on the top of the tank is used for periodicmanual fuel measurements. These measurements are made using a wood dipstick and noted tothe nearest ¼ inch. Throughout the six-month test, a record was kept of fuel deliveries and fuellevel readings. Before a fuel delivery was accepted a sample was drawn off into a graduatedcylinder and the specific gravity and temperature was tested for quality assurance.

C-3
C.1.4 Normal Fuel Cell Operation Releases and Byproducts
The normal mean operating temperature of the fuel cell is approximately 610 °C. The chemicalreaction between the fuel-air mixture that takes place in the fuel cell plates is:
CH3OH + 2H2O = 3H2 +CO2 + H2O
Reforming of the fuel is done with a copper/zinc catalyst, operated at 2900 space velocity, orvolume changes/hour at full load at O °C. When the fuel cell is operating normally, the averageemissions are:
Table 5. Average Daily Emissions.
Component Ft3/day
H2O (steam) 1900
CO2 550
O2 6800
N2 2850
Dioxin emissions are an important consideration for the safety officer. A letter was generated atby Fuel Cell Energy to the Safety Officer at Fort Eustis affirming that there were no dioxinsincluded in the exhaust.
C.1.5 Spill Prevention and Safety Systems
At the onset of the project, the R&D Center decided to do a Risk Analysis (Preliminary HazardAnalysis), to identify potential problems. The risk assessment team was comprised of the twopeople from the fuel cell project at the R&DC, the three primary counterparts from Fuel CellEnergy responsible for this project contract, and two subject matter experts (fire and testpersonnel) from the R&DC and two facilitators from the R&DC.
Procedure for Preliminary Hazard Analysis (PHA)
The top three identified hazard/accident scenarios were associated with an internal fuel leakduring routine operation of the fuel cell. The types of fuel-leak accidents are:
1. An internal gaseous fuel (H2/CO) leak caused by a gasket or seal leak resulting in afire accident. This scenario was assigned an accident severity category of one(mostly hazardous). Hydrogen is an explosive hazard.
Step 1
Define the activity or system of interest
Step 2
Define the accident
categories of interest and the
accident severity categories
Step 3
Conduct Review
Step 4
Use the results in decision making

C-4
2. An internal liquid fuel (CH3OH/H2O) leak caused by a gasket or seal leak resulting ina fire. This scenario was assigned an accident severity category of two.
3. An internal vapor (CH3OH/H2O) leak caused by a gasket or seal leak resulting in afire accident. This scenario was assigned an accident severity category of two.
Addressing all the safety issues cumulatively, the following safety precautions were taken or arepart of the fuel cell system.
The actual lighthouse at Cape Henry is an operational lighthouse and the maritime communityrelies on that light remaining lit. It was decided early on that because this is a prototype systemwith unknown reliability, that a duplicate light would be powered inside the oil building and notthe actual Cape Henry light.
The fuel tank is a double wall tank with a UL rating of 142, which is required for this application.This fuel tank is compliant with NFPA 30. The tank has a built-in visual leak detection system.The tank interior is coated with Ultra liner coating SP-6, and was painted white to reduce heatingof the fuel.
The stainless steel fuel line running along the ground to the fence was taped with yellow cautiontape. The fuel tank was labeled exactly as the totes to alert others of the exact contents of thetank. The fuel tank was enclosed in a fence with two doors, which allowed immediate access tothe tank and valves. The fence was labeled with no smoking signs and a sign designating thesite as a USCG R&D project, including phone number. The front door of the building is labeledwith the same USCG R&DC sign, and with a sign to call 911 in case of emergencies.
An emergency fuel shut off valve was installed outside the building in the fuel line near the tankand marked. An emergency shutoff switch was installed inside the building just inside the door,which shuts off the fuel injector and cuts fuel to the fuel cell. A CO and CO2 sensor was installedinside the building in plain view of anyone entering to alert them to adverse conditions. Anappropriate fire extinguisher is mounted on the wall just inside the door.
The inverter was programmed to shut down at a low input voltage cutoff of 22 VDC, this cuts all115 VAC, which powers the fuel pump, blower and all control equipment, shutting off fuel to thefuel cell.
Temperature sensors in the fuel cell system shut the system off at a high temperature cutoff of680 °C. Normal operating temperature is around 610 °C. Temperature sensors in the fuel cellsystem shut the system off at a low temperature cutoff of 500 °C, which may indicate a manifoldleak in the system.
A combustible gas sensor inside the fuel cell enclosure will trip the plant if the reading reachesthe trip point. A complete copy of the USCG risk assessment and an MSDS for the fuel wasforwarded to the Fort Story fire station chief, Operations officer (this was the USCG R&DCcontact for this project), and to the Fort Eustis Safety officer, prior to the start of the project.
The first fueling of the fuel cell on 2/21/02 was witnessed by personnel from the Ft. Eustis safetyoffice, the Ft. Story Fire Department, and all concerned with the fueling process and safety ofthis project. Fire trucks and safety equipment were on hand as a precaution. An inspection ofthe premises, power plant and associated equipment concluded in a stamp of approval by allconcerned. The fire chief requested that the fire department be notified when future re-fuelingwould take place.
The system start-up would begin on 2/22/02, and become operational on 2/23/02. Note: thefollowing figure shows a safety chart developed by Fuel Cell Energy of possible problems andthe system response to each.

C-5
C.1.6 Responsibilities of Hazardous Materials
A letter from the Office of the Garrison Commander, E. Douglas Earle, Colonel, Department ofthe Army, dated 1/29/02, addressed to Mr. Walter Lincoln USCG R&DC outlining the USCG’sresponsibilities. The USCG R&D Center acknowledged the responsibility for the usage andhandling of hazardous materials within the Coast Guard property and within the U.S. Armycompound.
C.2 MSDS Methanol 47 percent, Water 53 percent Mixed by weight.
MATERIAL SAFETY DATA SHEET
Section 1. Product and Company Information
Product Name: Methanol Solution
Manufacturer: Fuel Cell Energy, Inc. Phone: 203-825-60003 Great Pasture RoadDanbury, CT 06813 Fax: 203-825-6100
Section 2. Composition / Information on Ingredients
Component CAS Number Percentage Exposure Limit Methanol 67-56-1 47 200 ppm PEL-TWA
200 ppm TLV-TWA skin250 ppm STEL-TLV
Water7732-18-5
53None Established
What-If Scenarios
Issue Cause Consequences Safety Response
Fuel Delivery Failure
Pump Failure, Injector Plug/Fails Closed, Fuel Leak, Fuel Filter Failure, Tank Leak, Empty Tank
Burner Temperature reaches low set point, Stack voltage drops
System trips on Burner Low Alarm, goes to automatic shutdown. Inverter trip at Low Stack Voltage. Combustible gas detector senses high shuts system down.
Fuel Over -Delivery
Injector Fails Open, PLC Control Failure
Burner Temperature reaches high set point.
System trips on High Burner Alarm. Stack temperatures reach high alarm, trips system. Enclosure temperature alarm limit reached, trips system.
Loss of Air Flow
Blower Failure Burner Temperature reaches low set point, Stack voltage drops
Same as Fuel Delivery Failure
Loss of Inverter
Inverter Failure, Power Line failure
Blower, Fuel pump, Light shut down, stack voltage drops
Automatic Shut Down
Localized Fuel Leak in Power Plant
Stack Manifold Failure Burner temperature drops to low set point. High set point reached in manifold TC ’s
Shutdown activated on low burner temperature and/or high manifold temperature.

C-6
Section 3 Hazards Identification
This product is a clear, colorless liquid with a mild alcohol odor.
Emergency OverviewCombustible liquid and Vapor! May cause eye irritation. Inhalation may cause headache, dizziness, drowsiness,nausea, visual impairment, acidosis, narcosis and unconsciousness. Methyl Alcohol may be absorbed through theskin in harmful amounts. Poisonous if swallowed.
Section 4 First Aid Measures
Eyes: If contact occurs, immediately flush eyes with plenty of water for 15 minutes. Hold eyelidsopen to assure thorough flushing. Get medical attention.
Skin: Remove any contaminated clothing. Immediately wash contact area thoroughly with soapand water. Launder contaminated clothing before re-use. Get medical attention if irritation orsymptoms develop.
Ingestion: Get immediate medical advice by calling a Poison Control Center, or hospitalemergency department. Do not attempt to give anything by mouth to or induce vomiting to anunconscious or drowsy person.
Inhalation: Remove person to fresh air. If breathing has stopped administer artificial respiration.If breathing is difficult, have medical personnel administer oxygen. Get immediate medicalattention.
Section 5. Fire Fighting Measures
Flash Point: 75 °C (167 °F) ASTMD93Explosive Limits: LEL: 6.0 percent (methanol) UEL: 36 percent (methanol)Auto ignition Temperature: 867 °F (464 °C) (methanol)
Extinguishing Media: Use carbon dioxide, alcohol foam or dry chemical. Do not use water toextinguish fire. Cool fire exposed containers with water.Unusual Fire and Explosion Hazards: Combustible liquid. Methanol-water mixtures will burnunless very dilute. Flame is invisible in daylight. Vapours are heavier than air and may travel toremote ignition sources and flashback. Vapours may form explosive mixtures with air.Special Fire Fighting Procedures: Wear positive pressure self-contained breathing apparatusand full protective clothing.Hazardous Combustion Products: Burning may release carbon monoxide, carbon dioxide andformaldehyde. Contact with metals such as aluminium may produce flammable hydrogen gas.
Section 6. Accidental Release Measures
Wear appropriate protective clothing and equipment. Eliminate all ignition sources. Ventilatearea. Contain spill and collect with an inert absorbent and place into a suitable container fordisposal. Do not use combustible materials such as sawdust. Do not flush to sewer. Notifyauthorities as required. Refer to Section 8 for personal protective equipment.
Refer to Section 13 for disposal information.

C-7
Section 7. Handling and Storage
Handling: Avoid contact with eyes, skin or clothing. Avoid breathing vapours or mists. Harmfulor fatal if swallowed. Use only with adequate ventilation. Wash exposed skin thoroughly withsoap and water after use. Do not swallow. Remove contaminated clothing and launder beforere-use. Keep away from heat sources, sparks, flames and all other sources of ignition. Nosmoking in use or storage area.
Empty containers contain product residues and may be hazardous.
Storage: Store in a cool, well-ventilated area away from heat, sparks, open flames and allsources of ignition.
Section 8. Exposure Controls / Personal Protection
Exposure Limits: Refer to Section 2.
Engineering Controls: For operations where the TLV may be exceeded, mechanical ventilationsuch as local exhaust may be needed to maintain exposure levels below applicable limits.Respiratory Protection: For operations where the TLV may be exceeded, a NIOSH approvedsupplied air respirator or positive pressure self-contained breathing apparatus is recommended.Organic vapour cartridge respirators are not recommended for methanol vapour exposures. Forfire fighting, use self-contained breathing apparatus. Respirators should be selected and used inaccordance with all applicable regulations (in the US, OSHA 1910.143) and good industrialhygiene practice.Eye Protection: Splash-proof goggles recommended.Skin Protection: Chemical resistant gloves such as butyl rubber or Viton where contact ispossible. Wear appropriate protective clothing to prevent skin contact..
Section 9. Physical and Chemical Properties
Appearance and Odor: Clear, colorless liquid with a mild alcohol odor. The reported mean odorthreshold for methanol is 160 - 690 ppm.Solubility in Water: Complete Boiling Point: 149 °F (methanol)pH: Not Available Melting Point: -144°F(methanol)Specific Gravity: 0.9 Vapor Density: Greater than 1Evaporation Rate: Not Available Vapour Pressure: Not AvailablePartition Coefficient: Not Available Flash Point: 75 °C
Section 10. Stability and Reactivity
Stability: Stable.Incompatibility: Avoid heat, sparks, open flames and all other sources of ignition. Incompatiblewith strong oxidizing agents, strong acids and zinc, aluminium and magnesium.Hazardous Decomposition Products: Burning or heating to decomposition may release carbonmonoxide, carbon dioxide and formaldehyde.Hazardous Polymerization: Will not occur.

C-8
Section 11. Toxicological Information
Health Hazards
Inhalation: Vapours or mists may cause irritation of the nose and throat with headaches. Highvapour concentrations may cause headache, dizziness, drowsiness, nausea, vomiting, tingling,numbness and shooting pains in the hands and forearms and visual disturbances.
Skin Contact: Prolonged skin contact may cause redness and defeating of the skin. Methanolmay be absorbed through the skin with symptoms similar to those listed under ingestion.
Eye Contact: Liquid, vapors or mists may cause irritation with redness, tearing and temporarycorneal damage.
Ingestion: Methanol is highly toxic and may produce severe acidosis, blindness and death.Swallowing may cause abdominal discomfort or pain, nausea, vomiting, dizziness, drowsiness,headache, visual disturbances, convulsions, coma and death. Visual effects from methanolinclude blurred vision, double vision, changes in color perception, restriction of visual fields andcomplete blindness.
Massive overdoses of methanol may cause damage to the liver, kidney and heart muscle. Theremay be a delay of several hours between swallowing methanol and the onset of symptoms.Toxicity is related to the degree of acidosis produced during the time between exposure andtreatment. Swallowing as little as 4 ml of methanol has caused blindness and ingestion of 80-150 ml is usually fatal.
Chronic Hazards: Prolonged or repeated inhalation exposure may produce signs of centralnervous system effects, including nausea, vomiting, headache, dizziness and visualdisturbances. Prolonged overexposure at levels of 800-1000 ppm may result and in severe eyedamage. Repeated skin contact may cause dermatitis.
Cancer: None of the components are listed as a carcinogen by IARC, NTP or OSHA.
Mutagenicity: Methanol has been positive in bacterial and mammal cell assays.
Reproductive Toxicity: Methanol has been shown to cause embryofetal toxicity and birthdefects in laboratory animals.
Medical Conditions Aggravated by Exposure: Individuals with preexisting eye, skin, liver andkidney disorders may be at increased risk from exposure.
Acute Toxicity Values: Methanol: LD50 Oral Rat 5,628 mg/kg; LC50 Inhalation Rat 64,000 ppm/4hr, LD50 Skin Rabbit 15,800 mg/kg
Section 12. Ecological Information
Methanol: TLM 96: >1000 ppm
Section 13. Disposal Considerations
Dispose of product in accordance with all local, state and federal regulations.

C-9
Section 14. Transport Information
Transportation Classification: Combustible liquid, n.o.s. (contains methanol), 3, NA1993, PGIII
Note: Refer to 49CFR 173.150 for exceptions for combustible liquids. Containers ofgreater than 10,638 lbs. must be identified as RQ.
Section 15. Regulatory Information
OSHA: Hazardous by definition in Hazard Communication Standard (29 CFR 1910.1200).Category: Irritant, Target Organ Effects, Flammable
EPA SARA Regulations:Hazard Category for Section 311/312: Acute Health, Chronic Health, Fire
Section 313 Toxic Chemicals: This product contains the following chemicals subject to SARATitle III Section 313 Reporting requirements:
Methanol 47 percentSection 302 Extremely Hazardous Substances (TPQ): None
Toxic Substances Control Act (TSCA): All components of this product are listed on the TSCAinventory.
CERCLA Section 103: Methanol has a RQ of 5,000 lbs. Releases over the RQ (reportablequantity) must be reported to the National Response Center. . The RQ for the product is 10,638lbs. Many states have more stringent release reporting requirements. Report spills requiredunder federal, state and local regulations.
California Proposition 65 - This product does not contain chemicals regulated under CaliforniaProposition 65.
This product has been classified in accordance with the hazard criteria of the CPR and theMSDS contains all the information required by the CPR.
Canadian Environmental Protection Act: All of the components of this product are listed onthe Canadian Domestic Substances list (DSL).
Canadian Workplace Hazardous Materials Information System (WHMIS) categories apply tothis product:D-2-B Irritant, Chronic Toxin,B-3 Combustible Liquid
Section 16. Other Information
NFPA RATING (NFPA 704) FIRE: 2 HEALTH: 2 REACTIVITY: 0

D-1
APPENDIX D
D.1 System Operation
D.1.1 System Startup
The fuel cell start up time was approximately 36 hours. The system was heated up with anexternal power source, in this case a 5-kW gas generator, which powered the two built in 750-watt electrical heaters. The fuel cell stack must be brought up slowly, at 25 °C per hour fromroom temperature to 390 °C. This heating can take place overnight with out intervention using atemperature controller. It is also important that the fuel cell stack never exceeds a 50 °Ctemperature difference from one side of the stack to the other. Once the temperature reaches390 °C, the methanol/water fuel mixture can be added. Once the liquid fuel is added, the systemmust be monitored continuously until the temperature across the entire stack is above 490 °C.There are no temperature shutdown safeguards in place during this part of the heating process.The stack must be controlled by manually adjusting the fuel flow using the fuel knob on the flowmeter to limit fuel flow. Again, the fuel cell should be brought up to temperature at a rate notexceeding 50 °C per hour and should not exceed a temperature difference across the stack ofmore than 60 °C.
Once 500 °C is reached, the system can be switched from ‘startup’ to ‘automatic’ and the systemwill run continuously as long as fuel is fed to the system, and it does not reach either the low(500 °C), or hi (680 °C) temperature shut down points.
D.1.2 PLC Control About 610 °C
The PLC controls the fuel to the fuel cell system. The set point temperature for this system is610 °C. Below this temperature, the PLC adds fuel slowly until this temperature is reached,above this temperature the fuel is cut back to a normal fuel flow as set in the system. When theburner temperature is below 610 °C the following controls are added to the fuel injector to bringthe system up to temperature:
1- Normal operation is in 200-second increments where the fuel injector is operated for 4 out ofevery 10 seconds at preset control conditions. For example 12 pulses per second with an on timeof 14 milliseconds would be a typical starting point.
2- If during that 200-second period the burner temperature does not reach 610 °C, the secondcycle starts and continues for 350 seconds. During this 2nd cycle, the same timing occurs but forthe first two seconds of each 10-second period, one additional pulse is added to the fuel injector.
3- If during that 350-second period the burner temperature does not reach 610 °C, the third cycleis started for a time of 40 seconds. During this time the same single pulse is added for the firstseven seconds and returns to the original pulse rate for the next 1 second, repeating every 8seconds. If the 610 °C set point in not reached during this time, it will stay in this control patternin 40-second intervals until 610 °C is reached and be reset to the first cycle.
4- If during any of the above cycles 610 °C is reached, the system resets to the first cycle.
E-1
APPENDIX E
E.1 System Start Up Problems & Power Outages
E.1.1 Air bubbles in fuel line
On 2/3/02 the system shut down due to an over temperature spike. There was no apparentcause for this to happen. The system shuts down if the burner temp reaches 680 °C. The systemwas restarted on electrical heaters on 3/4/02, and FCE sent an engineer to help. After anotherfailure on 3/5/02, the fuel injector was replaced as a probable cause for the shut down.
On 3/6/02 again the system was shut down in the morning, but restarted quickly due to residualheat. During the day small bubbles were noticed going through the clear flow cube. The flowcube was a monitoring device for the fuel flow. It has a stainless steel ball, which measures thefuel flow to the fuel cell. On 3/7/02 it was found shut down in the morning, and again restarted.This time there were air bubbles in the flow cube at the top.
On 3/8/02 the system was again found shut down, and restarted. That night while watching thesystem a slight noise was heard and thousands of bubbles were noticed passing through the flowcube over a 5-10 second interval. These bubbles were like those in sparkling water but smaller insize. Shortly after this, the burner temperature climbed to 682 °C. While that normally wouldhave shut the system down, the fuel injector control was switched to manual for a few minutesand then placed back in automatic to prevent shut down. In fact, this over-temp situation washappening every 25 minutes more or less, very periodic, and each time thousands of bubbleswere viewed flowing through the flow cube. Checking the fuel lines from inside at the fuel cell tothe tank outside, it was determined that the valve packing on the emergency fuel shut off valveoutside on the fuel tank was loose. The valve packing was tightened; the lamp portion of theload was turned off for the night and the system left to idle on the housekeeping load. Thesystem was restarted again on 3/9/02.
On 3/10/02 the system was again found shut down in the morning. It was restarted and the loadwas turned back on at 2038. On 3/11/02, the system had run overnight, and at 1830 morebubbles were seen flowing through the flow meter. The valve was again tightened and the topwas packed with pipe compound in case air was leaking into the packing.
On 3/12/02 the emergency shut off valve was removed and a straight pipe was put in its placeuntil a new valve could be found.
On 4/11/02 the USCG Group Engineer found the system shut down. Service personnel arrivedon 4/12/02 and the system was restarted and running on 4/13/02.
On 4/15/02 more bubbles were observed, all the fittings along the fuel lines all the way to thetank were coated with RTV silicone to seal them.
On 4/17/02 the system was found shut down in the morning, and it was restarted and running bythe end of the day.
On 4/18/02 the system was again found shut down in the morning. On this occasion it wasoperator error. The air in valve, which is normally choked half way while starting for a short time,was never opened. The resulting air restriction caused a low power condition, which shut thefuel cell down. The system was restarted by 1407. Thousands of micro bubbles showed in theflow cube again on the 18t h and an over temp shutdown condition was averted by temporarilyswitching the fuel injector control to manual, and a few minutes later back to automatic.
On 5/10/02 the bubble dilemma was solved. During normal operation more bubbles wereobserved passing through the fuel flow meter. These bubbles seemed periodic preceded by asmall noise and each time caused a small rise in the burner temperature generating a saw toothtype pattern on the burner temp plot. These temperature lines are normally almost flat. Itappeared that the bubbles were being formed in the fuel line from dissolved oxygen. By tappingon the fuel lines, which run along the side of the building and waiting a short period of time,

E-2
bubbles could be seen passing through the flow meter. This small test determined this waswhere the bubbles were forming. Like a clear soda bottle full of water sitting in the sun wheresmall bubbles formed on the inside walls of the bottle, small bubbles of dissolved oxygen form onthe inside wall of the fuel line. The fuel line starts at the fuel tank in full sun and passes throughone of the small air vents in the bottom of the wall into the hot building and then to the fuel cell.The fuel line is small and has a ¼-inch inside diameter and the fuel flow to the fuel cell is low.When the bubbles on the wall get big enough and one breaks loose it acts as a pusher andpushes other bubbles in front of it; much like rain drops on an automobile windshield, where onedrop hits another and then another getting bigger with each encounter. These bubbles arecaptured by the fuel pump (the noise heard) and are subsequently pressurized to 35 PSI by thefuel pump just prior to being released by the opening of the fuel injector. Upon release thesefuel bubbles expand and because there are hundreds or thousands of them they act as a smallpressure wave and push fuel into the fuel cell system under more than normal pressure causinga burst of temperature in the burner, which can cause an over temperature situation and ashutdown. The periodicity of this phenomenon was due to different ambient temperatures.Depending on the outside temperature, enough bubbles may or may not form fast enough tobecome a problem, which is why on some days when only a few bubbles formed they were notenough to trigger a shut down.
On 5/13/02 FCE personnel arrived with what we will call a fuel tree to solve the bubble problem.This fuel tree is a ¾ inch stainless steel pipe about seven feet tall. The fuel from the fuel tankenters through a pipe at a distance of about five inches above the floor. The fuel outlet, whichdelivers fuel to the fuel cell, is taken from about three inches above the floor. This fuel tree isopen to the air at the top and is taller than the fuel tank outside. The fuel tree level seeks thesame level as the fuel tank level, and as bubbles are formed in the fuel line outside, they arereleased into the fuel tree pipe and simply float to the top and release into the air. The fuel drawnfrom a lower level pipe on the fuel level tree is always bubble free.
E.1.2 UPS Problem
A very small uninterruptible power supply (UPS) was on the system. The UPS was inserted onlyto keep the computer running while the system was switched from the start up mode to normaloperation run mode. One of the problems faced when the fuel cell was shutting down often at thebeginning of the test was that we would always loose the trace on the computer, so there wasnever an indication of why the system shut down. The file structure for data storage is about 30minutes. As the system shut down quickly, the traces were always lost because the UPS hadonly enough power to last about 10 minutes. To rectify the problem, a very large UPS was put inthe system to power the computer for almost an hour. This UPS, however, also gave us problemsand in two cases, on consecutive days, caused the system to shut down. As it turns out, thelarge UPS couldn’t withstand the high temperature in the fuel cell building. These units aremade for air-conditioned computer rooms and not a room that can get to 107 °F. This unit wastaken out about the same time as the bubble problem was solved and the small UPS remainedfor the duration. The file structure for data storage was changed to a shorter time frame toaccommodate the 10-minute power cycle of the small UPS.
E.1.3 PLC problem
On 3/17/02 the FCE personnel reported that there were no more bubbles but that the fuel cellhad been shutting down each night now with the temp dropping off, rather than the overtemperature situation experienced before. FCE suspected the control hardware was the cause ofthis shutdown. A possible reason for this failure was an increase in outside temperature whichresulted in an increase in temperature inside the building. A hair dryer was used to artificiallyheat the control box to see if heat was the actual problem. This additional heat caused the fuelinjector to fail, and failure was due to overheating of one of the several Programmable LogicControllers that control the fuel cell. This PLC module was replaced on 3/20/02 and a fan wasput in the cabinet to keep air flowing through the control hardware box. This hardware failureappears to be due to the component not meeting temperature specifications.

E-3
E.1.4 The Fuel Injector Problem
Early during the testing when the fuel cell was shutting down, prior to the knowledge of thebubble problem, the fuel pump and fuel injector were replaced because it was thought thesewere part of the problem. As it turned out neither were at fault. On 7/20/02, R&DC personnelarrived on site to find the system shut down. A restart was attempted and it was discovered thatthe fuel injector was not pulsing. The fuel injector and the integrated circuit were both burnedout and were replaced. This was a General Motors production fuel injector with a presumed highreliability and should not have failed. The system was restarted on 7/23/02. This constituted thefirst real equipment failure that was not due to operator error, equipment not meeting ourtemperature specifications, or learning about the peculiar aspects of the fuel in a first real-worldmarine environment installation.
E.1.5 Operator Error
Two instances of operator error also resulted in a system shutdown. On one occasion FCEpersonnel shut down the system while adjusting the injection frequency bandwidth of the fuelinjector remotely over the telephone line. These adjustments were made from time to time asthe ambient temperature changed over the year. The error occurred while typing in a newnumber. The software interaction was sluggish and by the time the error was noticed, there wasno time to change it before the system exceeded the high temperature set point.
The second instance was during a restart. R&DC personnel left the manual air control choked.This manual control is used to cut down the flow of air for the first few minutes when fuel is firstintroduced into the system and then returned to the full open position. When left in the chokedposition, there is not enough airflow to sustain the fuel cell and it shut down by dropping belowthe low temperature set point.
E.1.6 Computer Problems
Since the beginning of the test the original computer was a problem. The clock in the computerdid not keep proper time, and it was constantly being reset. The modem that provided the onlygateway to talk to the fuel cell control system remotely was always sluggish and slow.Eventually it was decided to replace the computer with an industrial type with a new modem. Asthis took place and the FCE personnel talked with the CITEK company about their software theydiscovered that the Windows 98®, system software has posed this problem when using theirsoftware. They had seen this problem before. The system software was upgraded to Windows2000®, and two modems were installed in the computer. One modem would be used to send outthe automatic faxes that the system sends at 1000 daily, as well as the emergency faxes whenthe system passes through either the high (680 °C) or the low (510 °C) set points. The othermodem would be used expressly for communication for remote access by FCE and R&DC. Bothof these modems use the single phone line. Once this new computer system was in place, thecomputer part of the system ran flawlessly and gave instant communications to test personnel.

F-1
APPENDIX F
F.1 Economic Analysis of Life Cycle Cost for USCG Remote Site Fuel Cell PowerSystems
Life cycle cost is composed of the initial capitalization cost and the operating costs. Thecapitalization cost of fuel cell power systems is projected to be greatly reduced due to strongcommercial development, and the projected operating costs will be less than comparable diesel-generator plants due to reductions in fuel consumption, maintenance and manning. The currentcontract with Fuel Cell Energy Inc. to install a three-kW fuel cell system in Cape Henry Light is$100,000, and this cost is projected to decrease in the future when production meets the marketdemand. Several companies are optimistic about achieving an initial unit cost below $1000/kWby 2005.
At many remote sites such as lighthouses, submarine cables (sub cables) provide electric power,but these cables are expensive to buy and install, and require frequent maintenance. In alighthouse in Delaware Bay it will cost over $300K to replace the cable. A replacement fuel cellpower system may cost less than $100K. In similar situations, other agencies have found thatfuel cells can provide a better power choice—the National Park Service reports a saving of $47Kfor its Golden Gate Bridge Concession Building with a fuel cell installation; the City of New Yorkhas recently replaced their overburdened Central Park substation power supply with a fuel cellinstallation and eliminated a expensive underground cable replacement.
The Coast Guard’s solar power program has been very successful over the last 20 years, andnow major light stations are being converted to solar power. The Graves Light Station in BostonHarbor presently has a 1000-W lamp and the cost to solarize will be about $150K including thecost of labor. This cost does not include the ancillary equipment already in the Coast Guardinventory. Thus, the capitalization costs of solar/PV and fuel cells are similar, but the life cyclecost of fuel cell power systems do not compare favorably due to their need for fuel.
Fuel cell power systems are a very effective alternative for those sites that require greater powerthan can be provided by solarization, or cannot be solarized due to other constraints such asclimate, site size and/or esthetics. Using these figures, the cost advantage of the fuel cell can besimplified to a comparison between replacing/maintaining the cable and annually transporting thefuel. As an example, the First District wants to eliminate submarine cables for ATON sites, asthe cost of maintaining the cable boat is prohibitive. The annual cost is $450K-500K, consistingof $200K for the personnel and $250K for work orders for the boat and cable purchases. Thereare presently 41 submarine cable sites in D1, and the average cost per site for maintaining thecables is $11K/year, or $6K, not including the billets . The cost of transporting the fuel includesplatform and billet costs. The fuel could be delivered at an annual saving of about $4K per site,over maintaining the submarine cable.
Air pollution is currently “free” in that fines are not levied for exhaust emissions, but couldbecome a cost liability in the future. Additional advantages for a fuel cell system such asinconspicuous installation and operation are offered such as at Seguin Island Light in Mainewhere local interests engaged Congress to resist the planned solarization. Seguin has a 17,000-ft cable and electric costs are $1800/yr. If a fuel cell were in use, there would be a need totransport fuel to the fuel cell power system. A one-KW fuel cell system would use approx. 1000gal/year of methanol. The annual cost of the fuel is comparable to the electric utility cost forSeguin, but both fuel and electrical energy costs are currently volatile and this may change in thefuture.

G-1
APPENDIX G
G.1 Fuel Accounting to the U.S. Army for the Cape Henry Fuel Cell Project
A condition set by U.S. Army Fort Eustis, Environmental and Natural Resource Division, Directorof Public Works, was that the USCG R&D Center make a full accounting of all fuel brought ontothe Fort Story Army Post, and all fuel used during the experiment. This accounting is to ensurethere were no spills on the Ft. Story facility and that the only fuel expended was for that of thefuel cell experiment. The following spreadsheet printout is the response sent to that Office.Included along with this document were copies of all fuel delivery invoices and a copy of theinvoice by an EPA certified hazardous material removal company for the removal of unused fuel.
Fuel Accounting for Cape Henry Fuel Cell Project 12/2/02Project officer Robert Desruisseau 860-441-2660By USCG R&D Center, 1082 Shennecossett Road, Groton CT. 06340Fuel is 47% methanol, 53 % deionized water, mixed by weight
FUEL USE DURING PROJECT TESTThere were 3,250 gallons of fuel delivered to the Cape Henry Site. The fuel was provided by Chemical andSolvents Inc. Colonial Heights, VA. 804-526-0877. The fuel cell used 2,889.81 gallons generating electricity.
There were no fuel leaks detected nor any fuel spilled during operation. At the end of the project the fuel tankwas pumped out by C&M Industries, Inc. Chesapeake, VA. 757-543-8775. Their invoice # 41311 showsthat 161.8 gal lons were pumped out. Our measurements show 361 gal lons pumped out. Mr. Wil l iam Barnesfrom the Ft. Eustis, Environmental Office was on site and was notif ied of the discrepancy.
The visual leak detector system built into the double wall of the fuel tankshowed no leaks to the double wall during any part of the test.
Cumulative Storage Tank Tank Leak Calculation Calculated CumulativeDate Time Hr Meter Fuel Depth Detector Cal gal/in Gal Used Gal Del
2/21/02 fuel del 500 gallons 0 No leak 8.13 gal/in 0 5002/21/02 13:02 0.0 61.5"2/23/02 17:08 0.0 Start test inverter on2/24/02 8:36 15.52/24/02 11:25 4' 11" 20.22/27/02 11:25 4' 4 7/8 69.92/27/02 15:49 94.62/28/02 11:25 4' 2 1/2 89.1
3/1/02 11:25 48 1/4 107.33/2/02 11:25 3' 10 1/2 121.53/3/02 11:25 3' 8 1/2 137.73/3/02 19:44 189.43/4/02 7:48 189.43/5/02 8:44 189.43/5/02 11:42 3' 7 3/4 143.83/6/02 9:09 203.03/6/02 11:15 3' 6 1/4 No Leak 1563/6/02 13:22 203.63/6/02 14:31 204.73/6/02 16:10 206.43/8/02 8:59 238.53/8/02 11:25 3' 3 1/4 180.33/8/02 18:43 242.53/9/02 7:53 255.73/9/02 11:19 3' 1 1/4 196.53/9/02 13:30 261.23/9/02 20:00 267.6

G-2
3/10/02 3' 0" 206.63/10/02 14:08 271.93/10/02 23:04 275.53/11/02 6:04 282.63/11/02 10:31 287.23/11/02 11:25 2' 10" 222.83/11/02 20:54 297.43/12/02 11:25 2' 8"=32 in 2393/12/02 11:53 312.3
11:30 Calculated value based on 3-11 to 3-12 fuel useeq 2 in per day3/19/02 estimated fuel level 2'8" 7days x 2"/d eq 14" used3/19/02 11:25 EST 32 -14 = 18 in 352.53/19/02 fuel delivery 250 gallons 7503/19/02 48 3/4 61.5 + 50" - 18"= 92.3"
4/4/02 10:12 1' 8 1/2" No Leak 581.934/4/02 10:43 fuel delivery 250 gallons 8.06 gal/in 10004/4/02 11:17 4' 3 1/2" 92.3 + 51.5- 20.5" = 123.30"
4/12/02 12:28 3' 3" 683.254/15/02 11:00 3' 1/2" 703.514/16/02 15:42 2' 10" 723.774/17/02 7:35 996.14/17/02 11:35 2' 9 1/2" 727.834/18/02 9:47 2" 8 1/2" No Leak 735.934/18/02 10:35 1002.44/18/02 14:07 1002.64/18/02 14:34 fuel delivery 250 gallons 8.19 gal/in 12504/18/02 15:25 5' 3" 123.3+5' 3- 2' 8" 1/2= 153.8 in
5/9/02 10:30 1' 6 3/4" No Leak 1094.585/9/02 10:30 fuel delivery 250 gallons 8.0 gal/in 15005/9/02 11:21 4' 2" 153.8+4' 2" -1' 6 3/4" = 185.05 in5/9/02 11:50 1502.3
5/10/02 11:30 3' 11 3/4" 1112.8175/11/02 11:43 3' 9 1/2" 1131.0535/11/02 11:55 1550.15/28/02 10:20 11" 1,410.6755/28/02 10:24 1945.0 No Leak5/28/02 10:25 fuel delivery 250 gallons 8.13 gal/in 17505/28/02 11:23 3' 5 3/4" 185.05+3' 5 3/4" - 11" = 215.8 in5/28/02 11:25 1946.9
6/11/02 10:08 2279.06/11/02 10:13 1' 2 1/2" No Leak 1,631.596/11/02 11:27 fuel delivery 250 gallons 8.19 gal/in 20006/11/02 13:05 3' 9" 215.8+3' 9" - 1' 2 1/2" = 246.3 in6/17/02 17:02 2428.86/17/02 17:08 2' 9" 1,728.7926/18/02 7:46 2443.0
Cumulative Storage Tank Tank Leak Calculation Calculated CumulativeDate Time Hr Meter Fuel Depth Detector Cal gal/in Gal Used Gal Del

G-3
6/18/02 11:21 2' 7 1/4" No Leak 1,742.986/18/02 11:49 fuel delivery 250 gallons 8.00 gal/in 22506/18/02 12:35 5' 2 1/2" 246.3 + 5' 2 1/2" - 2' 7 1/2" = 277.55 in
7/8/02 10:55 2920.07/8/02 11:16 1' 11 1/4" 2,061.107/9/02 11:15 1' 9 3/4" No Leak 2,073.267/9/02 13:20 fuel delivery 250 gallons 8.19 gal/in 25007/9/02 14:12 4' 4 1/4" 277.55 + 4'4 1/4"-1' 9 3/4 " = 308.05 in
7/20/02 10:00 3124.17/20/02 11:31 3' 1/2" No Leak 2,200.937/23/02 12:44 fuel delivery 235 gallons at 8.105 couldn't take all of del 27507/23/02 12:51 65 1/2" 308.05 + 65.5 - 3' 1/2" = 337.05 in8/13/02 10:55 3603.8 1' 10 1/4" No Leak 2,551.458/13/02 11:24 fuel delivery 265 gallons at 8.105 this is 250 + left over 30008/13/02 12:03 4' 7 1/4" 337.05 +4' 7 1/4" - 1' 10 1/4" = 370.05 in8/27/02 10:14 3932.9 2' 3" No Leak 2,780.428/27/02 10:21 fuel delivery 250 gallons 32508/27/02 11:12 4' 10" 370.05 + 4' 10" - 2' 3" = 401.05 in
9/10/02 10:21 4090.4 3' 8 3/4" system shut down. 2,887.81 3250End of test.
11/5/02 16:26 3' 8 1/2" lost 1/4 inch evaporation 2,889.81 3250
11/6/02 C&M pump ed out 286 gal by their measure Acutal amtpumper out using 8.105 gal per in is 361 gal.Mr W. Barnes was on site and was advised of the descripen cy at the time.
add 361 pumped out11/6/02 4090.4 0 3250.81 3250
Cumulative Storage Tank Tank Leak Calculation Calculated CumulativeDate Time Hr Meter Fuel Depth Detector Cal gal/in Gal Used Gal Del

G-4
Final Fuel Note
Final Fuel 2889.1 gal plus 361 pumped out equals 3250.81 gallonsThis accounts in total for the 3250 gallons of fuel brought on the premises of Fort Story Facility.
CALCULATIONS OF FUEL PER INCH IN TANK
Date Gallons Gallons Fuel depth Gal / inchDelivered delivered calculated measured calculation
2/21/02 500 61.5 8.133/19/02 250 32 *1 note
4/4/02 250 31 8.0654/18/02 250 30.5 8.197
5/9/62 250 31.25 85/28/02 250 30.75 8.136/11/02 250 30.5 8.1976/18/02 250 31.25 8
7/9/02 250 30.5 8.1977/23/02 The deliver of 7/23 & 8/13 *Note 18/13/02 totals 500 gal. Used together *Note 2 8.0658/27/02 250 31 8.065
Total fuel measured 3,151 Average 8.105 g/l
*Note 1 These values were used together in the avg calculation because thedelivery on 7/23 would not fit. The remainder of that delivery was in 8/13’s.
*Note 2 This measurement was not used because the depth just prior to thedelivery was estimated and not actually measured.