asiandbonsonline.adb.org us 2.87 -3.46 2.37 46.95 …...in the third quarter (q3) of 2017, based on...
TRANSCRIPT

19 February 2018
asiandbonsonline.adb.
org
asianbondsonline.adb.org
asiandbonsonline.adb.org
……………………………………………………………………………………………………………..……………..……
Key Developments in Asian Local Currency Markets
asiandbonsonline.adb.org
1
Selected Government Security Yields
Benchmark Yield Curves - Local Currency Government Bonds
Policy Rate versus Inflation Rate Charts Credit Default Swap Spreads & Exchange Rate Indexes Selected Debt Security Issuances Selected Asia Data Releases
2-versus-10 Yield Spread Chart
apan’s gross domestic product (GDP) growth slowed to 0.1% quarter-on-quarter (q-o-q) in the fourth quarter (Q4) of 2017 from 0.6% q-o-q in the third quarter (Q3) of 2017, based on preliminary estimates by the Cabinet Office. The slower growth was led by declines in government consumption and public investment. Malaysia’s GDP expanded faster than expected at 5.9% year-on-year (y-o-y) in Q4 2017, largely driven by private sector demand. In full-year 2017, Malaysia’s economic expansion accelerated to 5.9% from 4.2% in full-year 2016.
Singapore’s economy grew 3.6% y-o-y in Q4 2017, slower than the 5.5% y-o-y expansion posted in Q3 2017. For full-year 2017, Singapore’s economy expanded 3.6% y-o-y.
Bank Indonesia maintained its 7-day reverse repo rate during its monetary policy meeting on 14–15 February. Indonesia’s central bank stated that it kept the policy rate unchanged as it considered previous steps to ease monetary policy adequate to support the domestic economic recovery. The Bank of Thailand’s Monetary Policy Committee decided on 14 February to keep the policy rate unchanged at 1.50% as the economy’s outlook improved and inflation is expected to gradually rise.
Exports from Indonesia rose 7.9% y-o-y to USD14.5 billion in January and imports jumped 26.4% y-o-y to USD15.1 billion, both recording faster growth compared to the previous month. Indonesia incurred a wider trade deficit of USD676.9 billon in January, the highest deficit since April 2014. Singapore’s non-oil domestic exports rose 13.0% y-o-y in January, higher than the 3.1% y-o-y growth posted in December.
Malaysia posted a current account surplus in Q4 2017 amounting to MYR12.9 billion, which was the largest quarterly surplus in 2017. The larger surplus was mainly attributed to the strong performance of goods exports during the quarter. In full-year 2017, Malaysia recorded a current account surplus of MYR40.3 billion, up from full-year 2016, driven by a higher surplus in goods that offset the deficits in the services and income accounts.
Foreign investors returned to the Republic of Korea’s local currency bond market in January as investors bought a net KRW2,322 billion of listed bonds, following a net sale of KRW1,066 billion in December. The Bangko Sentral ng Pilipinas reported that net portfolio investment inflows in the Philippines in January narrowed to USD162 million from USD457 million in December.
Personal remittances from overseas Filipino workers rose 7.9% month-on-month to USD3.0 billion in December 2017, bringing the full-year 2017 tally to USD31.3 billion, up 5.3% from full-year 2016. Cumulative cash remittances coursed through banks in full-year 2017 reached USD28.1 billion.
The Bangko Sentral ng Pilipinas reduced the reserve requirement ratio of Philippine banks by 100 basis points to 19.0% as an operation adjustment to support its shift to a more market-based approach in implementing its monetary policy objectives.
Last week, local currency bonds yields fell for most tenors in the emerging East Asian markets except in Indonesia, the Philippines, and Singapore where yields rose for most tenors while yield movements were mixed in Malaysia. Meanwhile, yield spreads between 2-year and 10-year tenors widened in all markets except in the Philippines.
J Asia Bond Monitor November 2017 read more
10-Year Selected LCY Government Security Yields
asiandbonsonline.adb.org
Close of 16 February 2018
asiandbonsonline.adb.
org
basis point change from Markets Latest Closing Previous Day* Previous Week* 1-Jan-18*
US 2.87 -3.46 2.37 46.95
EU 0.71 -5.80 -3.90 27.90
Japan 0.06 -0.80 -0.70 1.10
PRC 4.09 0.00 -1.00 7.00
Hong Kong, China 2.04 0.00 -4.20 20.40
India 7.58 0.60 8.90 24.20
Indonesia 6.43 0.00 5.30 10.70
Korea, Rep. of 2.75 0.00 -1.50 28.50
Malaysia 4.02 0.00 6.70 10.40
Philippines 6.71 0.00 17.57 101.03
Singapore 2.29 0.00 4.35 28.88
Thailand 2.40 0.00 -2.00 7.50
Viet Nam 4.36 0.00 0.80 -84.20
2.37
-3.90
-0.70
-1.00
-4.20
8.90
5.30
-1.50
6.70
17.57
4.35
-2.00
0.80

………………………………………………………………………………………..……………………………..……...…
asianbondsonline.adb.org
asiandbonsonline.adb.org
………………………………………………………………………..………………………………………………….......
DEBT HIGHLIGHTSASIANBONDSONLINE
2
Summary Text of News Articles
GDP Growth Decelerates to 0.1% q-o-q in Japan, 5.9% y-o-y in Malaysia, and 3.6% y-o-y in Singapore in Q4 2017 ........................................................................................................................................ Japan’s economic growth slowed to 0.1% quarter-on-quarter (q-o-q) in the fourth quarter (Q4) of 2017 from 0.6% q-o-q in the third quarter (Q3) of 2017, based on preliminary estimates by the Cabinet Office. The slower growth was led by declines in government consumption and public investment, which fell 0.1% q-o-q and 0.5% q-o-q, respectively. Private residential investment continued to contract in Q4 2017, declining 2.7% q-o-q. Imports also increased at a faster pace of 2.9% q-o-q compared to exports, which rose 2.4% q-o-q. Meanwhile, private consumption posted growth of 0.5% q-o-q. On an annualized basis, Japan’s economic growth decelerated to 0.5% in Q4 2017, following growth of 2.2% and 2.5% in the two previous quarters.
Malaysia’s gross domestic product (GDP) growth was 5.9% y-o-y in Q4 2017, faster than expected but slower than the 6.2% y-o-y growth logged in Q3 2017. On the expenditure side, private sector demand continues to be the main driver of growth, with private consumption rising 7.0% y-o-y and private investment rising 9.2% y-o-y. Government expenditure saw faster growth in Q4 2017 at 6.9% y-o-y compared with 3.9% y-o-y in Q3 2017, while government investment contracted 1.4% y-o-y from an expansion of 4.1% y-o-y. Both export and import growth slowed in Q4 2017 versus Q3 2017 at 7.1% y-o-y and 7.4% y-o-y, respectively. On the production side, all economic sectors exhibited increased growth in Q4 2017 except for mining and quarrying, which declined 0.5% y-o-y due to lower production of natural gas and crude oil; the agriculture sector had the fastest increase of 10.7% y-o-y. On a q-o-q seasonally adjusted basis, GDP posted growth of 0.9% in Q4 2017, down from 1.8% in Q3 2017. In full-year 2017, Malaysia’s economic expansion accelerated to 5.9% from 4.2% in full-year 2016. The Malaysian government expects growth to remain robust in 2018, albeit at a slower pace ranging between 5.0% and 5.5% in 2018.
Singapore’s economy grew 3.6% y-o-y in Q4 2017, slower than the 5.5% y-o-y expansion posted in Q3 2017. The manufacturing sector’s growth decelerated to 4.8% y-o-y from 19.1% y-o-y in the previous quarter. Most major services-producing industries posted higher growth rates in Q4 2017, led by information and communications (6.0% y-o-y) and transportation and storage (5.3% y-o-y). The finance and insurance sector posted the highest annual growth rate at 6.3%, though this was slower than the 7.1% y-o-y growth in Q3 2017. The construction industry continued to contract in Q4 2017. On an annualized q-o-q basis, Singapore’s economy grew 2.1% in Q4 2017 versus 11.2% q-o-q in Q3 2017. For full-year 2017, Singapore’s economy expanded 3.6% y-o-y. The Ministry of Trade and Industry expects growth to moderate in 2018 and to be slightly above the middle of the forecast range of 1.5%–3.5%.
Bank Indonesia Maintains Reverse Repo Rate at 4.25%;
BOT Keeps Policy Rate Unchanged at 1.50% ........................................................................................................................................ Bank Indonesia maintained its 7-day reverse repo rate at 4.25% as well as its deposit facility and lending facility rates at 3.50% and 5.00%, respectively, during its monetary policy meeting on 14¬15 February. Bank Indonesia stated that it kept the policy rate unchanged as it considered previous steps to ease monetary policy adequate to prop up the domestic economy. Indonesia’s economy expanded 5.2% y-o-y in Q4 2017, up from 5.1% y-o-y in Q3 2017, indicating that the economic recovery is gaining traction. Inflation remained manageable and within the target despite the increase in inflationary pressure coming from volatile food prices. The central bank will continue to monitor risks such as growing uncertainty in global financial markets caused by the anticipated increase the United States’ federal funds rate, which can affect local market conditions, and the potential build-up of inflationary pressure from volatile food prices.
The Bank of Thailand’s Monetary Policy Committee unanimously voted to keep the policy rate unchanged at 1.50% in its monetary policy meeting held on 14 February. The decision was based on the economy’s improved outlook driven by growth in exports of goods and services, and continued expansion of private consumption. Headline inflation was projected to gradually rise as domestic demand picks up and oil prices continue to recover. The benchmark rate has remained unchanged since April.
For policy rate trends in Indonesia, refer to this link: https://asianbondsonline.adb.org/indonesia/data/marketwatch.php?code=policy_rate_and_inflation_trends
For policy rate trends in the Philippines, refer to this link: https://asianbondsonline.adb.org/philippines/data/marketwatch.php?code=policy_rate_and_inflation_trends

………………………………………………………………………………………………………………………..……….
………………………………………………………………………………………………………………………..….......
asianbondsonline.adb.org
asiandbonsonline.adb.org
DEBT HIGHLIGHTSASIANBONDSONLINE
3
Summary Text of News Articles
Bank Indonesia Maintains Reverse Repo Rate at 4.25%;
BOT Keeps Policy Rate Unchanged at 1.50% (cont…) ........................................................................................................................................ For policy rate trends in Thailand, refer to this link: https://asianbondsonline.adb.org/thailand/data/marketwatch.php?code=policy_rate_and_inflation_trends
Indonesia’s Trade Deficit Widens in January;
Singapore’s NODX Rise in January ........................................................................................................................................ Exports from Indonesia rose 7.9% y-o-y to USD14.5 billion in January, the second consecutive month of single-digit growth, while imports jumped 26.4% to USD15.1 billion. Both exports and imports recorded faster growth in January compared to the previous month, driven by exports of mining and manufactured goods, and imports of raw materials. In January, Indonesia incurred a wider trade deficit of USD676.9 billon versus USD220.1 billion in December. It was the second consecutive month of recording a deficit following November’ surplus and, is also the highest deficit since April 2014.
Singapore’s non-oil domestic exports (NODX) rose 13.0% y-o-y in January, higher than the 3.1% y-o-y growth posted in December. Nonelectronic NODX exhibited strong growth of 20.7% y-o-y in January following a 6.8% y-o-y increase in the previous month. Electronic NODX continued to contract, decreasing 3.9% y-o-y in January after a 5.3% y-o-y decline in December. NODX to Singapore’s top 10 markets grew for most markets except for Thailand and Taipei,China. On a seasonally adjusted month-on-month basis, Singapore’s NODX decreased 0.3% in January.
Malaysia’s Current Account Surplus Expands in Q4 2017 and Full-Year 2017 ........................................................................................................................................ Malaysia posted a larger current account surplus in Q4 2017 amounting to MYR12.9 billion, which is the largest quarterly surplus in 2017. The larger surplus is attributed to strong performance in goods exports during the quarter with a surplus of MYR34.1 billion, up from MYR31.7 billion in Q3 2017, as well as a smaller deficit in secondary income of MYR4.8 billion, down from MYR5.7 billion. For full-year 2017, Malaysia recorded a current account surplus of MYR40.3 billion, 38.8% higher than full-year 2016’s surplus, mainly driven by a higher surplus in goods that offset the deficits in services and income.
Net Foreign Bond Investment in the Republic of Korea Turns Positive in January;
Philippine Net Portfolio Investment Inflows Fall in January ........................................................................................................................................ Foreign investors returned to the Republic of Korea’s local currency bond market in January following 2 consecutive months of net foreign outflows. Foreign investors bought a net KRW2,322 billion of listed bonds, following a net sale of KRW1,066 billion in December. Net bond inflows amounted to KRW1,330 billion for Monetary Stabilization Bonds and KRW1,000 billion for Korea Treasury Bonds. However, foreign investors sold a net KRW8 billion of corporate bonds.
The Bangko Sentral ng Pilipinas (BSP) reported that net portfolio investment inflows in the Philippines in January narrowed to USD162 million from inflows of USD457 million in December. The decline in net inflows was due to a rise in gross outflows to USD1.5 billion in January from USD1.1 billion in the previous month, despite a rise in gross inflows of USD1.62 billion from USD1.56 billion in the same period. The top five investor locations were the United Kingdom; the United States; Malaysia; Singapore; and Hong Kong, China.
Philippine Remittances Rise in December ........................................................................................................................................ Personal remittances from overseas Filipino workers rose 7.9% month-on-month to USD3.0 billion in December from USD2.5 billion in the previous month. For full-year 2017, personal remittances reached 31.3 billion, an increase of 5.3% y-o-y from the prior year’s USD29.7 billion. Cash remittances coursed through banks reached USD28.1 billion in full-year 2017, led by contributions from workers in the United States, United Arab Emirates, and Singapore.

………………………………………………………………………………………………………………………..……….
………………………………………………………………………………………………………………………..….......
asianbondsonline.adb.org
asiandbonsonline.adb.org
DEBT HIGHLIGHTSASIANBONDSONLINE
4
Summary Text of News Articles
BSP Reduces Reserve Requirement Ratios of Banks ........................................................................................................................................ The BSP reduced the reserve requirement ratio of Philippine banks by 100 basis points to 19.0%. The BSP emphasized that the reduction in the reserve requirement ratio is an operation adjustment and not reflective of its current monetary policy stance. The BSP said that it has shifted to a more market-based approach in its adoption of the interest rate corridor framework and will rely less on the use of reserve requirement ratios to implement its monetary policy objectives.

…………………………………………………………………………………………………………………………………
…………………………………………………………………………………………………………………………….......
asianbondsonline.adb.org
asiandbonsonline.adb.org
DEBT HIGHLIGHTSASIANBONDSONLINE
5
Tip: Zoom-in on the table using the Acrobat zoom tool
Selected Government Security Yields
3-Month Selected LCY Government Security Yields
10-Year Selected LCY Government Bond Yields
Close of 16 February 2018
Close of 16 February 2018
EU = European Union, LCY =local currency, PRC = People’s Republic of China, US = United States.
Source: Based on data from Bloomberg, LP.
Previous
Day*
Previous
Week*1-Jan-18*
US 1.59 0.22 3.56 21.44
EU -0.58 -0.70 0.30 16.00
Japan -0.18 -1.27 -1.87 -1.50
PRC 3.33 0.00 -4.00 -50.00
Hong Kong, China 0.33 0.00 0.00 0.00
India 8.31 0.00 0.00 0.00
Korea, Rep. of 1.51 0.00 0.00 -0.40
Malaysia 3.21 0.00 -0.50 24.90
Philippines 2.78 0.00 7.42 35.31
Singapore 1.25 0.00 -0.30 -53.70
Thailand 1.22 0.00 0.00 0.00
basis point change fromLatest
ClosingMarkets
3.56
0.30
-1.87
-4.00
0.00
0.00
0.00
-0.50
7.42
-0.30
0.00
Previous
Day*
Previous
Week*1-Jan-18*
US 2.87 -3.46 2.37 46.95
EU 0.71 -5.80 -3.90 27.90
Japan 0.06 -0.80 -0.70 1.10
PRC 4.09 0.00 -1.00 7.00
Hong Kong, China 2.04 0.00 -4.20 20.40
India 7.58 0.60 8.90 24.20
Indonesia 6.43 0.00 5.30 10.70
Korea, Rep. of 2.75 0.00 -1.50 28.50
Malaysia 4.02 0.00 6.70 10.40
Philippines 6.71 0.00 17.57 101.03
Singapore 2.29 0.00 4.35 28.88
Thailand 2.40 0.00 -2.00 7.50
Viet Nam 4.36 0.00 0.80 -84.20
Markets
basis point change fromLatest
Closing
2.37
-3.90
-0.70
-1.00
-4.20
8.90
5.30
-1.50
6.70
17.57
4.35
-2.00
0.80

…………………………………………………………………………………………………………………………………
…………………………………………………………………………………………………………………………….......
asianbondsonline.adb.org
asiandbonsonline.adb.org
DEBT HIGHLIGHTSASIANBONDSONLINE
6
Tip: Zoom-in on the table using the Acrobat zoom tool
Benchmark Yield Curves – LCY Government Bonds
Indonesia
EU = European Union, LCY = local currency US = United States.
Source: Based on data from Bloomberg.
Viet Nam Thailand Singapore
Philippines Malaysia Korea, Republic of
Hong Kong, China China, People’s Rep. of
Japan EU US
1.8
2.3
2.8
3.3
0 4 8 12 16 20 24 28 32
Yie
ld (%
)
Time to maturity (years)
16-Feb-18 09-Feb-18 02-Feb-18
-1.0
-0.5
0.0
0.5
1.0
1.5
2.0
0 5 10 15 20 25 30
Yie
ld (%
)
Time to maturity (years)
16-Feb-18 09-Feb-18 02-Feb-18
-0.4
0.0
0.4
0.8
1.2
0 4 8 12 16 20 24 28 32 36 40
Yie
ld (%
)
Time to maturity (years)
16-Feb-18 09-Feb-18 02-Feb-18
3.2
3.5
3.8
4.1
4.4
0 1 2 3 4 5 6 7 8 9 10 11 12 13 14 15 16
Yie
ld (%
)
Time to maturity (years)
16-Feb-18 09-Feb-18 02-Feb-18
0.0
0.4
0.8
1.2
1.6
2.0
2.4
0 2 4 6 8 10 12
Yie
ld (%
)
Time to maturity (years)
16-Feb-18 09-Feb-18 02-Feb-18
4.5
5.0
5.5
6.0
6.5
7.0
7.5
0 3 6 9 12 15 18 21 24 27 30 33
Yie
ld (%
)Time to maturity (years)
16-Feb-18 09-Feb-18 02-Feb-18
1.4
1.7
2.0
2.3
2.6
2.9
0 2 4 6 8 10 12 14 16 18 20 22
Yie
ld (%
)
Time to maturity (years)
16-Feb-18 09-Feb-18 02-Feb-18
2.8
3.3
3.8
4.3
4.8
0 2 4 6 8 10 12 14 16 18 20 22
Yie
ld (%
)
Time to maturity (years)
16-Feb-18 09-Feb-18 02-Feb-18
1.8
2.8
3.8
4.8
5.8
6.8
7.8
0 3 6 9 12 15 18 21
Yie
ld (%
)
Time to maturity (years)
16-Feb-18 09-Feb-18 02-Feb-18
1.0
1.5
2.0
2.5
3.0
0 3 6 9 12 15 18 21 24 27 30
Yie
ld (%
)
Time to maturity (years)
16-Feb-18 09-Feb-18 02-Feb-18
1.0
1.5
2.0
2.5
3.0
3.5
0 2 4 6 8 10 12 14 16 18 20 22 24 26 28 30 32
Yie
ld (
%)
Time to maturity (years)
16-Feb-18 09-Feb-18 02-Feb-18
2.5
3.5
4.5
5.5
0 1 2 3 4 5 6 7 8 9 10 11 12 13 14 15 16
Yie
ld (%
)
Time to maturity (years)
16-Feb-18 09-Feb-18 02-Feb-18

…………………………………………………………………………………………………………………………………
…………………………………………………………………………………………………………………………….......
asianbondsonline.adb.org
asiandbonsonline.adb.org
DEBT HIGHLIGHTSASIANBONDSONLINE
7
Tip: Zoom-in on the table using the Acrobat zoom tool
2- versus 10- Year Yield Spread Chart
EU = European Union, US = United States.
Source: Based on data from Bloomberg LP.
0 25 50 75 100 125 150 175 200 225 250 275
US
EU
Japan
China, People's Rep. of
Hong Kong, China
Indonesia
Korea, Rep. of
Malaysia
Philippines
Singapore
Thailand
Viet Nam
basis points
16-Feb-18
9-Feb-18
2-Feb-18

…………………………………………………………………………………………………………………………………
…………………………………………………………………………………………………………………………….......
asianbondsonline.adb.org
asiandbonsonline.adb.org
DEBT HIGHLIGHTSASIANBONDSONLINE
8
Tip: Zoom-in on the table using the Acrobat zoom tool
Policy Rate versus Inflation Rate
Hong Kong, China China, People’s Rep. of
Thailand Viet Nam
Indonesia
The PRC uses the 1-year lending rate as one of its policy
rates.
Source: Bloomberg LP.
The Hong Kong Monetary Authority maintains a Discount
Window Base Rate.
Source: Bloomberg LP.
Bank Indonesia shifted its policy rate to the 7-day reverse
repo rate effective 19 August 2016.
Source: Bloomberg, LP.
Korea, Republic of Malaysia Philippines
The Bank of Korea shifted its policy rate from the overnight
repurchase (repo) rate to the 7-day repo rate in March 2008.
Source: Bloomberg LP.
Bank Negara Malaysia uses the overnight policy rate
(OPR) as its policy rate.
Source: Bloomberg LP.
Bangko Sentral uses the Philippine overnight reverse
repurchase agreement rate as one of its policy instruments.
Source: Bloomberg LP.
The Bank of Thailand replaced the 14-day repurchase
rate with the 1-day repurchase rate in January 2007 as
its policy rate.
Source: Bloomberg LP.
The State Bank of Viet Nam uses a benchmark prime
lending rate as its policy rate.
Source: Bloomberg LP.
1.50
4.35
0
1
2
3
4
5
6
7
Jan-15 Jun-15 Nov-15 Apr-16 Oct-16 Mar-17 Aug-17 Feb-18
Inflation Rate
1-year Lending Rate
4.00
3.00
0
1
2
3
4
5
Jan-15 Jun-15 Nov-15 Apr-16 Oct-16 Mar-17 Aug-17 Feb-18
Overnight Reverse Repo Rate
Inflation Rate
1.70
1.75
-1
0
1
2
3
4
5
Jan-15 Jun-15 Nov-15 Apr-16 Oct-16 Mar-17 Aug-17 Feb-18
HKMA Base Rate
Inflation Rate
1.00
1.50
0
1
2
3
Jan-15 Jun-15 Nov-15 Apr-16 Oct-16 Mar-17 Aug-17 Feb-18
c
7-day Repo Rate
Inflation Rate
0.68
1.50
-2
-1
0
1
2
3
Jan-15 Jun-15 Nov-15 Apr-16 Oct-16 Mar-17 Aug-17 Feb-18
1-day Repo Rate
Inflation Rate
3.50
3.25
0
1
2
3
4
5
6
Jan-15 Jun-15 Nov-15 Apr-16 Oct-16 Mar-17 Aug-17 Feb-18
Overnight Policy Rate
Inflation Rate
2.65
6.25
0
2
4
6
8
Jan-15 Jun-15 Nov-15 Apr-16 Oct-16 Mar-17 Aug-17 Feb-18
Refinancing Rate
Inflation Rate
3.25
4.25
2
3
4
5
6
7
8
Jan-15 Jun-15 Nov-15 Apr-16 Oct-16 Mar-17 Aug-17 Feb-18
Inflation Rate
7-day Reverse Repo Rate

…………………………………………………………………………………………………………………………………
…………………………………………………………………………………………………………………………….......
asianbondsonline.adb.org
asiandbonsonline.adb.org
DEBT HIGHLIGHTSASIANBONDSONLINE
9
Tip: Zoom-in on the table using the Acrobat zoom tool
Credit Default Swap Spreads and Exchange Rate Indexes
Credit Default Swap Spreads — Senior 5-Year*
Exchange Rate Indexes (vis-à-vis USD, 2 January 2007=100)
* In USD and based
on sovereign bonds
Source: Bloomberg
Mid
sp
rea
d in
ba
sis
po
ints
Source: AsianBondsOnline calculations
based on Bloomberg data.
0
50
100
150
200
250
300
350
Jan-13 Aug-13 Apr-14 Nov-14 Jul-15 Mar-16 Oct-16 Jun-17 Feb-18
China, People'sRep. of
Indonesia
Korea, Rep. of
Japan
Malaysia
Philippines
Thailand
Viet Nam
50
60
70
80
90
100
110
120
130
Jan-13 Aug-13 Apr-14 Nov-14 Jul-15 Mar-16 Oct-16 Jun-17 Feb-18
China, People'sRep. of
Indonesia
Korea, Rep. of
Malaysia
Philippines
Thailand
Singapore
Viet Nam

…………………………………………………………………………………………………………………………….......
asianbondsonline.adb.org
asiandbonsonline.adb.org
DEBT HIGHLIGHTSASIANBONDSONLINE
…………………………………………………………………………………………………………………………………
10
Tip: Zoom-in on the table using the Acrobat zoom tool
Selected Debt Security Issuances (12 — 16 February 2018)
HK 13-Feb 91-day Exchange Fund Bills 0.61 43.32 43.32
182-day Exchange Fund Bills 0.69 10.00 10.00
2-year Exchange Fund Notes 1.18 1.31 0.12 0.12
ID 13-Feb 91-day Treasury Bills 4.08 5,000.00
364-day Treasury Bills 4.97 5,000.00
10-year Treasury Bonds 6.37 6.13 4,300.00
15-year Treasury Bonds 6.82 6.63 2,750.00
20-year Treasury Bonds 7.13 7.50 3,950.00
JP 14-Feb 5-year Japanese Government Bonds -0.09 0.10 2,200.00 2,480.80
15-Feb 3-month Treasury Discount Bills -0.16 4,400.00 4,439.92
16-Feb 1-year Treasury Discount Billds -0.16 2,300.00 2,199.98
KR 12-Feb 5-year Korea Treasury Bonds 2.54 2.00 700.00 700.00
1-year Monetary Stabilization Bonds 1.90 1.90 910.00 910.00
PH 12-Feb 91-day Treasury Bills 2.67 9.00 7.39
182-day Treasury Bills 2.85 6.00 5.19
364-day Treasury Bills 3.04 5.00 1.59
SG 13-Feb 25-day MAS Bills 0.98 2.00 2.00
81-day MAS Bills 0.78 5.90 5.90
TH 12-Feb 28-day Treasury Bills 1.14 10.00 5.43
91-day Bank of Thailand Bonds 1.16 30.00 30.00
182-day Bank of Thailand Bonds 1.29 30.00 30.00
294-day Bank of Thailand Bonds 1.39 60.00 60.00
14-day Bank of Thailand Bonds 1.14 20.00 20.00
LCY = local currency, MAS = Monetary Authority of Singapore.
Sources: Local market sources and Bloomberg, LP.
17,000.00
Amount Issued
(LCY billion)Markets
Auction
Date Type of Securi ty
Average
Y ield (%)
Coupon (%) Amount Offered
(LCY billion)
…………………………………………………………………………………………………………………………….......
asianbondsonline.adb.org
asiandbonsonline.adb.org
DEBT HIGHLIGHTSASIANBONDSONLINE
11 …………………………………………………………………………………………………………………………………
Tip: Zoom-in on the table using the Acrobat zoom tool
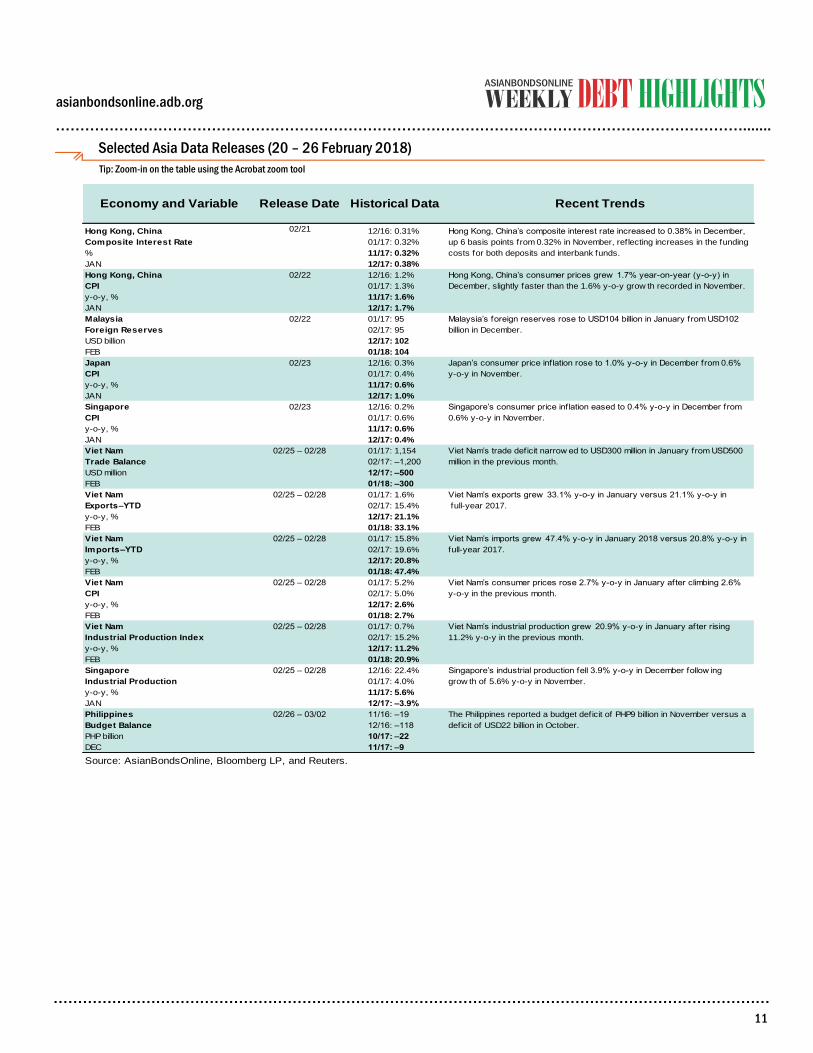
Selected Asia Data Releases (20 – 26 February 2018)
Economy and Variable Release Date Historical Data Recent Trends
Hong Kong, China 12/16: 0.31%
Composite Interest Rate 01/17: 0.32%
% 11/17: 0.32%
JAN 12/17: 0.38%
Hong Kong, China 12/16: 1.2%
CPI 01/17: 1.3%
y-o-y, % 11/17: 1.6%
JAN 12/17: 1.7%
Malaysia 01/17: 95
Foreign Reserves 02/17: 95
USD billion 12/17: 102
FEB 01/18: 104
Japan 12/16: 0.3%
CPI 01/17: 0.4%
y-o-y, % 11/17: 0.6%
JAN 12/17: 1.0%
Singapore 12/16: 0.2%
CPI 01/17: 0.6%
y-o-y, % 11/17: 0.6%
JAN 12/17: 0.4%
Viet Nam 01/17: 1,154
Trade Balance 02/17: –1,200
USD million 12/17: –500
FEB 01/18: –300
Viet Nam 01/17: 1.6%
Exports–YTD 02/17: 15.4%
y-o-y, % 12/17: 21.1%
FEB 01/18: 33.1%
Viet Nam 01/17: 15.8%
Imports–YTD 02/17: 19.6%
y-o-y, % 12/17: 20.8%
FEB 01/18: 47.4%
Viet Nam 01/17: 5.2%
CPI 02/17: 5.0%
y-o-y, % 12/17: 2.6%
FEB 01/18: 2.7%
Viet Nam 01/17: 0.7%
Industrial Production Index 02/17: 15.2%
y-o-y, % 12/17: 11.2%
FEB 01/18: 20.9%
Singapore 12/16: 22.4%
Industrial Production 01/17: 4.0%
y-o-y, % 11/17: 5.6%
JAN 12/17: –3.9%
Philippines 11/16: –19
Budget Balance 12/16: –118
PHP billion 10/17: –22
DEC 11/17: –9
Source: AsianBondsOnline, Bloomberg LP, and Reuters.
02/25 – 02/28 Viet Nam’s imports grew 47.4% y-o-y in January 2018 versus 20.8% y-o-y in
full-year 2017.
02/25 – 02/28 Viet Nam’s consumer prices rose 2.7% y-o-y in January after climbing 2.6%
y-o-y in the previous month.
02/23 Japan’s consumer price inflation rose to 1.0% y-o-y in December from 0.6%
y-o-y in November.
02/23 Singapore’s consumer price inflation eased to 0.4% y-o-y in December from
0.6% y-o-y in November.
02/26 – 03/02 The Philippines reported a budget deficit of PHP9 billion in November versus a
deficit of USD22 billion in October.
02/25 – 02/28 Viet Nam’s trade deficit narrow ed to USD300 million in January from USD500
million in the previous month.
02/25 – 02/28 Viet Nam’s exports grew 33.1% y-o-y in January versus 21.1% y-o-y in
full-year 2017.
02/25 – 02/28 Viet Nam’s industrial production grew 20.9% y-o-y in January after rising
11.2% y-o-y in the previous month.
02/25 – 02/28 Singapore’s industrial production fell 3.9% y-o-y in December follow ing
grow th of 5.6% y-o-y in November.
Hong Kong, China’s composite interest rate increased to 0.38% in December,
up 6 basis points from 0.32% in November, reflecting increases in the funding
costs for both deposits and interbank funds.
Hong Kong, China’s consumer prices grew 1.7% year-on-year (y-o-y) in
December, slightly faster than the 1.6% y-o-y grow th recorded in November.
02/21
02/22
02/22 Malaysia’s foreign reserves rose to USD104 billion in January from USD102
billion in December.

…………………………………………………………………………………………………………………………………
…………………………………………………………………………………………………………………………….......
asianbondsonline.adb.org
asiandbonsonline.adb.org
Disclaimer: AsianBondsOnline Newsletter is available to users free of charge. ADB provides no warranty or undertaking of any kind with respect to the information and materials
found on, or linked to, the AsianBondsOnline Newsletter. ADB accepts no responsibility for the accuracy of the material posted or linked to in the publication, or the information
contained therein, or for any consequences arising from its use, and does not invite or accept reliance being placed on any material or information so provided. Views expressed in
articles marked with AsianBondsOnline are those of the authors and not ADB. This disclaimer does not derogate from, and is in addition to, the general terms and conditions
regarding the use of the AsianBondsOnline website, which also apply.
DEBT HIGHLIGHTSASIANBONDSONLINE
12
Tip: Click on link to open a new browser (Acrobat Reader 8); for older versions right-click to open a new browser)
News Articles: Sources for Further Reading
GDP Growth Decelerates to 0.1% q-o-q in Japan, 5.9% y-o-y in
Malaysia, and 3.6% y-o-y in Singapore in Q4 2017
Quarterly Estimates of GDP for October - December 2017 (First Preliminary Estimates)
Cabinet Office Japan (14 February 2018)
Gross Domestic Product Fourth Quarter 2017
Department of Statistics Malaysia (14 February 2018)
Economic and Financial Developments in Malaysia in the Fourth Quarter of 2017
Bank Negara Malaysia (14 February 2018)
Malaysian economy grew 5.9% last year, slower pace seen this year
The Star (15 February 2018)
MTI Expects GDP Growth in 2018 to Moderate but Remain Firm
Ministry of Trade and Industry (14 February 2018)
Bank Indonesia Maintains Reverse Repo Rate at 4.25%; BOT Keeps
Policy Rate Unchanged at 1.50%
Bank Indonesia Holds Policy Rate: Economic Stability Maintained, Recovery Momentum Continues
Bank Indonesia (15 February 2018)
Monetary Policy Committee’s Decision 1/2018
Bank of Thailand (14 February 2018)
MPC keeps policy rate unchanged at 1.5%
Bangkok Post (14 February 2018)
Policy rate unchanged to foster growth
Bangkok Post (15 February 2018)
Indonesia’s Trade Deficit Widens in January; Singapore’s NODX
Rise in January
January 2018, Indonesia's export reached US $ 14.46 billion and Indonesia's import value reached US $ 15.13 billion
Statistics Indonesia (15 February 2018)
Indonesia Posts $670m Trade Deficit in January, Highest Since April 2014
Jakarta Globe (15 February 2018)
Singapore’s External Trade
International Enterprise Singapore (15 February 2018)
Malaysia’s Current Account Surplus Expands in Q4 2017 and Full-
Year 2017
Quarterly Balance of Payments, Fourth Quarter 2017
Department of Statistics Malaysia (14 February 2018)
Net Foreign Bond Investment in the Republic of Korea Turns
Positive in January; Philippine Net Portfolio Investment Inflows Fall
in January
Foreign Investors’ Stock and Bond Investment, January 2018
Financial Supervisory Service (13 January 2018)
Foreign portfolio investment transactions yield net inflows in January
Bangko Sentral ng Pilipinas (15 February 2018)
Philippine Remittances Rise in December
Personal Remittances Exceed 4.0 Percent Growth Projection for 2017; Full-Year Level Reaches US$31.3 Billion
Bangko Sentral ng Pilipinas (15 February 2018)
BSP Reduces Reserve Requirement Ratios of Banks
Monetary Board Approves Operational Adjustment in Reserve Requirements
Bangko Sentral ng Pilipinas (15 February 2018)