urbanization in sub-saharan africa - diva portal538141/fulltext01.pdf · urbanization, it is in...
TRANSCRIPT

Maria Nordhag
Bachelor thesis
Peace & Development studies
Linneaus University
June 2012
Urbanization in sub-Saharan Africa
A Study of Contemporary Urban Population Growth in a Less Developed Region
Abstract
This study investigates the contemporary urbanization process of sub-Saharan
Africa. The region is predicted to experience a surge in urban population
growth the forthcoming decades, yet why and how this is happening is not very
clear. Theory often considers urbanization to be a part of a modernization
process where people migrate from rural areas to urban. But depictions of
reality suggest that rural-to-urban migration might be less significant than
previously thought, and neither is it given that urbanization causes prosperity
in sub-Saharan Africa.
This thesis tries to complement the gap of knowledge regarding the
mechanisms of urbanization in sub-Saharan Africa. Statistical data is organized
and assembled by using the structured, focused comparison method and then
analyzed in order to create an understanding of urbanization and urban
population growth in this particular region.
The result of this study suggests that the mechanisms for urban population
growth change over time. Urban population growth is often thought to be
driven by rural-to-urban migration. However, nowadays there is a correlation
between urban population growth and population increase, which did not exist
a couple of decades ago.
It is clear that urbanized countries are, typically, more advanced regarding
economic growth, but it is unsure whether this factor affects socio-economic
development.
The findings underscore the vast complexity of urbanization and urban
population growth, as well as the heterogeneity of sub-Saharan Africa. Yet
there is potential for a new theoretical framework that can provide explanations
to the processes sub-Saharan Africa is expected to undergo.
Keywords: Urbanization, Urban Population Growth, sub-Saharan Africa,
Structured, Focused Comparison.

Table of contents
1. Introduction p. 1
1.1 Research problem p. 1
1.2 Purpose of the study p. 2
1.3 Relevance of the study p. 3
1.4 Outline of Method p. 3
1.5 Delimitations and Limitations p. 4
1.5.1 Delimitations p. 4
1.5.2 Limitations p. 5
1.6 Disposition p. 5
2. Literature overview p. 6
2.1 Two major theories p. 6
2.1.1 The Lewis two-sector model p. 6
2.1.1.1 Criticism against the Lewis two-sector model p. 7
2.1.2 The Harris-Todaro model on migration and the p. 7
Todaro migration model
2.1.2.1 Criticism against the Harris-Todaro model(s) p. 8
2.2 Urbanization in less developed countries p. 9
2.2.1 Different urbanization processes? p. 9
2.2.2 Urbanization and sub-Saharan Africa p. 11
2.2.2.1 The consequences of colonialism p. 11
2.2.2.2 Sub-Saharan Africa’s urban areas today p. 11
2.2.3 Where does this leave us? p. 13
3. Methodology p. 14
3.1 Structured, focused comparison p. 14
3.1.1 The research objective p. 15
3.1.2 The research strategy p. 15
3.1.3 The cases p. 16
3.1.4 Describing the variance p. 18
3.1.5 The questions p. 19
3.1.6 The consequences of using the structured, focused p. 20
comparison method
4. Findings p. 21
4.1 The focus countries and the control countries p. 21
4.1.1 The geographical location p. 22
4.2 Evaluation of tables split in quintiles p. 23
4.3 Comparing the focus countries and the control group p. 28
4.4 The timeline charts p. 32
4.4.1 Urban population, % of total, years 1960-2009 p. 32
4.4.2 Population, total, years 1960-2009 p. 33
4.4.3 Total fertility rate, births per woman, years 1960-2009 p. 33
4.4.4 Life expectancy, at birth (in years) 1960-2009 p. 33
4.4.5 Labor participation rate, % of total population, years 1980-2009 p. 34
4.5 Summary of findings p. 34
5. Analysis p. 36
5.1 Urban population in sub-Saharan Africa p. 36
5.1.1 Urban population extent throughout the years p. 36
5.1.2 Does the geographical location matter? p. 38
5.2 The connection between urban population and p. 38
population growth
5.2.1 Will the populations continue to increase? p. 40
5.3 Urban population growth and economic growth p. 42
5.3.1 Urban population and proxies connected to p. 44
economic growth
5.3.2 Why do the urban focus countries excel at p. 45
economic development?
5.3.3 The Lewis two-sector model and The Harris-Todaro p. 46
model on migration
5.4 The socio-economic situation p. 48
5.4.1 HDI p. 48
5.4.2 Life expectancies, mortality rates and more p. 49
5.5 Summary of analyses p. 51
5.5.1 What has urbanization lead to? p. 51
5.5.2 The contemporary mechanics of urban population growth p. 53

6. Conclusion p. 54
6.1 The research questions p. 54
6.2 What could have been done differently? p. 57
6.3 Future studies of urbanization and urban population growth p. 58
6.4 Concluding remarks p. 58
References p. 60
Appendix I p. 64
Appendix II p. 71
Appendix III p. 92

List of Abbreviations
GDP Gross Domestic Product
GNI Gross National Income
HDI Human Development Index
POPG Population growth (annual %)
RPG Rural population growth (annual %)
UNDP United Nations Development Program
UNFPA United Nations Population Fund
UPG Urban population growth (annual %)
UP% Urban population (% of total)
UNSD United Nations Statistics Division
WDI & GDF World Development Indicators & Global Development Finance
List of figures
Figure 4.1 Urban population, % of total, year 2009 p. 21
Figure 4.2 The geographical location of the focus countries p. 22
Figure 4.3 Example of total fertility rate timelines (1960-2009) p. 33
Figure 5.1 Urban population (%) of total, 2009: all of sub-Saharan Africa p. 36
Figure 5.2 Rural- and urban population growth (%) for the rural focus countries p. 39
Figure 5.3 Rural- and urban population growth (%) for the urban focus countries p. 39
Figure 5.4 Total Fertility Rate (births per woman) for the rural focus countries p. 41
Figure 5.5 Total Fertility Rate (births per woman) for the urban focus countries p. 41
Figure 5.6 Botswana: Urban population and GDP/cap p. 43
Figure 5.7 Gambia: Urban population and GDP/cap p. 43
Figure 5.8 Gabon: Urban population and GDP/cap p. 43
Figure 5.9 Cameroon: Urban population and GDP/cap p. 43
Figure 5.10 Burundi: Urban population and GDP/cap p. 43
Figure 5.11 Niger: Urban population and GDP/cap p. 43
Figure 5.12 Burkina Faso: Urban population and GDP/cap p. 44

Figure 5.13 Uganda: Urban population and GDP/cap p. 44
Figure 5.14 Labor participation rate (%) 2009: The urban-, rural- p. 47
and control countries
Figure 5.15 HDI 2009: Ranked from highest to lowest: The urban-, rural- p. 49
and control countries
Figure 5.16 Urban Population (% of total) 2009 and Prevalence of HIV 2009 p. 50
(ranked from highest to lowest Prevalence of HIV)
List of tables
Table 3.1 The proxies of this study p. 19
Table 3.2 Example of tables p. 20
Table 4.1 Urban population, % of total, year 2009: the urban- and rural p. 21
focus countries
Table 4.2 The control countries p. 22
Table 4.3 Quintile positioning of the urban focus countries p. 24
Table 4.4 Quintile positioning of the rural focus countries p. 25
Table 4.5 Quintile positioning of the control countries p. 26
Table 4.6 Average quintile positioning for the focus countries p. 29 and the control group
Table 5.1 Values for urban population (% of total), 2009 and 1989 p. 36
Table 5.2 Coefficient of determination (r2): urban population (% of total), p. 37
different years
Table 5.3 Coefficient of determination (r2): urban population (% of total) p. 37
Table 5.4 Coefficient of determination (r2): Urban- and total population growth p. 39
(annual %)
Table 5.5 Coefficient of determination (r2): Urban- and rural population growth p. 40
(annual %)
Table 6.1 Table 6.1 Countries with the highest Urban Population Growth p. 58
(annual %) 2009 and 1970

1
1. Introduction
Urbanization and urban population growth is nowadays taken for granted and even expected. It
happened in Europe and in North America during the industrialization era, and it is now occurring in
many less developed countries. The region of sub-Saharan Africa is expected to rapidly increase its
urban population the forthcoming decades (State of the World Population, 2007, p. 8), and while
some theories, such as the Lewis two-sector model, predicts economic development through
urbanization, it is in fact the slum quarters that experience the most urban population growth (White
et al, 2008, p. 307).
This study sets out to explore urban population growth and urbanization in sub-Saharan Africa with
the intent to better understand the processes behind urban population growth as well as some of the
consequences of urbanization in a less developed region.
1.1 Research problem
Sub-Saharan Africa is often referred to as the least urbanized region in the world (White et al, 2008,
p. 301). Yet the region’s total urban population is predicted to expand greatly during the forthcoming
20 years (State of the World Population, 2007, p. 8), and it is doubtful whether the region’s urban
areas can handle the explosive growth (White et al, 2008, p. 301). There is dissonance in the
theoretical debate about urbanization and urban population growth in less developed countries. On
the one hand, there are general theories designed to explain the mechanisms and outcome of urban
population growth. On the other hand, some literature suggests that urbanization and urban
population growth and their consequences are complex processes affected by various mechanisms, to
the degree that the use of any theory is questioned.
Classic notions of urbanization mean that at one point or another, an economy transforms from an
agrarian society into an industrialized, modern society with higher living standards as a result. The
Lewis two-sector model is a prime example. The model assumes that the agricultural sector of a
country has a surplus work force, and that people will readily migrate to urban areas as the wages are
higher there, which then enhances an industrialization process (Todaro and Smith, 2009, p. 115).
This is more or less what happened in Europe and North America (ibid, 2009, p. 118).
In the same line of thinking, some scholars argue that no country is as prosperous as those
who have gone through a thorough urbanization process and thus, it is an important part of fuelling
economic growth also for less developed countries (Annez and Buckley, 2009, p. 1). In this light, it
is not strange why the process of urbanization and urban population growth often brings about a
positive connotation. But can we really expect a less developed region like sub-Saharan Africa to
follow the same process, with similar results, as Europe and North America did back in the days?
The mechanisms behind urban population growth and urbanization are not very clear. Aside

2
from the Lewis two-sector model, there is also, among others, the Harris-Todaro model on migration
which explains that urban population growth is largely caused by rural-to-urban migration driven by
perceived income gains, rather than actual (Todaro and Smith, 2009, pp. 344-345). But, then, there
are also studies suggesting that rural-to-urban migration might not be the major driving force behind
urban population growth at all, but, on the contrary, natural increase (White et al, 2008, p. 302).
In fact, it is not even certain that such general theories are at all applicable on sub-Saharan
Africa. First of all, some literature stresses that, overall, less developed countries face a much
different urbanization process than Europe and North America did (Henderson, 2002, pp. 89-90;
State of the World Population 2007, p. 7, box 2). Secondly, it is argued that the preconditions for
sub-Saharan African urbanization were set already during the colonization era which has several
implications on the current urbanization process (Bocquier, 2004, p. 134; Boserup, 1985, pp. 384-
385). Finally, in sub-Saharan Africa especially, it is not entirely clear as to who is an urban resident
and who is not; seasonal and forced migrations tend to blur the image of population flows (ibid, p.
310, 302).
The problem, then, is multifaceted. Sub-Saharan Africa is about to experience rapid urban
population growth, and it is unsure whether the region’s urban areas can handle the massive increase.
Yet, despite being a thoroughly researched subject, there seems to be no theoretical consensus that
can explain the mechanisms of urban population growth and urbanization in sub-Saharan Africa, and
theories are contradicted by depictions of reality. In this study, I will take a deep look into the urban
population growth and urbanization of sub-Saharan Africa in order to try to understand what is really
going on.
1.2 Purpose of the study
The purpose of this study is to investigate the processes of urbanization and urban population growth
in sub-Saharan Africa in order to better understand what mechanisms lie behind. I will try to
untangle some of the uncertainties of, firstly; the mechanisms of urban population growth and
urbanization, and secondly; urban population growth’s and urbanization’s impact on socio-economic
factors, if there are any.
As a first step, I will try to establish whether urban population growth in sub-Saharan Africa
is a process which characteristics are shared among the countries of the region or if it is highly
individual. I wish to find out how coherent this region really is when it comes to urban population
growth and urbanization, and the dynamics behind it.
Secondly, I will elaborate upon the socio-economic consequences of urbanization and urban
population growth. I will take a deep look into factors that can potentially indicate socio-economic
statuses from the point of departure of urbanization.
Finally, combining these questions, I wish to briefly theorize the matter by trying to
understand the degree of similarity of urban population growth and urbanization and its

3
consequences throughout the region: can urbanization and urban population growth be generalized
for so many countries, or is a narrower scope preferable?
In order to deal with these matters, research questions have been outlined:
In sub-Saharan Africa,
o … what does the distribution of urban population look like for the different countries?
o … are the countries with the more urban population generally better off in terms of socio-
economic development than countries with less urban population?
o … what can be said about the mechanisms of urban population growth and urbanization, and,
taken together, will the answer to these questions contribute to an explanation of to what
extent the mechanisms of urbanization and urban population growth can be generalized for
the region?
1.3 Relevance of the Study
First of all, this research will help understand the process of urbanization and urban population
growth. It will indicate to what extent urbanization is following a homogenous pattern or if it is a
rather heterogenic process.
Secondly, this thesis will evaluate the use of theory and generalizations in this particular
issue. Theories were made to simplify complex matters and generate plausible predictions as for the
future. Since theory is applied in so many corners of the scientific and academic world, it is
important to evaluate the applicability of theory even in the scope of urbanization and urban
population growth. It would also help future demographic estimations and predictions.
Thirdly, urbanization brings about different connotations; necessary for- or as a consequence
of economic development on the one hand, but potentially harmful for individuals on the other hand.
Since this thesis will investigate the socio-economic state of sub-Saharan Africa from the perspective
of urbanization, it might help revealing some of the consequences the expected massive urban
population increase might bring about.
1.4 Outline of Method
In order to try to untangle some of the complexities regarding urban population growth and
urbanization in sub-Saharan Africa, I will perform a qualitative study based on statistical data, by
analyzing statistics thoroughly in trying to gain understanding. Because it is not entirely sure what to
look for in terms of urban population growth mechanisms, I will approach the matter from an
inductive point of departure. This allows me to approach data in a flexible way which then boils
down to a somewhat theorized conclusion; namely, to what degree the mechanisms of urban
population growth and urbanization can be generalized.

4
I will use the method of structured, focused comparison, which is a theory-oriented method
based on case studies. The core of structured, focused comparison is to gather and assemble data
systematically so that it can be compared between cases (George and Bennett, 2005, p. 67). I believe
that this method is the optimal for the type of problem presented in this study, because the problem
in itself is very complex and is thought to have many components. Therefore, a very structured and
systematic method might help me understand the mechanisms of urbanization and urban population
growth. Furthermore, the research questions are outlined in such a way that they imply comparison
between countries with a high degree of urbanization and countries with a low degree. In order to
find out what the urban population distribution looks like, and whether urbanized countries are better
off in terms of socio-economic development, I need to contrast cases (countries) to each other.
Structured, focused comparison then helps me maintain a systematic focus and ensure that
comparison between cases is as correct as it can get.
In order to complement findings, I will also perform correlation analyses with the coefficient
of determination (r2).
My study will be based on statistical data, mainly gathered from the World Bank’s databank.
In choosing to rely on statistical data, I hope to be able to cover as many aspects of urbanization and
urban population growth as possible. Statistics have the advantage of being relatively available,
which means that I can process plenty of data for several time periods. The strategy is to compile
statistical data according to the structured, focused comparison method and then try to understand
the urbanization process of sub-Saharan Africa.
1.5 Delimitations and Limitations
1.5.1 Delimitations
It is necessary to establish some boundaries to this thesis.
First of all, my study concerns sub-Saharan Africa only. This region is chosen partly because
of its unique composition of overall low urbanization but expected rapid urban population growth,
but also because of its reputation of being “poor”. In this thesis, I will use a definition of sub-
Saharan Africa from the United Nations Statistics Division (UNSD) but some countries have been
excluded. The motivation of this as well as excluded countries are presented in Appendix I.
Because some variables are not available for all years, I had to set a time scope. Some
variables were available from year 2011 the latest, but far from all. In order to gain consistency and
cover as many variables as possible, I decided to not include any data past year 2009. On the other
side of the scale, data will range as far back as to 1960. Even though no data is more recent than
2009, I will sometimes use expressions like “contemporary” and “nowadays” for the sake of
convenience.
While this thesis claims to concern all of sub-Saharan Africa, I will establish two groups of
countries that will serve as the focus. The two groups will represent those countries with the most
and the least urban population (on a national level) and their status of other factors will be the tool of

5
comparison. However, the data used in this thesis includes all the other countries and the result of
these countries will also be presented in the appendices. The other countries will also contribute to
correlation analyses as a larger pool of samples generates more valid results.
Concerning the reference to literature in this thesis, I decided to present only two
theories/models (Harris-Todaro/Lewis two-sector model) even though urbanization is such a
thoroughly researched process. This is, firstly, because throughout my research, I have come across
these two theories very often and they appear to constitute much of the core of urbanization research.
Secondly, the intent of the thesis is to investigate and try to understand the incoherence between
literature and reality, not to validate or refute theories.
1.5.2 Limitations
This thesis will investigate plenty of variables connected to urbanization and urban population
growth. However, it is impossible to cover all variables that potentially impact said subjects. Several
relevant variables turned out not to have data covering enough sub-Saharan African countries, in
which case these variables were excluded because comparisons could not be made.
In a similar manner, not all variables were available from year 1960. Therefore, some
variables will lack a historical scope.
1.6 Disposition
Chapter 2 presents a literature overview that further explains the dissonance and incoherence
discussed in the research problem. Chapter 3 concerns methodology and outlines the research made
in this thesis in accordance to the structured, focused comparison method. Chapter 4 contains the
findings in accordance to the method of structured, focused comparison. In Chapter 5, analyses of
the data from the foregoing chapter are presented, along with correlation analyses. Chapter 6 is the
concluding chapter where concise answers to the research questions will be stated as well as various
remarks.

6
2. Literature overview
The topic of urbanization and urban population growth is very vast, and much has been written
throughout the years. This chapter will start off with a presentation of two well-known theories with
a universal reach, and then I will assess literature suggesting that theories of urbanization need a
narrower approach.
2.1 Two major theories
Although many theories and variations of theories have been outlined throughout the years, I have
decided to bring up two that are often cited and referred to in relevant literature. They are both
examples of the common notion that economic development and urbanization are interlinked and
dependent on one another. Both theories are concerned with the origin of urbanization- and the rural-
to-urban migration process.
2.1.1 The Lewis two-sector model
The Lewis two-sector model was developed by W. Arthur Lewis in an attempt to explain the
dynamics of an “underdeveloped” economy through the migration from the rural sector to the urban
(Todaro and Smith, 2009, p. 115-118). It describes the transformation of a traditional agricultural-
based economy to a modernized, industrialized economy (ibid.).
The theory assumes a rural sector attributed by “surplus labor” which can be readily absorbed
by the modern sector without disrupting the production output on the country-side (Todaro and
Smith, 2009, p. 118). As long as there is surplus labor, the modern sector will provide minimum
wages, although at a higher value than the profits extracted through agricultural labor (which makes
urban labor attractive) (Mishra, 1969, p.879). The theory’s assumption is that the marginal profit
from the modern sector will be reinvested to increase or improve the production which will, in turn,
cause a demand for more employees (ibid). Eventually, urban labor force becomes scarcer as the
surplus labor is gradually absorbed (ibid). This will, then, according to the model, cause higher
wages as it is the necessary precondition for employing agricultural workers that do not qualify as
“surplus labor” (ibid). Eventually, the entire traditional workforce is employed within the modern
sector (now, a modern economy) which will then adopt capital-intensive actions in order to prevent
demands for labor to increase (ibid).
7
2.1.1.1 Criticism against the Lewis two-sector model
Although the Lewis two-sector model appears good in theory, it has been criticized for not being
applicable on today’s less developed countries. In Economic Development by Michael P. Todaro and
Stephen C. Smith, it is claimed that Lewis’ model is merely a reflection of the industrialization
process of the more developed countries (Todaro and Smith, 2009, p. 118). Further, Todaro and
Smith dissect the theory and address the flaws.
As described in the above section, the Lewis two-sector model assumes that accumulated
capital is reinvested in order to improve production. This assumption is questioned by Todaro and
Smith who mean that reinvestments may first of all not happen at all (Todaro and Smith, 2009, p.
118). There is no guarantee that the owner of a company chooses to reinvest, he or she might as well
transfer the profits to off-shore bank accounts, in which case it does not benefit the labor market at
all (ibid). Secondly, reinvestments might be made through labor saving actions, such as purchasing
machinery to replace laborers (ibid). Also in this second case, job seekers will suffer rather than
gain.
Another questionable aspect of the Lewis two-sector model is the assumption of surplus labor
in rural areas (Todaro and Smith, 2009, p. 119). According to Todaro and Smith, it is not at all
certain that there is an available rural workforce ready to accept any job opportunity in the modern
sector (ibid).
Several other examples of flaws are mentioned in Economic Development, but I will not bring them
up here. The intent was to show that although the Lewis two-sector model is popular, it is not
without critique. It is possible that this model inspired Todaro and Harris to develop their model on
rural-to-urban migration; which will be elaborated in the next section.
2.1.2 The Harris-Todaro model on migration and the Todaro migration model
These two models are in fact two forms of the same model; therefore I will go through both of them
at the same time. As described in Economic Development (Todaro and Smith, 2009, p. 345) the
Harris-Todaro model on migration is the equilibrium form of the Todaro migration model.
In 1970, Harris and Todaro published a theory on rural-to-urban migration with the intent to explain
the dynamics of this process. In their view, conventional economic theories on rural-to-urban
migration are not sufficient and often misleading (Harris and Todaro, 1970, p. 126). The authors
claim that former theories assume that migrants have access to waged employment and that this is
the driving force behind migration (ibid.). Meanwhile, Harris and Todaro noticed that reality is
different; plenty of rural-to-urban migrants end up unemployed; a situation that is, they argue, not
covered for by other theories (ibid).
The setting for the Harris-Todaro theory is as follows: there is a rural area where agricultural
goods are produced; either by using the entire labor force or by sacrificing production output by
allowing labor force to migrate in order to seek waged labor (Harris and Todaro, 1970, p. 127).

8
Then, there is an urban area where manufactured goods are produced by waged employees (ibid).
For analytical reasons, it is assumed that the rural migrants remain in touch with their rural family by
means like remittances, while the “original” urban working force has no ties to the rural population
(ibid).
The Harris-Todaro theory argues that migration from rural-to-urban areas will continue as
long as the urban minimum-wage exceeds the profits of working in the agricultural sector (Harris
and Todaro, 1970, p. 127). With this in mind, Harris and Todaro view the reason behind high
unemployment rates as a consequence of state actions. The authors (Harris and Todaro, 1970, p. 129)
argue that in developing countries, minimum wages are often set artificially by institutions in a way
that is not compatible with the free market which then results in high unemployment rates (as
migration occur on the basis of expected wages, not on guarantee of employment). As such, the end
result will be an equilibrium state where the possibility of gaining a higher income through rural-to-
urban migration is offset by the great risk of unemployment (Todaro and Smith, 2009, p. 825).
In Economic Development (2009), Todaro and Smith describe the Todaro Migration Model
more thoroughly, from the point of view of the individual. The focus is on the very conscious rural
resident who is well aware of the conditions of the labor market in cities (Todaro and Smith, 2009, p.
345). As such, before any rural-to-urban migration occurs, the individual carefully calculates the
expected income gain combined with the prospects of getting employed at all, balancing the two
factors against each other (ibid). Even though urban salaries (modern sector salaries) are often
considerably higher than what is achievable on the country side, this is of little value if the chances
of acquiring such an employment are very slim (ibid, p. 347). However, and this is a key issue, if the
urban wages are much higher than the rural income opportunities, then rural-to-urban migration is
likely to occur despite the risk of unemployment, because the chance of receiving a well-paid job
outweighs the risk of being unemployed for a while (ibid, p. 345-349). Therefore, because of the
uneven income distribution, rural-to-urban migration and high unemployment rates may continue to
occur in less developed countries (ibid, p. 349).
2.1.2.1 Criticism against the Harris-Todaro model(s)
In his article Equilibrium and Historical-Structural Perspectives on Migration, Charles H. Wood
refers to a specific model as The Equilibrium Model on Migration. This model encompasses all those
that mean that rural-to-urban migration will eventually reach some sort of equilibrium and cease to
exist; and the Harris-Todaro model is one version of this1 (Wood, 1982, p. 301).
Wood (1982, pp. 303-304) mean that the individual’s rational decision to migrate might in
fact reinforce regional inequalities rather than combat them. Wood refers to Myrdal when he claims
that surplus labor migration does not always adapt to the predicted states of equilibrium (ibid, p.
304). In fact, rural-to-urban migration might continue even if an economy has reached the
1 Although Woods (1982) does not mention it, it is possible that the Lewis two-sector model qualifies for some of
this critique since it is also a theory based on a future equilibrium.

9
equilibrium these models describe (ibid).
According to Wood, these equilibrium-based theories neglect to address another very
important factor: namely, ethics. Since these theories assume that rural-to-urban migration
eventually will regulate itself, this discourages state actions aimed to interfere with the migration
(Wood, 1982, p. 304). Wood means that the lack of control might lead to the exploitation of job
seekers (ibid).
Furthermore, Wood criticizes the notion that people migrate solely because of potential
income gains (Wood, 1982, p. 304-305). He finds it unrealistic that the capitalist settings required for
this kind of process exists in every single country, implying that there might be other underlying
reasons behind rural-to-urban migration (ibid, p. 305). For example, Wood explains that the
development process in itself is constructed in such a way that it might force people away from the
country side (ibid, p. 306). As such, the decision to migrate may not depend solely on the
individual’s rational choice, but is rather a consequence of many socio-economic factors (ibid).
In sum, then, both theories are concerned with rural-to-urban migration based on economic
incentives; whether actual or perceived. While the Lewis two-sector model might be a reflection of
the European and North American industrialization process, the Harris-Todaro model(s) is thought to
be better adapted to less developed countries. Yet both theories face critique, especially regarding
the notion that rural-to-urban migration will eventually level out and come to a halt. Both theories
were also developed some decades ago. In the following sections, I will discuss research and
literature that points out how the urbanization of less developed regions, sub-Saharan Africa in
particular, is very different from that of Europe and North America. Finally, I will present literature
that concerns the current conditions of urbanization and urban areas in sub-Saharan Africa.
2.2 Urbanization in less developed countries
An issue with the aforementioned theories is, as indicated, that they are expressed in a general
manner. Is it likely that all countries follow the same pattern of urbanization? Lewis two-sector
model was criticized as being outdated with little validity for today’s less developed countries. The
intent of the Harris-Todaro model (and Todaro migration model) was to cover up for some of these
flaws. Yet it has been argued that also this theory, as mentioned above, is too generalizing.
2.2.1 Different urbanization processes?
As discussed, it is doubtful whether industrialization process theories like Lewis two-sector model
are applicable on less developed countries. Aside from occurring during different time eras, the
urbanization of less developed countries compared to more developed countries might differ
significantly.
In an article called Urbanization in Developing Countries (2002), Vernon Henderson points

10
out two factors that differ between the urbanization process of today’s less developed countries and
that of more developed countries during their industrialization period. Firstly, Henderson (2002, p.
89) states that in general, the more developed countries had a much easier time urbanizing than what
the less developed countries now have. Secondly, the urbanization process of the more developed
countries was stretched over a very long time period, which allowed these countries to
simultaneously develop necessary institutions and market instruments (ibid, pp. 89-90). Henderson
(ibid, p. 90) means that since less developed countries are urbanizing very rapidly in comparison,
they do not have the time to develop and/or adjust to the institutions and instruments needed ensure
decent living standards.
The above mentioned differences are also stressed by the UNFPA report State of The World
Population 2007- Unleashing the potential of urban growth (p. 7, box 2). Additionally, it is pointed
out that Europe during its time of industrialization experienced a great population outflow of
migrants to North America; an occurrence not present among contemporary urbanizing countries
(ibid). This did not only relieve European cities of pressure, but it also helped fuelling the North
American industrialization (ibid).
In their article called Third World Urbanization: Dimensions, Theories, and Determinants,
the two authors John D. Kasarda and Edward M. Crenshaw also underscores a number of factors
differentiating the European and North American urbanization from that of today’s less developed
countries. Firstly, Kasarda and Crenshaw (1991, p. 468) state that already during the time of their
industrialization, the more developed countries possessed a comparatively high degree of economic
development and secure income gains. This factor enabled the more developed countries to deal with
issues caused by rapid urbanization (ibid). Secondly, Kasarda and Crenshaw (1991, p. 468) state that
the natural population increase (or “natural increase”)2 is much greater in today’s urbanizing
countries than that of the more developed countries when they went through the same process.
Finally, Kasarda and Crenshaw (1991, p. 468) point out the difference in market accessibility.
Countries industrializing and urbanizing in the 19th
Century did not face many economic competitors
but were able to profit relatively easily (ibid).
To summarize; there are a number of factors and conditions brought up in literature that stresses the
differences between European and North American urbanization and contemporary urbanization in
less developed countries. First, European and North American urbanization was a stretched out
process, whereas less developed countries urbanize rapidly. Secondly, less developed countries have
a high population increase, while Europe decreased its population size through migration during its
industrialization era. Finally, it is argued that Europe and North America was rather well off
economically compared to the rest of the world, contrary to less developed countries today.
As such, there are plenty of arguments for why comparing the industrialization period of the
19th Century and the urbanization of less developed countries today is not feasible. But the term “less
developed countries” encompasses a large region of the world, where sub-Saharan Africa is only a
2 The UNFPA defines “natural increase” as “The difference between the number of births and number of deaths in
a given population.” (State of the World Population, 2007, p. 6, box 1).

11
portion of it. In the following sections, I will present literature suggesting that we not only need to
differ between Europe’s/North America’s urbanization and that of less developed countries, but also
between less developed countries and its various regions, in specific, sub-Saharan Africa. Finally, I
will discuss the settings of sub-Saharan Africa’s urban areas today.
2.2.2 Urbanization and sub-Saharan Africa
2.2.2.1 The consequences of colonialism
In the work called New Forms of Urbanization – Beyond the Urban-Rural Dichotomy (edited by
Tony Champion and Graeme Hugo), Philippe Bocquier argues that the colonization has had a
significant impact on the urbanization of sub-Saharan Africa. Bocquier (2004, p. 134) states that pre-
colonial sub-Saharan Africa had almost no urbanization whatsoever, rather, the population density
was very low in order to supply communities with resources. However, during the colonization,
urban centers were set up on strategic spots (for example, near coasts) in order to simplify the
extraction and export of raw material (ibid). According to Bocquier (ibid), the beginning of the
urbanization of sub-Saharan Africa had very little to do with industrialization since the urbanization
was mainly aimed to provide the colonial powers with goods through export. Hence, Boquier (ibid)
stresses that, unlike for many other countries, sub-Saharan Africa urbanized due to external actions –
rather than because of internal dynamics.
In the article Economic and Demographic Interrelationships in sub-Saharan Africa (1985),
Ester Boserup elaborates on the pre-colonial state of Africa3. Boserup (1985, p. 384) means that
because of Africa’s initial low population density, migrant workers were needed in order to maintain
the facilities and infrastructure brought by colonization. Certain locations became favored due to
their proximity to raw material and export possibilities (ibid). Boserup (1985, p. 384) claims that
these locations got increased population densities; mostly consisting of the migrant labor force but
also because of indigenous farmers who used the infrastructure to export agricultural goods (ibid).
Boserup (ibid) then states that this occurrence caused income inequality throughout Africa; the
peasants residing near colonial communities had far better chances to develop beyond subsistence
farming.
Also Boserup (1985, pp. 384-385) stresses that the urbanization of Africa started out during
the colonial period – but not as a domestic mechanism. Unlike the case for other regions,
urbanization was not brought about (nor did it bring about) industrialization (ibid, p. 385). According
to Boserup, these patterns still remain (that is, around 1985 when the article was published) in terms
of low industrialization, poor infrastructure and little access to the global market (ibid).
2.2.2.2 Sub-Saharan Africa’s urban areas today
3 Although the article’s heading includes the term sub-Saharan Africa, Boserup often refers to Africa only in the
text, which is why the latter term is used here.

12
Today, sub-Saharan Africa’s urban population growth constitutes the highest growth rates in the
world (White et al, 2008, pp. 301-302). While other regions have dropped below 2% annual urban
population growth, it is predicted that sub-Saharan Africa will maintain a 3% growth until year 2030
(ibid, p. 302). Put in numbers, Africa’s urban population is expected to increase by almost 450
million people between year 2000 and 2030 (State of the World Population, 2007, p. 8). This is
interesting since sub-Saharan Africa is often considered to be the least urbanized region in the world
(White et al, 2008, p. 301).
While urbanization and industrialization went hand in hand with economic growth and societal
development for the more developed countries, it is doubtful whether this is true also for sub-
Saharan Africa (White et al, 2008, p. 307). Estimations reveal that around 70% of the urban dwellers
in sub-Saharan Africa in fact reside in slums4 (ibid). The urban population growth rate almost equals
the slum population growth rate, meaning that a large portion of the urban population expansion
occurs in slum areas (Todaro and Smith, 2009, p. 326, box 7.6; State of the World Population, 2007,
p. 16). For sub-Saharan Africa, urban population growth is rather associated with urban poverty, and
several health-indicating factors (such as child mortality) have deteriorated in urban areas (White et
al, 2008, pp. 307-308).
This is a serious issue; even though the physical proximity to facilities such as pharmacies
and hospitals may have increased, there are still socio-economic barriers to bypass (White et al,
2008, p. 308). A report issued in 2009 by the organization Population Reference Bureau describes
the conditions in the slum areas of Nairobi. The report claims that mortality rates in slum areas are
higher than in any other part of the country; partly because of how easily diseases transmit but also
because of the difficulty for a slum dweller to gain access to healthcare (Montgomery, 2009, p. 7).
The conclusion that some aspects of urban residence resemble that of rural residence is drawn in
State of the World Population 2007. Poor urban women are, for example, less likely to use
contraceptives than wealthier urban women (State of the World Population, 2007, p. 22).
Rural-to-urban migration and urban population increase is, on the whole, a rather complicated
subject to define regarding sub-Saharan Africa. Seasonal migrations are not uncommon, and in some
cases, people might be “forced” to migrate because of issues such as drought and famines (White et
al, 2008, p. 310, 302). Economically, rural and urban settlements are often interlinked due to
remittances being sent from family members engaged in waged labor to family members remaining
on the country side (ibid, p. 310). But, White (et al, 2008, p. 302) suggests that rural-to-urban
migration might not even be the general cause of urban population growth. Instead, natural increase
appears to be the main driving force behind expanding cities in sub-Saharan Africa (ibid).
4 The UNFPA refers to UN-HABITAT when it defines the term “slum household”: “…a group of individuals living under the same roof in an urban area who lack one or more of the following: durable housing, sufficient living area, access to improved water, access to sanitation and secure tenure.” (State of the World Population, 2007, p. 16, box 4).
13
2.2.3 Where does this leave us?
Urbanization and urban population growth are two huge and interlinked processes that have puzzled
researchers for decades. Now, the region of sub-Saharan Africa is predicted to experience rapid
urban population growth, yet theory and previous research is inconsistent about the dynamics
thereof. How can we explain urban population growth in this region; what are the mechanisms and
what will be the outcome?
While Lewis and Harris-Todaro offer rational explanations behind rural-to-urban migration,
it is not without critique. Furthermore, it is questioned whether rural-to-urban migration is at all very
significant for contemporary urban population growth; as suggested by White (et al, 2008, p. 302),
population increase might be the major driving force. Even though theory suggests that urbanization
has brought about economic development historically, some researchers worry that this might not be
the case for sub-Saharan Africa, and that it affects socio-economic development negatively.
In my study I will try to create an understanding of how this all fits together in sub-Saharan Africa;
what drives urban population growth and how does it appear in urban settings?

14
3. Methodology
This chapter will be dedicated to the methodology used in this thesis. I will start out by presenting
the method and how it will help me answer the research questions, and then go on to describe how
the method is implemented in this study in a detailed fashion.
3.1 Structured, focused comparison
The method through which data will be processed is called structured, focused comparison. This
method is described by Alexander George and Andrew Bennett in Case Studies and Theory
Development in the Social Sciences (2005). The core of the structured, focused comparison method
is to allow for fair comparison between cases in order to be able to theorize a particular phenomenon
(George and Bennett, 2005, p. 67).
The research objective and research questions in this study are outlined in such a way that
comparison between cases is necessary; for the first research question, to find out about the urban
population distribution, it is necessary to compare different countries to each other.
The second research question, the evaluation of socio-economic standard from an urban
perspective; also requires comparison. Because the research objective regards an entire region (sub-
Saharan Africa) and plenty of factors (urban population growth, urbanization, socio-economic
standard) I find it desirable to approach this matter from a very structured point of departure in order
to detect potential correlations, or lack thereof, that will help answer the research questions.
The third research question, concerning mechanisms- and the degree of generalization of
mechanisms of urbanization and urban population growth, depends on the results from the foregoing
questions. In terms of the structured, focused comparison method, this research question touches
upon the theory-oriented aspect of the method. The results from the previous questions will be
concluded and theorized in a way as to answer the third research question. Therefore, the third
research question relies on the foregoing two being answered systematically.
George and Bennett (2005, p. 67) explain how the structured, focused comparison method was
originally designed to evaluate foreign policy issues. To conduct individual case studies was popular
in the mid-20th Century, but soon enough scientists realized that individual case studies were not
optimal for comparison (ibid, p. 68). From this, George and Bennett offer a couple of criteria that
case studies should include in order to enable fair comparison between cases (although also relevant
for single case studies); which then, is the core of the structured, focused comparison method.
George and Bennett (2005, p. 73) explain that in designing theory-oriented case studies, five
crucial steps are necessary to complete. First, the researcher must formulate a clear research
objective (ibid, p. 74). Then, the researcher must decide upon a research strategy which involves
selecting dependent and independent variables (ibid, p. 79). The third step, George and Bennett (ibid,
p. 83) state, is the selection of cases, which should be done carefully in accordance to the research

15
objective. Fourthly, the researcher must decide upon how to describe variance in the measured
variables; by, for example, deciding how the particular variable should be divided or categorized in a
way that can indicate variance (ibid, pp. 84-85). The final step, according to George and Bennett
(ibid, p. 86) is to formulate questions to be asked to all of the cases. It is very important to be
systematic; the same questions must be given to all cases in order to allow for comparison (ibid).
3.1.1 The research objective
The first criterion mentioned is the formulation of a clear research objective. George and Bennett
(2005, p. 74) state that there are essentially 6 types of research objectives suited for theory-oriented
case studies, and hence, the structured focused comparison method. The research objective of this
thesis is what George and Bennett call a heuristic case study. George and Bennett (2005, p. 75)
explain that heuristic case studies seek to “… inductively identify new variables, hypotheses, casual
mechanics, and casual paths”. Heuristic case studies are also suited for studying ‘“Deviant” or
“outlier” cases’ (George and Bennett, 2005, p. 75). Because the research problem involves many
uncertainties and the overall goal is to try to understand the mechanisms of urban population growth
and urbanization, a heuristic approach seems appropriate. Urban population growth and urbanization
are two complicated, interlinked, historical and also contemporary processes. There is dissonance in
previous literature regarding urbanization and urban population growth. Hence, it is not crystal clear
of what to look for when trying to understand these matters. In order to try to untangle some of these
uncertainties, I need to approach data in an inductive way.
Based on this, my study will be qualitative. In Research Design – Qualitative, Quantitative,
and Mixed Methods Approaches John W. Creswell (2009, p. 4) explains how qualitative studies is a
way to try to understand and find meaning to complex matters. Creswell (2009, p. 4) also states that
qualitative studies are in close connection to an inductive approach. I believe that this approach is the
best suited for the purpose of this thesis; to try to understand the mechanisms of urbanization and
urban population growth in sub-Saharan Africa.
3.1.2 The research strategy
The basis of the research strategy is to outline parameters and variables and determine what variable
will serve as the dependent (George and Bennett, 2005, p. 79).
This study will use statistics the main source of data. I will assess plenty of variables in order
to try to understand the mechanisms of urbanization and urban population growth. Handling plenty
of data for plenty of cases can easily get overwhelming, but using the structured, focused comparison
method then allows me to assemble the statistics in a concise way and to enable comparison between
cases.
With this, I hope to gain as much insight as possible on the various mechanisms that are
related to urbanization. By utilizing statistics, I hope to detect correlations (or lack thereof), but also

16
to strengthen or weaken them. Finally, the comparatively easy acquisition of statistical data enables
me to process plenty of data during a short time period.
In order to maintain a high level of legitimacy and consistency, I have decided to acquire
most of my data from the same source. This is to allow for greater options of comparing countries
and statistics since as comparing between several sources could be difficult; given different methods
and definitions. As such, the definitions of used variables are the definitions of the original source
(for definition of variables: see Appendix I).
The major part of the data used in this thesis has been obtained from the databank issued by
the World Bank (World Bank 2012a). The databank itself contains several databases. The database
used in this thesis is called World Development Indicators & Global Development Finance (WDI &
GDF). All the variables are also available at the World Bank’s webpage, but the databank allows for
convenient usage and transfer of the data. The only other source of data is the United Nations
Development Program (UNDP) from which I will gather the Human Development Index (HDI).
3.1.3 The cases
The selection of cases is very important and must be done in accordance to the research objective
and the research strategy (George and Bennett, 2005, p. 83). The different cases must not be
randomly chosen, but they have to be somehow connected to each other so that comparisons can be
made (ibid).
First of all, this thesis concerns the region of sub-Saharan Africa. I have chosen to use a
definition of sub-Saharan Africa issued by the United Nations Statistics Division (UNSD). The
definition is as follows: “…the designation sub-Saharan Africa is commonly used to indicate all of
Africa except northern Africa, with the Sudan included in sub-Saharan Africa.” (UNSD, 2010).
However, a couple of countries and entities have been excluded in order to attain as valid results as
possible (see Appendix I for a thorough discussion about the definition of sub-Saharan Africa as well
as motivation for excluded countries). The final definition of the region in this thesis encompasses
42 countries5.
Secondly, in order to address the research problem and answer the research questions, I will
select a number of countries that will be used as a tool to manage data; focus countries. Because the
intent of this study is to try to understand mechanisms of urban population growth and urbanization,
the focus countries will be selected based on their respective urban population extent; some countries
with a high extent of urban population, and some with a low. This, I hope, will yield some insight of
the mechanisms of urban population growth, as the highly urbanized countries might have some
properties that the rural lack, or vice versa. I will select these countries by ranking the variable urban
5 In this thesis, sub-Saharan Africa encompasses the following countries: Angola, Benin, Botswana, Burkina Faso, Burundi, Cameroon, Central African Republic, Chad, Congo, Côte d’Ivoire, Democratic Republic of the Congo, Eritrea, Ethiopia, Gabon, Gambia, Ghana, Guinea, Guinea-Bissau, Kenya, Lesotho, Liberia, Madagascar, Malawi, Mali, Mauritania, Mauritius, Mozambique, Namibia, Niger, Nigeria, Rwanda, Senegal, Sierra Leone, Somalia, South Africa, Sudan, Swaziland, Togo, Uganda, United Republic of Tanzania, Zambia and Zimbabwe.

17
population (% of total)6,7
, for year 2009, from highest to lowest, and then split the table into five
quintiles. Since the number of cases is 42, four quintiles will contain eight cases each, and one
quintile will contain ten. The quintile with the additional number of cases will be the third quintile,
that is, the middle one. This is to allow for flexibility, as will be discussed in the following section.
The first quintile; the countries with the highest percentage of urban population, will become focus
countries. The countries in the last quintile will also become focus countries. As such, the focus
countries will constitute those with the highest- and the lowest percentage of urban population in
sub-Saharan Africa.
A third, smaller, focus group of countries will also be determined; a control group. This
group will consist of the middle countries in the table of urban population (% of total) mentioned
above. These countries will then be located in quintile 3, but since it would be too large of a project
to evaluate this entire quintile, I will select the four countries right in the middle.
Hence, the focus groups will consist of the countries with the highest percentage of urban
population, the countries with the lowest, and the control group will consist of the countries with the
median values. The purpose of this control group is to act as another element of determination
wherever uncertainty can be found.
The focus countries will serve as a tool to answering the research questions. In selecting these two
groups of countries, I hope to discover clues and patterns that can reveal the mechanisms of
urbanization, urban population growth, and the consequences thereof. The focus groups will also be
evaluated internally, that is, to find out if the countries of a given focus group are acting in coherence
to each other. The reason for selecting focus countries based on data of year 2009 is because I want
to compare countries that, currently, have a comparatively high extent of urban population to those
with a low extent.
The focus countries with the highest percentage of urban population in 2009 will be referred
to as the urban focus countries. Respectively, the countries with the lowest percentage of urban
population are hence referred to as the rural focus countries (since little urban population equals a
large rural population). Together, the two groups will be referred to as the focus groups or simply the
focus countries. This is purely a method to avoid confusion later on when going through and
analyzing the collected data, thus these labels should be viewed merely as a simplification without
any attached values. The control group will be referred to as the control countries or simply the
control group.
6 See: Appendix I for a complete definition of the variable. 7 The reason for choosing to use urban population (% of total) as a core proxy is very specific. One could argue that a
more sensible variable to use would be one yielding actual numbers rather than percentages. However, the intent is to evaluate the mechanisms and consequences of urban population growth, and as such it is desirable to look at countries that have an intentional (or unintentional) concentration of urbanization. If I had instead used a variable presenting actual numbers then countries with massive populations would almost certainly have been regarded as those with the highest urban population even though their rural population might have been proportionally larger, simply because of the large population. In that case, conclusions could end up being misleading and inaccurate because results from tests based on these countries might stem from the rural situation rather than the urban.
18
3.1.4 Describing the variance
The fourth step in the procedure regards the researcher’s approach towards variance in data; that is,
how to categorize data in order to draw the correct conclusions (George and Bennett, 2005, pp. 84-
85).
The strategy of this research is to evaluate plenty of variables, for given years, and compare
the score of the different countries in order to get a deeper understanding of the mechanisms of
urbanization and urban population growth. Similar to the way of the selection of the focus countries,
variables/proxies used in this study will be ranked from the highest figure to the lowest, and then
split into quintiles. I will then mark the focus countries and the control countries in order to establish
their rank (in what quintile) for each of the variables. Doing this, I hope to detect patterns, or lack
thereof, which can then explain how urbanization and urban population growth works. I will
evaluate the result of each variable, and in the end, I will allocate all the answers for the focus
countries into a table where the variable, the specific countries, and their quintile location will be
presented. This table will yield a compressed outline of the result from the various variables, and it
will be suitable for comparisons between and within the focus groups (see: Table 3.2).
In case that one (or more) countries lack data for a given variable; the country in question
will be marked with “n/a” in order to acknowledge this. The missing entry will be made up by
reducing the number of entries in quintile three (the middle quintile); hence why this quintile
contains ten cases instead of 8 to begin with. For example, let us say that for a given factor, data for
three countries is missing. Then quintile one, two, four and five will contain 8 cases each. Quintile
three, however, will contain 7 cases.
These tables will serve the purpose of detecting correlations or lack thereof and to explore the
constitution of different variables for the different countries. Based on the result of these tables, I
will add two other means of processing data in order to increase the understanding of the matter. In
connection to the tables, I will also create historical time lines of given data. This will allow me to
see the growth/decline process of a certain proxy as well as compare it to other proxies and
countries.
I will also perform correlation analyses. Data will be processed in the software program
Statistics Package for the Social Sciences (SPSS). The tool will be the so called coefficient of
determination, r2 (see: Appendix I, section I.2.3 for a definition of the coefficient of determination).
If any perceived correlation (or lack thereof) is doubtful or comes across as odd, I will run
correlation analyses in order to evaluate the correlation further. As such, these analyses will be a
complement to the results of the various aforementioned tables. I hope that by running correlation
analyses I can increase the understanding of a particular phenomenon detected in the tables.
Correlation analyses are generally more plausible and trustworthy the more cases are used.
Therefore, all countries of sub-Saharan Africa will be represented and not just the focus countries.
This is also a way of including these other countries and taking them into account in the analysis,
since after all, the purpose of this study concerns the entire region.

19
Table 3.1 The proxies of this study
Chapter 4 will present the findings of the tables split in quintiles and the time line charts, and the
correlation analyses will be brought up in chapter 5, along with the analyses of the findings.
3.1.5 The questions
The final step concerns the data specification, and how it is applied to the different cases (George
and Bennett, 2005, p. 86). Basically, the data should take the form of questions then asked to all the
cases in order to systematically generate answers be carefully selected in accordance to the previous
steps and motivated with the research objective in mind (ibid).
In my study, plenty of variables from the WDI & GDF and the UNDP will be used and
“asked” to all of the focus countries and the control group. This will, as stated above, take the form
of ranked tables split in quintiles in order to create a comparable system. The proxies (or, the
“questions”) are presented in table 3.1.
Several variables are connected to
demographics, and they will be used to
try to evaluate the urban population
distributions, the mechanisms and the
level of generalization. Other variables
were selected because they have the
potential to reveal socio-economic status.
However, the coverage of socio-
economic variables is fairly scarce,
which is why factors such as inequality
indexes and poverty headcounts are not
included. The variables were not selected
at random, but through consideration of
what they might yield. For a full
motivation of each variable as well as
their respective definitions, see Appendix
I section I.2.1 and I.2.2. The variables
will be evaluated for year 2009, and in order to gain a historical perspective, some variables will also
be evaluated from earlier time periods. Table 3.2 below shows how the data gathered from quintile
positioning will be assembled in a structured way that allows for comparison between the cases.
These tables will essentially present and summarize the result of the tables discussed in section 3.1.4.
There will be two versions of this table; both presented in the following chapter.
First, the quintile positioning of every country for every variable will be plotted onto the
table, with the intent to detect internal coherence or differences. Three tables of this kind will be
made; one for the urban focus countries, one for the rural- and one for the control group. Then, I will
make a table presenting the average quintile positioning for the urban focus countries, the rural- and
the control group. This table will help discovering differences between the focus groups.
Age dependency ratio (% of working age population)
Arable land (% of land area)
Gross Domestic Product growth (annual %)
GDP/capita, ppp, constant 2005 international $
Health expenditure/capita, ppp, constant 2005 international $
Human Development Index
Labor participation rate (% of total population ages 15+)
Land area (square km)
Life expectancy (at birth, in years)
Mortality rate (under 5 years, per 1000)
Population growth (annual %)
Population in the largest city (% of urban population)
Prevalence of HIV (% of population, ages 15-49)
Rural population growth (annual %)
Total fertility rate (births per woman)
Total population
Urban population (% of total)
Urban population growth (annual %)

20
Table 3.2 Example of tables 3.1.6 The consequences of using the
structured, focused comparison method
The bottom line of structured, focused
comparison is to enable comparison between
cases, but there are limitations to what the
method can yield. Firstly, I will only be able to
evaluate the cases I have chosen to focus upon,
since they have been selected carefully to fulfill
the purposes of the thesis. This means that cases
outside of this boundary (such as other countries
or regions) are not accounted for. Secondly, the
proxies (or “questions”) have been selected
keeping in mind that they must be answered by
all of the cases and formulated in a comparable
fashion. Due to this, the study will only
encompass variables matching these criteria.
As for the sources and the statistical data
acquisition, The World Bank states that although
all data is scrutinized, much of it is acquired
from national offices (World Bank 2012b). This
means that data acquisition might differ between
countries, depending on methodology et cetera.
However, regarding the database WDI & GDF,
the World Bank focuses on ensuring that the data
is consistent and based on similar
methodological measures (World Bank, 2012c).
Case 1 Case 2 Case 3
Age dependency ratio 2009
Arable land (%) 1961
Arable land (%) 2009
GDP growth (%) 2009
GDP/cap ppp, const. 2005 int. $ 1989
GDP/cap ppp, const. 2005 int. $ 2009
Health expenditure/cap 2009
Human Development Index 2009
Labor participation rate 2009
Land area (square km) 2009
Life expectancy 1960
Life expectancy 2009
Mortality rate (< 5 years) 2009
Pop. growth (annual %) 1960
Pop. growth (annual %) 1985
Pop. growth (annual %) 2009
Pop. in the largest city 2009
Prevalence of HIV 2009
Rural population growth 1960
Rural population growth 2009
Total fertility rate 1960
Total fertility rate 2009
Total population 1960
Total population 2009
Urban population (% of tot) 1960
Urban population growth 1960
Urban population growth 2009

21
Table 4.1 Urban population, % of total, year 2009: the urban- and rural focus countries
0 20 40 60 80
100
Source: WDI & GDF
Figure 4.1 Urban population, % of total, year 2009
4. Findings
In this chapter, the data and findings obtained from my research will be revealed. Following the
method discussed in Chapter 3, I will present the result in sections. Firstly, I will present the results
of the various tables split in quintiles for the focus countries and the control group. This will reveal
patterns or lack thereof within the groups, mainly. Then, I will compare the two focus groups and the
control group to each other, in order to reveal potential differences. Lastly, I will go through a
number of time line charts.
4.1 The focus countries and the control countries
I used the method of assorting countries into quintiles in order to establish what sub-Saharan African
countries have the highest and the lowest degree of urban population in relation to total population,
respectively. As outlined in Chapter 3, all sub-Saharan African countries were ranked according to
percentage of urban population and then divided into quintiles (see: Appendix II, table II.1). As such,
given that the two extreme quintiles
contain eight countries each, I was
left with 16 focus countries that will
be used to evaluate the state of urban
population and urbanization in sub-
Saharan Africa. The countries are
presented in Table 4.1.
Between the focus countries,
the difference in degree of urban
population is huge. This is better
illustrated in Figure 4.1. There is
noticeable difference even within the
two focus groups. Gabon has a much
higher degree of urban population
than the other countries in the urban
focus group. Similarly, the urban
population percentage of Eritrea is
almost double the amount of Burundi.
In other words, there is inconsistency
within the two selected groups.
The control countries were
extracted in a similar way, although
instead of the two extreme quintiles,
Urban focus c. (%)2009 Rural focus c. (%)2009
Gabon 85.52 Eritrea 21.16
Congo, Rep. 61.72 Burkina Faso 19.98
South Africa 61.22 Malawi 19.3
Liberia 60.82 Rwanda 18.62
Botswana 60.34 Ethiopia 17.3
Angola 57.6 Niger 16.62
Cameroon 57.58 Uganda 13.14
Gambia, The 57.26 Burundi 10.7
Source: WDI & GDF

22
Light gray: The urban
focus countries.
Gray: The rural focus
countries.
Dark gray: The control
countries.
Thick black line = The
area below the line
constitutes sub-
Saharan Africa
according to the
original UNSD
definition.
(note: Because of
difficulties to find a
clear map, South
Sudan is unfortunately
not included here).
Table 4.2 The control
countries
these countries are the four countries in the middle of the table (see Appendix II: table II.1). These
countries are presented in Table 4.2. The countries in the control group have very similar degrees of
urban population; with a maximum difference of less than 1%.
4.1.1 The geographical location
In order to get an idea of the geographical location, I added a map
of the continent Africa and colored the 16 focus countries and the
control group; Figure 4.2. Although the two focus groups are not
visually clustered to a certain point of the map, they are not
entirely mixed up geographically either. Several of the urban focus
countries are aligned along the south western coast, and all of them
but Botswana have access to the coast. The rural focus countries are more scattered, but mainly
Urban population (% of total)
2009
Zimbabwe 37.82
Mozambique 37.62
Namibia 37.42
Somalia 36.96
Figure 4.2 The geographical location of the focus countries
Source: WDI & GDF
23
located in central- and northern sub-Saharan Africa. All of them except for Eritrea are landlocked.
Three of the control countries are located in the most southern part of Africa; Namibia, Zimbabwe
and Mozambique. Somalia is located on the horn of Africa. Three countries have a shoreline, while
Zimbabwe is landlocked.
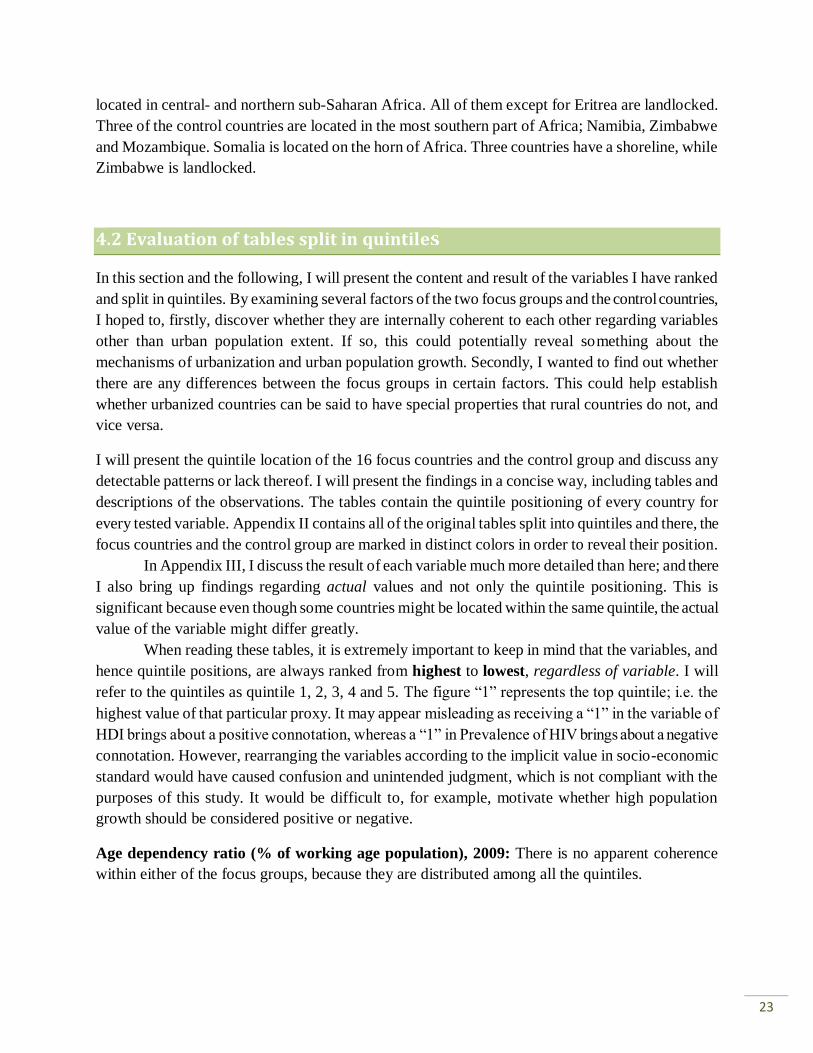
4.2 Evaluation of tables split in quintile
In this section and the following, I will present the content and result of the variables I have ranked
and split in quintiles. By examining several factors of the two focus groups and the control countries,
I hoped to, firstly, discover whether they are internally coherent to each other regarding variables
other than urban population extent. If so, this could potentially reveal something about the
mechanisms of urbanization and urban population growth. Secondly, I wanted to find out whether
there are any differences between the focus groups in certain factors. This could help establish
whether urbanized countries can be said to have special properties that rural countries do not, and
vice versa.
I will present the quintile location of the 16 focus countries and the control group and discuss any
detectable patterns or lack thereof. I will present the findings in a concise way, including tables and
descriptions of the observations. The tables contain the quintile positioning of every country for
every tested variable. Appendix II contains all of the original tables split into quintiles and there, the
focus countries and the control group are marked in distinct colors in order to reveal their position.
In Appendix III, I discuss the result of each variable much more detailed than here; and there
I also bring up findings regarding actual values and not only the quintile positioning. This is
significant because even though some countries might be located within the same quintile, the actual
value of the variable might differ greatly.
When reading these tables, it is extremely important to keep in mind that the variables, and
hence quintile positions, are always ranked from highest to lowest, regardless of variable. I will
refer to the quintiles as quintile 1, 2, 3, 4 and 5. The figure “1” represents the top quintile; i.e. the
highest value of that particular proxy. It may appear misleading as receiving a “1” in the variable of
HDI brings about a positive connotation, whereas a “1” in Prevalence of HIV brings about a negative
connotation. However, rearranging the variables according to the implicit value in socio-economic
standard would have caused confusion and unintended judgment, which is not compliant with the
purposes of this study. It would be difficult to, for example, motivate whether high population
growth should be considered positive or negative.
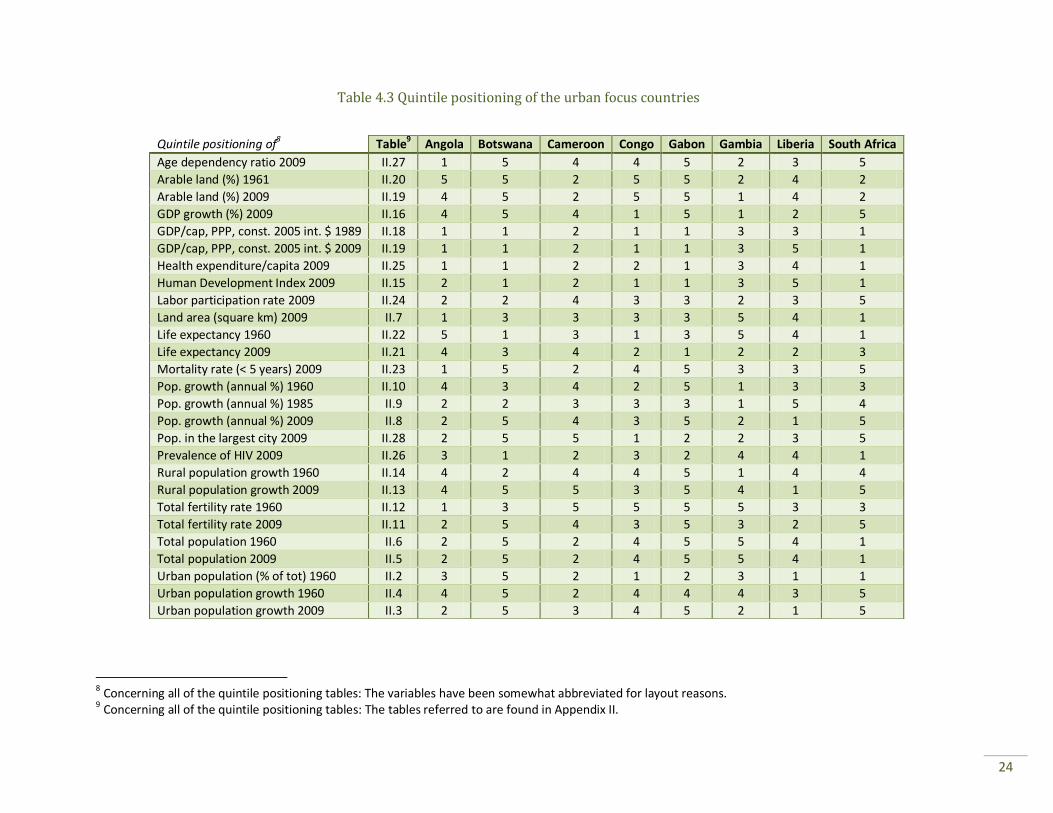
Age dependency ratio (% of working age population), 2009: There is no apparent coherence
within either of the focus groups, because they are distributed among all the quintiles.
24
8 Concerning all of the quintile positioning tables: The variables have been somewhat abbreviated for layout reasons.
9 Concerning all of the quintile positioning tables: The tables referred to are found in Appendix II.
Quintile positioning of8 Table
9 Angola Botswana Cameroon Congo Gabon Gambia Liberia South Africa
Age dependency ratio 2009 II.27 1 5 4 4 5 2 3 5
Arable land (%) 1961 II.20 5 5 2 5 5 2 4 2
Arable land (%) 2009 II.19 4 5 2 5 5 1 4 2
GDP growth (%) 2009 II.16 4 5 4 1 5 1 2 5
GDP/cap, PPP, const. 2005 int. $ 1989 II.18 1 1 2 1 1 3 3 1
GDP/cap, PPP, const. 2005 int. $ 2009 II.19 1 1 2 1 1 3 5 1
Health expenditure/capita 2009 II.25 1 1 2 2 1 3 4 1
Human Development Index 2009 II.15 2 1 2 1 1 3 5 1
Labor participation rate 2009 II.24 2 2 4 3 3 2 3 5
Land area (square km) 2009 II.7 1 3 3 3 3 5 4 1
Life expectancy 1960 II.22 5 1 3 1 3 5 4 1
Life expectancy 2009 II.21 4 3 4 2 1 2 2 3
Mortality rate (< 5 years) 2009 II.23 1 5 2 4 5 3 3 5
Pop. growth (annual %) 1960 II.10 4 3 4 2 5 1 3 3
Pop. growth (annual %) 1985 II.9 2 2 3 3 3 1 5 4
Pop. growth (annual %) 2009 II.8 2 5 4 3 5 2 1 5
Pop. in the largest city 2009 II.28 2 5 5 1 2 2 3 5
Prevalence of HIV 2009 II.26 3 1 2 3 2 4 4 1
Rural population growth 1960 II.14 4 2 4 4 5 1 4 4
Rural population growth 2009 II.13 4 5 5 3 5 4 1 5
Total fertility rate 1960 II.12 1 3 5 5 5 5 3 3
Total fertility rate 2009 II.11 2 5 4 3 5 3 2 5
Total population 1960 II.6 2 5 2 4 5 5 4 1
Total population 2009 II.5 2 5 2 4 5 5 4 1
Urban population (% of tot) 1960 II.2 3 5 2 1 2 3 1 1
Urban population growth 1960 II.4 4 5 2 4 4 4 3 5
Urban population growth 2009 II.3 2 5 3 4 5 2 1 5
Table 4.3 Quintile positioning of the urban focus countries
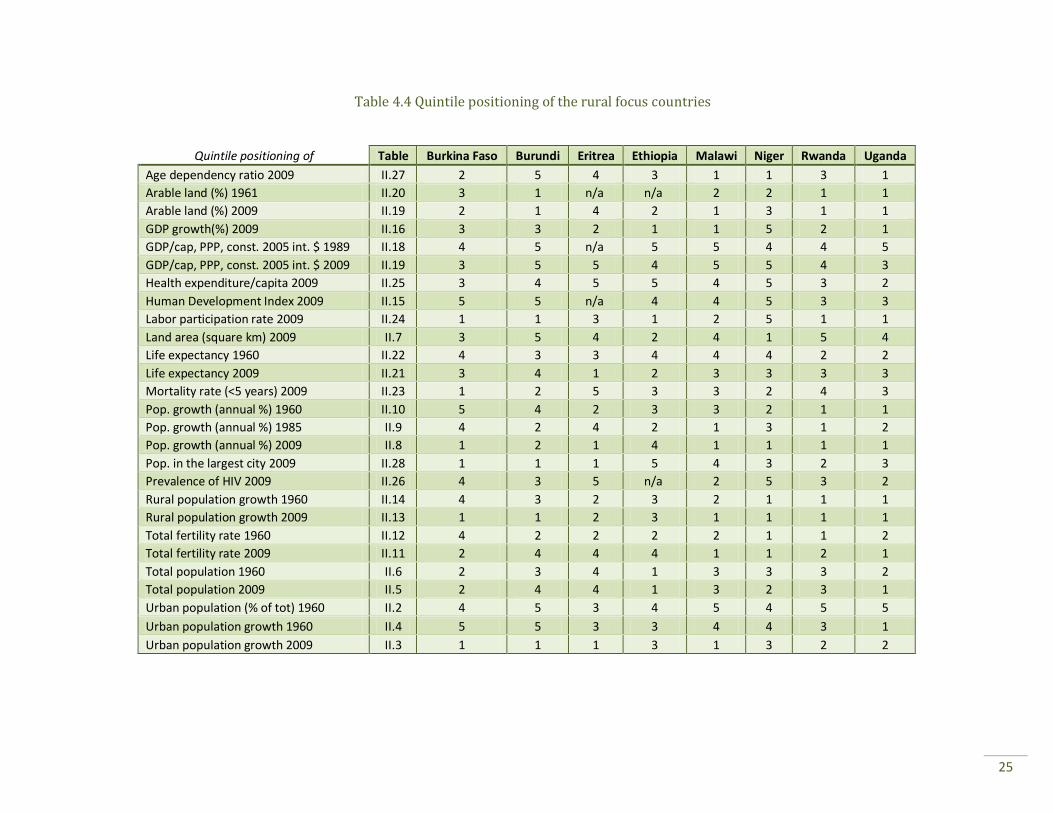
25
Quintile positioning of Table Burkina Faso Burundi Eritrea Ethiopia Malawi Niger Rwanda Uganda
Age dependency ratio 2009 II.27 2 5 4 3 1 1 3 1
Arable land (%) 1961 II.20 3 1 n/a n/a 2 2 1 1
Arable land (%) 2009 II.19 2 1 4 2 1 3 1 1
GDP growth(%) 2009 II.16 3 3 2 1 1 5 2 1
GDP/cap, PPP, const. 2005 int. $ 1989 II.18 4 5 n/a 5 5 4 4 5
GDP/cap, PPP, const. 2005 int. $ 2009 II.19 3 5 5 4 5 5 4 3
Health expenditure/capita 2009 II.25 3 4 5 5 4 5 3 2
Human Development Index 2009 II.15 5 5 n/a 4 4 5 3 3
Labor participation rate 2009 II.24 1 1 3 1 2 5 1 1
Land area (square km) 2009 II.7 3 5 4 2 4 1 5 4
Life expectancy 1960 II.22 4 3 3 4 4 4 2 2
Life expectancy 2009 II.21 3 4 1 2 3 3 3 3
Mortality rate (<5 years) 2009 II.23 1 2 5 3 3 2 4 3
Pop. growth (annual %) 1960 II.10 5 4 2 3 3 2 1 1
Pop. growth (annual %) 1985 II.9 4 2 4 2 1 3 1 2
Pop. growth (annual %) 2009 II.8 1 2 1 4 1 1 1 1
Pop. in the largest city 2009 II.28 1 1 1 5 4 3 2 3
Prevalence of HIV 2009 II.26 4 3 5 n/a 2 5 3 2
Rural population growth 1960 II.14 4 3 2 3 2 1 1 1
Rural population growth 2009 II.13 1 1 2 3 1 1 1 1
Total fertility rate 1960 II.12 4 2 2 2 2 1 1 2
Total fertility rate 2009 II.11 2 4 4 4 1 1 2 1
Total population 1960 II.6 2 3 4 1 3 3 3 2
Total population 2009 II.5 2 4 4 1 3 2 3 1
Urban population (% of tot) 1960 II.2 4 5 3 4 5 4 5 5
Urban population growth 1960 II.4 5 5 3 3 4 4 3 1
Urban population growth 2009 II.3 1 1 1 3 1 3 2 2
Table 4.4 Quintile positioning of the rural focus countries

26
Arable land (% of land area): For 1961, setting aside the internal differences of the groups, we see
that there is some difference between the rural- and the urban focus countries. The rural focus
countries appeared to have a larger amount of arable land year 1961.
For 2009, there are internal differences within the focus groups, but there is a tendency for
the rural focus countries to have a, generally, greater total of arable land, both in 1961 and in 2009.
GDP growth (annual %), 2009: In actual numbers, the differences between the countries (of both
focus groups) are great. Some countries grow by a couple of percent while some have negative
growth. Yet many of the rural focus countries have higher GDP growth than some of the urban-.
Gross Domestic Product (GDP), PPP (constant 2005 international $): For 1989, we see that the
urban focus countries are dominating GDP/capita while the rural focus countries are far behind.
Quintile positioning for Table Mozambique Namibia Somalia Zimbabwe
Age dependency ratio 2009 II.27 2 5 2 4
Arable land (%) 1961 II.20 4 5 5 3
Arable land (%) 2009 II.19 4 5 5 3
GDP growth (%) 2009 II.16 1 3 n/a 2
GDP/cap, PPP, const. 2005 int. $ 1989 II.18 5 1 n/a n/a
GDP/cap, PPP, const. 2005 int. $ 2009 II.19 4 1 n/a n/a
Health expenditure/capita 2009 II.25 4 1 n/a n/a
Human Development Index 2009 II.15 5 1 n/a 4
Labor participation rate 2009 II.24 1 5 4 4
Land area (square km) 2009 II.7 2 2 2 3
Life expectancy 1960 II.22 5 1 4 1
Life expectancy 2009 II.21 4 1 4 5
Mortality rate (< 5 years) 2009 II.23 2 5 1 4
Pop. growth (annual %) 1960 II.10 4 3 3 1
Pop. growth (annual %) 1985 II.9 5 2 5 1
Pop. growth (annual %) 2009 II.8 3 4 4 5
Pop. in the largest city 2009 II.28 5 2 3 3
Prevalence of HIV 2009 II.26 1 1 5 1
Rural population growth 1960 II.14 3 3 3 1
Rural population growth 2009 II.13 4 4 3 5
Total fertility rate 1960 II.12 4 3 1 1
Total fertility rate 2009 II.11 3 5 1 5
Total population 1960 II.6 1 5 3 2
Total population 2009 II.5 2 5 3 3
Urban population (% of tot) 1960 II.2 5 2 2 3
Urban population growth 1960 II.4 2 3 3 3
Urban population growth 2009 II.3 2 4 4 5
Table 4.5 Quintile positioning of the control countries

27
For 2009, even though the rural focus countries on average seem to have caught up a little
with the urban-, the urban focus countries are still excelling at GDP/capita.
Health expenditure/capita, PPP (constant 2005 international $), 2009: On the whole, health
expenditure/capita seems closely connected to GDP/capita as the quintile positioning of the countries
is very similar. The urban focus countries excel at this proxy.
Human Development Index, 2009: Even though the urban focus countries seem to dominate also
this variable, there are internal differences. Same goes for the control group. The rural focus
countries are also dispersed but mainly located on the bottom half of the table.
Labor participation rate, total (% of total population ages 15+), 2009: It seems as if the rural
focus countries have greater similarity between each other than the urban-, regarding this proxy. The
rural focus countries are also the dominating ones.
Land area, km2, 2009: The focus countries are scattered throughout the quintiles and there is no
visible connection between urban population extent and land area. However, the differences in actual
land area are massive between all of the countries.
Life expectancy, at birth (in years): For 1960, some of the urban focus countries (and two of the
control countries) have much higher life expectancy than the rest. The rural focus countries appear
all over the table but mostly on the bottom half. Yet, it is difficult to see any patterns because most
of the countries are very scattered.
In 2009, the life expectancy for the focus countries appears very random, and there seems to
be no difference (at least not much) between the focus groups. Hence, there is little coherence.
Mortality rate, under-5 (per 1000 live births), 2009: Both the rural- and the urban focus countries
are present in all quintiles, quite evenly distributed. Also the control countries are all in separate
quintiles. As such, there is no apparent correlation at this point.
Population growth (annual %): In 1960, all of the focus countries were located in all quintiles, and
it is difficult to see any kind of pattern.
In 1985, it seems as if the rural focus countries, generally, have higher population growth.
However, the internal differences are great; while some rural focus countries had comparatively high
population growth, some had comparatively low.
In 2009, the rural focus countries are without a doubt dominating population growth.
Meanwhile, the urban focus countries are distributed between all quintiles. Seemingly, there is a
connection only applicable for the rural focus countries.
Population in the largest city (% of urban population), 2009: There is no obvious allocation of
either of the focus groups, but three of the urban focus countries are in the fifth quintile, but only one
of the rural. Overall, the countries are fairly scattered.

28
Prevalence of HIV, total (% of population ages 15-49), 2009: Quintile-wise, there is no obvious
pattern for the focus groups. The control group, however, has three out of four countries represented
in the 1st quintile. Nevertheless, the differences in actual numbers are huge, and Botswana and South
Africa has by far the highest HIV prevalence out of the focus countries.
Rural population growth (annual %): In 1960, the rural focus countries appear to have, generally,
higher growth rates. The rural focus countries are gathered on the top half of the table, while plenty
of the urban focus countries are located in the fourth quintile.
In 2009, the rural focus countries are beyond doubt excelling at rural population growth. The
urban focus countries are gathered around the bottom of the table.
Total fertility rate (births per woman): In 1960, the rural focus countries seem to have higher
fertility rate than the urban-. Most of the rural focus countries are located within quintile 1 and 2,
while the urban focus countries are more dispersed.
In 2009, there is not as strong of a connection, but the rural focus countries still seem to,
typically, have higher fertility rates. That being said, the countries differ greatly between each other,
in all groups.
Total population: In 1960, the different population sizes vary greatly in actual numbers. However,
there are five urban focus countries that have smaller population sizes than all of the rural focus
countries and three of the control countries.
In 2009, the quintile positioning looks pretty much the same; while five of the urban focus
countries have comparatively small population sizes, the rural focus countries seem very scattered.
Urban population (% of total), 1960: While the urban focus countries seem quite dispersed, the
rural focus countries are typically located within the bottom two quintiles. The control countries are
also scattered.
Urban population growth (annual %): In 1960, there is no detectable pattern for either of the
focus groups. Most of the rural-, as well as the urban focus countries are allocated in the bottom
three quintiles.
In 2009, many of the rural focus countries have comparatively high urban population growth.
Meanwhile, the urban focus countries and the control countries are rather scattered.
4.3 Comparing the focus countries and the control group
This section will put the focus countries and the control group against each other by comparing
average quintile positioning. The average quintile positioning for the focus groups and the control
group do in some cases suggest structures and patterns that are too prominent to be negligible.
However, this type of average comparison may not be an ideal indicator due to the low number of
cases, and as has been discussed in previous sections, internal differences. Nevertheless, a structured,

29
Table 4.6 Average quintile positioning for the focus countries and the control group
focused comparison of this type can serve as a tool to discover congruence, or lack thereof.
On the whole, scores on the variables are fairly even with only marginal differences. It is
extremely difficult to tell whether these marginal differences are significant, keeping in mind lack of
data for certain countries and the possible differentiation in data acquisition. On the other hand,
merely marginal differences are in themselves interesting, since minor differences might indicate a
lack of correlation to urbanization.
Age dependency ratio (% of working age population), 2009: The average differs by about one
quintile between the urban- and the rural focus countries. This suggests that the rural focus countries,
altogether, have a higher dependency burden than their urban counterpart. The control group is
located in between the two focus groups.
10* = one missing entry, ** = two missing entries
Average quintiles of Table Urban focus g. Rural focus g. Control group
Age dependency ratio 2009 II.27 3.625 2.5 3.25
Arable land (%) 1961 II.20 3.75 1.669**10
4.25
Arable land (%) 2009 II.19 3.5 1.875 4.25
GDP growth (%) 2009 II.16 3.375 2.25 2*
GDP/cap PPP, const. 2005 int. $ 1989 II.18 1.625 4.571* 3**
GDP/cap PPP, const. 2005 int. $ 2009 II.19 1.875 4.25 2.5**
Health expenditure/cap 2009 II.25 1.875 3.875 2.5**
Human Development Index 2009 II.15 2 4.143* 3.333*
Labor participation rate 2009 II.24 3 1.875 3.5
Land area (square km) 2009 II.7 2.875 3.5 2.25
Life expectancy 1960 II.22 2.875 3.25 2.75
Life expectancy 2009 II.21 2.625 2.75 3.5
Mortality rate (< 5 years) 2009 II.23 3.5 2.875 3
Pop. growth (annual %) 1960 II.10 3.125 2.625 2.75
Pop. growth (annual %) 1985 II.9 3 2.375 3.25
Pop. growth (annual %) 2009 II.8 3.375 1.5 4
Pop. in the largest city 2009 II.28 3.125 2.5 3.25
Prevalence of HIV 2009 II.26 2.5 3.429* 2
Rural population growth 1960 II.14 3.5 2.125 2.5
Rural population growth 2009 II.13 4 1.375 4
Total fertility rate 1960 II.12 3.75 2 2.25
Total fertility rate 2009 II.11 3.625 2.375 3.5
Total population 1960 II.6 3.5 2.625 2.75
Total population 2009 II.5 3.5 2.5 3.25
Urban population (% of tot) 1960 II.2 2.25 4.375 3
Urban population growth 1960 II.4 3.875 3.5 2.75
Urban population growth 2009 II.3 3.375 1.75 3.75

30
Arable land (% of land area): The average in 1961 indicates difference between the focus groups.
Altogether, the urban focus countries had a much smaller extent of arable land than the rural focus
countries. The control group, however, had even less arable land than the urban focus countries.
In 2009, the arable land distribution is somewhat similar between the urban- and the rural
focus countries as compared to 1961, with minor differences. The control group scores exactly the
same value as in 1961.
GDP growth (annual %), 2009: For the rural focus countries, the average growth is higher than for
the urban-. However, the growth rate for the control group is higher than that of the rural countries.
Gross Domestic Product (GDP), PPP (constant 2005 international $): In 1989, the urban focus
countries score very high, in contrast to the rural focus countries which are at the other end of the
scale. This is one of the variables where the difference between the groups is the most prominent.
The control group is located right in between the two other groups.
For 2009, indicates that the difference between the urban- and the rural focus countries has
been reduced. Although there is a significant gap between the two groups, it is not as large as in
1989. The average quintile for the urban focus countries is lower in 2009 than in 1989, but for the
rural- and the control groups, the average quintile is now higher.
Health expenditure/capita, PPP (constant 2005 international $), 2009: The average quintile
positioning is surprisingly similar as that of the above mentioned variable. The urban focus countries
have the same average score as for GDP/capita, and so does the control group. However, the rural
focus groups have a higher quintile positioning for health expenditure than GDP/capita, hence there
is less difference between the focus groups regarding this variable than for the former. Regardless of
that, the differences are still substantial.
Human Development Index, 2009: The urban focus countries score, in average, two quintiles
higher than the rural-. The control group is in between, although closer to the rural focus countries
than the urban-.
Labor participation rate, total (% of total population ages 15+), 2009: The rural focus countries
have greater labor participation than the urban-, with a difference of little more than one quintile.
The control group does however have a lower average than the urban focus countries.
Land area, km2, 2009: In average, the urban focus countries are larger than the rural-. The control
group turns out to have the greatest land area of them all.
Life expectancy, at birth (in years): In 1960, the life expectancy is marginally different between
the focus countries. The urban focus countries did in average have higher life expectancy than the
rural-, and in turn the control group had higher rates than the urban countries. The differences are
less than one quintile.
In 2009, the life expectancies for the various groups are even more converged and the
difference between the urban- and the rural focus countries are minimal. Interestingly, though, both

31
groups have an average of greater than the total average for the whole of sub-Saharan Africa.
Contrary to in 1960, the control group has the lowest score of the focus groups, in fact, lower than its
1960 value.
Mortality rate, under-5 (per 1000 live births), 2009: In average, the rural focus countries have a
higher mortality rate than the urban-, although not by far. The control group has a middle
positioning.
Population growth (annual %): In 1960, the urban focus group had less population growth than the
rural- and the control group. The rural focus countries and the control group had very similar average
positions.
In 1985, the average quintile for the rural focus countries is slightly higher than in 1960.
Meanwhile, the urban focus countries and the control group lowered their score; the former by less
than the latter.
In 2009, the rural focus countries again have a higher average quintile positioning than in
1985, and the urban- and the control group lowered theirs in comparison to 1985. In 2009, the
difference between the urban- and the rural focus countries is significant, where the latter has a much
higher growth rate. The control group has a lower average than both of the other groups.
Population in the largest city (% of urban population), 2009: The rural focus countries have
slightly higher population in the largest city than the urban-, in year 2009. The control group has a
lower average than the urban focus countries, but only marginally.
Prevalence of HIV, total (% of population ages 15-49), 2009: The urban focus countries have in
average greater prevalence of HIV than the rural-. The difference is little less than one quintile. The
control group has the greatest prevalence of them all.
Rural population growth (annual %): In 1960, the urban focus countries had a lower average rural
population growth than the rural- .The difference is of slightly more than one quintile. The control
group had a middle average score.
In 2009, the difference between the rural- and urban focus countries is much greater.
Interestingly, the control group has the same average quintile positioning as the urban focus
countries.
Total fertility rate (births per woman): In 1960, the rural focus countries had a higher total
fertility rate than the urban focus countries, with a difference of almost two quintiles. The control
group had a value in between the focus groups, but closer to the rural focus countries.
In 2009, the difference is less, although still noticeable. This year, the control group is closer
to the score of the urban focus group than that of the rural-.
Total population: In 1960, the difference between the rural- and the urban focus group was
approximately one quintile. The control group had a marginally lower average quintile position than
the rural focus countries.

32
In 2009, the difference between the rural- and the urban focus countries has expanded to
exactly one quintile. Meanwhile, still maintaining a middle value, the control group resembles more
of the urban focus countries.
Urban population (% of total), 1960: The urban focus countries were in comparison more
urbanized (population-wise) than the rural focus countries; with a difference of about two quintiles.
The control group had an average quintile positioning in between the two focus groups.
Urban population growth (annual %): In 1960, there is not much difference between the focus
groups.. Both groups had fairly similar values, while the control group had the highest growth rates.
In 2009, however, the rural focus countries have in average a much higher urban population
growth rate than the urban-. The control group, contrary to in 1960, has the lowest growth rates.
4.4 The time line charts
In this section I will present the time line charts for the 16 focus countries. I will discuss the
different, observable patterns and compare the differences. The charts contain data of several
relevant variables and most of them range from year 1960 to year 2009 (for certain variables the
years differ due to unavailable data). All charts are available in Appendix II.
4.4.1 Urban population, % of total, years 1960-2009 (Appendix II, Figure II.1-II.4)
The time lines for the individual countries are very different. A few countries appear to have
increased their urban population rather steadily over the years; their timeline constitutes of a rather
straight line. Other countries have experienced a surge in urban population increase at one point or
another.
Aside from the degree of urban population, there is no distinct difference between the time
lines of the rural- and the urban focus countries. That is, there is no distinct pattern that either group
appear to follow; the time lines of the countries are very individual regardless of their amount of
urban population.
All countries, however, have one thing in common: their urban population has drastically
increased over the years. Although this is more prominent for the urban focus countries, as they have
grown to a much larger extent, it is valid even for the rural-.
The time lines reveal that the urban focus countries generally had a higher degree of urban
population around 1960. Botswana is the only case of the urban focus countries that had an urban
population of less than 10% in year 1960. Meanwhile, for the rural focus countries, no country had
more than 10%, and Eritrea is the only close case with 9.8%.

33
3 4 5 6 7 8 9
1960
1964
1968
1972
1976
1980
1984
1988
1992
1996
2000
2004
2008
Source: WDI&GDF
Figure 4.3 Example of total fertility rate timelines (1960-2009)
Gabon
Gambia, The
Malawi
Niger
4.4.2 Population, total, years 1960-2009 (Appendix II, Figure II.5-II.8)
All of the focus countries have had an increase to their total population from year 1960 to year 2009.
However, the focus countries differ greatly in amount of total population.
As perhaps expected, the countries with the greatest population in 1960 are also the ones with
the largest total population in year 2009.
In two cases, Liberia and Rwanda, the time lines are visibly distorted at certain points. They
are the only two countries with such an apparent downturn in total population, most likely due to the
genocide in Rwanda and the Liberian civil war(s). That being said, the other time lines are not
altogether straight; small bumps and accelerations are visible.
Unfortunately, it is difficult to evaluate potential patterns in population growth because of the
huge differences in sizes. However, the time lines for many countries appear to get steeper around
late 1970s- beginning of the 1980s.
4.4.3 Total fertility rate, births per woman, years 1960-2009 (Appendix II, Figure II.9-
II.12)
All of the focus countries, apart from Niger, have a lower total fertility rate in 2009 than they did in
1960. However, the total fertility rate has not been reduced consequently throughout the years; in
many cases, the total fertility rates have increased past 1960 only to decrease again, creating an arch-
like shape on the time lines. Figure 4.3 below presents examples of this occurrence. The time lines
clearly resemble of some kind of inverted u-curve.
While Figure 4.3 contains
only four cases, this occurrence is
visible also for other cases. Some
time lines are of a different shape.
Botswana, for example, might have
been at a peak of an “inverted u-
curve” in 1960, although because of
lack of data it is impossible to know
for sure. South Africa appears to have
no resemblance of a u-curve. Even
though most countries eventually
decreased their respective total fertility rates, they did not do so simultaneously.
4.4.4 Life expectancy, at birth (in years) 1960-2009 (Appendix II, Figure II.13-II.16)
Life expectancy has increased for all countries since 1960. For some countries this has happened
through a steady increase, but for some it has been somewhat of a rocky road. For some

34
countries, it is possible to detect a similar arch shape as for total fertility rates (for example,
Malawi, Uganda, Botswana and South Africa). This could be because of HIV and AIDS, since
these countries also have a comparatively high HIV prevalence. Some countries have significant
downturns in life expectancy, most predominately, Rwanda and Liberia. This is most likely due
to the same reasons as stated in section 4.4.2.
Nowadays, all of the countries appear to have increasing life expectancy, regardless of
previous downturns.
4.4.5 Labor participation rate, % of total population, years 1980-2009 (Appendix II,
Figure II.17-II.20)
For most of the focus countries, the graph displays a rather straight line with little difference in
labor participation rate over the last 29 years.
Out of the urban focus countries, all but South Africa have had a labor participation rate
of over 60% of the total population during this time period. Angola is the only country out of the
urban focus countries which participation rate exceeds 80%. On the other hand, South Africa is
the only country that has increased its labor participation rate significantly (around 10%). The
other countries have gone through minor upturns or downturns, but only by a percent or two at
most.
The time lines for the rural focus countries are slightly more vivid. 5 countries have a
current labor participation rate exceeding 80%. None of the countries have a figure lower than
60% and Niger is the only country that did during this time period (it crossed the threshold in
1996). Malawi had a downturn in labor participation rate, beginning around 1983. Malawi’s
downturn ended around 1987, and since then the country has maintained approximately the same
degree of labor participation rate. Overall, the labor participation rate has not changed much
during this period for most of the countries; Niger improved the most by around 6%.
Unfortunately, there is no data for labor participation rate going further back than 1980.
Hence, the time scope for this particular variable is smaller than usual.
4.5 Summary of findings
The urban population distribution of sub-Saharan Africa in year 2009 is far from unanimous. As
seen in Appendix II: table II.1 and section 4.1 of this thesis, urban population (% of total) ranges
from about 10% to 85%. In my attempt to create two focus groups that could represent high and low
degree of urban population, I realized that not even these two groups are conformed. At a first glance
of urban population extent, it looks as if sub-Saharan Africa deserves to be recognized as a very
diverse region, at least in this regard.

35
As for socio-economic factors, and to whom they favor, this turned out to be a particularly tricky
question. For most of the applied variables, diversity was great among the countries, and even
though averages might differ, there were sometimes still huge differences within the two focus
groups, both in quintile positioning and in actual numbers. One of the idiosyncratic variables was
GDP/capita (PPP, constant 2005 international $) where the urban focus countries excelled
remarkably. Also variables connected to the former; health expenditure/capita (PPP, constant 2005
international $) and the Human Development Index showed great differences between the urban- and
the rural focus countries. However, from this, it is not possible to tell what kind of connection there
is between urbanization and economic development. For one, a major question is whether
urbanization is a prerequisite for economic development; or the other way around. Secondly, it is not
very clear what advantages there are with higher economic development; for many other socio-
economic variables (if not most) I was unable to spot any clear cut, without-doubt patterns, as the
average quintile positioning was less than one quintile. However, it is interesting to note that the
rural focus countries, in average, have higher labor participation, something that Lewis in his two-
sector model did not predict. These and many other questions and topics that will be deliberated in
the following chapter.
As for the control countries, sometimes they did indeed end up right between the urban- and
the rural focus countries, for instance in GDP/capita (PPP, constant 2005 international $). This is
however far from the rule, and every now and then they took on extreme positions; as either higher
or lower than both of the focus groups. It is also important to point out that neither the control group
was unanimous internally; the differences were great regarding many proxies.
In order to speak of the mechanisms of urban population growth, and the subsequent question of
similarity of patterns in sub-Saharan Africa, more analyzing must be done. This will be a major topic
in the following chapter. As far as one can tell by briefing through the data offered in this chapter,
there appears to be some connection between low urban population and high population growth;
urban-, rural- and total population growth. As discussed in section 4.2 and 4.3, there seems to be a
correlation between the rural focus countries and population growth, but only in contemporary time.
Meanwhile, there is no such distinguishable connection between population growth and the urban
focus countries. The question is whether this perceived connection has to do with urban population
extent, or perhaps with time period. This matter will be elaborated upon in the following chapter and
complemented with correlation analyses in order to try to establish the mechanisms of urban
population growth and how they relate to population growth.

36
Table 5.1 Values for urban population (% of
total), 2009 and 1989
0
50
100
Source: WDI & GDF
Figure 5.1 Urban population (%) of total, 2009: all of sub-Saharan Africa
5. Analysis
This chapter will evaluate the data presented in the previous chapter in an analytical way. The
analyses will be presented in topic-wise sections, rather than directly answering each research
question. This is because the findings have potential to yield much more information than is asked
for in the research problem. In the next chapter, the Conclusion, the research questions will be
brought up yet again, this time with concise and complete answers.
5.1 Urban population in sub-Saharan Africa
Sub-Saharan Africa is very diverse when it comes to contemporary extent of urban population, at
least in year 2009 (see: Appendix II: table II.1 for the full range of urban population percentage in
sub-Saharan Africa).
For all of sub-Saharan Africa, the total range of urban population (%) in year 2009 is 74.82. The
standard deviation is 16.12, the median is 37.52 and the mean value is 37.95. All of this suggests a
great diversity of urban population within sub-Saharan Africa. The range reveals the great extent as
the maximum number would be 100 (as in 100% urban population). The standard deviation shows
that the countries are not closely
clustered together on the scale.
Looking at Figure 5.1 and
keeping the mean and the median in
mind, one can tell that these numbers
are fairly representative. Average
values are sometimes misleading
when a number of cases with
extremely high values are added to a
number of cases with extremely low values. This is not the case for urban population extent in sub-
Saharan Africa. Today, the region of sub-Saharan Africa is not uniform in terms of urban population.
5.1.1 Urban population extent throughout
the years
Contemporary sub-Saharan Africa is not
uniform in its level of urban population.
Therefore, it makes little sense to talk about the
entire region’s level of urbanization when
countries are so diverse. Yet, generalizing the region has some grain of truth to it. As mentioned in
Variable 2009 Variable 1989
Mean 37.95 Mean 28.92
Median 37.52 Median 28.06
Range (total) 74.82 Range (total) 62.42
Standard deviation 16.12 Standard deviation 13.38

37
Table 5.2 Coefficient of
determination (r2): urban
population (% of total), different
years
Table 5.3 Coefficient of
determination (r2): urban
population (% of total)
Dependent: UP% of tot. Independent: UP% of tot.
Year r2
d: UP%2009/i: UP%1999 0.976
d: UP%1999/i: UP%1989 0.941
d: UP%1989/i: UP%1979 0.889
d: UP%1979/i: UP%1969 0.885
d: UP%1969/i: UP%1960 0.937
Source: WDI & GDF
Table 5.3 r2 Correlation analysis:
urban population (% of total)
previous chapters, urbanization and urban population growth are expected to increase rapidly in sub-
Saharan Africa, and have done so during the last 20 years. Table 5.1 presents some values of urban
population (% of total) in sub-Saharan Africa from year 2009 and 1989 respectively. Compared to
2009, the mean and median values were nearly 10 units lower in 1989, the range was more than 10
units lower and the standard deviation differed by a little less than 3. This suggests that not only
were the levels of urbanization much lower in 1989, but there was also greater conformity between
the 42 countries. This means that urban population extent has
become less conform throughout the years, it is not a linear
process shared between all of the countries.
In section 2.2.1, researchers argued that the more developed
countries were in great advantage at the point where they
urbanized. It was said that a country that begun its
urbanization process a long time ago ought to have developed
infrastructure and facilities enabling further urban population
growth, in contrast to a country with very low levels of
urbanization. The question is if this holds true even for sub-
Saharan Africa, since some countries have a much greater
extent of urban population. In order to evaluate this notion, I
performed two correlation analyses.
The first one, Table 5.2, shows the correlation
between urban population (% of total) in 2009 and urban
population (% of total) of earlier years. There is a very strong
correlation between urban population in 2009 and that of
1999, but for every other year the correlation ceases.
Nevertheless, the result indicates that urban population
growth is highly dependent on the already existing urban
population, but only for approximately 20 years, after which
the correlation deteriorates.
The second correlation analysis, Table 5.3, was made
with the intent to put the same matter in a historical
perspective.
The dependent variable is urban population (% of
total) of a given year, and the independent value is urban population (% of total) dating 10 years
back. For this analysis, the correlations are all very strong. The urban population degree in 1969 is
strongly correlated to that of 1960, and so on. It is clear that the existing extent of urban population
affects the growth of urban population, and that has apparently been the case for at least the last 50
years in sub-Saharan Africa.
All of this point to that urban population growth is indeed escalating, especially for those
countries that already have a significant amount of urbanization. It is reasonable to assume that the
Dependent: UP%xxxx Independent: UP%xxxx
Year r2
d: UP%2009/i: UP%1999 0.976
d: UP%1999/i: UP%1989 0.941
d: UP%1989/i: UP%1979 0.889
d: UP%1979/i: UP%1969 0.885
d: UP%1969/i: UP%1960 0.937
Source: WDI & GDF
Dependent: UP%2009 Independent: UP%xxxx
Year r2
UP % of tot. 1999 0.976
UP % of tot. 1989 0.858
UP % of tot. 1979 0.645
UP % of tot. 1969 0.430
UP % of tot. 1960 0.313
Source: WDI & GDF

38
countries with a high degree of urban population in 2009 will experience an urban population
increase the forthcoming years.
5.1.2 Does the geographical location matter?
Recall figure 4.2 displaying the geographical location of the focus countries. All of the urban focus
countries except for one have access to sea, and vice versa for the rural focus countries. It is possible
that this feature has some effect on the degree of urbanization. As discussed in chapter 2, section
2.2.2.1, both Phillipe Bocquier (2004, p. 134) and Ester Boserup (1985, p. 384) claim that
colonialists strategically set up urban centers near coasts and other facilities of infrastructure and that
these urban centers swelled to become cities today. As discussed in section 5.1.1, the extent of urban
population seemingly depends upon the already existing amount of urban population.
Thus, it is possible that the urban focus countries begun developing cities in coastal regions
during the colonial times and that these cities then expanded. Although urban centers ought to have
existed even in regions and countries without direct access to the coast, it is possible that the urban
focus countries were favored and in advantage because of their geographical location. As additional
food for thought, in 1960, Botswana had the least urban population (% of total) of the urban focus
group, and it is the only of the countries that is landlocked.
Although the control group consists of only four countries; three of these have access to sea:
Namibia, Mozambique and Somalia. Zimbabwe, however, is land locked. This suggests that even
though access to coast may have been an advantage when setting up urban centers, it cannot be the
whole cause.
The actual size of the countries appears not to matter much in regards of urban population extent. As
discussed in chapter 4 (and in Appendix III), the difference in actual land area is massive between
the 16 focus countries. Although the rural focus countries on average have smaller land area then the
urban, the countries differ greatly from within the two focus groups. Both the rural- and the urban
focus group represent examples of both some of the largest and some of the smallest countries, area
wise. Therefore, it is difficult to evaluate the impact of land area; should there be any.
5.2 The connection between urban population and population growth
As noted in section 4.2and section 4.3, the rural focus group scores quite high on urban population
growth as well as rural population growth. At a first glance, it does not seem very odd that the
countries with the least urban population have a higher growth in percentages than those countries
with a greater urban population. Realistically, a smaller population needs less in order to grow by a
couple of percent than a larger population. However, this is contested by the fact that the rural focus
countries also have comparatively high rural population growth rates. It suggests that the urban
population growth of the rural focus countries is not solely driven by rural-to-urban migration. If that

39
Table 5.4 Coefficient of
determination (r2): Urban- and
total population growth (annual
%)
Table 5.4 r2 Correlation analysis:
Urban- and total population
growth
was the case, then the rural focus countries ought to have a (much) lower rural population growth.
On the other hand, the urban population growth rates are generally higher than rural population
growth rates. This, then, implies that both rural-to-urban migration as well as a steady urban natural
increase might result in the increasing urban population for the rural focus group. To illustrate this, I
created diagrams displaying rural- and urban population growth in 2009 for the two focus groups
(Figure 5.2 and 5.3).
As we can see, the rural focus countries have steady growth rates for both variables. The
urban focus countries, on the other hand, experience urban population growth but not necessarily
rural population growth.
In three cases of the urban focus countries, the rural population growth is even negative.
Could it be that the reason behind urban population growth
differs between the two focus groups? As it turns out, the rural
focus countries excel at total population growth in 2009 (with
the exception of Ethiopia).
The time lines for population growth were evaluated in section
4.3.2., and they indicated increased total population for all
focus countries since 1960. However, for many countries the
timelines appeared steeper after the beginning of the 1980s.
Many of the urban focus countries had already by 1980 a
comparatively large urban population (see: section 4.3.1).
Hence, the urbanization of the urban focus countries ought to
have been less dependent on increase in total population. The
two regression analyses presented in table 5.4 and 5.5 support
this notion.
Table 5.4 shows that urban population growth correlates with population growth
Dependent: UPG Independent: POPG
Year r2
UPG/POPG 2009 0.660
UPG/POPG 1999 0.774
UPG/POPG 1989 0.308
UPG/POPG 1979 0.271
UPG/POPG 1969 0.295
UPG/POPG 1960 0.050
Source: WDI&GDF
0
2
4
6
Source: WDI&GDF
Figure 5.2 Rural- and urban population growth for the rural focus
countries
Rural population growth (%) 2009 Urban population growth (%) 2009
-2 0 2 4 6 8
Source: WDI&GDF
Figure 5.3 Rural- and urban population growth for the urban
focus countries
Rural population growth (%) 2009 Urban population growth (%) 2009

40
Table 5.5 Coefficient of
determination (r2): Urban- and
rural population growth (annual
%)
Table 5.5 r2 Correlation analysis:
Urban- and rural population
growth
strongly during the most recent decades, only to diminish gradually back in time. Only during the
last 20 years, there seem to be a very strong connection between urban population growth and total
population growth. However, this data does not differentiate between the rural- and the urban focus
countries, it only shows that urban population growth is likely to be fuelled by population growth
today, but not back in time.
That being said, we know that the urban focus countries have a greater urban population and that
some of them had a relatively high urban population extent already in 1960.
Table 5.5 reveals some kind of correlation between urban-and rural population growth during
the last decade. Further back in time, there appears to be no correlation whatsoever. Similarly to the
previous correlation analysis, the correlation ceases into nothingness further back in time than 20
years. This means that, nowadays, urban population growth occurs simultaneously with rural
population growth. Although, the r2 values are not particularly strong which means that this
interpretation should be taken with a grain of salt.
Nevertheless, there seems to be some kind of correlation today
that did not exist before.
In sum, this may indicate that today’s mechanisms of
urban population growth differs from that of earlier time
periods . Up until very recently, there was no connection
between population growth (total population growth and rural
population growth) and urban population growth. Yet the
urban focus countries urbanized during this period, which then
ought to depend heavily on rural-to-urban migration. Today,
thereis a great connection between population growth and
urban population growth, and the rural focus countries
dominate urban population growth. This could indicate a
change in mechanism, where today urban population growth
depend on population growth, while before it was driven by rural-to-urban migration. Yet, it could
also be an indication of different mechanisms depending on at what stage of urbanization a country
is. Perhaps the mechanisms of urban population growth is different in the beginning of an
urbanization process than when a country is already fairly urbanized.
Either way, as stated in section 2.2.2.2, urban population growth in sub-Saharan Africa is
thought to be fuelled by high nativity rather than by rural-to-urban migration. According to the
findings in this thesis, this claim appears to be correct.
5.2.1 Will the populations continue to increase?
In Chapter 2, section 2.2.2.2, the topic of fertility and natural increase was discussed. Some
researches claim that sub-Saharan African urban population growth is mostly driven by natural
increase and that fertility rates are not necessarily lower in urban areas compared to rural. As shown
Dependent: UPG Independent: RPG
Year r2
UPG/RPG 2009 0.349
UPG/RPG 1999 0.383
UPG/RPG 1989 0.006
UPG/RPG 1979 0.033
UPG/RPG 1969 0.085
UPG/RPG 1960 0.015
Source: WDI&GDF

41
in the sections above, this might very well be accurate, since there appears to be a connection to total
population- and urban population growth.
As discussed in sections 4.2 and 4.3, most of the rural focus countries have comparatively high total
fertility rates in 2009, while some of the urban focus countries have very low. It is also possible to
see a greater distinction between the focus groups in year 1960 than 2009. That being said, all of the
focus countries (in fact, all sub-Saharan African countries) but Niger have a lower total fertility rate
in 2009 than they had in 1960 (see: Figure 5.4 and 5.5). At a first glance, then, despite high numbers,
total fertility rates appear to be decreasing.
In section 4.4.3, total fertility rate timelines were evaluated. There it was shown that although
total fertility rates have generally been decreased since 1960, it was usually not a steady decrease. In
several cases, the fertility rates increased at first only to shape an arch on the timeline which then
lead to a steady decrease. Even Niger, which currently has a higher total fertility rate than in 1960,
appears to have crossed its total fertility rate threshold and is now decreasing (see: Appendix II:
Figure II.12). Hence, a decrease in total fertility rate for sub-Saharan Africa might be on its way,
however, the pace is yet undetermined.
On the other hand, life expectancy is incresing. As discussed in section 4.4.4, despite
downturns and the like, the life expectancy rates for all of the 16 focus countries appear to be
increased. One could argue, then, that decreasing fertility rates mean little when life expectancy is on
the upturn. However, ageing can not be improved indefenitely, despite improved living conditions
people will die eventually. Therefore, as long as fertility rates are decreasing, total population growth
might eventually slow down.
0 1 2 3 4 5 6 7 8 9
Source: WDI & GDF
Figure 5.4 Total Fertility Rate (births per woman) for the rural focus
countries
Total Fertility Rate (births per woman) 1960
Total Fertility Rate (births per woman) 2009
0 1 2 3 4 5 6 7 8
Source: WDI & GDF
Figure 5.5 Total Fertility Rate (births per woman) for the urban focus
countries
Total Fertility Rate (births per woman) 1960
Total Fertility Rate (births per woman) 2009

42
5.3 Urban population growth and economic growth
It was mentioned in the introductory chapter and in the literature overview that urbanization is often
associated with economic development. As shown in chapter 4 it is true that the urban focus
countries on average have higher GDP per capita (PPP, constant 2005 international $) than the rural
focus countries, and the control group. Nevertheless, the question is just how strongly economic
growth is connected to urbanzation; or the other way around. The previously mentioned author
Vernon Henderson writes in the article Urbanization in Developing Countries (2002) that, typically,
urban population growth occurs in the beginning of economic development, only to phase out and
become stagnant later on (2002, p. 98). It is not entirely clear what Henderson considers to be the
“beginning of economic development”, but he mentions the shift from agriculture to industry (ibid,
p. 90) which suggests that he might be inspired by traditional economic theories such as Lewis two-
sector model.
Patricia Clark Annez and Robert M. Buckley in Urbanization and Growth: Setting the
Context state that, historically, urbanization and economic growth appears to be strongly connected
to one another as the most wealthy nations have a significant degree of urban population (2009, pp.
3-4). However, their research shows that the process of urbanization is not enough to yield economic
growth for todays less developed countries (ibid, pp. 4-6). Figure 4.2 displayed how the majority of
the urban focus countries have sea access, while the majority of the rural focus countries are
landlocked. As stated in section 2.2.2.1, many urban centers in sub-Saharan Africa were
conveniently located in junctions of various means for infrastructure (Phillipe Bocquier, 2004, p. 13;
Ester Boserup 1985, p. 384). This could have an impact on economic growth because countries with
a shoreline have another means of transportation and infrastructure that those without do not, and
could, to some extent, explain why the urban focus countries have better economic progress. It is
important to distinguish between the variables GDP per capita (PPP, constant 2005 international $)
and GDP growth (%), both which were evaluated in the previous chapter. While the urban focus
countries excelled in GDP per capita, they were inferior to the rural focus countries in terms of GDP
growth (%). This is not so strange, considering that the rural focus countries with their smaller
economies require less real economic growth in order to grow in percentages (similar to the
discussion in section 5.2). What is more interesting is that three of the urban focus countries have
negative GDP growth rates. What comes first, urbanization or economic growth?
In order to shed some light to this, I created charts displaying both urban population (% of
total) and GDP per capita (PPP, current 2005 international $) for some of the urban focus countries.
In figure 5.6 presenting the data for Botswana, we see that the country’s urban population and its
economic growth (in terms of the aforementioned variable) appears to increase more or less
simultaneously. It is also clear that the value of GDP/capita increases by quite a lot, during the
presented years. In figure 5.7, the same data is presented, but for another urban focus country:
Gambia. For Gambia, there is no visible congruence between urban population growth and
GDP/capita. The GDP/capita has not increased by nearly as much as for Botswana either. Same goes
for Gabon and Cameroon, at least partially. Both countries increase their urban population steadily

43
0 20 40 60 80
0
5000
10000
15000
1980
1983
1986
1989
1992
1995
1998
2001
2004
2007
Source: WDI&GDF
Figure 5.6 Botswana: Urban population and GDP/cap
GDP/cap (ppp, constant 2005 international $) Urban population (% of total)
0 20 40 60 80
900 1000 1100 1200 1300
1980
1983
1986
1989
1992
1995
1998
2001
2004
2007
Source: WDI&GDF
Figure 5.7 Gambia: Urban population and GDP/cap
GDP/cap (ppp, constant 2005 international $) Urban population (% of total)
0
50
100
0 5000
10000 15000 20000
1980
1983
1986
1989
1992
1995
1998
2001
2004
2007
Source: WDI&GDF
Figure 5.8 Gabon: Urban population and GDP/cap
GDP/cap (ppp, constant 2005 international $)
Urban population (% of total)
0 20 40 60 80
0
1000
2000
3000 19
80
1983
1986
1989
1992
1995
1998
2001
2004
2007
Source: WDI&GDF
Figure 5.9 Cameroon: Urban population and GDP/cap
GDP/cap (ppp, constant 2005 international $) Urban population (% of total)
0 5 10 15 20
0
500
1000
1980
1983
1986
1989
1992
1995
1998
2001
2004
2007
Source: WDI&GDF
Figure 5.11 Niger: Urban population and GDP/cap
GDP/cap (ppp, constant 2005 international $) Urban population (% of total)
0
5
10
15
0
200
400
600
1980
1983
1986
1989
1992
1995
1998
2001
2004
2007
Source: WDI&GDF
Figure 5.10 Burundi: Urban population and GDP/cap
GDP/cap (ppp, constant 2005 international $) Urban population (% of total)

44
0
5
10
15
0
500
1000
1500
1982
1985
1988
1991
1994
1997
2000
2003
2006
2009
Source: WDI&GDF
Figure 5.13 Uganda: Urban population and GDP/cap
GDP/cap (ppp, constant 2005 international $) Urban population (% of total)
0
10
20
30
0
500
1000
1500
1980
1983
1986
1989
1992
1995
1998
2001
2004
2007
Source: WDI&GDF
Figure 5.12 Burkina Faso: Urban population and GDP/cap
GDP/cap (ppp, constant 2005 international $) Urban population (% of total)
thoughout the years, but GDP/capita does not increase that smoothly, and sometimes not at all.
Although regarding Cameroon, the two variables appear to increase somewhat simultaneously after
the early 90s.
Yet, evaluating economic development is a difficult task. First of all, there are plenty of
variables available, each with advantages and disadvantages. Unfortunately, this study cannot cover
them all. Furthermore, GDP/capita (PPP, constant 2005 international $) does not cover years further
back than 1980, at which point many countries already had a fairly large extent of urban population.
Hence, we cannot know what this relationship looked like earlier. However, the rural focus countries
might yield some insight. At 1980, these countries had lower urban population extent than the urban
focus countries, which might make them more interesting to evaluate. For two of the presented rural
focus countries, GDP/capita appears to increase along with urban population increase; Burkina Faso
and Uganda. Urban population has increased also for Burundi and Niger, but these countries’
GDP/capita has not followed the same pattern. In other words, from these simple timeline graphs,
one cannot conclude that GDP/capita and urban population growth always occur simultaneously, and
likewise, it is not possible to establish what occurs first.
5.3.1 Urban population and proxies connected to economic growth
Looking at the average quintile positioning in section 4.3, it is very clear that the urban focus
countries excel also in variables connected to GDP/capita; namely, health expenditure/capita (PPP,
constant 2005 international $) and the Human Development Index11
. These three variables are also
some of the few where the urban focus countries, the rural- and the control group are aligned
11
However, HDI is calculated using Gross National Income per capita and not GDP per capita, therefore the connection is not direct. However, GDP/capita as an indicator of economic wealth can be used to estimate on what level of economic development a country is. See: Appendix I: section I.2.1 and I.2.2 for detailed information of how these variables are calculated.

45
according to expectation: urban focus countries have the highest values, crontrol group the middle,
and the rural focus countries have the lowest values.
Despite the higher averages in health expenditure and HDI, there are differences among the
urban focus countries, and some have less values than some of the rural focus countries (see: section
4.2), and this is important because it shows that high urban population may not always be connected
to high GDP/capita and other variables based on the former.
Nevertheless, in spite of the high averages in aforementioned two proxies, this is not a
guarantee for better socio-economic standard. As we shall see later, the urban focus countries are not
at (great) advantage regarding some of the socio-economic proxies included, which creates doubt as
to what causes health expenditure and HDI to be so high. It is possible that these two proxies are
heavily influenced by the urban focus countries’ greater economic development which consequently
improves their health expenditure/capita and HDI in comparison.
5.3.2 Why do the urban focus countries excel at economic development?
As stated in the previous sections, it is not possible to tell which of urbanization or economic
development that occurs first, from the data processed in this thesis. It is somewhat of a “hen or the
egg”-issue. However, there is plenty of literature concerned with this particular matter. Some of the
authors already mentioned in this study stress the impact of “agglomeration economies”. In
Economic Development (2009) Todaro and Smith writes that cities are often formed because of an
agglomeration of economy; that is, there is an advantage to both producers and consumers if
everything is allocated and concentrated to one area (Todaro and Smith, 2009, p. 327). Vernon
Henderson states that agglomeration economies benefit companies because of “spillover effects”
where one company can in one way or another use the knowledge accumulated by another company
(Henderson, 2002, p. 91). He means that countries with low economic development must focus on
developing one area (agglomeration/city) at a time (ibid, p. 99).
If this holds true for the urban focus countries, it makes sense that they excel at economic
development. Recall the variable population in the largest city, which is evaluated in the previous
chapter. In section 4.3, it is shown that the urban focus countries have a lower average quintile
positioning then the rural-, regarding this variable. This means that, on average, the rural focus
countries have cities with larger population. This is in contrast to what agglomeration economies
describe; the urban focus countries with their comparatively high GDP/capita ought to have
developed one or two large cities. Likewise, the rural focus countries with high population cities
ought to have better economic development.
However, as shown in Table 4.3, there are four urban focus countries located in quintile 1
and 2 for population in the largest city; Angola, Congo, Gabon and Gambia. Three of these countries
(all but Gambia) are also found in the 1st quintile of GDP/capita, meaning that they might be subjects
to agglomeration of economies after all. Yet, this does not explain why the rural focus countries on
average have cities with larger populations. In section 4.2, Table 4.4, it is shown that also the rural
focus countries have four countries in quintile 1 and 2 for the variable population in the largest city;

46
Burkina Faso, Burundi, Eritrea and Rwanda. But these countries do not do well regarding
GDP/capita. For GDP/capita, Burkina Faso is found in the 3rd
quintile, Burundi and Eritrea in the 5th
and Rwanda in the 4th. As such, the data indicates that while some of the urban focus countries might
follow the logics of agglomeration economies, the rural focus countries do not.
That being said, this topic is gigantic and would on its own constitute a large thesis, if not a volume.
There are plenty of factors regarding this matter, and this study is not merely concerned with
agglomeration economics, let alone economic development. In order to properly evaluate this issue,
one would have to access data much older than 1980, for many more proxies. It would also be
necessary to evaluate all cities and their respective population size for all concerned countries. It
could also be that all of the urban focus countries have in fact gone through and surpassed
agglomeration of economies. Vernon Henderson (2002, p. 99) means that once a country has gained
capital from one focused urban center, it is possible to develop more remote areas and hence even
out the urban population concentration (urban deconcentration). In short, this is a far to complicated
matter to be determined in this study. Yet indicies show that even though agglomeration of
economies might explain the comparatively high GDP/capita for some urban focus countries, this is
not the case for all, and we cannot apply this reasoning to the rural focus countries.
5.3.3 Lewis two-sector model and The Harris-Todaro model on migration
Recall Lewis two-sector model. In short, Lewis’ means that a traditional economy would eventually
become modern through labor force migrating from rural to urban areas. We know for sure that a
couple of sub-Saharan African countries have a large urban population (the urban focus countries),
but have they fulfilled and gone through the other mechanisms of Lewis two-sector model? The
Harris-Todaro model on migration (and the Todaro migration model) suggested that urban
population growth might occur without the expected development, since in some cases
unemployment rates are unreasonably high. Based on the data acquired and the research done in this
study, what can be said about the applicability of these two theories?
Because the urban focus countries have higher GDP/capita than the rural-, it suggests that some sort
of modernization process has occurred. But as noted in previous section, the origin of this economic
development is somewhat hazy. The average quintile positioning for arable land, section 4.3, shows
that the urban focus countries had less arable land than the rural-, both in 1961 and in 2009. The
control group, however, has less arable land than both focus groups. This speaks in favor of both
Lewis two-sector model and Harris-Todaro, as less arable land could indicate a greater focus on
urban employment. (It is not an infallible claim however, since this variable says nothing about
produced goods or effiency thereof.)
Yet, out of the urban focus countries, three are found in quintile 5 of arable land (2009)
(meaning little arable land); Botswana, Congo and Gabon. All these three countries are in the first
quintile of GDP/capita. While this is also in accordance to Lewis’ and Harris-Todaro, South Africa is

47
also found in the 1st quintile of GDP/capita, but in the 2
nd quintile of arable land; meaning
comparatively much arable land. Recall that South Africa in 1960 had by far the largest percentage
of urban population, nearly 50%. With such a history of urbanization, South Africa ought to have
much less arable land today if Lewis’ and Harris-Todaro’s theories were completely applicable.
Moreso, the control group, those with the middle-values of urban population, have less arable land
than both the rural- and the urban focus group, both in 1961 and in 2009. In fact, their average
quintile positioning for arable land is exactly the same in 1961 as in 2009. As such, some countries
behave as if they might have gone through, or are going through, a modernization process as
suggested by (mostly) Lewis, while others do not, assuming that a modernization process would
mean to downsize the agricultural sector.
Both Lewis two-sector model and the Harris-Todaro model on migration are concerned with
employment and the labor force. Lewis’ means that the profits gained will be reinvested and in turn
cause more job opportunities, while Harris-Todaro mean that the amount of job opportunities is
vastly overestimated, yet causes urban population growth because of the perception of available
labor. The results from the testing of the variable labor participation rate is slightly in favor of
Harris-Todaro on this
matter.
The average
quintile positioning of
labor participation rate
was higher for the rural
focus countries than
the urban-. The control
group had the lowest
average quintile
positioning. This is
interesting, because
that can only mean that unemployment is generally greater among the urban focus countries, as
predicted by Harris-Todaro. However, labor participation for the control group ought then to be
higher than that of the urban focus countries.
Figure 5.14 displays the labor participation rate for the two focus groups and the control
group. Clearly, there are some differences, both between the groups and within the groups.
Another factor connected to this is the age dependency. The age dependency ratio calculates
the amount of people of working age to people under- or over working age (under 15 and over 64),
i.e. dependants. Meanwhile, the labor participation rate includes the entire population except for
people under the age of 15. In other words, the labor participation rate includes seniors, while the
age dependendy ratio does not. As discussed in section 4.3, the rural focus countries on average have
a higher age dependency ratio, meaning that these countries have a greater share of dependants than
the urban focus countries. This is particularly interesting because it means that the rural focus
countries, in percent, have an even lesser labor force than indicated by the labor participation rate.
0 20 40 60 80
100
Bu
run
di
Rw
and
a
Mo
zam
biq
ue
Eth
iop
ia
Uga
nd
a
Bu
rkin
a Fa
so
An
gola
Gam
bia
, Th
e
Mal
awi
Bo
tsw
ana
Gab
on
Co
ngo
, Rep
.
Erit
rea
Lib
eria
Som
alia
Cam
ero
on
Zim
bab
we
Nig
er
Nam
ibia
Sou
th A
fric
a
Source: WDI&GDF
Figure 5.14 Labor participation rate (%) 2009: The urban-, rural- and control countries

48
Either that, or the rural focus countries have a greater share of working seniors. As such, the rural
focus countries not only have to support a greater amount of people, their share of working age
citizens may also be smaller in comparison to the urban-.
Recall section 4.4.5 evaluating the timelines of labor participation rate. For most of the urban
focus countries, the timelines were rather static, with only minor up’s and down’s, where South
Africa was among the countries that had improve the most during the time period. Most of the rural
focus countries have also had rather static timelines, although with some mobility. This is interesting
because it indicates that nothing (or very little) has changed regarding labor opportunity during the
last 30 years; despite continuous urban population growth for both of the focus groups. Regardless of
if we want to apply Lewis’ or Harris-Todaro’s theories, we would expect at least some noticable
change to labor participation. In the case of Lewis, it would be assumed that labor activity increases
as more job opportunities emerge. For Harris-Todaro, labor participation ought to decrease along
with urban population growth. As such, the labor participation time lines created in this thesis
confirm neither of the theories. On the other hand, nor do they refute them. After all, labor
participation rates includes all economically active citiziens, and can as such refer to farmers as well
as employed urban citizens and even people working in the informal sector. Yet, it is interesting to
note that the rural focus countries in general have a higher labor participation, especially when
confronted with the inferior GDP/capita. If the urban focus countries’ (comparatively) high
GDP/capita was indeed reinvested to yield job opportunities and increase production as suggested by
Lewis, then why do they have stagnant labor participation rates?
5.4 The socio-economic situation
As is known from previous sections, the urban focus countries excel considerably in terms of
GDP/capita as well as health expenditure and HDI. The two latter are indicators of socio-economic
standard, and as such, it seems as if the urban focus countries are better off regarding this matter than
the rural-, and the control group. However, this is confronted by the fact that the urban focus
countries have less labor participation; where in fact the opposite would be plausible given the better
economic development. In this section, I will bring up the remainder of the tested variables in order
to find out whether they can shed some light on this complicated and contradicting matter.
5.4.1 HDI
The Human Development Index has already been analyzed to some extent in connection to
GDP/capita and health expenditure. As discussed in previous sections of this chapter, the urban
focus countries have, on average, a higher HDI than the rural-, and the control group; but it is not
entirely clear as to what exactly this indicates. It has been stated that the urban focus countries are at
advantage concerning economic development (measured in GDP/capita), something that can affect

49
the corresponding HDI value 12
. The other components of HDI are life expectancy at birth and
mean- and expected years of schooling (UNDP, 2012a). Unfortunately, I was unable to acquire
statistics of the two former due to bad coverage.
As for life expectancy (at birth), it is known from chapter 4 that the urban focus countries on
average had higher life expectancy than the rural in 1960. In 2009 however, the two focus groups
have almost identical
life expectancy. The
control group, in
contrast to the others,
has lower life
expectancy in 2009 than
in 1960 (although, there
is no data for Somalia
for this proxy). As such,
the higher HDI values
for the urban focus
countries (and the
control group) cannot stem from life expectancy (at least not for all countries). While unfortunately
this study does not cover the educational aspect of HDI, the similar life expectancy values indicates
that the HDI values may be under great influence of economic development, rather than societal.
5.4.2 Life expectancies, mortality rates and more
The similar life expectancy values indicate that an urban residence does not guarantee improved
health, despite proximity to institutions issuing health care. This matter has been discussed by
authors and researchers (as outlined in section 2.2.2.2) with the conclusion that there are plenty of
socio-economic barriers in cities which may be difficult to overcome. That being said, it is
interesting to note that both the urban- and the rural focus countries on average have higher life
expectancies than half of sub-Saharan Africa. This suggests that neither an urban- nor a rural
concentration of people may have anything to do with this matter.
However, as has been the case for plenty of other variables, the internal differences in the
two focus groups are huge regarding life expectancy. Therefore, it is really difficult, if not unfair, to
speak of averages, because they cannot be said to be very representative. Yet the differences are in
themselves quite telling; why does one urbanized country have high life expectancy while another
does not?
12 Again, HDI is calculated by values of Gross National Income per capita. See: Appendix I.
0 0.2 0.4 0.6 0.8
Gab
on
Bo
tsw
ana
Nam
ibia
Sou
th A
fric
a
Co
ngo
, Rep
.
An
gola
Cam
ero
on
Uga
nd
a
Rw
and
a
Gam
bia
, …
Mal
awi
Eth
iop
ia
Zim
bab
we
Bu
rkin
a …
Lib
eria
Mo
zam
biq
…
Bu
run
di
Nig
er
Erit
rea
Som
alia
Source: UNDP
Figure 5.15 HDI 2009: Ranked from highest to lowest: The urban-, rural- and control countries

50
Tim Dyson has written an article called HIV/AIDS and Urbanization (2003) which, as the title
suggests, is concerned with the correlation between HIV/AIDS and urban areas, in particular in sub-
Saharan Africa. Dyson (2003, pp. 428-429) states that almost always, HIV prevalence is higher in
urban areas than in rural, and he gives several examples of countries who are among the focus
countries of this thesis. Dyson (ibid, p. 430) points out that this does most likely not mean that
countries with a large urban population ultimately have greater prevalence of HIV, rather that HIV
prevalence is likely to be greater in urban areas regardless of the urban population size. The reason
for this is because of the population density; more people to get in touch with, more sexual
interactions, greater use of drugs et cetera (ibid, p. 429). Dyson (ibid, p. 432-433), states that the
impacts of HIV/AIDS can be disastrous for a country; especially in terms of mortality rates, birth
rates, basically population growth overall. He (ibid, p. 433) means that HIV/AIDS may have a
negative effect on
urbanization; not only
does it reduce the
population size overall,
it may also alter the
migration patterns, he
argues, and people who
fall ill often move back
to a family member’s
settlement in rural
areas.
As noted in
section 4.3, the urban
focus countries have on
average greater
prevalence of HIV than
the rural focus
countries (although the
control group has a greater average than both of them). Yet the differences in HIV prevalence differs
greatly between the urban focus countries (see: Table 4.3) where Botswana and South Africa have
much higher rates. Figure 5.16 displays both urban population and prevalence of HIV for year 2009,
where countries are ranked from highest level of HIV prevalence to lowest. Even though the urban
focus countries had a higher average quintile positioning regarding this variable, there is no clear
visible connection in figure 5.16. Furthermore, the control group had higher average (greatest HIV
prevalence) than any of the focus groups, despite their lesser amount of urban population.
Additionally, the rural focus group lacked an entry (Ethiopia) which might have contributed to a
lower average. As such, it appears as Dyson is right when he stated there is probably no correlation
between urbanization and HIV prevalence on an aggregate level. However, the countries with a great
HIV prevalence might suffer great consequences thereof.
0 10 20 30 40 50 60 70 80 90
Bo
tsw
ana
Sou
th A
fric
a
Zim
bab
we
Nam
ibia
Mo
zam
biq
ue
Mal
awi
Uga
nd
a
Cam
ero
on
Gab
on
Co
ngo
, Rep
.
Bu
run
di
Rw
and
a
An
gola
Gam
bia
, Th
e
Lib
eria
Bu
rkin
a Fa
so
Erit
rea
Nig
er
Som
alia
Eth
iop
ia
Source: WDI&GDF
Figure 5.16 Urban Population (% of total) 2009 and Prevalence of HIV 2009 (ranked from highest to lowest
Prevalence of HIV)
Urban population (% of total) 2009 Prevalence of HIV (%)2009

51
Dyson (2003, p. 432-433) mentions birth rates as a declining factor due to HIV/AIDS, and
true enough, Botswana and South Africa are both in the fifth quintile of total fertility rate (i.e. very
low fertility rate). Likewise, Namibia and Zimbabwe are also located in the fifth quintile, while
Mozambique is in the third.
On the other hand, Botswana and South Africa are in the third quintile of life expectancy;
some kind of mid-value of sub-Saharan Africa. Zimbabwe is in the 4th
quintile and Mozambique in
the fifth, indicating very low life expectancy. Namibia, however, is in the first quintile and has, as
such, one of the highest life expectancies of all of sub-Saharan Africa. This is interesting, then,
because while there might be a connection between HIV/AIDS and fertility rates based on the
studies conducted in this thesis, the same cannot be said (as clearly) for life expectancy.
Nevertheless, there could be plenty of reasons for why these countries have comparatively low
fertility rates, it surely does not only depend on the HIV prevalence.
One factor that might affect fertility rates is the mortality rate of chilren and infants. Mortality rates
of children and infants are also good indicators of a country’s distribution of health care, mainly
maternal health care. As noted in section 4.3, the rural focus countries have, on average, the highest
mortality rates, second comes the control group and third, the urban focus countries. Yet there are
great differences of the actual life expectancy.. As such, the averages are hardly useful, and mortality
rates are likely to depend on something other than level of urban population.
5.5 Summary of analyses
If anything, this study has shown how extremely complex and multifacetted this process is. It is
questionable whether it is one process or in fact several interacting processes. In a way, the findings
of this study suggests that the process of urbanization and urban population growth must be seen
from more than one point of view. On the one hand, it is possible to discuss and possibly theorize the
actual mechanicsof urban population growth; how it happens. On the other hand, it is much more
difficult to evaluate the actual impacts of urbanization and urban population growth, and its
consequences.
5.5.1 What has urbanization lead to?
The two factors where the rural- and urban focus countries differ the most are population growth and
economic development. Yet even for these variables nothing is set in stone. As the findings and
analyses have shown, there may be averages pointing one way or the other, but within the focus
groups there are differences too huge to overlook.
Regarding the socio-economic variables, there were very few cases where one group or the other
appeared to have an advantage or disadvantage of some sort. As discussed in previous sections, the

52
urban focus countries do excel at HDI and health expenditure, but it is unclear as to what this truly
means; one would expect more funded health care to lead to higher life expectancy, but as the data
has shown, there is no such indication. Likewise, a greater GDP/capita suggests better working
opportunities, but neither that could be confirmed. From the results of this study, then, it is not
possible to tell whether urban population growth and urbanization directly causes improvement in
living standards.
As for pure economic development, yes, it is true that the urban focus countries on average
have higher GDP/capita than the rural. Yet the greatest question of them all remains: why is that?
Despite involving a multitude of factors such as historical data, labor participation, gerographical
location et cetera, I was unable to pinpoint a convincing enough reason. Most of all, the great
differences in actual GDP/capita of the focus countries causes some doubt as to if there is a strong
connection at all. Everything suggests that urbanization is an extremely complicated process
dependent on a multitude of factors, circumstances, conditions and even time.
The reality is that sub-Saharan Africa is extremely diverse regarding most proxies tested in this
thesis. Averages have been used, focus groups were selected, but as the findings and analyses show,
these were rarely representative. From the very beginning when the focus groups were selected
according to urban population (%) rank, it was clear that the degree thereof differed by a lot even
within the urban- and rural focus countries.
When a couple of countries scored similar quintile positionings, the actual values often differ
greatly. Even in those cases where the majority of the countries belonging to one focus group have
roughly similar values and positionings, they do not all do; there is always one or two countries
breaking the pattern.
Regarding the urban focus countries, Liberia often stands out by being somewhat malplaced
in comparison to the other countries. For example, Liberia scores high on nearly all variables
connected to population growth (in contemporary time) a property which, as we know, is mostly
connected to the rural focus countries. For proxies where the urban focus countries tend to excel
(GDP/capita, HDI, health expenditure), Liberia scores remarkably low in comparison and often
lower than many rural focus countries. As such, Liberia is a bit of an exception; not only does the
country lower the averages for the urban focus countries but it also questions the few factors that
actually appeared to be affected by/impacted urbanization.
Likewise, despite being part of the control group, Namibia often follows the same “pattern”
the urban focus countries do, but also with “better” scores in many socio-economic proxies. In
contemporary time, Namibia has low population growth, low fertility rate, high HDI, low GDP
growth, high GDP/capita, high life expectancy, low mortality rate and high health expenditure.
All of this suggests that if one seek to understand the impacts of urbanization and urban population
growth, a very detailed and encompassing studied must be made. And even so, it is doubtful that
there will be clear indicies of advantages or disadvantages. It could simply be that while urbanization
occurs in many countries, the consequences thereof are extremely individual and dependent on so
many more factors than just urban population growth.
53
This study has shown that these kind of generalizations of sub-Saharan Africa are often
misleading, because while the region on a global level might be “poor” or “less developed”, the
countries within the region often differ greatly between each other. The findings and analyses
suggest that, in order to understand the socio-economic factors of urbanization, one must look
beyond Lewis two-sector model, Harris-Todaro model on migration and other theories that do not
allow for national differences. Furthermore, the time perspective of this study has indicated that the
very dynamics of urbanization change over time, and therefore, older theories might not be very
useful in trying to understand contemporary dynamics.
5.5.2 The contemporary mechanics of urban population growth
The result of this study suggests, that, while it is difficult to find any connection between
urbanization and socio-economic development, it might be possible to theorize the process of urban
population growth, on a rather general level. As discussed in Chapter 2, researchers and authors have
debated the fact that urban population growth is no longer mainly constituted by rural-to-urban
migration, and the findings of this thesis supports this claim. Nowadays, urban population growth
correlates with both total population growth and rural population growth. Some decades ago, this
synergy did not exist. It could be that in the beginning of an urbanization process, the mechanisms
for urbanization and urban population growth differ from that when a country is already fairly
urbanized. It could also be that, nowadays, the mechanisms of urban population growth depend
mostly on population increase while some decades ago, it relied mostly on rural-to-urban migration.
Section 5.1.1 revealed that urban population growth is highly dependent on pre-existing urban
population growth. All data point to a continuing increase in urban population for rural- and urban
focus countries alike, there seems to be no threshold where urban population growth somehow
becomes saturated. Both Lewis two-sector model and Harris-Todaro are examples of theories
suggesting that urbanization will at one point or another reach an equilibrium where rural-to-urban
migration stops occuring (see: section 2.1.2.1). While this might in part be true, it overlooks the fact
that cities and urban areas grow from within; people reproduce. As such, urban population growth
migth just have much more to do with regular demographic than socio-economic incentives, at least
in contemporary time.
That being said, this conclusion is yet again dependent on the scores from a majority of the
countries, but not all of them. There are differences concerning population growth; Ethiopia, for
example, stands out by scoring comparatively low in comparison to the other rural focus countries
regarding most demographic variables. Liberia has significantly high ratings on demographic
variables, despite being part of the urban focus countries.
54
6. Conclusion
In the final chapter of this thesis, I will return to the research problem and the research questions to
see if the objective of this thesis has been met, and if the findings of this study yielded enough
information to untangle some of the complexities of urbanization and urban population growth.
6.1 The research questions
In the beginning of this thesis, I formulated three research questions that captured the research
problem. In this section, I will review the questions one by one.
In sub-Saharan Africa,
o what does the distribution of urban population look like for the different countries and what
can be said about the mechanisms of urban population growth and urbanization?
In contemporary time, the urban population differs greatly between the countries of sub-Saharan
Africa. Some countries have approximately 10% urban population, while another has nearly 80%.
Figure 5.1 displays urban population (% of total) in year 2009 for all sub-Saharan African countries,
and it is clear that the region is very diverse in this regard.
Even as far back as in 1960, the urban population extent was very different for the countries.
While the rural focus countries had relatively low urban population extent even in the 1960’s, there
was no such distinguishable pattern for the urban focus countries. While some of the urban focus
countries had comparatively high urban population extent already back then, some had relatively low
rates; and Botswana had even lower urban population extent than some of the rural focus countries.
In sub-Saharan Africa,
o … are the countries with the more urban population generally better off in terms of socio-
economic development than countries with less urban population?
The urban focus countries typically have higher HDI and health expenditure/capita than the rural-.
However, it is not clear if this truly indicates higher socio-economic standard. The reason for this
doubt is, as discussed in section 5.4, the fact that the urban countries have much higher values of
GDP/capita while still having roughly similar values of life expectancy and mortality rate (under-5)
as the rural focus countries. Because life expectancy is one component of HDI, it is safe to say that
life expectancy is not what causes the urban focus countries to have average HDI values.
The labor participation rate is actually higher for the rural focus countries than the urban-,
and according to the time line charts, it has not changed much last few decades. This means that
even though the urban population has continuously increased, labor opportunities have not
necessarily done so.
55
The urban focus countries have, on average, greater prevalence of HIV (although the control
countries have the highest average of them all). Tim Dyson (2003, pp. 429-430) claims that urban
centers typically have greater prevalence of HIV because of the close proximity to people. However,
as the control countries also have great HIV prevalence and since two of the rural focus countries
also have comparatively high rates, it could just mean that there is a greater likeliness for the urban
focus countries to have greater prevalence of HIV because of their greater urban population extent.
In sum, it is not possible to detect any socio-economic advantage or disadvantage in relation to urban
population extent. The urbanized countries excel at the economic variables, but it is not clear what
this actually means in terms of socio-economic development.
In sub-Saharan Africa,
o … what can be said about the mechanisms of urban population growth and urbanization,
and, taken together, will the answer to these questions contribute to an explanation of to
what extent the mechanisms of urbanization and urban population growth can be
generalized for the region?
It was suggested in the literature overview, Chapter 2, that urban population growth in sub-Saharan
Africa today is mostly driven by high nativity (White et al, 2008, p. 302). The analyses made in this
thesis support this claim, which is then in contrast to both the Lewis two-sector model and the
Harris-Todaro model on migration that both consider urban population growth to depend on rural-to-
urban migration. That being said, as discussed in section 5.2, it seems as if rural-to-urban migration
still contributes to urban population growth, but to a smaller extent.
The Lewis two-sector model describes the perceived transition from a traditional society to a
modern. Urbanization and urban population growth is thought to bring about economic growth and
job opportunities. It is true that the urban focus countries generally excelled at GDP/capita and
proxies connected to economic development. Yet there are many questions left unanswered. Figure
5.6-5.13 presented time lines of GDP/capita and urban population growth, and only for a few
countries did these two proxies grow simultaneously. The data of labor participation rate showed that
the rural focus countries in fact had higher averages than the urban-.
Likewise, the timelines of labor participation revealed little change on the labor market last
few decades. This is, however, in line with the reasoning of the Harris-Todaro model on migration
which predicts that urban population growth might lead to high rates of unemployment.
However, both the Lewis two-sector model and the Harris-Todaro model on migration are
theories that predict an eventual end to rural-to-urban migration. While they might be somewhat
correct in this regard, they overlook the fact that cities grow from within; that population increase
alone contributes to urban population growth. The findings of this thesis reveal no signs of a halt to
urban population growth.
As such, it is very difficult to evaluate the mechanisms or urban population growth and urbanization.
While it appears to be mostly fuelled by nativity nowadays, it is not given what this leads to. The

56
urban focus countries generally have higher GDP/capita, but it is not clear whether urbanization or
economic development comes first. Finally, there have hardly been any differences on the labor
market for the urban focus countries lately, and they have, on average, inferior labor participation
rate to the rural focus countries. Hence, it is neither sure what a comparatively high GDP/capita truly
means.
Overall, two aspects of urbanization has the potential to be generalized and theorized. The first is the
question of what drives urban population growth. The second is the connection between urbanization
and economic growth.
Nowadays, there is a connection between urban population growth and regular population growth. In
section 5.2, it was concluded that there is a correlation between these two factors and that this
correlation did not exist a couple of decades ago.
In other words, the urban focus countries experienced their urban population growth without
this covariation to population growth. Today the rural focus countries represent the highest urban
population growth rates, as well as the highest total population growth and rural population growth.
At the same time, also the urban focus countries continuously increase their urban population, and as
the correlation analyses has shown, this is also likely to depend on total population growth rather
than rural-to-urban migration. That being said, rural-to-urban migration is not at all obsolete; as
stated in section 5.2, rural-to-urban migration exists, but it is probably not the driving force behind
urban population growth.
It is possible that rural-to-urban migration used to fuel urban population growth, but that
nowadays it has been replaced in favor of intra-city population growth. Yet it could also be that the
mechanisms of urban population growth changes as the urban population extent increases; while the
urban focus countries might have begun their urbanization process mainly through rural-to-urban
migration, it could nowadays be driven mainy by natural increase.
This recent connection between population growth and urban population growth and how it
relates to rural-to-urban migration could be the foundation of a new theoretical platform regarding
urbanization. With furher studies, it would be possible to shed further light on this matter and further
explore the dynamics.
The urban focus countries turned out to dominate economic factors (GDP/capita, HDI and health
expenditure). That is in line with the classic notion of urbanization as a modernization process. Yet,
it was not possible to establish whether urbanization enables economic development, or the other
way around. Likewise, increase in GDP/capita did not necessarily occur simultaneously with urban
popultion growth.
While it is possible to say that urbanized countries generally have higher GDP/capita, it is not
given what impact this has on socio-economic development. The urban focus countries were not
convincingly superior in any of the socio-economic variables aside from HDI and health
expenditure.

57
On the whole, sub-Saharan Africa is a very diverse region, not only in regards of urban population.
For nearly every variable tested, the differences were great country-wise; both in actual numbers and
in quintile positioning. Not even the focus groups, that were deliberately selected in order to be
representative, were very unanimous in their extent of urban population.
Even when the focus groups appeared to stand out as being at either one end of the scale or
the other, there were still one or more country breaking the pattern. For example, most of the urban
focus countries were located in one of the top quintiles of HDI, but Liberia was located in the fifth,
hence last quintile. Even though there are indicies of properties belonging to either of the focus
groups, there are exceptions of countries not following the rule.
In sum, one could say that while urban population growth and economic growth appear
generalizable, socio-economic- status and development does not.
In the end, I believe that the most important finding of this thesis is that urbanization and
urban population growth is a very complex process. Despite analyzing a multitude of variables for
several time periods, only a few correlations could be detected. And even for these correlations, not
all countries followed the pattern.
6.2 What could have been done differently?
In hindsight, I realize that some of the procedures used in this thesis could have been done
differently in order to obtain a different and perhaps more satisfying result.
First of all, instead of selecting my focus countries based on urban population (% of total), I
could have used the variable urban population growth (annual %) as the determining factor. That
way, it is possible that I would have gained greater insight on the mechanisms of urban population
growth. Based on the results of this thesis, I could, for example, have selected the countries with the
highest urban population growth in year 2009 and compared them to the fastest growing countries in
1970. This would have been an excellent complement to the findings regarding total population
growth versus rural-to-urban migration. Table 6.1 shows the urban population growth (annual %) of
year 2009 and 1960. As we can see, the growth rates are much higher in 1970 than in 2009 and it
would be extremely intresting to dig deeper into this.
Secondly, I used average quintile positioning as a means to compare the two focus groups
(and the control group) to each other. While this lead to some insights, the averages were often
questionable because many times, the countries were very scattered on the table. While some
countries of a focus group had a high quintile positioning, some had low, causing the average to end
up somewhere in the middle. In a sense, the focus countries were much less coherent to each other
than expected.
Thirdly, despite my attempt to investigate as many proxies as possible, for as many years as
possible, I realized that it would have been beneficial to evaluate many more factors. Urbanization is
such a complex process with so many factors involved and interlinked, and it is near impossible to
determine what factor affects the other and in what way. I would have liked to examine many more
socio-economic variables. This would have granted further insights both in the relation between

58
Source: WDI & GDF
socio-economic development and urbanization and urban population growth, and also pure economic
development. Inequality indexes and income distribution values would have been very interesting to
incorporate.
Finally, there are several variables I would have like to examined for more years. As table 6.1
suggests, perhaps I should have examined urban population growth for more years than 2009 and
1960.
6.3 Future studies of urbanization and urban
population growth
Despite my attempt to try to understand the
mechanisms of urban population growth and increase
the understanding of the urbanization process in sub-
Saharan Africa, this study has, if anything,
underscored the complexity of these matters.
In this thesis, I have found indicies that urban
population growth nowadays might be driven mainly
by population growth and not rural-to-urban
migration. The latter still occurs, but likely to a lesser
extent than previously expected. How these two
mechanisms fit together is yet unknown. What I found
is that only during the two most recent decades, there
is a strong correlation between urban population
growth and regular population growth. Future studies
inspired by these findings have the potential to yield
great insights and possible the formulation of a new theoretical framework.
Furthermore, the connection between economic development, socio-economic development
and urbanization is very unclear in sub-Saharan Africa. The region is expected to increase its’ urban
population rapidly, and the findings in this thesis supports that. Studies regarding this aspect might
prove to be very useful because it is so uncertain what urbanization and urban population growth
actually causes.
6.4 Concluding remarks
The objective of this study was to try to untangle some of the complexities regarding urban
population growth and urbanization in sub-Saharan Africa.
In the introductory chapter of this thesis, I discussed the lack of a theoretical consensus to
explain urbanization and urban population growth in sub-Saharan Africa, and it was my intention to
Highest Urban Pop. Growth (annual %) 2009
Liberia 5.86
Malawi 5.70
Burundi 5.67
Burkina Faso 5.10
Eritrea 5.10
Mali 4.79
Tanzania 4.64
Sudan 4.54
Highest Urban Pop. Growth (annual %) 1970
Botswana 14.00
Togo 9.92
Swaziland 9.59
Mauritania 9.23
Tanzania 8.06
Zambia 7.97
Gambia 7.95
Chad 7.91
Table 6.1 Countries with the highest
Urban Population Growth (annual %)
2009 and 1970
Source: WDI & GDF

59
try to shed some light on this matter. Yet I have found that urbanization and urban population growth
are so complicated and intertwined with several other factors, and that the region of sub-Saharan
Africa is very diverse regarding so many things. I have learned that even though patterns might be
spotted and traces of correlations can be seen, there will always be another factor; another country;
or another time period which questions that perception, and it appears near impossible to discover
them all.

60
References
Published sources
Annez, P., C.; Buckley, R., M. Urbanization and Growth: Setting the Context. In: Spence, M.,
ed; Annez, P., C., ed.; Buckley, R., M., ed. (2009) Urbanization and Growth. Washington:
Commission on Growth and Development. Ch. 1.
Bocquier, P. Analyzing Urbanization in Sub-Saharan Africa. In: Champion, T., ed; Hugo, G., ed.
(2004) New Forms of Urbanization – Beyond the Urban-Rural Dichotomy. England: Ashgate
Publishing Limited. Ch. 7.
Boserup, E. (1985) Economic and Demographic Interrelationships in sub-Saharan Africa.
Population and Development Review, 11(3), pp. 383-397.
Creswell, J., W. (2009) Research Design – Qualitative, Quantitative, and Mixed Methods
Approaches 3rd
ed. California: Sage Publications, Inc.
Djurfeldt G, Larsson, R, Stjärnhagen, O. (2010) Statistisk Verktygslåda 2nd
ed. Studentlitteratur.
Dyson, T. (2003) HIV/AIDS and Urbanization. Population and Development Review, 29(3), pp.
427-442.
George, A., L.; Bennett, A. (2005) Case Studies and Theory Development in the Social Sciences.
Cambridge: Belfer Center for Science and International Affairs.
Harris, R., J.; Todaro, P., Michael. (1970) Migration, Unemployment and Development: A Two-
Sector Analysis. The American Economic Review, 60(1), pp. 126-142.
Henderson, V. (2002) Urbanization in Developing Countries. The World Bank Research
Observer, 17(1), pp. 89-112.
Kasarda, D., J.; Crenshaw, M., E. (1991) Third World Urbanization: Dimensions, Theories, and
Determinants. Annual Review of Sociology, 17, pp. 467-501.
Mishra, G., P. (1969) Development Policy and Planning. Economic and Political Weekly, 4(21)
pp. 879, 881-883, 885-886.
Montgomery, M. (2009) Urban Poverty and Health in Developing Countries. Population
Bulletin, 64(2). Population Reference Bureau.
61
Montgomery, M. (2008) The Demography of the Urban Transition: What We Know and Don’t
Know. In: Martine, G., ed; McGranahan, G., ed; Montgomery, M., ed; Fernandez-Castilla, R.,
ed. (2008) The New Global Frontier – Urbanization, Poverty and Environment in the 21st
Century. UK/USA: Earthscan. Ch. 1.
Tacoli, C., McGranahan, G., Satterthwaite, D. Urbanization, Poverty and Inequity: Is Rural-
Urban Migration a Poverty Problem, or Part of the Solution? In: Martine, G., ed; McGranahan,
G., ed; Montgomery, M., ed; Fernandez-Castilla, R., ed. (2008) The New Global Frontier –
Urbanization, Poverty and Environment in the 21st Century. UK/USA: Earthscan. Ch. 2.
Todaro, P., M.; Smith, C., S. (2009) Economic Development 10th ed. England: Pearson Education
Limited
White, J., M.; Mberu, U., B.; Collinson, A., M. African Urbanization: Recent Trends and
Implications. In: Martine, G., ed; McGranahan, G., ed; Montgomery, M., ed; Fernandez-Castilla,
R., ed. (2008) The New Global Frontier – Urbanization, Poverty and Environment in the 21st
Century. UK/USA: Earthscan. Ch. 18.
Woods, H., C. (1982) Equilibrium and Historical-Structural Perspectives on Migration.
International Migration Review, 16(2) (Special issue: Theory and Method in Migration and
Ethnic Research) pp. 298-319.
Online sources
UNDP (2012a) Human Development Index (HDI) [Online] http://hdr.undp.org/en/statistics/hdi/
[Accessed: 2012-04-16]
UNDP (2012b) Do-It-Yourself Data Tables [Online] http://hdrstats.undp.org/en/tables/
[Accessed: 2012-03-23]
UNFPA (2007) State of the World Population – Unleashing the Potential of Urban Growth
[Online] http://www.unfpa.org/swp/2007/presskit/pdf/sowp2007_eng.pdf
[Accessed: 2012-05-26]
UNSD (2011) Composition of Macro Geographical (continental) Regions, Geographical Sub-
regions, and Selected Economic and Other Groupings [Online]
http://unstats.un.org/unsd/methods/m49/m49regin.htm#developed
[Accessed: 2012-02-07]
62
World dataBank (2012) World dataBank – World Development Indicators (WDI) & Global
Development Finance (GDF) [Online] http://databank.worldbank.org/ddp/home.do
[Accessed: 2012-04-15]
World Bank (2012a) [Online] http://www.worldbank.org/
[Accessed: 2011-12-12]
World Bank (2012b) Data Overview [Online] http://data.worldbank.org/about/data-overview
[Accessed: 2012-03-12]
World Bank (2012c) Methodologies [Online] http://data.worldbank.org/about/data-
overview/methodologies
[Accessed: 2012-03-12]
World Bank (2012d) Urban Population (% of total) [Online]
http://data.worldbank.org/indicator/SP.URB.TOTL.IN.ZS
[Accessed: 2012-02-08]
World Bank (2012e) Urban Population Growth (annual %) [Online]
http://data.worldbank.org/indicator/SP.URB.GROW
[Accessed: 2012-02-13]
World Bank (2012f) Rural Population (% of total) [Online]
http://data.worldbank.org/indicator/SP.RUR.TOTL.ZS
[Accessed: 2012-02-15]
World Bank (2012g) Rural Population Growth (annual %) [Online]
http://data.worldbank.org/indicator/SP.RUR.TOTL.ZG
[Accessed: 2012-02- 22]
World Bank (2012h) Population, Total [Online]
http://data.worldbank.org/indicator/SP.POP.TOTL
[Accessed: 2012-03-01]
World Bank (2012i) Population Growth (annual %) [Online]
http://data.worldbank.org/indicator/SP.POP.GROW
[Accessed: 2012-02-18]
World Bank (2012j) Land Area (sq. km.) [Online]
http://data.worldbank.org/indicator/AG.LND.TOTL.K2
[Accessed: 2012-02-15]
World Bank (2012k) Fertility Rate, Total (births per woman) [Online]
http://data.worldbank.org/indicator/SP.DYN.TFRT.IN
[Accessed: 2012-02-15]

63
World Bank (2012l) GDP per capita, PPP (constant 2005 international $) [Online]
http://data.worldbank.org/indicator/NY.GDP.PCAP.PP.KD
[Accessed: 2012-02-15]
World Bank (2012m) GDP per capita (current US$) [Online]
http://data.worldbank.org/indicator/NY.GDP.PCAP.CD
[Accessed: 2012-02-13]
World Bank (2012n) GDP Growth (annual %) [Online]
http://data.worldbank.org/indicator/NY.GDP.MKTP.KD.ZG
[Accessed: 2012-02-08]
World Bank (2012o) Arable Land (% of land area) [Online]
http://data.worldbank.org/indicator/AG.LND.ARBL.ZS
[Accessed: 2012-02-11]
World Bank (2012p) Life Expectancy at Birth, total (years) [Online]
http://data.worldbank.org/indicator/SP.DYN.LE00.IN
[Accessed: 2012-02-12]
World Bank (2012q) Mortality Rate, under-5 (per 1,000 live births) [Online]
http://data.worldbank.org/indicator/SH.DYN.MORT
[Accessed: 2012-02-18]
World Bank (2012r) Labor Participation Rate, total (% of total population ages 15+) [Online]
http://data.worldbank.org/indicator/SL.TLF.CACT.ZS
[Accessed: 2012-02-18]
World Bank (2012s) Health Expenditure per capita, PPP (constant 2005 international $)
[Online] http://data.worldbank.org/indicator/SH.XPD.PCAP.PP.KD
[Accessed: 2012-02-13]
World Bank (2012t) Prevalence of HIV, total (% of population ages 15-49) [Online]
http://data.worldbank.org/indicator/SH.DYN.AIDS.ZS
[Accessed: 2012-02-15]
World Bank (2012u) Age Dependency Ratio (% of working-age population) [Online]
http://data.worldbank.org/indicator/SP.POP.DPND
[Accessed: 2012-02-13]
World Bank (2012v) Population in the Largest City (% of urban population) [Online]
http://data.worldbank.org/indicator/EN.URB.LCTY.UR.ZS
[Accessed: 2012-02-21]

64
Source: WDI & GDF
Appendix I
In this appendix I offer a more thorough explanation of definitions of concepts and variables used in
this thesis; as well as how and why they were selected and derived.
I.1 The definition of sub-Saharan Africa
I.1.1 The original definition of sub-Saharan Africa
In this thesis, sub-Saharan Africa is defined according to the definition outlined by the United
Nations Statistics Division (UNSD). The UNSD defines sub-Saharan Africa in the following way
“…the designation sub-Saharan Africa is commonly used to indicate all of Africa except northern
Africa, with the Sudan included in sub-Saharan Africa.” (UNSD, 2010). According to UNSDs site,
sub-Saharan Africa then comprises the following countries and entities: Angola, Benin, Botswana,
Burkina Faso, Burundi, Cameroon, Cape Verde, Central African Republic, Chad, Comoros, Congo,
Côte d’Ivoire, Democratic Republic of the Congo, Djibouti, Equatorial Guinea, Eritrea, Ethiopia,
Gabon, Gambia, Ghana, Guinea, Guinea-Bissau, Kenya, Lesotho, Liberia, Madagascar, Malawi,
Mali, Mauritania, Mauritius, Mayotte, Mozambique, Namibia, Niger, Nigeria, Réunion, Rwanda,
Saint Helena, Sao Tome and Principe, Senegal, Seychelles, Sierra Leone, Somalia, South Africa,
Sudan, Swaziland, Togo, Uganda, United Republic of Tanzania, Zambia, Zimbabwe.
I.1.2 Excluded countries
Although this thesis bases its definition of sub-Saharan Africa on the above mentioned definition,
some countries and entities are excluded. First of all, the overseas- departments and territories have
been excluded: that is, Réunion, Saint Helena and Mayotte. Secondly, since this thesis assesses data
from 2009 the latest and because of the country’s recent
establishment, South Sudan is not included either (although
technically, it is part of Sudan because of the old statistics).
Thirdly, I have applied a delimitation based on total
population. A great part of this thesis will include variables
consisting of- or depending on demography, and therefore too
small populations might distort the result. As such, all
countries with less than 1 million inhabitants in year 2009 are
excluded. The affected countries are presented in Table 3.1.
Country name Population Cape Verde 491,621 Comoros 715,774
Djibouti 872,090
Equatorial Guinea 681,115
Sao Tome and Principe 162,515
Seychelles 87,298
Table I.1 Countries with less than 1 million inhabitants (2009) (2009)
65
Figure I.1 Border marking sub-
Saharan Africa
I.1.3 The final definition of sub-Saharan Africa
Thus, the original UNSD definition has been reduced, and the
final definition of sub-Saharan Africa used in this thesis consists
of 42 countries: Angola, Benin, Botswana, Burkina Faso,
Burundi, Cameroon, Central African Republic, Chad, Congo,
Côte d’Ivoire, Democratic Republic of the Congo, Eritrea,
Ethiopia, Gabon, Gambia, Ghana, Guinea, Guinea-Bissau,
Kenya, Lesotho, Liberia, Madagascar, Malawi, Mali,
Mauritania, Mauritius, Mozambique, Namibia, Niger, Nigeria,
Rwanda, Senegal, Sierra Leone, Somalia, South Africa, Sudan,
Swaziland, Togo, Uganda, United Republic of Tanzania,
Zambia and Zimbabwe. In Figure 3.1, the region below the red
border constitutes sub-Saharan Africa according to the original
UNSD definition.
I.2 Definition of variables
In this sub-section I will define and explain the various variables used in this thesis and their
respective sources.
I.2.1 Variables obtained from the WDI & GDF
Urban population (% of total) is defined as “…people living in urban areas as defined by national
statistical offices.” (World Bank, 2012d). It is measured with data from the World Bank and the
United Nations World Urbanization Prospects (ibid).
This variable will constitute the core of this thesis as it is the dependent factor. Countries
based on their urban population (% of total) will be analyzed. See section 1.4, 1.5.2 and chapter 4 for
further elaboration. Even though it is not directly measured in this thesis, it is worth mentioning that
rural population (% of total) is the remaining percentages of urban population (% of total) (World
Bank, 2012f). Therefore, the percentage of rural population can easily be estimated whenever a
number revealing urban population is given.
Urban population growth (annual %) is defined and calculated in the same way as urban
population (% of total) (World Bank, 2012e).
The growth rate will be used to understand the dynamics of urbanization and urban
population growth; both in the present and in the past.
66
Rural population growth (annual %) is defined and calculated in the same way as rural population
(% of total) (World Bank, 2012g).
Although this thesis focuses on urban areas, evaluating its rural counterpart can reveal
information of, for example, population flows. As such, this variable is a complement to urban
population growth.
Population, total includes “…all residents regardless of legal status or citizenship--except for
refugees not permanently settled in the country of asylum, who are generally considered part of the
population of their country of origin.” (World Bank, 2012h).
Since this thesis is concerned with populations and population flows, it seems relevant to
widen the scope a little further. It is possible that urban population growth is connected to total
population.
Population growth (annual %) is based on the same definition as total population and is calculated
in the following way “ [the] … rate for year t is the exponential rate of growth of midyear population
from year t-1 to t, expressed as a percentage .” (World Bank, 2012i).
Similar to that of urban- and rural population growth rate, this variable might possibly yield
information about the dynamics of urban population growth and extent.
Land area (square kilometers) refers to the “…country's total area, excluding area under inland
water bodies, national claims to continental shelf, and exclusive economic zones.” (World Bank,
2012j).
Geography overall is rarely included in research concerning urbanization. But as suggested in
section 2.2.2.1, urban centers might have been installed at very specific locations with good
infrastructure. Land area might not be able to verify this notion, but there might be a connection after
all.
Fertility rate, total (births per woman) is defined as “… the number of children that would be
born to a woman if she were to live to the end of her childbearing years and bear children in
accordance with current age-specific fertility rates.” (World Bank, 2012k).
Evaluating fertility rates has a twofold purpose: first, it is connected to demographics, and
second, it might be connected to socio-economic status, as indicated in section 2.2.2.2. There are
plenty of variables available that measures level of fertility or children born. Total fertility rate was
chosen because it is a recognized variable and often used in research.
Gross Domestic Product (GDP), PPP (constant 2005 international $) (World Bank 2012l). GDP
is defined as “[the]… sum of gross value added by all resident producers in the economy plus any
product taxes and minus any subsidies not included in the value of the products. It is calculated
without making deductions for depreciation of fabricated assets or for depletion and degradation of
natural resources.” (World Bank, 2012m).
Purchasing Power Parity (PPP) means that goods and services of a certain country is
calculated according to US prices and in $ (Todaro and Smith, 2009, p. 47). This allows for more
67
just comparisons, since even though GDP might be much lower in a less developed country, so is
probably the cost of commodities (ibid). The constant value of the $ in this variable means that the
numbers are not subjects of inflation, which further validates comparisons.
Out of many variables indicating economic prosperity, this one was chosen for its properties
mentioned above; mainly for the sake of as fair comparison as possible.
GDP growth (annual %) is defined according to the definition of GDP as described above (World
Bank, 2012n).
Although not as ideal as above mentioned variable, it still yields an indication of the increase
in GDP. Because it lacks purchase power parity and since it is not protected for inflation, this
variable will be critically analyzed, and it will not be compared to the GDP measurement above.
Arable land (% of land area) comprises “…land defined by the FAO [authors edit: Food and
Agriculture Organization] as land under temporary crops (double-cropped areas are counted once),
temporary meadows for mowing or for pasture, land under market or kitchen gardens, and land
temporarily fallow.” (World Bank, 2012o).
It seems reasonable to assume that countries with a large rural population ought to have
plenty of arable land, but do they really? Countries with a large urban population might require
plenty of arable land to supply its population with food stuffs. This particular variable is relevant
concerning the Lewis two-sector model in particular, given that the model assumes a transformation
from a traditional economy to a modern.
Life expectancy, at birth, total is “… the number of years a newborn infant would live if prevailing
patterns of mortality at the time of its birth were to stay the same throughout its life.” and is
calculated by adding together life expectancy for males and for females (World Bank, 2012p).
Life expectancy ratings are thought to reveal some information of the living conditions in the
various countries. While urbanization is connected to prosperity and development, some facts
indicate that conditions might be subpar in urban areas, as suggested in the previous chapter.
Mortality rate, under-5 (per 1000 live births) represents “the probability per 1,000 that a newborn
baby will die before reaching age five, if subject to current age-specific mortality rates.” (World
Bank, 2012q).
Mortality rates of children might indicate living conditions in the various countries. Similar
to life expectancy, this variable will be used to evaluate health conditions. There are several
mortality rates of children (e.g. infant mortality rate); this one was chosen because it includes the
most ages.
Labor participation rate, total (% of total population ages 15+) is defined as the ”… proportion
of the population ages 15 and older that is economically active: all people who supply labor for the
production of goods and services during a specified period.” (World Bank, 2012r).
This variable is thought to indicate if countries with a large urban population truly have
greater job opportunities (as suggested by Lewis two-sector model, mainly). Following that, it could

68
help explain urban population growth, as well as indicating socio-economic status. There are several
variables connected to employment, such as employment to population ratio. However, I decided to
use labor participation rate because it estimates informal work as well, something that might be
wide-spread in sub-Saharan Africa.
Health expenditure per capita, PPP (constant 2005 international $) encompasses “… public and
private health expenditures as a ratio of total population. It covers the provision of health services
(preventive and curative), family planning activities, nutrition activities, and emergency aid
designated for health but does not include provision of water and sanitation.” (World Bank, 2012s).
Health expenditure was chosen because it might indicate socio-economic standard and
availability of healthcare.
Prevalence of HIV, total (% of population ages 15-49) is the percentage of HIV positive people in
the given country (World Bank 2012t). The data originates from UNAIDS and WHO (ibid).
HIV and AIDS is no doubt a problem in sub-Saharan Africa, and probably more so in
specific countries. I do not know if HIV is generally more common in urban centers than in rural;
urban centers have a higher population density but on the other hand, access to healthcare and
information ought to be more available. Therefore, in terms of living conditions, it is an important
variable to include.
Age dependency ratio (% of working age population) shows the ratio of age dependent
population (people <15 years and people >64 years) per 100 working age people (people between 15
and 64 years old) (World Bank, 2012u).
This variable is thought to grant some understanding of the demographics in sub-Saharan
Africa.
Population in the largest city (% of urban population) is the “… percentage of a country's urban
population living in that country's largest metropolitan area.” (World Bank 2012v).
As mentioned in section 2.2.2.2, it is claimed that urban residents often live in smaller cities
rather than large metropolitan areas. As such, this variable will be used to evaluate the distribution of
urban residents in sub-Saharan Africa.
I.2.2 Human Development Index
The Human Development Index (HDI) is an index consistent of several variables and its purpose is
to reveal a unit’s social and economic status (UNDP, 2012a). The index yields a number between 0
and 1 where the higher the number – the better the status (ibid).
The HDI consists of three components which all make up a third of the total value: Health,
education and living standard (UNDP, 2012a). Health is based on life expectancy at birth, and living
standard is derived from gross national income per capita (PPP) (ibid). Education is a twofold
component, consisting of mean years of schooling and expected years of schooling (ibid).

69
The HDI used in this thesis originates from an online database issued by the UNDP (see: UNDP,
2012b).
I.2.3 Pearson’s r and r2
The coefficient of correlation, r, indicates a correlation between variables through a regression
analysis (Djurfeldt et al, 2010, pp. 160-161). Squaring this coefficient yields r2, the coefficient of
determination, which explains more accurately how much of the variation in the dependent variable
that can be explained by the independent variable (ibid). r2 yields a number between 0 and 1, where
1 represents 100% correlation (variations in the dependent variable (Y) is explained by the
independent variable (X) (ibid). In my thesis I will use r2.
I.3 Definition of concepts
In this sub-section, I will discuss a couple of concepts used in this thesis. Some concepts in this these
are often used in very broad terms and might therefore be subjects to different pre-understandings.
I.3.1 The concepts of urbanization and urban areas
According to Todaro and Smith (2009, p. 842) the term urbanization is defined as “… the economic
and demographic growth process of the urban centers”. With this definition in mind, it is important
to differentiate between urbanization on the one hand and urban population size on the other,
especially in this thesis. In many cases, the two terms appear to be used interchangeably, an action I
will try to avoid. Since the basis for this thesis will be urban population ratio it is necessary to keep
in mind that this might not reflect the true level of urbanization since it reveals nothing of the
economic component of the term.
It is important to stress that the term “urban area” does not only refer to large cities. In sub-Saharan
Africa, only 6% of the urban population resides in cities equal to or larger than 5 million inhabitants
(White et al, 2008, p. 302). In fact, 57% of the urban residents live in cities of less than 500,000
inhabitants (ibid). Although smaller cities are often attractive to migrants, some factors such as
fertility level and mortality rates often reflect those in rural areas (ibid). According to State of the
World Population 2007 (p. 11-12) the abundance of “smaller” cities and low population density is a
feature unique to sub-Saharan Africa.
The rather vague definition of the term urbanization has caused some problem for researchers. Mark
Montgomery (2008, pp. 26) explains that urban projections and estimations are made difficult due to
the various understandings of what the “urban” terms truly encompass. The UN differentiates

70
between the terms city proper, urban agglomeration and sometimes metropolitan region, all which
represent demographics in cities but including different areas (for example: city proper refers to the
area within the boundaries decided by the state) (Montgomery, 2008, p. 27). Although asked to
provide data for urban agglomerations only, the UN noted that very few countries actually did so
(ibid).
As stated in section 3.2.1, the data issued by the World Bank is generated mostly from
national offices. Therefore, there is a risk that different definitions of urban areas and demography
have been used. Since thesis will compare data between countries it is important know that there
might be slight variations.
I.3.2 The concept of development
To define the term “development” is not an easy task. It is a highly subjective term and in some
cases it might concerns the market only while in others it encompasses plenty of socio-economic
variables. In this thesis, I will distinguish between economic development and development. The
term “economic development” refers to the increase of GDP per capita only. “Development”, on the
other hand, is a much broader concept and refers to several socio-economic factors, but mainly
relying on the Human Development Index. Granted, the definitions are still fairly vague, but it is
close to impossible to pin-point the exact measurements without disregarding too many aspects.
In a similar manner, it is sometimes necessary for the sake of convenience to classify countries
according to their developmental status. On several occasions, I will refer to either less developed
countries or more developed countries. These terms are taken from Todaro and Smith in Economic
Development. In short, the less developed countries constitute what is often referred to as the
“developing countries” and the more developed countries are the “developed countries” (Todaro and
Smith, 2009, p. 820). I prefer these labels as other similar terms such as “underdeveloped countries
versus developed countries”, “the core versus the periphery” are subjective, historical and attached
with values and pre-understandings which is not the intention of my usage of these labels.

71
Appendix II
Table II.1
Table II.2
Urban population, % of total
Urban population, % of total
Year: 2009
Year: 1960
Quint.: Urban population, % of total 2009
Quint.: Urban population, % of total 1960
Gabon 85.52
South Africa 46.6 Congo, Rep. 61.72
Mauritius 33.2
South Africa 61.22
Congo, Rep. 31.6 1 Liberia 60.82
1 Ghana 23.3
Botswana 60.34
Senegal 23 Angola 57.6
Congo, Dem. Rep. 22.3
Cameroon 57.58
Central African Republic 20.1 Gambia, The 57.26
Liberia 18.6
Ghana 50.76
Zambia 18.1 Cote d'Ivoire 49.44
Namibia 17.9
Nigeria 49.08
Cote d'Ivoire 17.7 2 Sudan 44.32
2 Gabon 17.4
Togo 42.7
Sierra Leone 17.4 Senegal 42.64
Somalia 17.3
Mauritius 42.54
Nigeria 16.2 Benin 41.6
Cameroon 13.9
Mauritania 41.2
Guinea-Bissau 13.6 Central African Republic 38.74
Zimbabwe 12.6
Sierra Leone 38.08
Gambia, The 12.1 Zimbabwe 37.82
Mali 11.1
3 Mozambique 37.62
3 Sudan 10.7 Namibia 37.42
Madagascar 10.6
Somalia 36.96
Guinea 10.5 Zambia 35.56
Angola 10.4
Guinea 34.92
Togo 10.1 Congo, Dem. Rep. 34.58
Eritrea 9.8
Mali 32.74
Benin 9.3 Guinea-Bissau 29.92
Kenya 7.4
Madagascar 29.86
Mauritania 6.9 4 Chad 27.14
4 Chad 6.7
Lesotho 26.18
Ethiopia 6.4 Tanzania 25.96
Niger 5.8
Swaziland 25.22
Tanzania 5.2 Kenya 21.9
Burkina Faso 4.7
Eritrea 21.16
Malawi 4.4 Burkina Faso 19.98
Uganda 4.4
Malawi 19.3
Swaziland 3.9 5 Rwanda 18.62
5 Mozambique 3.7
Ethiopia 17.3
Lesotho 3.4 Niger 16.62
Botswana 3.1
Uganda 13.14
Rwanda 2.4 Burundi 10.7
Burundi 2
Source: WDI & GDF
Source: WDI & GDF

72
Table II.3 Table II.4
Urban population growth, annual %
Urban population growth, annual %
Year: 2009
Year: 1960
Quint.: Urban pop. growth, annual % 2009 Quint.: Urban pop. growth, annual % 1960
Liberia 5.86 Lesotho 10.90 Malawi 5.70 Swaziland 10.45 Burundi 5.67 Mauritania 9.71 1 Burkina Faso 5.10 1 Cote d'Ivoire 8.95 Eritrea 5.10 Togo 8.24 Mali 4.79 Uganda 7.21 Tanzania 4.64
Nigeria 7.02
Sudan 4.54
Zambia 6.92
Congo, Dem. Rep. 4.54
Ghana 6.82 Rwanda 4.54
Benin 6.72
Uganda 4.45
Sudan 6.37 2 Mozambique 4.42
2 Tanzania 6.02
Angola 4.40
Kenya 5.81 Chad 4.33
Mozambique 5.80
Gambia, The 4.23
Cameroon 5.73 Madagascar 4.06
Chad 5.72
Niger 4.03
Liberia 5.63 Nigeria 3.98
Eritrea 5.59
Kenya 3.96
Guinea 5.55 Ethiopia 3.92
Rwanda 5.54
3 Benin 3.87
3 Ethiopia 5.42 Ghana 3.85
Senegal 5.30
Lesotho 3.81
Madagascar 5.23 Togo 3.79
Namibia 5.09
Cameroon 3.63
Somalia 5.08 Guinea 3.48
Zimbabwe 4.82
Namibia 3.44
Congo, Rep. 4.75 Somalia 3.39
Angola 4.71
Congo, Rep. 3.32
Gambia, The 4.66 4 Senegal 3.29
4 Central African Republic 4.64
Cote d'Ivoire 3.24
Niger 4.55 Zambia 3.14
Malawi 4.55
Sierra Leone 3.08
Sierra Leone 4.47 Mauritania 2.96
Gabon 4.35
Swaziland 2.67
Mauritius 4.26 Botswana 2.63
Congo, Dem. Rep. 4.00
Gabon 2.42
Mali 3.81 5 Guinea-Bissau 2.33
5 Burkina Faso 3.68
Central African Republic 2.29
Botswana 3.57 South Africa 1.86
South Africa 3.41
Zimbabwe 1.46
Guinea-Bissau 3.38 Mauritius 0.65
Burundi 2.81
Source: WDI & GDF
Source: WDI & GDF

73
Table II.5 Table II.6
Population, total
Population, total
Year: 2009
Year: 1960
Quint.: Population, total 2009
Quint.: Population, total 1960
Nigeria 154488072
Nigeria 45926253 Ethiopia 81187751
Ethiopia 22553350
Congo, Dem. Rep. 64204304
South Africa 17396000 1 South Africa 49320150
1 Congo, Dem. Rep. 15367539
Tanzania 43524738
Sudan 11561784 Sudan 42478309
Tanzania 10074485
Kenya 39462188
Kenya 8105435 Uganda 32367909
Mozambique 7647298
Ghana 23824402
Uganda 6788219 Mozambique 22858607
Ghana 6742107
Madagascar 20124150
Cameroon 5409083 2 Cote d'Ivoire 19350026
2 Mali 5247877
Cameroon 19175028
Madagascar 5103652 Angola 18555115
Angola 4963068
Burkina Faso 15984479
Burkina Faso 4881947 Niger 14972257
Zimbabwe 3752373
Mali 14909813
Cote d'Ivoire 3638385 Malawi 14442290
Guinea 3540756
Zambia 12723746
Malawi 3525246 Zimbabwe 12473992
Niger 3249965
3 Senegal 12106865
3 Senegal 3047804 Chad 10937089
Zambia 3044733
Rwanda 10311275
Chad 2954088 Guinea 9761217
Burundi 2940498
Somalia 9119848
Somalia 2819246 Benin 8601771
Rwanda 2771018
Burundi 8170853
Benin 2419644 Togo 5901859
Sierra Leone 2187240
Sierra Leone 5739293
Togo 1577708 4 Eritrea 5097998
4 Central African Republic 1503509
Central African Republic 4318128
Eritrea 1423599 Congo, Rep. 3941454
Liberia 1115736
Liberia 3835929
Congo, Rep. 1013581 Mauritania 3377630
Mauritania 854167
Namibia 2242078
Lesotho 851594 Lesotho 2149201
Mauritius 659351
Botswana 1981576
Namibia 602545 5 Gambia, The 1681734
5 Guinea-Bissau 593289
Guinea-Bissau 1484120
Botswana 523997 Gabon 1477514
Gabon 485732
Mauritius 1275323
Gambia, The 372625 Swaziland 1168345
Swaziland 349181
Source: WDI & GDF
Source: WDI & GDF

74
Table II.7 Table II.8
Land area, square kilometers
Population growth, annual %
Year: 2009
Year: 2009
Quint.: Land area, sq. km. 2009
Quint.: Population growth, annual % 2009
Sudan 2376000
Liberia 4.74 Congo, Dem. Rep. 2267050
Niger 3.55
Niger 1266700
Uganda 3.23 1 Chad 1259200
1 Malawi 3.07
Angola 1246700
Mali 3.06 Mali 1220190
Rwanda 3.02
South Africa 1214470
Eritrea 3.00 Mauritania 1030700
Burkina Faso 2.98
Ethiopia 1000000
Tanzania 2.93 Nigeria 910770
Madagascar 2.91
Tanzania 885800
Benin 2.90 2 Namibia 823290
2 Angola 2.83
Mozambique 786380
Burundi 2.82 Zambia 743390
Gambia, The 2.75
Somalia 627340
Zambia 2.74 Central African Republic 622980
Congo, Dem. Rep. 2.73
Madagascar 581540
Congo, Rep. 2.70 Kenya 569140
Senegal 2.68
Botswana 566730
Chad 2.62 Cameroon 472710
Kenya 2.58
3 Zimbabwe 386850
3 Sudan 2.53 Congo, Rep. 341500
Nigeria 2.51
Cote d'Ivoire 318000
Mauritania 2.47 Burkina Faso 273600
Ghana 2.38
Gabon 257670
Mozambique 2.33 Guinea 245720
Sierra Leone 2.24
Ghana 227540
Cameroon 2.19 Uganda 199810
Somalia 2.19
Senegal 192530
Ethiopia 2.17 4 Benin 110620
4 Togo 2.14
Eritrea 101000
Guinea 2.09 Liberia 96320
Guinea-Bissau 2.07
Malawi 94280
Cote d'Ivoire 1.89 Sierra Leone 71620
Namibia 1.88
Togo 54390
Central African Republic 1.87 Lesotho 30360
Gabon 1.86
Guinea-Bissau 28120
Swaziland 1.55 5 Burundi 25680
5 Botswana 1.36
Rwanda 24670
South Africa 1.07 Swaziland 17200
Lesotho 1.02
Gambia, The 10000
Mauritius 0.51 Mauritius 2030
Zimbabwe 0.18
Source: WDI & GDF
Source: WDI & GDF

75
Table II.9 Table II.10
Population growth, annual %
Population growth, annual %
Year: 1985
Year: 1960 Quint.: Population growth, annual % 1985
Quint.: Population growth, annual % 1960
Gambia, The 4.44
Cote d'Ivoire 3.61 Malawi 4.23
Zimbabwe 3.22
Cote d'Ivoire 3.93
Gambia, The 3.16 1 Zimbabwe 3.82
1 Ghana 3.14
Kenya 3.72
Kenya 3.07 Rwanda 3.71
Uganda 3.04
Swaziland 3.65
Rwanda 3.01 Togo 3.41
Tanzania 2.89
Uganda 3.34
Mauritius 2.86 Namibia 3.30
Zambia 2.86
Botswana 3.30
Niger 2.81 2 Burundi 3.26
2 Mauritania 2.81
Ethiopia 3.24
Senegal 2.66 Ghana 3.23
Congo, Dem. Rep. 2.55
Zambia 3.14
Congo, Rep. 2.51 Angola 3.12
Eritrea 2.48
Tanzania 3.09
South Africa 2.46 Gabon 3.09
Swaziland 2.44
Senegal 2.94
Namibia 2.37 Cameroon 2.90
Sudan 2.36
3 Congo, Rep. 2.87
3 Madagascar 2.36 Congo, Dem. Rep. 2.86
Liberia 2.36
Sudan 2.86
Botswana 2.27 Niger 2.76
Somalia 2.27
Chad 2.76
Malawi 2.25 Benin 2.75
Ethiopia 2.25
Mauritania 2.74
Nigeria 2.09 Central African Republic 2.66
Chad 2.08
Madagascar 2.63
Cameroon 2.07 4 South Africa 2.60
4 Mozambique 1.94
Eritrea 2.57
Burundi 1.80 Burkina Faso 2.56
Angola 1.78
Guinea 2.55
Lesotho 1.67 Nigeria 2.52
Central African Republic 1.61
Sierra Leone 2.51
Sierra Leone 1.55 Lesotho 2.31
Burkina Faso 1.53
Mali 1.80
Guinea 1.47 5 Guinea-Bissau 1.78
5 Togo 1.27
Liberia 1.46
Mali 1.26 Mozambique 1.02
Benin 1.20
Mauritius 0.67
Guinea-Bissau 0.55 Somalia -0.87
Gabon 0.49
Source: WDI & GDF
Source: WDI & GDF

76
Table II.11 Table II.12
Total fertility rate, births per woman
Total fertility rate, births per woman
Year: 2009
Year: 1960
Quint.: Total fertility rate 2009
Quint.: Total fertility rate 1960
Niger 7.12
Rwanda 8.17 Somalia 6.36
Kenya 7.95
Mali 6.36
Cote d'Ivoire 7.35 1 Uganda 6.24
1 Angola 7.32
Zambia 6.23
Madagascar 7.30 Chad 6.07
Somalia 7.25
Malawi 5.99
Zimbabwe 7.16 Congo, Dem. Rep. 5.90
Niger 7.04
Burkina Faso 5.89
Zambia 7.02 Angola 5.58
Uganda 7.00
Nigeria 5.56
Malawi 6.91 2 Tanzania 5.56
2 Eritrea 6.90
Rwanda 5.40
Ethiopia 6.88 Benin 5.37
Tanzania 6.81
Guinea 5.33
Burundi 6.80 Liberia 5.31
Mauritania 6.78
Guinea-Bissau 5.14
Ghana 6.75 Sierra Leone 5.08
Swaziland 6.72
Mozambique 4.99
Mali 6.70 Gambia, The 4.98
Senegal 6.64
3 Senegal 4.90
3 Sudan 6.63 Kenya 4.76
Botswana 6.62
Madagascar 4.72
Mozambique 6.60 Central African Republic 4.72
Togo 6.52
Mauritania 4.60
South Africa 6.45 Congo, Rep. 4.58
Liberia 6.41
Cameroon 4.56
Guinea 6.37 Eritrea 4.54
Nigeria 6.35
Cote d'Ivoire 4.52
Burkina Faso 6.29 4 Sudan 4.48
4 Benin 6.28
Burundi 4.47
Chad 6.25 Ethiopia 4.35
Mauritius 6.17
Ghana 4.24
Namibia 6.15 Togo 4.16
Sierra Leone 6.03
Swaziland 3.45
Congo, Dem. Rep. 6.00 Zimbabwe 3.36
Congo, Rep. 5.88
Namibia 3.29
Central African Republic 5.84 5 Gabon 3.29
5 Lesotho 5.84
Lesotho 3.27
Guinea-Bissau 5.83 Botswana 2.80
Cameroon 5.77
South Africa 2.50
Gambia, The 5.57 Mauritius 1.50
Gabon 4.11
Source: WDI & GDF
Source: WDI & GDF

77
Table II.13 Table II.14
Rural population growth, annual %
Rural population growth, annual %
Year: 2009
Year: 1960
Quint.: Rural pop. growth, annual % 2009
Quint.: Rural pop. growth, annual % 1960
Niger 3.45
Zimbabwe 2.99 Uganda 3.05
Gambia, The 2.96
Liberia 3.02
Rwanda 2.95 1 Rwanda 2.68
1 Kenya 2.85
Zambia 2.52
Uganda 2.85 Burundi 2.49
Tanzania 2.73
Malawi 2.46
Niger 2.71 Burkina Faso 2.46
Cote d'Ivoire 2.50
Eritrea 2.44
Mauritania 2.31 Madagascar 2.43
Botswana 2.23
Tanzania 2.34
Mauritius 2.17 2 Mali 2.23
2 Eritrea 2.15
Senegal 2.22
Malawi 2.14 Benin 2.22
Congo, Dem. Rep. 2.14
Kenya 2.20
Swaziland 2.13 Mauritania 2.13
Ghana 2.06
Chad 2.00
Ethiopia 2.03 Guinea-Bissau 1.95
Madagascar 2.02
Ethiopia 1.81
Zambia 1.98 Congo, Dem. Rep. 1.79
Sudan 1.89
3 Sierra Leone 1.73
3 Senegal 1.88 Congo, Rep. 1.72
Chad 1.82
Central African Republic 1.61
Mozambique 1.80 Somalia 1.49
Namibia 1.79
Guinea 1.36
Burundi 1.78 Swaziland 1.18
Somalia 1.69
Nigeria 1.10
South Africa 1.64 Mozambique 1.08
Liberia 1.62
Sudan 0.97
Congo, Rep. 1.49 4 Namibia 0.95
4 Cameroon 1.49
Togo 0.93
Angola 1.45 Ghana 0.89
Burkina Faso 1.42
Gambia, The 0.80
Lesotho 1.36 Angola 0.73
Nigeria 1.16
Cote d'Ivoire 0.60
Guinea 1.00 Mauritius 0.40
Sierra Leone 0.95
Cameroon 0.28
Mali 0.94 5 Lesotho 0.05
5 Central African Republic 0.86
South Africa -0.16
Benin 0.65 Botswana -0.54
Togo 0.51
Zimbabwe -0.59
Guinea-Bissau 0.11 Gabon -1.40
Gabon -0.31
Source: WDI & GDF
Source: WDI & GDF

78
Table II.15 Table II.16
Human Development Index
Gross Domestic Product growth, annual %
Year: 2009
Year: 2009
Quint.: HDI 2009
Quint.: GDPg, annual % 2009
Mauritius 0.722
Ethiopia 8.79 Gabon 0.664
Malawi 7.60
Botswana 0.626
Congo, Rep. 7.47 1 Namibia 0.617
1 Uganda 7.25
South Africa 0.61
Nigeria 7.00 Ghana 0.527
Mozambique 6.45
Congo, Rep. 0.523
Zambia 6.40 Swaziland 0.515
Gambia, The 6.16
Kenya 0.499
Tanzania 6.02 Madagascar 0.483
Zimbabwe 6.00
Angola 0.481
Ghana 4.66 2 Cameroon 0.475
2 Liberia 4.59
Tanzania 0.454
Mali 4.50 Senegal 0.453
Rwanda 4.10
Nigeria 0.449
Sudan 3.96 Mauritania 0.447
Eritrea 3.88
Lesotho 0.44
Benin 3.80 Uganda 0.438
Cote d'Ivoire 3.75
Togo 0.429
Burundi 3.50 3 Benin 0.422
3 Burkina Faso 3.50
Rwanda 0.419
Togo 3.23 Zambia 0.419
Sierra Leone 3.20
Gambia, The 0.413
Lesotho 3.06 Sudan 0.403
Mauritius 3.03
Cote d'Ivoire 0.397
Guinea-Bissau 3.00
Malawi 0.387
Congo, Dem. Rep. 2.83 Ethiopia 0.353
Kenya 2.59
4 Mali 0.352
Angola 2.40 Zimbabwe 0.349
4 Senegal 2.22
Guinea-Bissau 0.348
Cameroon 2.00 Guinea 0.341
Central African Republic 1.70
Central African Republic 0.334
Swaziland 0.40
Sierra Leone 0.329
Guinea -0.28
Burkina Faso 0.326
Namibia -0.70 Chad 0.323
Niger -1.20
5 Liberia 0.32
Mauritania -1.22 Mozambique 0.312
5 Gabon -1.41
Burundi 0.308
Chad -1.60 Niger 0.285
South Africa -1.68
Congo, Dem. Rep. 0.277
Madagascar -4.58
Eritrea n/a
Botswana -4.93
Somalia n/a
Somalia n/a
Source: UNDP, 2012b
Source: WDI & GDF

79
Table II.17 Table II.18
GDP/capita, ppp, constant
GDP/capita, ppp, constant
2005 international $
2005 international $
Year: 2009
Year: 1989
Quint.: GDP/cap ppp 2009
Quint.: GDP/cap ppp 1989
Gabon 13007.97
Gabon 14669.28 Mauritius 11847.65
South Africa 8164.69
Botswana 11771.84
Botswana 6705.48 1 South Africa 9339.95
1 Mauritius 5748.51
Namibia 5642.94
Namibia 4044.72 Angola 5389.87
Congo, Rep. 3617.15
Swaziland 4731.00
Angola 3393.49 Congo, Rep. 3591.78
Swaziland 3329.57
Cameroon 2038.36
Cameroon 2281.83 Nigeria 2030.46
Cote d'Ivoire 1998.26
Sudan 1986.20
Mauritania 1620.01 2 Senegal 1711.83
2 Senegal 1533.22
Mauritania 1701.12
Kenya 1410.93 Cote d'Ivoire 1686.97
Nigeria 1342.98
Kenya 1440.65
Zambia 1289.49 Benin 1422.29
Guinea-Bissau 1161.44
Ghana 1401.46
Gambia, The 1130.26 Lesotho 1349.86
Benin 1116.37
Zambia 1322.80
Sudan 1114.99 3 Gambia, The 1238.22
3 Madagascar 1035.06
Tanzania 1237.12
Liberia 992.30 Chad 1209.64
Togo 942.53
Uganda 1120.60
Ghana 902.32
Burkina Faso 1062.48
Chad 882.26
Guinea-Bissau 1049.95
Guinea 864.26 Rwanda 1000.21
Central African Republic 857.41
Guinea 981.49
4 Tanzania 828.73 4 Mali 942.05
Rwanda 742.33
Togo 884.58
Niger 732.70 Madagascar 880.60
Burkina Faso 703.32
Ethiopia 866.29
Congo, Dem. Rep. 700.13
Mozambique 806.62
Mali 690.31
Malawi 762.31
Sierra Leone 690.13 Sierra Leone 722.51
Malawi 558.36
Central African Republic 698.18
5 Ethiopia 548.77 5 Niger 621.81
Uganda 547.36
Eritrea 493.77
Burundi 485.92 Liberia 370.70
Lesotho 426.60
Burundi 361.84
Mozambique 400.99
Congo, Dem. Rep. 298.30
Eritrea n/a
Somalia n/a
Somalia n/a Zimbabwe n/a
Zimbabwe n/a
Source: WDI & GDF
Source: WDI & GDF

80
Table II.19 Table II.20
Arable land, % of land area
Arable land, % of land area
Year: 2009
Year: 1961 Quint.: Arable land, % of land area 2009
Quint.: Arable land, % of land area 1961
Rwanda 52.70
Mauritius 44.33 Mauritius 42.86
Togo 33.09
Togo 40.45
Nigeria 28.99 1 Gambia, The 40.00
1 Burundi 26.29
Malawi 38.18
Rwanda 19.66 Nigeria 37.33
Uganda 15.76
Burundi 35.05
Senegal 15.23 Uganda 33.03
Guinea 14.33
Benin 22.15
Malawi 13.79 Burkina Faso 21.56
Gambia, The 11.80
Senegal 20.00
Lesotho 11.79 2 Ghana 19.34
2 Cameroon 10.58
Sierra Leone 15.15
South Africa 9.88 Ethiopia 13.95
Niger 9.08
Cameroon 12.61
Guinea-Bissau 8.36 South Africa 11.82
Benin 8.32
Niger 11.79
Burkina Faso 7.76 Guinea 11.60
Ghana 7.47
Tanzania 11.29
Swaziland 7.21 Lesotho 11.03
3 Kenya 6.15
3 Zimbabwe 10.81
Tanzania 5.87 Guinea-Bissau 10.67
Cote d'Ivoire 5.28
Swaziland 10.17
Sierra Leone 4.96 Kenya 9.49
Zimbabwe 4.87
Cote d'Ivoire 8.81
Sudan 4.53 Sudan 8.48
Liberia 3.92
Eritrea 6.83
Zambia 3.43 Mozambique 6.42
4 Madagascar 3.31
Mali 5.21
Mozambique 3.11 4 Madagascar 5.07
Congo, Dem. Rep. 2.82
Zambia 4.51
Central African Republic 2.70 Liberia 4.15
Chad 2.30
Chad 3.41
Angola 2.14 Angola 3.21
Congo, Rep. 1.52
Central African Republic 3.13
Somalia 1.42 Congo, Dem. Rep. 2.96
5 Mali 1.34
Somalia 1.59
Namibia 0.78 5 Congo, Rep. 1.46
Botswana 0.70
Gabon 1.26
Gabon 0.35 Namibia 0.97
Mauritania 0.26
Botswana 0.44
Eritrea n/a Mauritania 0.38
Ethiopia n/a
Source: WDI & GDF
Source: WDI & GDF

81
Table II.21 Table II.22
Life expectancy, at birth (in years)
Life expectancy, at birth (in years)
Year: 2009
Year: 1960
Quint.: Life expectancy, at birth 2009
Quint.: Life expectancy, at birth 1960
Mauritius 72.88
Mauritius 58.75 Madagascar 66.19
Zimbabwe 51.54
Ghana 63.39
Botswana 50.54 1 Gabon 61.85
1 South Africa 49.04
Namibia 61.62
Congo, Rep. 48.58 Sudan 60.79
Namibia 46.88
Eritrea 60.56
Lesotho 46.50 Senegal 58.63
Kenya 46.36
Ethiopia 58.12
Ghana 45.98 Mauritania 57.92
Zambia 45.11
Gambia, The 57.84
Swaziland 44.24 2 Tanzania 56.59
2 Uganda 43.98
Congo, Rep. 56.56
Tanzania 43.65 Togo 56.20
Mauritania 42.23
Kenya 55.84
Rwanda 42.22 Liberia 55.48
Sudan 41.59
Benin 55.17
Cameroon 41.52 Rwanda 54.67
Burundi 41.24
Burkina Faso 54.47
Congo, Dem. Rep. 41.02 Cote d'Ivoire 54.06
Cote d'Ivoire 40.42
3 Niger 53.82
3 Chad 40.24 Guinea 53.17
Madagascar 39.88
Uganda 53.07
Gabon 39.57 Botswana 53.01
Togo 39.56
Malawi 52.68
Eritrea 39.11 South Africa 51.61
Senegal 38.93
Nigeria 50.95
Nigeria 38.50 Somalia 50.63
Ethiopia 38.41
Cameroon 50.58
Niger 37.90 4 Mali 50.54
4 Malawi 37.77
Angola 50.25
Liberia 37.65 Burundi 49.42
Central African Republic 36.48
Mozambique 49.28
Somalia 35.99 Chad 48.89
Burkina Faso 35.86
Zimbabwe 48.45
Benin 35.58 Swaziland 47.89
Mozambique 35.00
Zambia 47.81
Guinea-Bissau 34.51 5 Congo, Dem. Rep. 47.80
5 Gambia, The 33.54
Guinea-Bissau 47.31
Angola 32.99 Sierra Leone 46.96
Guinea 32.36
Central African Republic 46.88
Sierra Leone 31.46 Lesotho 46.67
Mali 30.31
Source: WDI & GDF
Source: WDI & GDF

82
Table II.23 Table II.24
Mortality rate, under 5 years
Labor participation rate, % of total
(per 1,000 live births)
Year: 2009
Year: 2009 Quint.: Mortality rate, under 5 2009
Quint.: Labor participation rate (%) 2009
Mali 181.6
Burundi 89.3 Sierra Leone 180
Tanzania 88.4
Somalia 180
Madagascar 86.4 1 Burkina Faso 178
1 Rwanda 86
Chad 175.1
Mozambique 85.8 Congo, Dem. Rep. 172.1
Ethiopia 85.4
Angola 164.3
Uganda 84.5 Central African Republic 160.5
Burkina Faso 84.4
Guinea-Bissau 151.6
Guinea 84.2 Niger 150
Kenya 82.2
Nigeria 146.7
Angola 81.3 2 Burundi 143.1
2 Central African Republic 79
Mozambique 139.6
Gambia, The 77.8 Cameroon 137.6
Malawi 76.8
Guinea 134.2
Botswana 76.6 Cote d'Ivoire 125.3
Senegal 76.4
Benin 118.1
Gabon 75.5 Zambia 116.1
Ghana 74.6
Mauritania 111.5
Togo 74.4 Liberia 108.9
Lesotho 74
3 Ethiopia 108.8
3 Benin 72.7 Togo 105.7
Congo, Rep. 72.7
Sudan 104.2
Eritrea 72.6 Uganda 102.6
Guinea-Bissau 71.5
Gambia, The 101.1
Liberia 71.1 Malawi 98.1
Congo, Dem. Rep. 70.8
Rwanda 97.5
Chad 70.4 Congo, Rep. 93.6
Somalia 70.3
Lesotho 92
Mauritania 70 4 Kenya 87
4 Zambia 69.2
Zimbabwe 83
Cameroon 67 Swaziland 81.8
Cote d'Ivoire 66.9
Tanzania 80.4
Zimbabwe 66.8 Senegal 78.5
Sierra Leone 66.4
Ghana 76.6
Swaziland 63.6 Gabon 74.9
Niger 62.7
Madagascar 65.4
Mauritius 57.5 5 Eritrea 63.2
5 Namibia 57.1
South Africa 60.9
Nigeria 56.2 Botswana 49.4
South Africa 55
Namibia 44.1
Sudan 52.3 Mauritius 15.3
Mali 51.9
Source: WDI & GDF
Source: WDI & GDF

83
Table II.25 Table II.26
Health expenditure, per capita (constant
Prevalence of HIV, total (% of
2005 international $)
population ages 15-49)
Year: 2009
Year: 2009
Quint.: Health expenditure per capita 2009
Quint.: Prevalence of HIV 2009
Botswana 1340.69
Swaziland 25.9 South Africa 861.56
Botswana 24.8
Mauritius 730.50
Lesotho 23.6 1 Gabon 512.52
1 South Africa 17.8
Namibia 383.93
Zimbabwe 14.3 Angola 316.00
Zambia 13.5
Swaziland 312.21
Namibia 13.1 Sudan 161.08
Mozambique 11.5
Nigeria 136.22
Malawi 11 Lesotho 132.81
Uganda 6.5
Congo, Rep. 126.09
Kenya 6.3 2 Cameroon 121.58
2 Tanzania 5.6
Uganda 114.91
Cameroon 5.3 Sierra Leone 106.24
Gabon 5.2
Ghana 103.85
Central African Republic 4.7 Senegal 102.10
Nigeria 3.6
Rwanda 101.91
Chad 3.4 Chad 94.43
Congo, Rep. 3.4
Burkina Faso 87.60
Cote d'Ivoire 3.4 3 Cote d'Ivoire 86.25
3 Burundi 3.3
Gambia, The 84.47
Togo 3.2 Zambia 68.31
Rwanda 2.9
Kenya 68.15
Guinea-Bissau 2.5 Tanzania 67.53
Angola 2
Mali 65.98
Gambia, The 2 Benin 64.73
Ghana 1.8
Guinea 61.16
Sierra Leone 1.6 4 Togo 57.12
4 Liberia 1.5
Liberia 52.54
Guinea 1.3 Malawi 50.27
Benin 1.2
Mozambique 50.08
Burkina Faso 1.2 Burundi 48.70
Sudan 1.1
Mauritania 46.53
Mali 1 Madagascar 40.91
Mauritius 1
Niger 40.08
Senegal 0.9 5 Ethiopia 39.87
5 Eritrea 0.8
Guinea-Bissau 34.66
Niger 0.8 Central African Republic 32.34
Mauritania 0.7
Congo, Dem. Rep. 30.51
Somalia 0.7 Eritrea 13.45
Madagascar 0.2
Somalia n/a
Congo, Dem. Rep. n/a Zimbabwe n/a
Ethiopia n/a
Source: WDI & GDF
Source: WDI & GDF

84
Table II.27 Table II.28
Age dependendy ratio (% of
Population in the largest city
working age population)
(% of urban population)
Year: 2009
Year: 2009
Quint.: Age dependency ratio 2009
Quint.: Population in the largest city 2009
Niger 104.75
Guinea-Bissau 67.97 Uganda 104.25
Togo 63.20
Mali 97.62
Eritrea 60.16 1 Angola 97.38
1 Burkina Faso 55.64
Zambia 97.31
Senegal 53.79
Congo, Dem. Rep. 96.93
Congo, Rep. 53.13
Malawi 95.78
Burundi 52.03
Chad 94.00
Mauritania 50.93
Tanzania 91.44
Gabon 48.98
Somalia 91.01
Rwanda 47.33
Burkina Faso 91.01
Guinea 46.86
2 Mozambique 90.47
2 Gambia, The 45.32
Benin 88.33
Angola 42.20
Madagascar 87.19
Central African Republic 41.94
Gambia, The 86.62
Cote d'Ivoire 41.91
Guinea 86.56
Namibia 40.73
Liberia 86.15
Niger 40.36
Senegal 86.13
Somalia 40.13
Nigeria 85.88
Sierra Leone 40.06
Ethiopia 83.19
Lesotho 39.10
3 Rwanda 82.28
3 Kenya 39.06
Kenya 82.25
Congo, Dem. Rep. 37.84
Sierra Leone 81.69
Liberia 37.83
Cote d'Ivoire 81.51
Uganda 36.09
Guinea-Bissau 81.28
Zimbabwe 34.05
Central African Republic 80.63
Mali 33.34
Congo, Rep. 79.82
Zambia 31.22
Cameroon 79.38
Madagascar 30.22
Eritrea 78.77
Malawi 29.45
4 Sudan 78.24
4 Tanzania 28.38
Zimbabwe 76.73
Mauritius 27.52
Togo 76.71
Chad 27.24
Mauritania 74.86
Sudan 26.67
Ghana 74.03
Swaziland 25.05
Swaziland 73.35
Benin 22.78
Lesotho 72.85
Ethiopia 20.38
Burundi 70.23
Ghana 18.76
5 Namibia 68.20
5 Cameroon 18.60
Gabon 67.63
Mozambique 18.48
Botswana 58.34
Botswana 16.38
South Africa 53.65
Nigeria 13.46
Mauritius 41.07
South Africa 11.95
Source: WDI & GDF
Source: WDI & GDF

85
Figure II.1 Urban population, % of total (1960-2009)
Source: WDI & GDF
Figure II.2 Urban population, % of total (1960-2009)
Source: WDI & GDF
Figure II.3 Urban population, % of total (1960-2009)
Source: WDI & GDF
0 10 20 30 40 50 60 70 80 90
1960
1963
1966
1969
1972
1975
1978
1981
1984
1987
1990
1993
1996
1999
2002
2005
2008
Angola
Botswana
Cameroon
Congo, Rep.
0 10 20 30 40 50 60 70 80 90
1960
1963
1966
1969
1972
1975
1978
1981
1984
1987
1990
1993
1996
1999
2002
2005
2008
Gabon
Gambia, The
Liberia
South Africa
0
5
10
15
20
25
1960
1963
1966
1969
1972
1975
1978
1981
1984
1987
1990
1993
1996
1999
2002
2005
2008
Burkina Faso
Burundi
Eritrea
Ethiopia

86
Figure II.4 Urban population, % of total (1960-2009)
Source: WDI & GDF
Figure II.5 Population, total (1960-2009)
Source: WDI & GDF
Figure II.6 Population, total (1960-2009)
Source: WDI & GDF
0
5
10
15
20
25
1960
1963
1966
1969
1972
1975
1978
1981
1984
1987
1990
1993
1996
1999
2002
2005
2008
Malawi
Niger
Rwanda
Uganda
0
10000000
20000000
30000000
40000000
50000000
60000000
1960
1964
1968
1972
1976
1980
1984
1988
1992
1996
2000
2004
2008
Angola
Cameroon
Congo, Rep.
South Africa
0
1000000
2000000
3000000
4000000
5000000
1960
1964
1968
1972
1976
1980
1984
1988
1992
1996
2000
2004
2008
Botswana
Gabon
Gambia, The
Liberia

87
Figure II.7 Population, total (1960-2009)
Source: WDI & GDF
Figure II.8 Population, total (1960-2009)
Source: WDI & GDF
Figure II.9 Total fertility rate, births per woman (1960-2009)
Source: WDI & GDF
0
5000000
10000000
15000000
20000000
1960
1964
1968
1972
1976
1980
1984
1988
1992
1996
2000
2004
2008
Burkina Faso
Burundi
Eritrea
Rwanda
0
20000000
40000000
60000000
80000000
100000000
1960
1963
1966
1969
1972
1975
1978
1981
1984
1987
19
90
1993
1996
1999
2002
2005
2008
Ethiopia
Malawi
Niger
Uganda
0
2
4
6
8
1960
1963
1966
1969
1972
1975
1978
1981
1984
1987
1990
1993
1996
1999
2002
2005
2008
Angola
Botswana
Cameroon
Congo, Rep.

88
Figure II.10 Total fertility rate, births per woman (1960-2009)
Source: WDI & GDF
Figure II.11 Total fertility rate, births per woman (1960-2009)
Source: WDI & GDF
Figure II.12 Total fertility rate, births per woman (1960-2009)
Source: WDI & GDF
0
2
4
6
8
1960
1963
1966
1969
1972
1975
1978
1981
1984
1987
1990
1993
1996
1999
2002
2005
2008
Gabon
Gambia, The
Liberia
South Africa
0
2
4
6
8
1960
1963
1966
1969
1972
1975
1978
1981
1984
1987
1990
1993
1996
1999
2002
2005
2008
Burkina Faso
Burundi
Eritrea
Ethiopia
0
2
4
6
8
10
1960
1963
1966
1969
1972
1975
1978
1981
1984
1987
1990
1993
1996
1999
2002
2005
2008
Malawi
Niger
Rwanda
Uganda
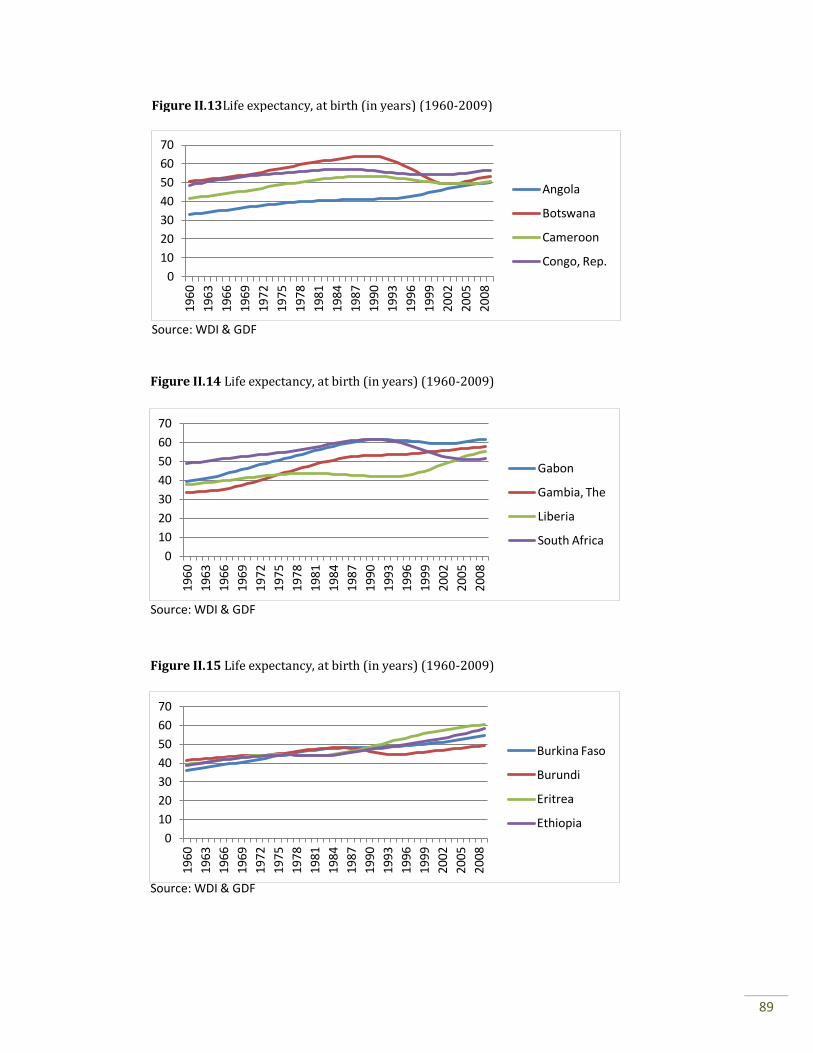
89
Figure II.13Life expectancy, at birth (in years) (1960-2009)
Source: WDI & GDF
Figure II.14 Life expectancy, at birth (in years) (1960-2009)
Source: WDI & GDF
Figure II.15 Life expectancy, at birth (in years) (1960-2009)
Source: WDI & GDF
0
10
20
30
40
50
60
70
1960
1963
1966
1969
1972
1975
1978
1981
1984
1987
1990
1993
1996
1999
2002
2005
2008
Angola
Botswana
Cameroon
Congo, Rep.
0
10
20
30
40
50
60
70
1960
1963
1966
1969
1972
1975
1978
1981
1984
1987
1990
1993
1996
1999
2002
2005
2008
Gabon
Gambia, The
Liberia
South Africa
0
10
20
30
40
50
60
70
1960
1963
1966
1969
1972
1975
1978
1981
1984
1987
1990
1993
1996
1999
2002
2005
2008
Burkina Faso
Burundi
Eritrea
Ethiopia

90
Figure II.16 Life expectancy, at birth (in years) (1960-2009)
Source: WDI & GDF
Figure II.17 Labor participation rate, % of total (1980-2009)
Source: WDI & GDF
Figure II.18 Labor participation rate, % of total (1980-2009)
Source: WDI & GDF
0
10
20
30
40
50
60
1960
1963
1966
1969
1972
1975
1978
1981
1984
1987
1990
1993
1996
1999
2002
2005
2008
Malawi
Niger
Rwanda
Uganda
0
20
40
60
80
100
1980
1982
1984
1986
1988
1990
1992
1994
1996
1998
2000
2002
2004
2006
2008
Angola
Botswana
Cameroon
Congo, Rep.
0
20
40
60
80
100
19
80
19
82
19
84
19
86
19
88
19
90
19
92
19
94
19
96
19
98
20
00
20
02
20
04
20
06
20
08
Gabon
Gambia, The
Liberia
South Africa

91
Figure II.19 Labor participation rate, % of total (1980-2009)
Source: WDI & GDF
Figure II.20 Labor participation rate, % of total (1980-2009)
Source: WDI & GDF
0
20
40
60
80
100
1980
1982
1984
1986
1988
1990
1992
1994
1996
1998
2000
2002
2004
2006
2008
Burkina Faso
Burundi
Eritrea
Ethiopia
0
20
40
60
80
100
1980
1982
1984
1986
1988
1990
1992
1994
1996
1998
2000
2002
2004
2006
2008
Malawi
Niger
Rwanda
Uganda

92
Appendix III
This appendix offers a more thorough presentation of the result of the tables that were split in
quintiles (Appendix II). Each and every variable is gone through carefully to reveal the positioning
of the focus groups and the control groups. Moreover, the sections offer some discussions around the
actual values of the variables, rather than only the quintile positioning. This is very important
because although some countries are allocated in the same quintile, they might still differ greatly in
actual values.
III.1 Urban population, % of total, year 1960 (Appendix II, Table II.2)
All of the rural focus countries are located on the bottom half of the table. This means that already in
1960, these eight countries had comparatively low urban population in relation to total population.
However, there is still a difference of a couple of percentages between the country with the least
urban population (Burundi, 2%) and the country with the most (Eritrea, 9.8%) out of the rural focus
countries.
While the rural focus countries are seemingly allocated rather close to each other, this is not
the case with the urban focus countries. The eight urban focus countries can be found in quintile 1, 2,
3, and 5. As such, they represent both the top and the bottom of urbanized sub-Saharan African
countries in 1960.
South Africa was by far the country with the highest degree of urban population in 1960 with
its 46.6%. Out of the urban focus countries, Botswana had the least urban population in 1960, merely
3.1%. Hence, the urban focus countries started out on uneven grounds in 1960.
The control countries are dispersed in three different quintiles; quintile 2, 3 and 5.
III.2 Urban population growth, annual %, year 2009 (Appendix II, Table II.3)
The rural focus countries are all located on the top half of the table; that is, among the sub-Saharan
African countries with the most rapid urban population growth. Four countries are found in the first
quintile: Malawi, Burundi, Burkina Faso and Eritrea. The remaining four countries are found in
quintile two and three respectively.
The urban focus countries are found within all five quintiles. South Africa, Gabon and
Botswana are located in the fifth quintile; in order words, among the countries with the least urban
population growth. Interestingly, Liberia is not only found in the first quintile, but is also the country
with highest urban population growth of all sub-Saharan African countries. Again, there is no
apparent consistency among the urban focus countries; their properties differ greatly.
Three of the control countries are found in quintile 4 and 5 respectively, in other words, quite
low urban population growth. The remaining country however, is located in quintile 2.
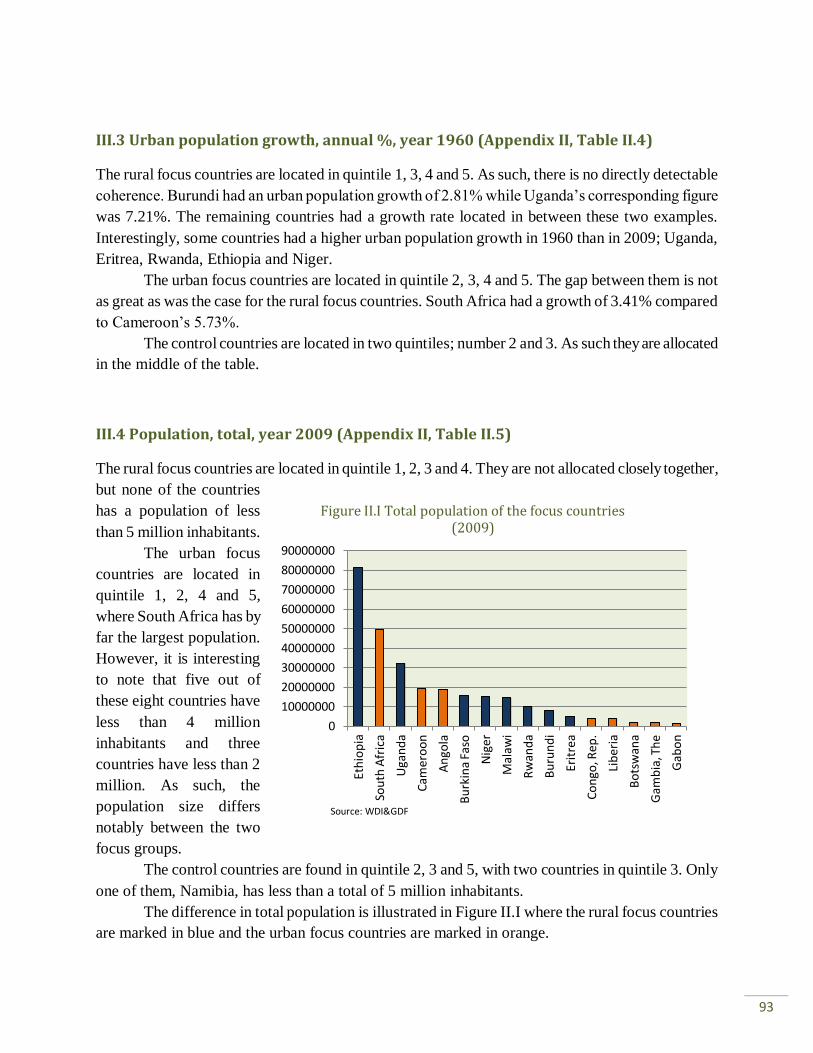
93
III.3 Urban population growth, annual %, year 1960 (Appendix II, Table II.4)
The rural focus countries are located in quintile 1, 3, 4 and 5. As such, there is no directly detectable
coherence. Burundi had an urban population growth of 2.81% while Uganda’s corresponding figure
was 7.21%. The remaining countries had a growth rate located in between these two examples.
Interestingly, some countries had a higher urban population growth in 1960 than in 2009; Uganda,
Eritrea, Rwanda, Ethiopia and Niger.
The urban focus countries are located in quintile 2, 3, 4 and 5. The gap between them is not
as great as was the case for the rural focus countries. South Africa had a growth of 3.41% compared
to Cameroon’s 5.73%.
The control countries are located in two quintiles; number 2 and 3. As such they are allocated
in the middle of the table.
III.4 Population, total, year 2009 (Appendix II, Table II.5)
The rural focus countries are located in quintile 1, 2, 3 and 4. They are not allocated closely together,
but none of the countries
has a population of less
than 5 million inhabitants.
The urban focus
countries are located in
quintile 1, 2, 4 and 5,
where South Africa has by
far the largest population.
However, it is interesting
to note that five out of
these eight countries have
less than 4 million
inhabitants and three
countries have less than 2
million. As such, the
population size differs
notably between the two
focus groups.
The control countries are found in quintile 2, 3 and 5, with two countries in quintile 3. Only
one of them, Namibia, has less than a total of 5 million inhabitants.
The difference in total population is illustrated in Figure II.I where the rural focus countries
are marked in blue and the urban focus countries are marked in orange.
0
10000000
20000000
30000000
40000000
50000000
60000000
70000000
80000000
90000000
Eth
iop
ia
Sou
th A
fric
a
Uga
nd
a
Cam
ero
on
An
gola
Bu
rkin
a Fa
so
Nig
er
Mal
awi
Rw
and
a
Bu
run
di
Erit
rea
Co
ngo
, Rep
.
Lib
eria
Bo
tsw
ana
Gam
bia
, Th
e
Gab
on
Source: WDI&GDF
Figure II.I Total population of the focus countries (2009)

94
III.5 Population, total, year 1960 (Appendix II, Table II.6)
Similarly to the outline above, the rural focus countries are found in quintile 1, 2, 3 and 4. Position-
wise, the difference is not great between 2009 and 1960. However, all countries have experienced a
huge population increase.
The same applies to the urban focus countries. Those countries that in 2009 had less than 4
million inhabitants have less than 1.5 million in 1960.
The control countries are found in quintile 1, 2, 3 and 5, so there has been some mobility
compared to 2009. Similarly to the focus countries, the control group countries have experienced a
large increase in total population.
III.6 Land area, square kilometers, year 2009 (Appendix II, Table II.7)
The rural focus countries are found within all five quintiles. The land area difference is massive;
from Niger with 1,266,700 km2 to Rwanda with 24,670 km
2. However, six countries out of eight are
located on the bottom half of the table. Only Niger and Ethiopia are above.
Similarly, the difference in land area is great also among the urban focus countries, from
Angola with 1,246,700 km2 to Gambia with 10,000 km
2. Four of the eight countries are found in the
mid-quintile, that is, quintile 3.
Contrary to the focus countries, the control countries are located quite close to each other on
the table; three countries in quintile 2 and one in quintile 3. The differences between the countries
are in other words less for the control countries.
III.7 Population growth, annual %, year 2009 (Appendix II, Table II.8)
Six out of the eight rural focus countries are in the quintile of the highest population growth, that is,
quintile 1. A seventh country; Burundi, is found in quintile 2. Ethiopia, however, is found in quintile
4. The majority of the rural focus countries hence possess among the highest population growth rates
in all of sub-Saharan Africa.
The urban focus countries are less coherent with each other. They can be found in all five
quintiles, where three out of the eight countries are located in the fifth quintile. Liberia stands out as
being the country with the highest population growth rate in all of sub-Saharan Africa.
The control countries are located in quintile 3, 4 and 5. As such, their population growth is in
many cases lower than both rural- and urban focus countries.
The rural focus countries appear to follow some sort of pattern in this particular variable,
whilst the urban focus countries do not.

95
III.8 Population growth, annual %, year 1985 (Appendix II, Table II.9)
Compared to 2009, the table and the location of the focus countries look slightly different. The rural
focus countries are no longer in close proximity to each other, but represented in four out of five
quintiles. However, although the positioning is different, some countries had a higher population
growth in 1985 than in 2009.
The positioning of the urban focus countries in 1985 differs also from that of 2009. Most of
them can be found somewhere around the middle of the table. However, two countries stand out as
being located far away from the other. The first one is Gambia, which in 1985 has the greatest
population growth of all of sub-Saharan Africa. The second country is Liberia, which, surprisingly,
is in 1985 found in the fifth (last) quintile. Recall that Liberia in 2009 was the country with the
greatest population growth. The country has, in other words, progressed from the bottom to the top
in a matter of less than 25 years.
Also the control countries have quite different quintile positioning compared to in 2009. One
country is found in quintile 1, one in quintile 2 and two countries in quintile 5. Zimbabwe is the
country in quintile number 1, while in 2009 the country’s position was in quintile 5.
It should be noted that the other countries (both the rural focus countries and the urban) have
not experienced such surges or downfalls in population growth (as compared to Liberia, Gambia and
Zimbabwe). Most countries’ population growth differs by some 10th
of a percent up to around 1% -
not more.
III.9 Population growth, annual %, year 1960 (Appendix II, Table II.10)
The rural focus countries can be found in all of the five quintiles. This is interesting when compared
to the previously examined years; 1985 and 2009. Seemingly, these eight countries have moved
closer and closer together (at least the majority of them).
Likewise, the urban focus countries are also located within all five quintiles. Gambia is again
the only country out of the eight that is represented in the first quintile. Although it is does not
possess the highest population growth of sub-Saharan Africa, it is within top 3. At the very bottom,
however, we find Gabon. As such, the most urbanized countries are represented all over the chart
with countries both at the bottom and in the top.
The control countries are found in quintile 1, 3 and 4. Zimbabwe is once again located in the
first quintile.
III.10 Total fertility rate, births per woman, year 2009 (Appendix II, Table II.11)
Five of the eight rural focus countries are found in quintile 1 and 2. The remaining three are located
in the fourth quintile. Niger has the leading position of all of sub-Saharan Africa with a total fertility

96
rate of 7.12, while Ethiopia has the lowest rate of the rural focus countries (4.35).
The urban focus countries are found in all of the quintiles but the first. The total fertility rate
differs between 5.58 (Angola) and 2.5 (South Africa).
It is worth noting that in the first quintile, that of highest total fertility rate, three of the rural
focus countries are represented – but none of the urban focus countries. In the fifth quintile,
however, three of the urban focus countries are found – but none of the rural.
The control countries are present in quintile 1, 3 and 5, where two countries are in the latter
quintile. As such, these countries are quite dispersed.
III.11 Total fertility rate, births per woman, year 1960 (Appendix II, Table II.12)
Seven of the eight rural focus countries are located in the two top quintiles; two countries are in the
first quintile and five in the second. Burkina Faso is the country not following this pattern; it is found
in the fourth quintile.
The urban focus countries are found in quintile 1, 3 and 5. Angola is the one country
represented in the first quintile. Four countries are in the fifth quintile Gabon, Gambia and Cameroon
together constitute the three countries with the least total fertility rate of sub-Saharan Africa in 1960.
As such, the rural focus countries generally had a higher total fertility rate than the urban
focus countries. However, this is not a clear cut case since not all countries follow this pattern.
Interestingly, this division between the urban and the rural focus countries might appear visible in
1960, but not in the above mentioned figures for year 2009.
The control countries are quite scattered also in 1960; two countries in quintile 1, one country
in quintile 3 and one in the 4th.
III.12 Rural population growth, annual %, year 2009 (Appendix II, Table II.13)
Seven out of the eight rural focus countries are closely located to each other. Six countries are
represented in the first quintile and one country in the second quintile. Ethiopia is the country located
further away; namely in the third quintile.
Six of the eight urban focus countries are located in the bottom two quintiles; four countries
in quintile 5 and two countries in quintile 4. Republic of Congo is in quintile 3, and Liberia is in
quintile 1. Three countries (South Africa, Botswana and Gabon) experienced negative rural
population growth in 2009.
The control countries are located in quintile 3, 4 and 5, where Zimbabwe is the only country
with negative rural population growth. As such all control countries have less urban population
growth than all the rural focus countries.

97
III.13 Rural population growth, annual %, year 1960 (Appendix II, Table II.14)
The rural focus countries are not as closely located in 1960 as in 2009. However, three countries are
still found in quintile 1. The remaining are in quintile 2, 3 and 4.
Five of the urban focus countries are found in close proximity in quintile 4. Two countries,
Botswana and Gambia, are found in quintile 2 and 1, respectively. Gabon has the least rural
population growth of all of sub-Saharan Africa and is also the only country (in the entire region) to
have a negative rural population growth.
Three of the control countries are located in quintile 3, and one, Zimbabwe, in quintile 1.
III.14 Human Development Index, year 2009 (Appendix II, Table II.15)
The rural focus countries are distributed in the lower three quintiles; that is, quintile 3, 4 and 5. Two
countries are in quintile 3, another 2 in quintile 4, and three countries in quintile 5. Eritrea has no
available data so it has not been ranked. There is some internal difference; Niger has the lowest HDI
of the rural focus countries, namely 0.285. Uganda has the highest HDI of the rural focus countries:
0.438. Since HDI is a comparatively encompassing variable, it is clear that the rural focus countries
are not identical in certain factors.
Six out of the eight urban focus countries are located in quintile 1 and 2. Gambia is found in
quintile 3 and Liberia in quintile 5. While the majority of the urban focus countries are evidently
among the sub-Saharan African countries with the highest HDI ranks, there is noticeable difference
between the countries. 3 countries have over 0.6 HDI and 4 countries have less than 0.4. Liberia has
0.32 HDI; a number lower than most of the rural focus countries.
Generally spoken, the urban focus countries are located higher up on the table than the rural
focus countries.
For the control countries, Namibia is found in the first quintile and has as such comparatively
high HDI. Zimbabwe and Mozambique are found in quintile 4 and 5 respectively, while Somalia
lacks data altogether.
As previously mentioned; Eritrea lacks data of HDI for this year, and so does Somalia. This
means that, in this particular table, quintile 3 has 8 entries instead of 10.
III.15 Gross Domestic Product growth, annual %, year 2009 (Appendix II, Table II.16)
Seven out of the eight rural focus countries are located on the top half of the table. Three countries
are found in quintile 1; two countries are in quintile 2 and two countries in quintile 3. Niger is
located in quintile 5, and it is also the only country (out of the rural ones) to have a negative figure. It
is worth nothing that Ethiopia and Malawi are the two countries with the highest growth in all of
sub-Saharan Africa.
The urban focus countries are located all over the table: two countries in quintile 1, one

98
country in quintile 2, two countries in quintile 4 and three countries in quintile 5. Gabon, South
Africa and Botswana are all in quintile 5, all with a negative figure. The growth difference between
the urban focus countries is huge; from Botswana with a value of -4.93% to Republic of Congo with
a corresponding value of 7.47%.
Only three control countries had data available for this variable. Out of those, Mozambique is
located in the 1st quintile, Zimbabwe in the 2
nd and Namibia in the 3
rd.
There was no data available for Somalia and as such the division of the quintiles is slightly
skewed (quintile 3 has only 9 entries instead of its usual 10).
III.16 GDP per capita, PPP, constant 2005 international $, year 2009 (Appendix II, Table
II.17)
All of the rural focus countries are on the bottom half of the table. That being said, two countries are
in quintile 3, two countries in quintile 4 and four countries in quintile 5. Even so, the numbers are
nowhere similar. Burundi has a GDP per capita of 361.84 while Uganda’s corresponding value is
1120.60. The other countries
are in between these two
figures.
Five of the urban
focus countries are found in
quintile 1. One country is
found in quintile 2, in close
proximity to those previously
mentioned. Gambia is found
in the 3rd
quintile and Liberia
in the 5th
. Once again, Liberia
differs from the other urban
focus countries by having a value that resembles of that of the rural focus countries. Although
several countries are closely located on the table, the difference in GDP per capita is great.
Despite the internal differences within the two focus groups, the urban focus countries have
higher GDP per capita than the rural focus countries (with the exception of Liberia). Figure II.2
displays the values; the urban focus group marked in orange and the rural in blue.
Only two control countries are presented here because of data infrequency. Mozambique is
located in the 4th quintile while Namibia is in the 1
st.
Two countries lacked data; Somalia and Zimbabwe. Therefore quintile 3 contains only 8
entries.
0
5000
10000
15000
Source: WDI&GDF
Figure II.2 GDP/cap, ppp, constant 2005 international $ (2009)

99
III.17 GDP per capita, PPP, constant 2005 international $, year 1989 (Appendix II, Table
II.18)
Seven of the rural focus countries are either in quintile 4 or quintile 5. There is no data for Eritrea
and therefore it is not accounted for in this particular variable. For 1989, the difference between the
rural focus countries is less than in 2009. Recall the range between Uganda and Burundi from 4.2.16.
In 1989, Burundi still has the lowest GDP per capita (482.95) and Rwanda has the highest (742.33).
In other words, there was greater coherence in 1989. Since that year, some countries have
experienced an increase in GDP per capita which has then stretched the range.
The urban focus countries that in 2009 were in quintile 1 (there were five of them) were also
in quintile 1 year 1989, although with slightly different positions and different values. Cameroon is
located in quintile 2; same quintile as in 2009. Gambia is located in quintile 3, also the same quintile
as in 2009. Liberia, on the other hand, is just like Gambia found in quintile 3, and not in quintile 5 as
in 2009. While the other countries have maintained rather similar positions in year 1989 and 2009,
Liberia stands out.
The GDP per capita differs for the rural- and urban focus countries for year 1989 and 2009
alike. But it is worth nothing that the quintile positioning remained quite static for the urban focus
countries during these two years. For the rural focus countries there has been some mobility, but
even so they are inferior to the urban focus countries in terms of GDP per capita even in 1989.
As with the foregoing variable, data for the control countries is only available for
Mozambique and Namibia. The former is found in quintile 5 and the latter in quintile 1.
Three countries did not have any data available; Eritrea, Somalia and Zimbabwe. Therefore
quintile 3 contains only 7 entries and the rural focus countries lacked one member compared to the
urban.
III.18 Arable land, % of land area, year 2009 (Appendix II, Table II.19)
Four of the rural focus countries are found in quintile 1. Two countries are in quintile 2, one in
quintile 3 and one in quintile 4. The arable land percentage difference is huge between these
countries. The extreme values are 6.83% for Eritrea and 52.70% for Rwanda. While the majority of
the rural focus countries are located on the upper half of the chart, this is mooted by the great
discrepancy between the countries.
Three of the urban focus countries are found in quintile 5, two in quintile 4, two in quintile 2
and one in quintile 1. As such, there is a varying degree of arable land among the urban focus
countries. As with the rural focus countries, the extreme values differ greatly. While Gambia has
40% arable land, Botswana has 0.44%.
One of the control countries is found in quintile 3, one in quintile 4 and two in quintile 5.
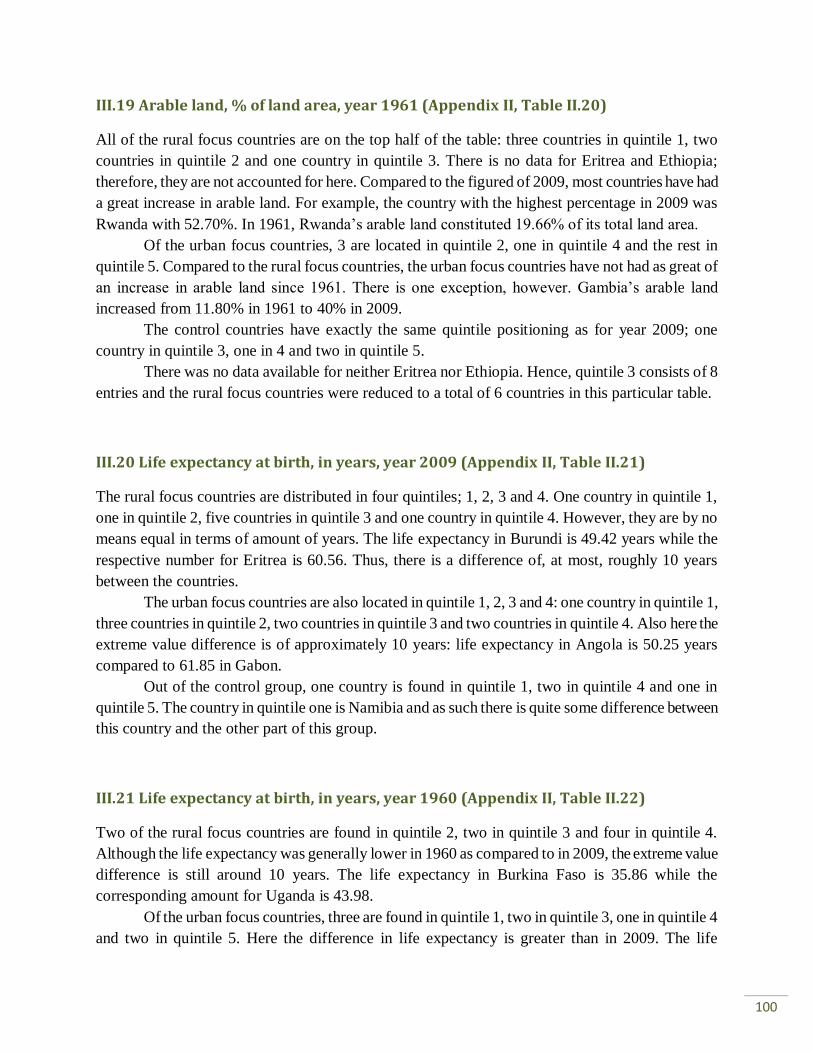
100
III.19 Arable land, % of land area, year 1961 (Appendix II, Table II.20)
All of the rural focus countries are on the top half of the table: three countries in quintile 1, two
countries in quintile 2 and one country in quintile 3. There is no data for Eritrea and Ethiopia;
therefore, they are not accounted for here. Compared to the figured of 2009, most countries have had
a great increase in arable land. For example, the country with the highest percentage in 2009 was
Rwanda with 52.70%. In 1961, Rwanda’s arable land constituted 19.66% of its total land area.
Of the urban focus countries, 3 are located in quintile 2, one in quintile 4 and the rest in
quintile 5. Compared to the rural focus countries, the urban focus countries have not had as great of
an increase in arable land since 1961. There is one exception, however. Gambia’s arable land
increased from 11.80% in 1961 to 40% in 2009.
The control countries have exactly the same quintile positioning as for year 2009; one
country in quintile 3, one in 4 and two in quintile 5.
There was no data available for neither Eritrea nor Ethiopia. Hence, quintile 3 consists of 8
entries and the rural focus countries were reduced to a total of 6 countries in this particular table.
III.20 Life expectancy at birth, in years, year 2009 (Appendix II, Table II.21)
The rural focus countries are distributed in four quintiles; 1, 2, 3 and 4. One country in quintile 1,
one in quintile 2, five countries in quintile 3 and one country in quintile 4. However, they are by no
means equal in terms of amount of years. The life expectancy in Burundi is 49.42 years while the
respective number for Eritrea is 60.56. Thus, there is a difference of, at most, roughly 10 years
between the countries.
The urban focus countries are also located in quintile 1, 2, 3 and 4: one country in quintile 1,
three countries in quintile 2, two countries in quintile 3 and two countries in quintile 4. Also here the
extreme value difference is of approximately 10 years: life expectancy in Angola is 50.25 years
compared to 61.85 in Gabon.
Out of the control group, one country is found in quintile 1, two in quintile 4 and one in
quintile 5. The country in quintile one is Namibia and as such there is quite some difference between
this country and the other part of this group.
III.21 Life expectancy at birth, in years, year 1960 (Appendix II, Table II.22)
Two of the rural focus countries are found in quintile 2, two in quintile 3 and four in quintile 4.
Although the life expectancy was generally lower in 1960 as compared to in 2009, the extreme value
difference is still around 10 years. The life expectancy in Burkina Faso is 35.86 while the
corresponding amount for Uganda is 43.98.
Of the urban focus countries, three are found in quintile 1, two in quintile 3, one in quintile 4
and two in quintile 5. Here the difference in life expectancy is greater than in 2009. The life

101
expectancy in Angola in 1960 was 32.99 years while Botswana’s was 50.54.
For the control group, two countries are found in quintile 1, one in quintile 4 and one in
quintile 5. Namibia and Zimbabwe are the ones in quintile one, as such, Namibia has maintained its
comparatively high life expectancy while Zimbabwe’s has been lowered.
III.22 Mortality rate, under-5 (per 1000 live births), year 2009 (Appendix II, Table II.23)
The rural focus countries are represented in all five quintiles. One country is in the first quintile, two
countries in the 2nd
, three countries in the 3rd
, one country in the 4th
and one in the 5th
. Hence, there is
no apparent consistency among the rural focus countries. In fact, the mortality rate differs by quite a
bit. The country in quintile 5, Eritrea, has a mortality rate of 63.2 per 1000. The country in quintile 1,
Burkina Faso, has a mortality rate of 178 per 1000.
The urban focus countries are also present in all quintiles. One in quintile 1, one in quintile 2,
two countries in quintile 3, one in quintile 4 and three countries in quintile 5. The extreme values are
very different also for the urban focus countries. Angola has a mortality rate of 164.3 per 1000 while
Botswana has a mortality rate of 49.4 per 1000.
There is no apparent division between the rural- and the urban focus countries. They are all
present in every quintile, although with slight differences.
The control countries are present in 4 quintiles, in other words, also quite dispersed. One
country is in quintile 1, one in the 2nd
, one in the 4th
and then, one in the 5th.
III.23 Labor participation rate, % of total, year 2009 (Appendix II, Table II.24)
Five of the rural focus countries are in quintile 1. One country is in quintile 2, one in quintile 3 and
one in quintile 5. As such, the majority of the rural focus country has a comparatively high
percentage of labor participation. However, the extreme values are 62.7% (Niger) compared to
89.3% (Burundi), which reveals incoherence among these eight countries. Of the urban focus
countries, three are found in quintile 2, three in quintile 3, one in quintile 4 and one in quintile 5.
The location of the urban focus countries is not as concentrated as for the rural, but the
extreme values are quite different also for the urban focus countries. South Africa has a labor
participation rate of 55% while Angola’s corresponding figure is 81.3%. The majority of the rural
focus countries are located in the first quintile, but none of the urban focus. As such, five of the rural
focus countries have a higher labor participation rate than the country with the highest rate of the
urban focus countries.
The control countries are located in quintile 1, 4 and 5, where two countries are in the 4th
quintile. As such, the majority of the control countries also have quite low labor participation, where
Mozambique stands out by being in the 1st quintile.

102
III.24 Health expenditure per capita, PPP, constant 2005 international $, year 2009
(Appendix II, Table II.25)
The rural focus countries are found in quintile 2, 3, 4 and 5. One country is in quintile 2, two in
quintile 3, two in quintile 4 and three in quintile number 5. Thus, five of the eight countries are
among the 50% countries with the least health expenditure. Eritrea has the lowest value of all of sub-
Saharan Africa, $13.45. Uganda has the highest value of the rural focus countries: $114.91.
Evidently, the health expenditure differs greatly between the countries.
Four of the urban focus countries are located in quintile 1. Two countries are in the 2nd
quintile, one in the 3rd
quintile and one country in the 4th
. The health expenditure differs even more
between the urban focus countries than was the case for the rural focus countries. Liberia spends
$53.54 on health expenditure while Botswana’s corresponding number is $1340.99.
Despite the differences within the two focus groups, the urban focus countries generally
invest more in health expenditure than the rural. Six of the urban focus countries have higher health
expenditure per capita than Uganda, which is the country with the highest value of the rural focus
countries. Five of the rural focus countries have less health expenditure per capita than Liberia,
which is the country with the lowest value of the urban focus countries.
Only two countries out of the control group have data available; Mozambique and Namibia.
The former is in the 4th quintile and the latter in the 1
st.
Two countries, Somalia and Zimbabwe, are excluded in this table because of unavailable
data. Therefore, quintile 3 consists of 8 entries instead of 10.
III.25 Prevalence of HIV, total (% of population ages 15-49), year 2009 (Appendix II,
Table II.26)
The rural focus countries appear in quintile 2, 3, 4 and 5. Two countries are in quintile 2, two in
quintile 3, one in quintile 4 and two countries in quintile 5. Ethiopia is excluded from this particular
variable due to lack of data. Between the countries, the prevalence of HIV ranges from 0.8% to 11%
indicating little conformity in this matter.
The urban focus countries are found in quintile 1, 2, 3, and 4. Two countries are in the first
quintile, two in the 2nd
, two in the 3rd
and two in the 4th. The percentage between the countries
differs greatly. The prevalence of HIV in Liberia is reported to be 1.5% while in Botswana the
corresponding figure is 24.8%.
Although Botswana and South Africa stand out with a much higher HIV prevalence than any
other country, this is not the case for the remaining urban focus countries. In fact, disregarding
Botswana and South Africa, Uganda and Malawi are the countries with the highest prevalence of
HIV.
Three of the control countries are found in quintile 1, and one, Somalia, in the 5th quintile. As
such, the majority of the control countries are affected by high HIV prevalence.
103
Democratic Republic of the Congo and Ethiopia are not accounted for in this table because of
absence of data. Therefore, quintile 3 is reduced to three entries.
III.26 Age dependency ratio (% of working age population), year 2009, (Appendix II,
Table II.27)
The rural focus countries are represented in all quintiles. Three countries are in the 1st quintile, one in
the 2nd
, two in the 3rd
and one country in quintile 4 and 5 respectively. Niger and Uganda have the
two highest ratios of all of sub-Saharan Africa, which is more than double the amount of the country
with the lowest ratio. The rural focus country with the lowest ratio is Burundi: 70.23; and the highest
is Niger: 104.75. Hence, there is quite some difference between the countries in this focus group.
The urban focus countries have a similar constellation to the rural-, although mirrored. The
countries appear in each of the quintiles, but three are located in the 5th
. Two countries appear in the
4th quintile, and one country in each of the remaining quintiles. The range is 43.73 between the
highest and the lowest ratio of the urban focus countries; Angola and South Africa. Hence, there is
little coherence among these focus countries.
The control group countries are spread in three quintiles; two countries in quintile 2, one in
quintile 4 and one in quintile 5.
III.27 Population in the largest city (% of urban population), year 2009, (Appendix II,
Table II.28)
Three of the rural focus countries appear in the 1st quintile; one country in quintile 2, two countries
in quintile 3, and one country in quintile 4 and 5 respectively. The percentage differs between the
countries; Eritrea has the highest number of 60.16% and Ethiopia has the lowest, 20.38%.
One urban focus country is present in the 1st quintile, three countries in the 2
nd, one in the 3
rd
and three countries in the fifth. As such, there are some disparities also within this focus group. The
lowest degree is 11.95% and the highest is 53.13%.
It is interesting to note that the urban focus countries are allocated around two points on the
table, while the rural focus countries are more evenly distributed.
The control countries are found in quintile 2, 3 and 5, where two countries are in the 2nd
quintile.