urban planning and building smart cities based on the...
TRANSCRIPT

Accepted Manuscript
Urban planning and building smart cities based on the internet ofthings using big data analytics
M. Mazhar Rathore , Anand Paul , Awais Ahmad , Suengmin Rho
PII: S1389-1286(16)00008-6DOI: 10.1016/j.comnet.2015.12.023Reference: COMPNW 5796
To appear in: Computer Networks
Received date: 31 July 2015Revised date: 22 December 2015Accepted date: 23 December 2015
Please cite this article as: M. Mazhar Rathore , Anand Paul , Awais Ahmad , Suengmin Rho , Urbanplanning and building smart cities based on the internet of things using big data analytics, ComputerNetworks (2016), doi: 10.1016/j.comnet.2015.12.023
This is a PDF file of an unedited manuscript that has been accepted for publication. As a serviceto our customers we are providing this early version of the manuscript. The manuscript will undergocopyediting, typesetting, and review of the resulting proof before it is published in its final form. Pleasenote that during the production process errors may be discovered which could affect the content, andall legal disclaimers that apply to the journal pertain.

ACCEPTED MANUSCRIPT
ACCEPTED MANUSCRIP
T
Urban Planning and Building Smart Cities based on the Internet of Things
using Big Data Analytics
M. Mazhar Rathore1, Anand Paul
2 , Awais Ahmad
3, Suengmin Rho
4
1, 2, 3 The School of Computer Science and Engineering, Kyungpook National University, Daegu, 702-701, Korea [email protected], [email protected], [email protected] 4 Department of Multimedia, Sungkyul University, Anyang, Korea,
Corresponding Author: [email protected] (Anand Paul)
Abstract— The rapid growth in the population density in urban cities demands tolerable provision of services and infrastructure.
To meet the needs of city inhabitants. Thus, increase in the request for embedded devices, such as sensors, actuators, and
smartphones, etc., which is providing a great business potential towards the new era of Internet of Things (IoT); in which all the
devices are capable of interconnecting and communicating with each other over the Internet. Therefore, the Internet technologies
provide a way towards integrating and sharing a common communication medium. Having such knowledge, in this paper, we
propose a combined IoT-based system for smart city development and urban planning using Big Data analytics. We proposed a
complete system, which consists of various types of sensors deployment including smart home sensors, vehicular networking,
weather and water sensors, smart parking sensors, and surveillance objects, etc. A four-tier architecture is proposed which
include 1) Bottom Tier-1: which is responsible for IoT sources, data generations, and collections 2) Intermediate Tier-1: That is
responsible for all type of communication between sensors, relays, base stations, the internet, etc. 3) Intermediate Tier 2: it is
responsible for data management and processing using Hadoop framework, and 4) Top tier: is responsible for application and
usage of the data analysis and results generated. The system implementation consists of various steps that start from data
generation and collecting, aggregating, filtration, classification, preprocessing, computing and decision making. The proposed
system is implemented using Hadoop with Spark, voltDB, Storm or S4 for real time processing of the IoT data to generate results
in order to establish the smart city. For urban planning or city future development, the offline historical data is analyzed on
Hadoop using MapReduce programming. IoT datasets generated by smart homes, smart parking weather, pollution, and vehicle
data sets are used for analysis and evaluation. Such type of system with full functionalities does not exist. Similarly, the results
show that the proposed system is more scalable and efficient than the existing systems. Moreover, the system efficiency is
measured in term of throughput and processing time.
Index Terms— IoT, Urban planning, Smart city, Big Data.
1. INTRODUCTION
An emergent number of objects are being connected to the Internet at an extraordinary rate comprehending the knowledge of the
Internet of Things (IoT). In 2008, CISCO reported that the number of things connected to the Internet surpassed the number of
people living on earth, whereas, in 2020, it will touch the limit of 50 billion, resulting in enrichment of the digital world [1].
There is a different domain in which IoT plays a vital role and improve the quality of human life. The people are also now using
the capillary devices in IoT for health applications [2]. Similarly, there are a lot of other domains where IoT facilitates the
humans in a noteworthy way including healthcare, automation, and transportation, emergency response to man-made and natural
disasters where it is hard for the human to make decisions.
IoT empowers object’s capabilities of hearing, seeing, listening and communicating them together. Thus, IoT transforms those
objects from being traditional toward smart by incorporating its ubiquitous and pervasive computing, embedded devices (e.g.,
actuators, smartphones, tablets, and other networked-enabled devices), communication technologies, sensor networks, Internet
Protocols and applications, revolutionize the way of human beings. The Internet will be no longer considered as the network of
computers. However, it will be involved with the billions of smart devices along with the embedded systems. As a result, Internet
of Things (IoT) will significantly increase its size and scope, providing a new way of opportunities, as well as challenges [3].
The majority of the countries have put forward longstanding national strategies for the implementations of IoT after completing
the intangible stage of service level. For instance, Japan’s broadband access is providing the facility of communication between
people, people and things, and things and things [4]. Similarly, S. Korea’s smart home enables their people to access things
remotely [5]. Singapore next generation I-Hub [6] intentions to comprehend the next generation “U” type network through a
secure and ubiquitous network [7]. The stated initiatives laid the foundation of IoT [8]. Moreover, the efforts in Tag free activity
sensing using RFID [9], evidence theory [10], and mobile ad-hoc social networking [11] leads us towards the advancement in
IoT.
Due to that fact that IoT is considered as the next big prospect to the world of Internet. Thus, leading us toward the concept of
smart homes where different electronic appliances are interconnected with each other and achieving high-quality two-way
interactive multimedia services. In such system, where a large number of devices are communicating with each other, generating

ACCEPTED MANUSCRIPT
ACCEPTED MANUSCRIP
T
a massive volume of data (termed as Big Data). To enrich the smart home technology, the better analytics of Big Data could play
a vital role in the advancement of Information and Communications Technologies (ICTs). Such kind of Big Data analysis
provides a better understanding and useful information about the future as well as planning and development. Thus, providing us
the insight knowledge about the Big Data.
Other than that, to make the IoT more appealing, traditional application can be considered, i.e., the smart home where embedded
devices, such as sensors and actuators are self-configurable and can be controlled remotely with the help of the Internet
Technology. Such kind of technology is used to enable a large variety of security, as well as monitoring application. A Large
number of involved devices senses surrounding’s activities and transmit massive amount of data to the remote station where it
can be processed, analyzed, and predict or give a response to the user for his/her convenience based on the received data. In the
literature, extensive research work has been performed on the Smart home technology [12] has been observed. Such research
work focused on individual homes. Similarly, the idea of the smart home is also extended towards the Smart Community where
Home Domain, Community Domain, and Service Domain are integrated to provide benefits to the human kind. However, such
technology is lacking off various factors, such as how to connect vehicles, roadside units, GPS, and other to the same
infrastructure, i.e., the central Web.
It is observed that 70% of the world’s population (more than six billion) will live in cities and neighboring regions by 2050 [13].
Having such massive volume of the population, billions of the devices will also communication with each other, this producing
overwhelming of Big Data. Hence, analyzing such data based on the user needs and choices, the cities would become even
smarter. Thus, powered by the variation of enabling technologies and their data analytics, the IoT has come across out of its early
stages and is entering into the era of revolutionizing the traditional network infrastructure into a fully integrated future the
internet. Wireless Sensor Network (WSN) and the related technologies flawlessly unified into urban infrastructure establishing a
digital skin over it [13]. The massive amount of information generated by the embedded and pervasive devices will be shared
across assorted platform and applications to enrich the cities smarter and predict accordingly in term of its planning and
development.
Traditionally, for urbanization, it is an utmost important factor to comprehend the demand for service profiling to enhance the
efficiency and may bring the recent advancement in the city management. Presently, few organization are on the way with their
platforms for live monitoring, planning and gathering urban process parameters. Such activities are followed by the amount of
data collected, offline and real-time Big Data processing and analysis, and decision making. Usually, data collection technique is
a costly and difficult to achieve. Therefore, there is a need to incorporate smart technology that could efficiently collect the huge
and fast data, performed analysis on Big Data, and predict the future for better planning and development [14, 15].
Having understood the feasibility and potential of the IoT and the smart home, in this paper, we propel the concept of the smart
home toward the smart city with the notion of urban planning and development based on Big Data analytics. In the paper, we
proposed the complete architecture to develop the smart city and does urban planning using IoT-based Big Data analytics. The 4-
tier architecture is proposed, which has the capability to analyze the huge amount of IoT datasets generating from various
sources of the smart system in the city, such as smart homes, smart car parking, vehicular traffic, etc. In addition, the complete
system implementation model is giving, which guides various municipalities to implement the system. Moreover, the analysis is
performed on the IoT datasets to make smart city decision using the proposed system. Finally, the system is tested and evaluated
with respect to efficiency measures in terms of throughput and processing time.
2. MOTIVATION
As mentioned earlier, smart cities become smarter due to the enrich nature of digital technology, in which smart city is equipped
with different electronic equipment utilized by the various application, such as street cameras for the surveillance system, sensors
for the transportation system, and so on so forth. Although, there are also initiatives that use objects to provide different value-
added services, such as Google street view, global positioning system (GPA), and so on so forth. Furthermore, the enriching
nature also grows toward the usage of individual mobile devices, contributing in the said scenario. Have said that, in this
heterogeneous environment in term of objects features, contributors, motivations, security rules, etc. different queries arises from
a city environment, which need to reciprocate [16]. These are:
How to tackle uncertainty induced due to the real-time and offline dynamics and ensure the quality of information?
How to make existing objects smarter? Alternatively, how to design new object smarter based on the user choice?
How to enable objects to react accordingly with respect to context?
How to minimize the cost of data collection that is being generated by some devices?
How to get an insight into the data if data is collected and going to processing stage in a real-time?
Based on the questions mentioned above, the smart city concept utilizes ICT in a way that could help the citizens in a very day
life within limited resources. Moreover, various organization aim to develop a system that uses advanced technology by

ACCEPTED MANUSCRIPT
ACCEPTED MANUSCRIP
T
providing the efficient services to their citizens. The majority of these recent technologies consists of advanced sensing
capabilities, storage capability for the unprecedented volume of data, and finally, to get an insight into the voluminous data.
The rationale behind our intentions is to enrich the vast deployment of ICT resources in developing the entire system. For this
very reason, we know that the advancement of recent technology in the embedded system depicts the trends of ICT. Therefore, a
system is required that could inhale all of the recent developments in the field of ICT, due to which a remarkable growth can be
seen in a near future. The design of this system requires all the capabilities of sensing the environment and analyzing the sensing
information. Therefore, various real-time action could be welcomed due to these technological resources. Moreover, it can be
seen that integrating a large amount of data to perform the efficient analysis are already performed at their best. However, with
large scale environment, it is unavoidable that the huge portion of data is left disjoint. As a result, such data cannot provide us a
better understanding of the situation so that we may plan for future. For this reason, urban planning and developing provide a
new way to the field of the IoT, in which devices are integrated by means of their geographic location, and they are analyzed by
means of a newly designed system for various services in a city.
Due to the fact that urban planning and development applications can be benefited from a smart city IoT capabilities can be
grouped into impact areas [13]. This includes the effect on the citizen in terms of health and safety, the transportation system in
terms of mobility and pollution, and so on so forth. Different projects related to monitoring of cyclist, cars, public car parking,
etc. are undergoing that utilizes sensors services for the collection of specific collection of data. Apparently, different other
service domain applications are identified that utilizes smart city IoT infrastructure to provision operations in air, noise,
pollution, vehicle mobility, and surveillance system in the cities. The recent research consists of a very few research findings in
the field of smart city as well as in urban areas. Similarly, a compact system is not yet built which is more scalable and efficient.
The Big Data is used to analyze different aspects of the smart city and then uses the knowledge obtain from the past generated
data for the betterment of cities. A similar concept is followed using the IoT paradigm and the Big Data concepts for urban
planning. Thus, we tried to come up with a solution that is applicable to be used in the smart city and as well as in the urban
areas. The proposed system is implemented and tested on the Hadoop framework with Spark to get the real time effects in the
case of real-time smart city decision. Moreover, Hadoop and MapReduce is used for large historical data for urban planning and
future enhancements.
3. URBAN PLANNING AND DEVELOPMENT SMART CITIES BASED ON IoT
The key concept of the smart city is to get the right information at the right place and on the right device to make the city related
decision with easiness and to facilitate the citizens more quick and fast ways. To develop the IoT-based smart city concept and
urban planning system, we deployed several wireless and wired sensors, surveillance cameras, emergency buttons in streets, and
other fixed devices. The main challenge in this regard is to achieve smart city system and link IoT information together. We do
this by providing relay nodes, aggregation classifiers, etc. Moreover, all sensors generate abundant data with high speed, which
is termed as Big Data. To process that data in an efficient way the Hadoop systems is employed. In this section, we provide a
complete architecture of how the sensors are deployed and how the sensors is generating data. Similarly, we proposed an IV-Tier
architecture and system implementation to clearly show the working of the proposed system.
Figure 1. Sensors Deployment
3.1. IoT-based smart city
One of the core challenge and perhaps many people might have the question in the mind that how IoT can be used to established
and build a smart city. Thus, we come up with the proper explanation and of course the answer to this question. IoT is called as
Vehicular Traffic
IoT Platform
Weather and water system
Environmental Pollution Surveillance
Smart Home Smart Parking
TimeNo of vehicles
Free slots
Total slots
Temperature
Gas consumption
water
Electricity consumption
Pollution Data
Wind speed
River/lake water
RainHumidity
Temperature
Pressure
Front screen sensors
Location
Time
others
Sulfur-di-oxide
Ozone
Carbon mono-oxide
others
Emergency buttonvoice
CCTVPedestrian count
Smoke
Noise
Smart City and Urban Planning
Aggregator

ACCEPTED MANUSCRIPT
ACCEPTED MANUSCRIP
T
the interlinking of heterogeneous devices with each other together over the internet. Since, we are moving towards the digital era,
homes, and cities and so on. Therefore, we initiate a thinking that the devices that are available in the homes and the
surroundings should be linked to the internet for fast accessibilities. In order to achieve our target, we deployed many sensors at
different places to collect the data and analyze that data for better usage. The ultimate goal is to achieve smart homes, smart
parking, weather and water systems, vehicular traffic, environment population and surveillance system.
In a smart home, the home is continuously monitored by sending data generated from the sensors measures the smoke and
temperature. Similarly, in order to detect fire at the real time, the electricity and gas consumption to effectively manage the
power, gas, and water consumption to the houses and different areas of the city. Similarly, monitoring the pollution helps in the
health care of the citizens and alert them when the pollution increases than a particular threshold.
The smart parking helps in the checking of vehicles coming and going out of different car parking zones. Thus, a smart car
parking can be design or the considering the number of vehicles in a region new car parking can be developed in the areas of
more cars. Similarly, the smart car parking data provides lot facilitation of the citizens as well as merchants as being a part of the
smart city. The citizens easily get the information of the nearest free slot of parking. Similarly, the citizen can get the information
from the smart city about more suitable places to park his/her vehicle. This system reduces the fuel consumption of vehicles.
Moreover, other applications may include safety of time wastage and a person can spend more time in a marketplace or other
activities.
Weather and water information also increases the efficiency of the smart city by providing the weather related data like
temperature, rain, humidity, pressure, wind speed and water levels at rivers, lakes, dams, and other reservoirs. All these
information is collected by placing the sensors in water reservoirs and other open places. In the world, most of the flood occur
due to the rain and similarly few by snow melting and dam breakage. Therefore, we use rain measuring sensors and snow
melting parameters in order to predict the flood earlier. We can also predict about the water reservoirs in advance to meet the
need of the water to the citizens.
Vehicular traffic information is the most significant source of a smart city. Through this type of data source and with useful real-
time analysis the citizen and as well as government can get more benefits. The citizens can get the destination based on the
current intensity of traffic and the average speed of the vehicles. The traffic can be diverse through all the cities, and it will
reduce the fuel consumption as well as decreases pollution that occur due to the crowded traffic. Government authorities can also
get the real time of information about the blockage of the road due to the accident or other things. They can make necessary
action at the real time to manage the traffic. In our smart city system, we are getting the traffic information by GPRS, vehicular
sensors, as well as the sensors placed on the front screen of the car. We get the location of each vehicle, the number of vehicles
between two pairs of sensors placed at the various location of the city. Moreover, if any accident is happened the front screen
will be damage and the sensor will send the alert to the police, traffic authorities, and hospital. Similarly, we can do a lot of other
things with real-time to make it more efficient.
Moreover, for people health care conditions, monitoring the environmental pollution and delivering the information to the people
is also vital. A city can never be smart with unhealthy citizens. Therefore, while designing smart city, we put a separate module
to get environment data which includes gases information, such as particular metals, carbon monoxide sulfur di-oxide, ozone,
and noise as well as. These gases are very dangerous to human health that causes liver disordering, coughing, and heart diseases.
People should not go outside when these gases are more in the environment. Especially the children, old age people, people for
physical exercise, already sick people, should not go outside from their homes when any of the polluted gas is more in the
environment. This can only be possible when there is access to all these information to the people at a real time and generate
alerts when any of the gas excesses a particular threshold. Moreover, the place where there is more population, the government
should reduce the causes of the pollution, like moving industries to other areas, diverting traffic to the other routes, etc.
Last but not least, the most important thing for the people of the smart city is the security concerns. Security is achieved by the
proposed system by continuous monitoring the video of the whole city. However, it is very challenging to analyze the video and
detect any mishap with anyone at real time by the system. To overcome this limitation, we propose new scenarios that increase
the security of the system of the whole city. We put various emergency buttons including microphones at various places of the
city with surveillances cameras. When any mishap happens with anyone like robbery, car stolen, purse stolen, fighting, or
someone watching some illegal activity. He can just push the emergency button at any near place, and it will send the message to
the nearest police station etc. Thus, the police or security agencies can start monitoring the nearby locations through surveillance
cameras and can easily locate the imposter. Moreover, the information collected from different sensors can be used to avoid the
future security issues. This leads to providing a more secure environment to the citizens of the proposed smart city.
The complete IoT objects deployment is shown in Figure 1. There is one aggregation server that collects and aggregate the data
from all smart systems. The data is received with high speed. Therefore, the aggregation process is powerful enough to aggregate
the data and send it for analysis through IoT systems.
3.2. IoT-based Urban Planning

ACCEPTED MANUSCRIPT
ACCEPTED MANUSCRIP
T
For urban planning, the same IoT scenario is considered with same devices and sensors as shown in Figure 1. Only the different
in urban planning system is the use of sensors generated data and the purpose of analysis. In a smart city, we do real-time
decision making on real-time data on the other hand. In urban planning, we use the previous historical data generated from the
same smart city’s IoT devices and do planning for future regarding anything related to the city. For example by analyzing the
electricity consumption of the previous years, we predict the demand for next year and take necessary action to fulfill the
demands.
By smart home generated data government authorities can analyze previous energy consumption data and growing needs and
make future places for building new dams to produce more energy. Moreover, they can also analyze the pattern of usage energy
at different periods and manages the electricity and gas bills according to facilitates the citizens. They can also make energy
plans for various periods of the year accordingly. For smart parking and vehicular traffic generated data, new parking lots needs,
new building needs, places to build new roads or extend roads all these things can be planned for future. Based on the increase or
decrease in pollution due to the traffic changes is analyzed for identity the causes of pollution increases/decrease and make
planning accordingly. Similarly, analyzing the weather and water consumption data sets, we can make plans for agriculture, for
prior safety from floods, safety water, etc. Moreover, based on the temperature data and electricity consumption, we can make a
better plan for high-temperature seasons to reduce the consumption of electricity. Similarly, from surveillance data sets, we can
analyze the number of crime events, more dangerous place, more affected people, which crime is spreading, etc. based on these
data, the security places for the next year or even for next month can be prepared.
3.3. The Big Data Analytical Architecture and Implementation Model
Based on the needs of the smart city and urban planning, we proposed a 4-tier architecture to analyze IoT Big Data in order to
establish smart cities. The complete architecture is shown in Figure 2; the 1st tier is the bottom tier, two intermediate tiers, and
finally the top tier. Functionality of each tier is described below:
Tier 1. Bottom Tier: this layer handles data generation through various IoT sources and then collecting and aggregating that data.
Since there are a lot of IoT sensors participating in the generation of data, therefore a lot of heterogeneous data is produced with
varying format, a different point of origin and periodicity. Moreover, various data have security, privacy, and quality
requirements. Also, in sensor data, the Metadata is always greater than the actual measure. Therefore early registration and
filtration technique are applied at this layer, which filters the unnecessary Metadata, as well as repeated data, is also discarded.
Tier-II; Intermediate Tier-I: This tier is responsible for the communication between sensors, from sensors to relay node through
ZigBee technology, and rely to GW or base station and then on the internet using various communication technologies, such as
Wi-Fi, WiMAX, LTE, 3G, etc. At the analysis sides between various analysis servers, Ethernet is used.
Tier-III: Intermediate Tier-II: This layer is the main layer of the whole analytical system, which is responsible fo the processing
of data. Since we need real-time analysis for the smart system, therefore, we need a third party real-time tool to combine with
Hadoop to provide a real-time implementation. To provide real-time implementation, Strom, Spark, VoltDb could also be used.
However, for system evaluation, we implemented the system by using Spark. At lower layer of Hadoop, same structure of
MapReduce and HDFS is used. With this system, we can also use HIVE, HBASE, and SQL for managing Database (in-memory
or Offline) to store historical information. For urban planning, since we do not care about the real-time results. Therefore, we use
Hadoop with the MapReduce programming.
Figure 2. IV-Tier Architecture for IoT Big Data analytics for remote smart city and urban planning

ACCEPTED MANUSCRIPT
ACCEPTED MANUSCRIP
T
All the data is be stored at Hadoop using HDFS and analysis are performed at intermediate tier-II. The last tier is the
interpretation tier, which is the usage of the results of analyzed data and then generating reports. Here, the generator results are
announced and used by many applications, such as flood detection, security, and city planning.
We also design implementation model of the system, which is shown in Figure 3. It shows the complete details of all the steps
performed while implementing the system. Initially, every system generates their data, such as smart hoe generated data,
vehicular data, smart parking data, etc. At every system, there is relay node, which is responsible for collection data from all the
sensors in the system. It uses ZigBee technology to communicate with the sensors. The relay handles collecting data from all
sensors and then sending to the analytical system through GW and Internet. As the sensors have a lot of Metadata. Therefore, all
the unnecessary Metadata and redundant data are discarded. Moreover, the data is classified by the message type and the
identifier. After classification, the classified data is converted to the form, i.e., understandable to the Hadoop ecosystem, such as
sequence file.
Figure 3. Implementation Model.
Since we are dealing with a large amount of data (termed as Big Data). Therefore, we need a system that could efficiently
process a large set of huge datasets. To meet these requirements, we used Hadoop ecosystem, which contains Master nodes, and
various data nodes under the Master node. The Hadoop ecosystem has HDFS file storage, which divides the data into an equal
amount of chunks and stored them on various data nodes. Later, the parallel processing is performed on these chunks using
MapReduce system. All the processing calculations, results generation are done at Hadoop ecosystem. Finally, the decision
making is performed based on the results generated by Hadoop ecosystem. The decision-making approach uses machine
learning, pattern recognition, soft computing and decision models.
4. URBAN DATA ANALYSIS AND DISCUSSION
To perform the feasibility study, and understand the importance of the system, the detailed analysis are performed on various IoT
datasets. The analysis is performed to show that how the smart city can be built by using the proposed system, how the
deployment of sensors matters for building a smart city, and also how we can use the historic sensors data to perform Big Data
analytics for urban planning. This section also illustrates how we can use the same IoT generated data for both real-time decision
making to make your city smarter as well as performing offline analysis on historical data to perform urban planning. In this
section, we describe the details of the datasets used for analysis as well as for evaluation purpose and also the discussion on the
analysis make to establish the smart city and perform useful urban planning for future.
4.1. Datasets description

ACCEPTED MANUSCRIPT
ACCEPTED MANUSCRIP
T
We take real large size IoT generated datasets from various reliable resources. The datasets includes 1) the data of flood occur in
all over the world, 2) the smart home temperature collected dataset including the water usage of each house, , etc., 3) the
vehicular datasets including all the details of the vehicles traveling between many pairs of source and destination points at
various places of the city, 4) parking places datasets including the current status of number of vehicles in the parking area, 5)
pollution datasets including various gases and noise pollution, 6) social media datasets, such as Twitter including daily tweets
record, 7) weather datasets including continuous measurement of temperature, humidity, rain, etc., outside as well as inside the
home, 8) other data common city datasets, such as cultural events, library events, etc. the complete datasets details including the
datasets size, the number of parameters, and the source is given in Table 1.
Table 1. Datasets details
S# Datasets Size No. of parameters Source
1 Floods 16 MB 30 [17]
2 Water Usage 5 MB 11 [18]
3 Madrid Highway vehicular traffic 450 MB 5 [19]
4 Vehicular Mobility Traces 4.03 GB 5 [20-22]
5 Parking lots 294 KB 7 [23-25]
6 pollution 32 GB + 570 MB 8 [23-25]
7 Social Network (twitter) 8 +8 MB 7 [23-25]
8 Aarhus city traffic 33 GB 9 [23-25]
9 Weather 3 MB 7 [23-25]
G.R.Brakenridge [17] generated the flood data set by collecting the news from official and TV news channel of the flooded
country. The data contains the date of flood, area of flood, damage, intensity, death, etc.
The water usage data for each household of Surrey city of Canada is taken for household analysis. Total 61263 houses water
meter readings are measured. It contains the complete address and water usage of the house. The 3rd dataset that we have
analyzed for the smart city and urban planning is Madrid Highway vehicular traffic. This dataset is more important for the smart
city to facilitate the people as well as for urban planning in constructing new roads building, etc. it contains the location of the
each vehicle between two edge points of Madrid highway as well as the speed of the vehicle. We also tested the vehicular
mobility dataset that is generated by Institute of Transportation Systems, German Aerospace Center (ITS-DLR) as
TAPASCologne project. It contains the mobility of all the cars in Cologne city of Germany. It covers the area of 400 square km
in 24 hours with 700 cars. Next all other datasets are covering the Aarhus city of Denmark. Parking lot dataset covers the
continuous monitoring of eight parking lots of the city with respect to the usage. It contains the data from May 22, 2014, to Nov
4, 2014, by capturing data through 55 points. The pollution datasets and Aarhus city vehicular datasets are generated by placing
sensors at the same location at the same timing to find the effects to traffic on the environment. Both of datasets contains the
various periods of data of 2014. They generate the data by placing 449 sensors at different locations in the city. For vehicular
data generation, they placed source and destination pair sensor in different locations to estimate the traffic between two points. It
contains various information about the average speed of vehicles between two points, the average speed, and time to reach the
2nd point. The pollution data has various measures including Ozone, Nitrogen dioxide, nitrogen oxide, particle matters, carbon
dioxide, etc. Moreover, social network data is also important for smart city real-time decisions and urban planning as well. So we
take twitter data which includes tweets from many peoples of the city, their location, time, etc. Twitter data contains the
information of 13674 tweets from September 23, 2013, to December 17, 2013. Finally, the weather data consisting of
temperature, humidity, rain, pressure, wind, etc., are also considered for analysis and evaluation, which covers the period of Feb
to June and August to September 2014.
4.2. Analysis and Discussion
The main challenge in the smart city development is the analysis of real-time data to make an urgent action. Enabling smart cities
not only give benefits to the government authorities but the citizens can also take benefit from it, such as it helps citizens to save
their fuels by efficiently managing the route to reach the destination, as well as to protect themselves from environmental
pollution when it's more in the air. Here, we are analyzing various kinds of data and give directions to the authorities how they
can use IoT technologies and the Big Data generated from IoT for Smart cities and urban planning. We mainly presented the
analysis of vehicular traffic, parking lots, smart home taking the use of water by each house in the city of Aarhus, flood, and
pollution.
4.2.1. Vehicular traffic analysis
As a use case scenario, we use publically available traffic data of Aarhus, Denmark, which contains the information of
geographical location, timestamp, and traffic intensity, such as average speed and vehicle count. Moreover, we also used the

ACCEPTED MANUSCRIPT
ACCEPTED MANUSCRIP
T
vehicular datasets of Madrid City as we mention earlier. The analysis of Aarhus city traffic is presented only by the data taken
from the two sensors placed at 1 Km distance in “A rhusvej” street of Hinnerup.
Figure 4. The speed of vehicles at low intensity of traffic between two points.
The number of vehicles in a particular area plays a vital role in society. For instance, during the on hours, the traffic intensity at
particular roads are higher than off times. Similarly, the road management system can be affected by the number of vehicles in a
particular time and on a particular road. In Figure 4 and 5, we carefully analyzed the traffic intensity on different roads in a
society. For instance, if the vehicle speed is low on some roads than this means that the intensity of the cars is high on that roads.
Moreover, in Figure 4, when the number of vehicles is higher for example 106 and 121, the vehicle speed is less 45 and 42.
Therefore, keeping this relation between vehicle and vehicle speed, we can design roads for better vehicular management.
Similarly, in Figure 5, the number of vehicles are taken between 25 and 35, by considering this number as high-intensity traffic.
We can see that when the number of vehicles is high for example 37, the vehicle speed decreases to 18. Thus, the statistics in
Figure 4 and Figure 5 can be used to design wide roads where the intensity of vehicle is high and vice versa while planning for
future.
Figure 5. Speed of vehicles at high intensity of traffic between two points.
0
5
10
15
20
25
30
35
40
0
10
20
30
40
50
60
70
80
1
16
31
46
61
76
91
10
6
12
1
13
6
15
1
16
6
18
1
19
6
21
1
22
6
24
1
25
6
27
1
28
6
30
1
31
6
33
1
34
6
36
1
37
6
39
1
No
. o
f V
hic
als
Avg
. Sp
ee
d
Time vehicleCount avgSpeed (km/h)
0
10
20
30
40
50
60
1 6
11
16
21
26
31
36
41
46
51
56
61
66
71
76
81
86
91
96
10
1
avgSpeed (km/h) vehicle Count

ACCEPTED MANUSCRIPT
ACCEPTED MANUSCRIP
T Figure 6. Estimated time to reach the destination depending on the traffic intensity
In Figure 6, two types of traffic classes are used, i.e., 1~15 and 25~35 cars. We performed an experiment of reaching moving
between two points. We start assuming a car is moving from point A to point B on the road with the number of cars between 1
~15. The Figure shows that the time required for the car to reach its destination is less comparing to the same road with cars
between 25 and 35. This estimation is taken at a real time average speeds of the cars running on the roads. Thus, we can design
wider roads in those areas where the intensity of car is high. For example, if on a road the number of schools, colleges,
universities, etc. is high, then using statistics, a wider road is considered. Similarly, the area where the number of buildings is
less than the roads can be designed with less number of lanes. However, we are avoiding the scalability option for now, and we
will consider it in our future work.
Figure 7. No. of vehicles between sources and destination pairs at the various time of the day.
In Figure 7, we check the intensity of the vehicle along a road in a different duration of time. For example, we can see from the
graph, during 08:25 and 11:55, the number of vehicles are very high in number i.e. >12. Thus, an efficient road system can
design that can dynamically change the routes during the rush hour time. Similarly, the sensors can be installed at different
locations that can communicate with the vehicles in the case of accidents and congestion on the roads. Thus, the various
conclusion can be drawn from the statistics of Figure 7. For example, the engineer can be provided with better information about
the road designing and construction.
From the above IoT-based network traffic analysis, we can predict the estimated time to reach from one point to the other point.
Smart City analyzes vehicular traffic data at a real time and facilitates citizens to find how much time it will take them to reach
the destination by following alternative routes depending on the current intensity of the traffic. It gives the updated information
about all the travelers so that they can make their plan to reach the destination by following the convenient route. Moreover, it
also helps the government traffic authorities to control traffic and make an optimized plan at a run time when the intensity of
traffic becomes higher, or the road is blocked due to any mishaps happens on the road like an accident, strike, any damage, etc.
This traffic management not only helps the citizen and government while providing fuel saving but also provide safety from
pollution that is generated by abundant of traffic at a single point. So smart city helps the diversion of traffic from busy roads to
free roads to get the equal usage of all alternative roads.
0
50
100
150
200
250
1 6
11
16
21
26
31
36
41
46
51
56
61
66
71
76
81
86
91
96
10
1
Esti
mat
ed T
ime
to R
eac
(min
)
Time
Less vhicals (1-15)
0
2
4
6
8
10
12
14
07
:50
:00
08
:25
:00
08
:55
:00
09
:25
:00
09
:55
:00
10
:25
:00
10
:55
:00
11
:25
:00
11
:55
:00
12
:25
:00
12
:55
:00
13
:25
:00
13
:55
:00
14
:30
:00
15
:05
:00
15
:35
:00
16
:15
:00
16
:55
:00
17
:35
:00
20
:55
:00
23
:25
:00
05
:35
:00
06
:15
:00
06
:50
:00
No
. of
vhic
als
Time
ACCEPTED MANUSCRIPT
ACCEPTED MANUSCRIP
T
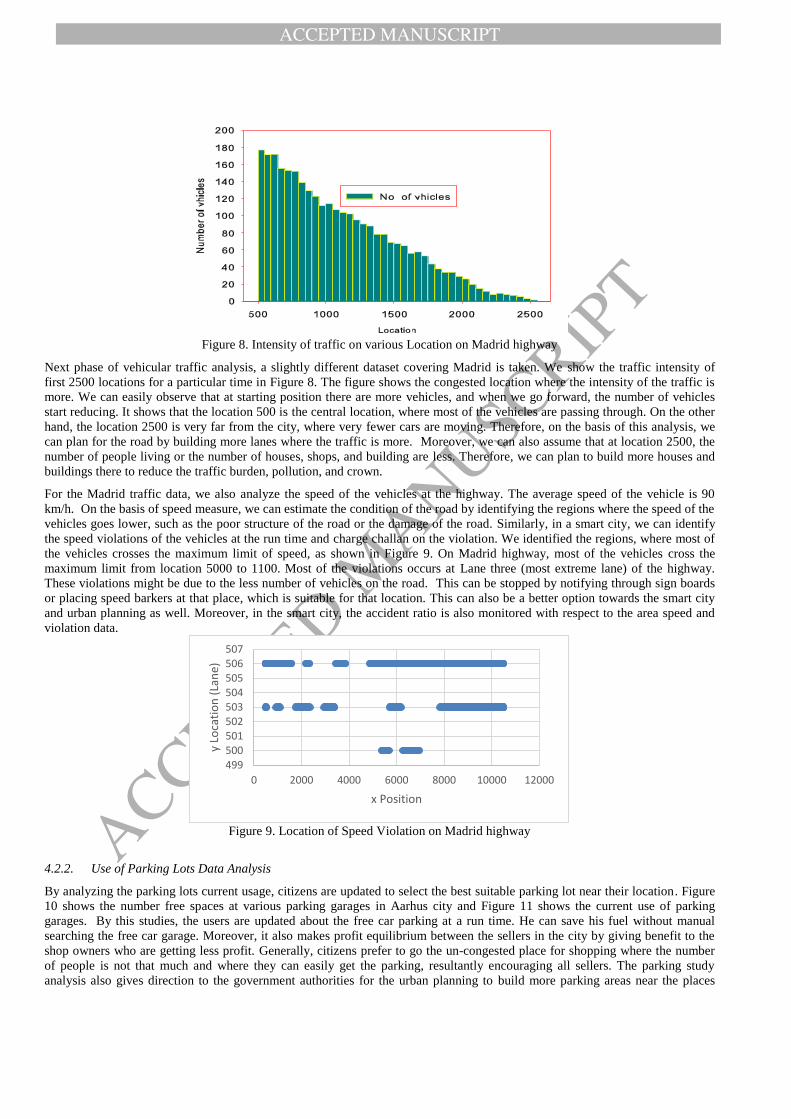
Figure 8. Intensity of traffic on various Location on Madrid highway
Next phase of vehicular traffic analysis, a slightly different dataset covering Madrid is taken. We show the traffic intensity of
first 2500 locations for a particular time in Figure 8. The figure shows the congested location where the intensity of the traffic is
more. We can easily observe that at starting position there are more vehicles, and when we go forward, the number of vehicles
start reducing. It shows that the location 500 is the central location, where most of the vehicles are passing through. On the other
hand, the location 2500 is very far from the city, where very fewer cars are moving. Therefore, on the basis of this analysis, we
can plan for the road by building more lanes where the traffic is more. Moreover, we can also assume that at location 2500, the
number of people living or the number of houses, shops, and building are less. Therefore, we can plan to build more houses and
buildings there to reduce the traffic burden, pollution, and crown.
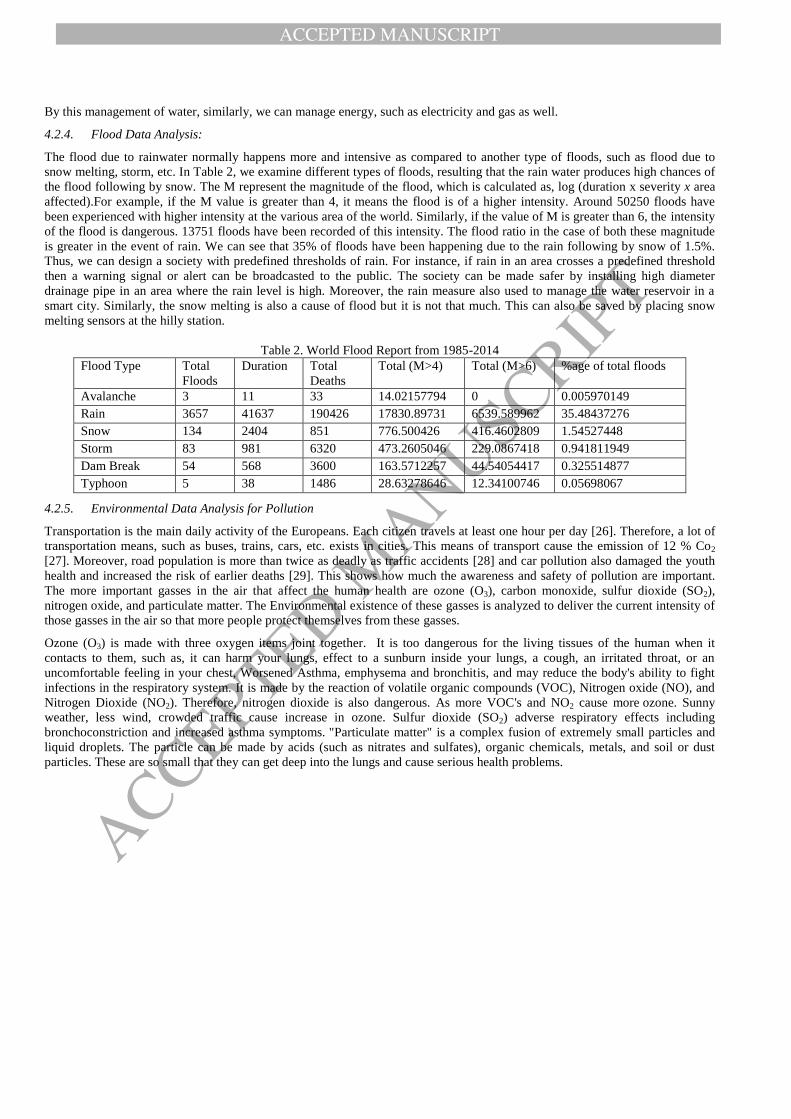
For the Madrid traffic data, we also analyze the speed of the vehicles at the highway. The average speed of the vehicle is 90
km/h. On the basis of speed measure, we can estimate the condition of the road by identifying the regions where the speed of the
vehicles goes lower, such as the poor structure of the road or the damage of the road. Similarly, in a smart city, we can identify
the speed violations of the vehicles at the run time and charge challan on the violation. We identified the regions, where most of
the vehicles crosses the maximum limit of speed, as shown in Figure 9. On Madrid highway, most of the vehicles cross the
maximum limit from location 5000 to 1100. Most of the violations occurs at Lane three (most extreme lane) of the highway.
These violations might be due to the less number of vehicles on the road. This can be stopped by notifying through sign boards
or placing speed barkers at that place, which is suitable for that location. This can also be a better option towards the smart city
and urban planning as well. Moreover, in the smart city, the accident ratio is also monitored with respect to the area speed and
violation data.
Figure 9. Location of Speed Violation on Madrid highway
4.2.2. Use of Parking Lots Data Analysis
By analyzing the parking lots current usage, citizens are updated to select the best suitable parking lot near their location. Figure
10 shows the number free spaces at various parking garages in Aarhus city and Figure 11 shows the current use of parking
garages. By this studies, the users are updated about the free car parking at a run time. He can save his fuel without manual
searching the free car garage. Moreover, it also makes profit equilibrium between the sellers in the city by giving benefit to the
shop owners who are getting less profit. Generally, citizens prefer to go the un-congested place for shopping where the number
of people is not that much and where they can easily get the parking, resultantly encouraging all sellers. The parking study
analysis also gives direction to the government authorities for the urban planning to build more parking areas near the places
499500501502503504505506507
0 2000 4000 6000 8000 10000 12000
y Lo
cati
on
(La
ne)
x Position

ACCEPTED MANUSCRIPT
ACCEPTED MANUSCRIP
T
where most of the people go. In Figure 11, it is obvious that the Bruuns is a huge parking with the capability of parking 931
cards but still you cannot find the parking place few times. This shows the need for more parking lots at that location to facilitate
the user. Similarly, the same result we get by the analysis of selling the garage.
Figure 10. Free Spaces at various parking lots at different times
Figure11. Usage of various parking lots at different times
4.2.3. Smart Home Data Analysis
While analyzing the smart home Data, one use case is taken to analyze the current usage of water consumption in each house.
The helps smart cities to manage the water resource with respect to the current usage of data. The next year need of water can
also be predict. Moreover, the flow of water to various area depending on the need of the area can also be controlled. The water
consumption of each house of the Surrey city of Canada is analyzed for that purpose. Figure 12 shows the histogram of the usage
of water in the cubic meter at all houses of the city. It shows more than 6000 houses consume water more than 8000-9000 cubic
meter. This shows the normal use of the water at maximum houses. This study can help the authorities to decide the water
billing rates based on normal use of water.
-200
0
200
400
600
800
1000
1200
1
41
81
12
1
16
1
20
1
24
1
28
1
32
1
36
1
40
1
44
1
48
1
52
1
56
1
60
1
64
1
68
1
72
1
76
1
80
1
84
1
88
1
No
. of
Vh
icle
s
Time
Bruuns(931) Busgadehuset (130)
Kalkvaerksvej (210) Magasin (400)
Salling (700)
0
200
400
600
800
1000
1200
1
41
81
12
1
16
1
20
1
24
1
28
1
32
1
36
1
40
1
44
1
48
1
52
1
56
1
60
1
64
1
68
1
72
1
76
1
80
1
84
1
88
1
No
. of
vhic
les
Time
Bruuns (931) Busgadehuset (130)
kalkvaerksvej (210) Magasin (400)

ACCEPTED MANUSCRIPT
ACCEPTED MANUSCRIP
T
Figure 12. Total water usage counts for the Surrey City
In general, every city and each street or home in a city used a different amount of water. The consumption of water directly
depends on the number of people present in a city. Similarly, some of the cities provide fewer services, such as industries,
hospitals, universities, schools, etc. therefore, the population of these cities is fewer comparative to the other cities. Therefore,
the statistics present in Figure 12 for the Surrey homes helps us in designing the water usage system for the houses within a city.
Similarly, the fresh water consumption can be maintained, for example if a house needs more fresh water and another needs less
than a balance relation can be drawn among the houses. Moreover, it also helps the authorities to control the water resources
depending on their reservoirs. For instance, if you have more water reservoir, then you can only store the required amount of
water by finding the smart city overall water consumption parameter. Likewise, if you have a scarcity of water reservoir, then
you can predict the need for water before and then consume the water accordingly.
Figure 13. Water usage of various areas of Surrey City
We also noticed that the water usage in some areas like cities and industrial zones is more than the water usage in the residential
area. In Figure 13, we show the average water consumption in different areas. For instance, in area 101B and 102B, the average
water consumption is very short. Similarly, in area 102 and 103A, the average water consumption is very high. This helps us in
designing a system by increasing or decreasing the flow and level of water in different areas. Similarly, an efficient drainage
system can designs while keeping the above statistics in mind. Thus, we can draw a conclusion on the basis of water
consumption in a particular city by planning a billing system of water usage. To check the authenticity of the statistics regarding
water usage and predict for future need, we use the skewness measure. It Univariate usage of water consumption W1, W2, W3 . .
. WN by the following formula of skewness.
Sk = ∑
(1)
Where W¯ is the mean, s is the standard deviation, and N is the number of data points. While computing the skewness, the s is
computed with N, rather than N-1.
We observed that in total 61263 houses, the average consumption of the house is 57877.937. However, 50% of the citizens
consume less than 58186 cubic water (find out by Median analysis), 25 % citizen use less than 26893 cubic water. While the 75
% of the people use less than 81983 cubic water. The data is positively skewed, which means more than 50% use more than
average consumption of water. By this analysis of water consumption, smart authorities manage the billing system by choosing a
limit for less fixed bill payments and for charging extra amount to those people who consume more amount of water as
compared to most of the users.
0100000020000003000000400000050000006000000700000080000009000000
Wat
er
Usa
ge (
m3 )
Area
ACCEPTED MANUSCRIPT
ACCEPTED MANUSCRIP
T
By this management of water, similarly, we can manage energy, such as electricity and gas as well.
4.2.4. Flood Data Analysis:
The flood due to rainwater normally happens more and intensive as compared to another type of floods, such as flood due to
snow melting, storm, etc. In Table 2, we examine different types of floods, resulting that the rain water produces high chances of
the flood following by snow. The M represent the magnitude of the flood, which is calculated as, log (duration x severity x area
affected).For example, if the M value is greater than 4, it means the flood is of a higher intensity. Around 50250 floods have
been experienced with higher intensity at the various area of the world. Similarly, if the value of M is greater than 6, the intensity
of the flood is dangerous. 13751 floods have been recorded of this intensity. The flood ratio in the case of both these magnitude
is greater in the event of rain. We can see that 35% of floods have been happening due to the rain following by snow of 1.5%.
Thus, we can design a society with predefined thresholds of rain. For instance, if rain in an area crosses a predefined threshold
then a warning signal or alert can be broadcasted to the public. The society can be made safer by installing high diameter
drainage pipe in an area where the rain level is high. Moreover, the rain measure also used to manage the water reservoir in a
smart city. Similarly, the snow melting is also a cause of flood but it is not that much. This can also be saved by placing snow
melting sensors at the hilly station.
Table 2. World Flood Report from 1985-2014
Flood Type Total
Floods
Duration Total
Deaths
Total (M>4) Total (M>6) %age of total floods
Avalanche 3 11 33 14.02157794 0 0.005970149
Rain 3657 41637 190426 17830.89731 6539.589962 35.48437276
Snow 134 2404 851 776.500426 416.4602809 1.54527448
Storm 83 981 6320 473.2605046 229.0867418 0.941811949
Dam Break 54 568 3600 163.5712257 44.54054417 0.325514877
Typhoon 5 38 1486 28.63278646 12.34100746 0.05698067
4.2.5. Environmental Data Analysis for Pollution
Transportation is the main daily activity of the Europeans. Each citizen travels at least one hour per day [26]. Therefore, a lot of
transportation means, such as buses, trains, cars, etc. exists in cities. This means of transport cause the emission of 12 % Co2
[27]. Moreover, road population is more than twice as deadly as traffic accidents [28] and car pollution also damaged the youth
health and increased the risk of earlier deaths [29]. This shows how much the awareness and safety of pollution are important.
The more important gasses in the air that affect the human health are ozone (O3), carbon monoxide, sulfur dioxide (SO2),
nitrogen oxide, and particulate matter. The Environmental existence of these gasses is analyzed to deliver the current intensity of
those gasses in the air so that more people protect themselves from these gasses.
Ozone (O3) is made with three oxygen items joint together. It is too dangerous for the living tissues of the human when it
contacts to them, such as, it can harm your lungs, effect to a sunburn inside your lungs, a cough, an irritated throat, or an
uncomfortable feeling in your chest, Worsened Asthma, emphysema and bronchitis, and may reduce the body's ability to fight
infections in the respiratory system. It is made by the reaction of volatile organic compounds (VOC), Nitrogen oxide (NO), and
Nitrogen Dioxide (NO2). Therefore, nitrogen dioxide is also dangerous. As more VOC's and NO2 cause more ozone. Sunny
weather, less wind, crowded traffic cause increase in ozone. Sulfur dioxide (SO2) adverse respiratory effects including
bronchoconstriction and increased asthma symptoms. "Particulate matter" is a complex fusion of extremely small particles and
liquid droplets. The particle can be made by acids (such as nitrates and sulfates), organic chemicals, metals, and soil or dust
particles. These are so small that they can get deep into the lungs and cause serious health problems.
ACCEPTED MANUSCRIPT
ACCEPTED MANUSCRIP
T
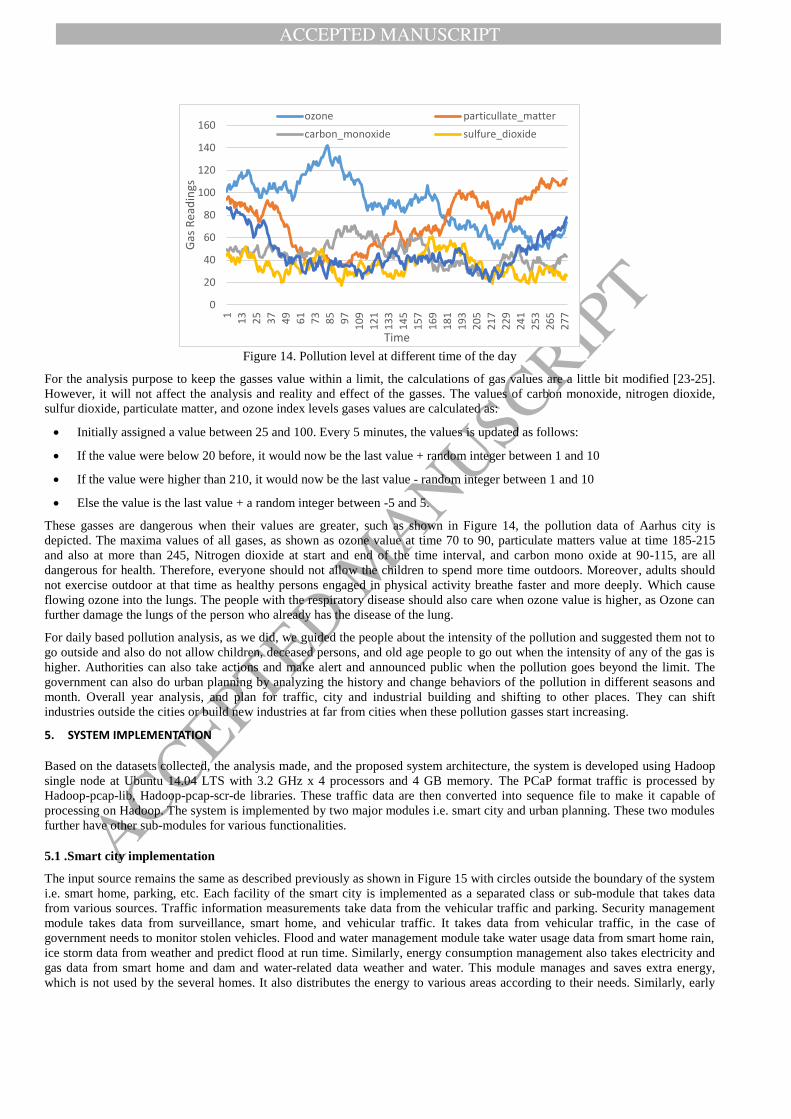
Figure 14. Pollution level at different time of the day
For the analysis purpose to keep the gasses value within a limit, the calculations of gas values are a little bit modified [23-25].
However, it will not affect the analysis and reality and effect of the gasses. The values of carbon monoxide, nitrogen dioxide,
sulfur dioxide, particulate matter, and ozone index levels gases values are calculated as:
Initially assigned a value between 25 and 100. Every 5 minutes, the values is updated as follows:
If the value were below 20 before, it would now be the last value + random integer between 1 and 10
If the value were higher than 210, it would now be the last value - random integer between 1 and 10
Else the value is the last value + a random integer between -5 and 5.
These gasses are dangerous when their values are greater, such as shown in Figure 14, the pollution data of Aarhus city is
depicted. The maxima values of all gases, as shown as ozone value at time 70 to 90, particulate matters value at time 185-215
and also at more than 245, Nitrogen dioxide at start and end of the time interval, and carbon mono oxide at 90-115, are all
dangerous for health. Therefore, everyone should not allow the children to spend more time outdoors. Moreover, adults should
not exercise outdoor at that time as healthy persons engaged in physical activity breathe faster and more deeply. Which cause
flowing ozone into the lungs. The people with the respiratory disease should also care when ozone value is higher, as Ozone can
further damage the lungs of the person who already has the disease of the lung.
For daily based pollution analysis, as we did, we guided the people about the intensity of the pollution and suggested them not to
go outside and also do not allow children, deceased persons, and old age people to go out when the intensity of any of the gas is
higher. Authorities can also take actions and make alert and announced public when the pollution goes beyond the limit. The
government can also do urban planning by analyzing the history and change behaviors of the pollution in different seasons and
month. Overall year analysis, and plan for traffic, city and industrial building and shifting to other places. They can shift
industries outside the cities or build new industries at far from cities when these pollution gasses start increasing.
5. SYSTEM IMPLEMENTATION
Based on the datasets collected, the analysis made, and the proposed system architecture, the system is developed using Hadoop
single node at Ubuntu 14.04 LTS with 3.2 GHz x 4 processors and 4 GB memory. The PCaP format traffic is processed by
Hadoop-pcap-lib, Hadoop-pcap-scr-de libraries. These traffic data are then converted into sequence file to make it capable of
processing on Hadoop. The system is implemented by two major modules i.e. smart city and urban planning. These two modules
further have other sub-modules for various functionalities.
5.1 .Smart city implementation
The input source remains the same as described previously as shown in Figure 15 with circles outside the boundary of the system
i.e. smart home, parking, etc. Each facility of the smart city is implemented as a separated class or sub-module that takes data
from various sources. Traffic information measurements take data from the vehicular traffic and parking. Security management
module takes data from surveillance, smart home, and vehicular traffic. It takes data from vehicular traffic, in the case of
government needs to monitor stolen vehicles. Flood and water management module take water usage data from smart home rain,
ice storm data from weather and predict flood at run time. Similarly, energy consumption management also takes electricity and
gas data from smart home and dam and water-related data weather and water. This module manages and saves extra energy,
which is not used by the several homes. It also distributes the energy to various areas according to their needs. Similarly, early
0
20
40
60
80
100
120
140
160
1
13
25
37
49
61
73
85
97
10
9
12
1
13
3
14
5
15
7
16
9
18
1
19
3
20
5
21
7
22
9
24
1
25
3
26
5
27
7
Gas
Rea
din
gs
Time
ozone particullate_matter
carbon_monoxide sulfure_dioxide

ACCEPTED MANUSCRIPT
ACCEPTED MANUSCRIP
T
fire management program performs fire detection. Finally, the health management makes a decision on pollution data. Citizens
have limited access to the results of these modules, and the government has full access to them. The complete flow of data,
modules, actors, is shown in Figure 15
Figure 15. Smart city system implementation scenario
5.2. Urban Planning system Implementation
Urban planning system implementation is done at three levels i.e. physical level, intermediate level and upper level as shown in
Figure 16. Physical level is called storage level, which is based on Hadoop HTFS system. All the historical data is stored in
physical level. Each data set given a number in the figure, such as vehicular data at number 1, energy data as number 2, and so
on. The intermediate level is the second level, which is also called processing level. All the processing is done at this level by
taking the data stored on the physical level. At this level, statistical calculation, computation, graph analysis, and other
computations are performed. The third level is the upper level, which is also called decision level. The decision regarding the
urban planning is made at this level. The decision level has various modules for each type of planning, for example, road
planning, building planning, and so on. The number written under the planning module is the number of data set from which the
module takes the data for input.
Citizen: Govt.
Govt.
Govt.Citizen: Govt.
SmartHome
Parking
VehicularTraffic
Surveillance
Weather& water
Securitymanagement
Traffic info.management
Flood & Water management
Energymanagement
Healthmanagement
Early firemanagement
Environment

ACCEPTED MANUSCRIPT
ACCEPTED MANUSCRIP
T
Figure 16. Urban planning system implementation scenario
6. SYSTEM EVALUATION
The proposed algorithm is implemented using Hadoop single node setup on UBUNTU 14.04 LTS coreTMi5
machine with 3.2 GHz processor and 4 GB memory. For real-time traffic, we generated Pcap packets by
Wireshark libraries and retransmitted them using other systems to the developed the system. Hadoop-pcap-lib,
Hadoop-pcap-serde, and Hadoop Pcap Input libraries are used for network packets processing and generating
Hadoop Readable for (sequence file) at collection and aggregation unit so that Spark can process it. MapReduce
programming is used for performing offline analysis for urban planning. The Dataset mentions in section IV are
used to perform the efficiency evaluation of the system.
Figure 17. Processing time of various size vehicular datasets
Since the system is based on Big Data analytics, the system is evaluated with respect to the efficiency and
response time. The System performance is measured various size dataset by considering the processing time (in
milliseconds) and throughput (in megabytes/sec Mbps). The processing time results are shown in Figure 17, and
the throughput analysis result is shown in Figure 18. It is obvious in the graph that when the data size is
increased the processing time proportionally increased, both data size and processing time are directly
proportional to each other. However, we can examine the processing at higher (larger) dataset i.e. 5345MB, the
processing time for this dataset is just 300000 which is far better than other systems. Moreover, when we
analyze the throughput corresponding to the data size. We identified that the throughput was also directly
proportional to data size because of the parallel processing nature of Hadoop system. This is the major
achievement of the system that with an increase in data size the throughput is also increased.
Physical Lavel:Storage Level
Intermediate Level:Processing Level
Upper Level:Decision Level
1. Vehicular Data
2. Energy Data
3. Water Data
4. Pollution Data
5. Weather Data
6. Parking slots Data
7. Surveillance Data
8. Manual AnnualStatistics
1. Statisticalmeasurements
(average, correlation, Variation, chi-square test,Probability calculations)
2. Graphs Analysis
3. Other processing
. Road 7 traffic planning(1 : 4 : 6 : 8)
. Building, parking, shopping malls planning
(1 : 4 : 5: 6 : 7 : 8). Factories & Industries
(1 : 2 : 4 : 5 : 8). Energy need & safety planning
(2 : 4 : 5 : 8). Flood safety planning
(3 : 5 : 8)
. Environmental health care planning
( 1 : 4 : 5 : 8). Security Planning
(7 : 8)
Historic data Processing, Results Future Planning
0
50000
100000
150000
200000
250000
300000
350000
78 150 301 450 1228.8 1843.2 3276.8 5345.28
Pro
cess
ing
Tim
e(m
s)
Dataset size (MB)

ACCEPTED MANUSCRIPT
ACCEPTED MANUSCRIP
T
Figure 18. Throughput of datasets depending on the size of data
We also check the performance of the system by increasing the number of sensors for a single record. We keep
the data size as constant i.ie. 2 GB and raise the number of sensors per record, we came to know that with the
increase in the number of sensors, the throughput is decreased. This is because when we increase the sensors, it
takes a lot of time in classification filtrations and processing, as a lot of comparisons due to a large number of
sensors in a single record. The throughput of the system with respect to the number of sensors is shown in
Figure 19.
Figure 19, Throughput of the system by increasing the number of sensors per record for 1GB of data
7. ConCLUSION
Smart cities and urban planning leave a major impact on the development of the nations. It increases the
decision power of the societies by making an intelligent and effective decision at the appropriate time. In this
paper, we propose a system for smart cities and urban planning by using IoT generated Big Data analysis. The
proposed architecture consists of four tier, which have the functionalities of the collection, aggregation,
communication, processing, and interpretation. The complete system is developed using Hadoop technologies
with Spark to achieve real-time processing. The simple IoT-based smart city data sets, such as vehicular
network, smart parking, smart home, weather, pollution, surveillance, etc. data sets are analyzed for making
the smart city as well as urban planning decisions. The proposed system not only beneficial to the citizens but
also the authorities while providing them the facilities to make intelligent and fast decisions. The system is
finally tested based on the efficiency performance by considering processing time and throughput. The system
gives efficient results even on larger data sets. The system throughput is increased with the rise in data size.
ACKNOWLEDGEMENT
This study was supported by the Brain Korea 21 Plus project (SW Human Resource Development Program for Supporting Smart
Life) funded by Ministry of Education, School of Computer Science and Engineering, Kyungpook National University, Korea
0
2
4
6
8
10
12
14
16
18
20
-500 500 1500 2500 3500 4500 5500
Thro
ugh
ou
t (M
Bp
s)
Dataset Size (MB)
0
1
2
3
4
5
6
0 10 20 30 40 50
Thro
ugh
pu
t (M
Bp
s)
No. of sensors/record

ACCEPTED MANUSCRIPT
ACCEPTED MANUSCRIP
T
(21A20131600005). This work was supported by Institute for Information & communications Technology Promotion (IITP)
grant funded by the Korea government (MSIP). [No. 10041145, Self-Organized Software platform (SoSp) for Welfare Devices]
8. REFERENCES
[1] CISCO, “The Internet of Things, Infographic”, available online at http://blogs.cisco.com/news/the-internet-of-things-
infographic, May 24, 2015.
[2] Ahmad, Awais, Anand Paul, M. Mazhar Rathore, and Hangbae Chang. "Smart cyber society: Integration of capillary devices
with high usability based on Cyber–Physical System." Future Generation Computer Systems, Vol. 56, March 2016, Pages
493-503.
[3] Zeng, Deze, Song Guo, and Zixue Cheng. "The web of things: A survey." Journal of Communications 6, no. 6 (2011): 424-
438.
[4] Srivastava, Lara.“Japan’s ubiquitous mobile information society”. info, vol. 6, no. 4, pp. 234-251, 2004.
[5] Giroux, Sylvain, and Hélène Pigot “From Smart Homes to Smart Care: ICOST 2005, 3rd International Conference on Smart
Homes and Health Telematics.” Vol. 15. IOS Press, 2005.
[6] Han, Sun Sheng. "Global city making in Singapore: a real estate perspective." Progress in Planning 64, no. 2 (2005): 69-175.
[7] O'droma, Mairtin, and Ivan Ganchev. "The creation of a ubiquitous consumer wireless world through strategic ITU-T
standardization." IEEE Communications Magazine 48, no. 10 (2010): 158-165.
[8] Xia, Feng, Laurence T. Yang, Lizhe Wang, and Alexey Vinel "Internet of things." International Journal of Communication
Systems 25, no. 9 (2012): 1101.
[9] Daqiang Zhang, Jingyu Zhou, Minyi Guo, Jiannong Cao, Tianbao Li “TASA: Tag-Free Activity Sensing Using RFID Tag
Arrays.” IEEE Trans. Parallel Distrib. Syst. 22(4): 558-570 (2011)
[10] Daqiang Zhang, Minyi Guo, Jingyu Zhou, Dazhou Kang, Jiannong Cao “Context reasoning using extended evidence theory
in pervasive computing environments.” Future Generation Comp. Syst. 26(2): 207-216 (2010)
[11] Daqiang Zhang, Daqing Zhang, Haoyi Xiong, Ching-Hsien Hsu, Athanasios V. Vasilakos “BASA: building mobile Ad-Hoc
social networks on top of android.” IEEE Network 28(1): 4-9 (2014)
[12] Dixit, Sudhir, and Ramjee Prasad, eds. “Technologies for home networking.” John Wiley & Sons, 2007.
[13] Jin, Jiong, Jayavardhana Gubbi, Slaven Marusic, and Marimuthu Palaniswami. "An information framework for creating a
smart city through Internet of things." Internet of Things Journal, IEEE 1, no. 2 (2014): 112-121.
[14] Ahmad, Awais, Anand Paul, and M. Mazhar Rathore. "An efficient divide-and-conquer approach for big data analytics in
machine-to-machine communication." Neurocomputing 174 (2016): 439-453.
[15] M. Mazhar Rathore, Anand Paul, Awais Ahmad, Bo-Wei Chen, Bormin Huang, and Wen Ji. "Real-Time Big Data
Analytical Architecture for Remote Sensing Application."
[16] Kyriazis, Dimosthenis, Theodora Varvarigou, Anna Rossi, Douglas White, and Joshua Cooper. "Sustainable smart city IoT
applications: Heat and electricity management & Eco-conscious cruise control for public transportation." In World of
Wireless, Mobile and Multimedia Networks (WoWMoM), 2013 IEEE 14th International Symposium and Workshops on a,
pp. 1-5. IEEE, 2013.
[17] G.R.Brakenridge, "Global Active Archive of Large Flood Events", Dartmouth Flood Observatory, University of Colorado,
http://floodobservatory.colorado.edu/Archives/index.html., accessed on June 30, 2015.
[18] http://data.surrey.ca/dataset/water-meters, accessed on June 30, 2015
[19] HighwaysMarco Gramaglia, Oscar Trullols-Cruces, Diala Naboulsi, Marco Fiore, Maria Calderon. “Vehicular Networks on
Two Madrid.” IEEE SECON 2014, 3 July, Singapo
[20] S. Uppoor, M. Fiore, “Large-scale Urban Vehicular Mobility for Networking Research.”
IEEE VNC 2011, Amsterdam, The Netherlands, November 20
[21] D. Naboulsi, M. Fiore, “On the Instantaneous Topology of a Large-scale Urban Vehicular Network: the Cologne case.”
ACM MobiHoc 2013, Bangalore, India, July 2013
[22] S. Uppoor, O. Trullols-Cruces, M. Fiore, J.M. Barcelo-Ordinas, “Generation and Analysis of a Large-scale Urban Vehicular
Mobility Dataset.” IEEE Transactions on Mobile Computing, Vol.13, No.5, May 2014
[23] Stefan Bischof, Athanasios Karapantelakis, Cosmin-Septimiu Nechifor, Amit Sheth, Alessandra Mileo and Payam Barnaghi,
"Semantic Modeling of Smart City Data", Position Paper in W3C Workshop on the Web of Things: Enablers and services
for an open Web of Devices, 25-26 June 2014, Berlin, Germany.
[24] R. Tönjes, P. Barnaghi, M. Ali, A. Mileo, M. Hauswirth, F. Ganz, S. Ganea, B. Kjærgaard, D. Kuemper, S. Nechifor, D.
Puiu, A. Sheth, V. Tsiatsis, L. Vestergaard, "Real Time IoT Stream Processing and Large-scale Data Analytics for Smart
City Applications." poster session, European Conference on Networks and Communications 2014.
[25] Sefki Kolozali, Maria Bermudez-Edo, Daniel Puschmann, Frieder Ganz, Payam Barnaghi, "A Knowledge-based Approach
for Real-Time IoT Data Stream Annotation and Processing." in Proc. of the 2014 IEEE International Conference on Internet
of Things (iThings 2014), Taipei, Taiwan, September 2014.

ACCEPTED MANUSCRIPT
ACCEPTED MANUSCRIP
T
[26] Eurostat, “Passenger mobility in Europe.” European Commission, 2007
[27] Eurostat, “Energy, transport and environment indicators”, European Commission, 2011
[28] S. Yim, S. Barrett S, “Public Health Impacts of Combustion Emissions in the United Kingdom”, Department of Aeronautics
and Astronautics, Massachusetts Institute of Technology, Cambridge, United States, 2012
[29] US environmental Protection Agency (EPA), “Car Pollution effects”, 2012.
ACCEPTED MANUSCRIPT
ACCEPTED MANUSCRIP
T
Muhammad Mazhar Ullah Rathore received the Master’s degree in computer and communication security from the National University of Sciences and Technology, Islamabad, Pakistan, in 2012, and is currently pursuing the Ph.D. degree at Kyungpook National University, Daegu, Korea. His research interests
include Big Data analytics, network traffic analysis and monitoring, intrusion detection, and computer and network security.

ACCEPTED MANUSCRIPT
ACCEPTED MANUSCRIP
T
Anand Paul (SM’15) received the Ph.D. degree in electrical engineering from the National Cheng Kung University, Tainan, Taiwan, in 2010. He is currently
working as an Associate Professor with the School of Computer Science and Engineering, Kyungpook National University, Daegu, Korea. He is a delegate
representing Korea for M2M focus group and for MPEG. His research interests include algorithm and architecture reconfigurable embedded computing. Prof. Paul has Guest Edited various international journals and he is
also part of Editorial Team for Journal of Platform Technology and Cyber Physical Systems. He serves as a Reviewer for various IEEE/IET journals. He is the
track Chair for smart human computer interaction in ACMSAC 2015, 2014. He was the recipient of the Outstanding International Student Scholarship Award in 2004–2010, the Best Paper Award in National Computer Symposium, Taipei, Taiwan, in 2009, and International Conference on Softcomputing and Network
Security, India, in 2015.
Awais Ahmad (S’14) received the B.S. degree (CS) from the University of Peshawar, Peshawar, Pakistan, and the M.S. degree (telecommunication and networking) from Bahria University, Islamabad, Pakistan, in 2008 and 2010, respectively. Currently,
he is pursuing the Ph.D. degree at Kyungpook National University, Daegu, Korea. During his research work, he worked on energy efficient congestion control
schemes in Mobile Wireless Sensor Networks (WSN). There he got research experience on Big Data analytics, machineto- machine communication, and wireless sensor network. Mr. Ahmad was the recipient of three prestigious awards: 1) Research Award from President of Bahria University Islamabad, Pakistan in 2011,
2) Best Paper Nomination Award in WCECS 2011 at UCLA, USA, and 3) Best Paper Award in 1st Symposium on CS&E, Moju Resort, Korea, in 2013.

ACCEPTED MANUSCRIPT
ACCEPTED MANUSCRIP
T
Dr. Seungmin Rho, Ph.D. is a faculty of Department of Multimedia at Sungkyul University in Korea.
In 2012, he was an assistant professor at Division of Information and Communication in Baekseok University. In 2009-2011, he had been working as a Research Professor at School of Electrical Engineering in Korea University. In 2008-2009, he was a Postdoctoral Research Fellow at the Computer Music Lab of the
School of Computer Science in Carnegie Mellon University. He gained his B.Science. (2001) in Computer Science from Ajou University, Korea (South),
M.Science. (2003) and Ph.D. (2008) in Information and Communication Technology from the Graduate School of Information and Communication at Ajou University. He visited Multimedia Systems and Networking Lab. in Univ. of Texas at Dallas from Dec. 2003 to March 2004. Before he joined the Computer
Sciences Department of Ajou University, he spent two years in industry. His current research interests include database, big data analysis, music retrieval,
multimedia systems, machine learning, knowledge management as well as computational intelligence.
He has published more than 180 papers in refereed journals and conference proceedings in these areas. He has been involved in more than 20 conferences and
workshops as various chairs and more than 30 conferences/workshops as a program committee member.
He has been appointed as an Editor-in-Chief in Journal of Platform Technology (JPT) since 2013. He has edited a number of international journal special issues
as a guest editor, such as Enterprise Information Systems, Multimedia Systems, Information Fusion, ACM Transactions on Embedded Computing, Journal of Real-Time Image Processing, Future Generation Computer Systems, Engineering Applications of Artificial Intelligence, New Review of Hypermedia and
Multimedia, Multimedia Tools and Applications, Personal and Ubiquitous Computing, Telecommunication Systems, Ad Hoc & Sensor Wireless Networks and
etc.
He has received a few awards including Who's Who in America, Who's Who in Science and Engineering, and Who's Who in the World in 2007 and 2008,
respectively.