urban league web viewamerican indian and alaska native owned no business as shown in table ......
TRANSCRIPT

THE STATE OF BLACK/AFRICAN AMERICANS IN THE MAHONING VALLEY
ACKNOWLEDGMENTS
I want to express my appreciation to Jacqueline Taylor, Research Economist and Community Liaison of the Regional Economic Development Initiative (REDI), YSU; for being the principal contact for all requested data used in this study.
I also like to thank Thomas S. Conley, Affiliate CEO, Greater Warren-Youngstown Urban League for initiating the need to conduct this study, and for meeting with us to discuss the outline of issues that they needed us to emphasize in the study.
I would also like to thank Michael Hripko, Associate Vice President for Research, REDI, YSU; for his role in reviewing and making useful suggestions during the draft phase of this report. Last, but not least, I would like to extend my appreciation to Maureen Wilson, Layout Design Supervisor, Office of Marketing and Communications, YSU; for designing the cover page of this report.
Finally, all efforts were made to make this study align with the goals of the local Urban League Chapter, and to dovetail with the overall discourse of the National Urban League -- The State of Black America.
______________________________________
Frank Akpadock, Ph.D.Senior Research Economist and Regional ScientistAuthor: City in Transition….The Case of Youngstown, OhioRegional Economic Development Initiative (REDI)Youngstown State University, One University PlazaYoungstown, OH 44555Phone: (330) 941-3355 Ext. 1406
PS: Special Note of Appreciation from Thomas S. Conley, President and CEO, Greater Warren-Youngstown Urban League
It is my pleasure to present to you, the State of Black/African Americans in the Mahoning Valley. It is my hope that the
information contained in this report, will make you aware of a measurable socio-economic disparity in our communities. As the
Urban League, Mahoning Valley Page i

decision makers and stake holders in these communities, it is my sincere belief that you will use your good offices to bring about
change in our communities as suggested in this report that will provide economic growth opportunities to all people in the Valley
irrespective of color or creed, political persuasions or national origin.
The Greater Warren-Youngstown Urban League in the Mahoning Valley will continue to be an organ of advocacy for change
in these communities. Accordingly, my special thanks go to the Youngstown State University’s REDI Department director and staff,
for their willingness to undertake this important study, and also to my Board of Directors and Staff for their thoughtfulness. It is
anticipated that this report will be published annually for information updates, and that appropriate legislative actions will be taken by
our elected local leaders when and where necessary for change.
On behalf of the Greater Warren-Youngstown Urban League organization in the Mahoning Valley, we thank you in advance for your
support and God Bless!
Thomas S. ConleyPresident and CEOGreater Warren Youngstown Urban League
Urban League, Mahoning Valley Page ii

EXECUTIVE SUMMARY AND KEY FINDINGS
Population Growth Analysis
Population growth trend analysis by race was undertaken for the Mahoning County between 2010 and 2014 with the following
results:
-.004% for the Black/African American population
-1.2% for the White population
13.6% for the Asian population
3.1 for the Hispanic/Latino population
-3.5% for the American Indian and Alaska Native population as shown in Table 1 below.
Table 1
Selected Population* Growth Trend in Mahoning County by Race, 2010-2014Race 2010 2014
(Estimate)2010-2014 % Change
% Change Rank
Black/African American
37,433 37,132 -.004 3
White 190,848 188,634 -1.2 4
Asian 1,682 1,911 13.6 1
Hispanic/Latino
11,136 11,482 3.1 2
American Indian &
Alaska Native
491 474 -3.5 5
Source: Data from the U.S, Census Bureau, 2010 Census Demographic Profile Summary File and Ohio Development Services Agency, Office of Research
Urban League, Mahoning Valley Page iii

*Five race-based populations were selected for this studyPopulation growth trend analysis by race was undertaken for the Trumbull County between 2010 and 2014 with the following results
shown in Table 2 below.
-.6% for the Black/African American population
.84% for the White population
3.1% for the Asian population
-4.6% for the Hispanic/Latino population
-12.9% for the American Indian and Alaska Native populations
Table 2Selected Population Growth Trend in Trumbull County by Race, 2010-2014Race 2010 2014
(Estimate)2010-2014 %
Change% Change Rank
Black/African
American
17,422 17,317 -.6 3
White 184,529 186,070 .84 2
Asian 997 1,028 3.1 1
Hispanic/Latino 3,128 2,984 -4.6 4
American Indian & Alaska Native
278 242 -12.9 5
Source: Data from the U.S, Census Bureau, 2010 Census Demographic Profile SummaryFile and Ohio Development Services Agency, Office of Research.
Urban League, Mahoning Valley Page iv

Economic AnalysisMedian Household Income
Table 3 compares median household income in 2014 between Mahoning and Trumbull Counties by race. The Black/African
American median household income was lower in Mahoning County ($20,095), than in Trumbull County ($24,954), ranking 5th and
4th positions respectively. The Asian population had the highest median household income among the races between the two counties,
scoring 1st positions in both, followed in 2nd position by the White population. The Hispanic/Latino residents ranked 3rd in Mahoning
County and 5th in Trumbull County. The American Indian and Alaska Native residents ranked 4th in Mahoning County and 3rd in
Trumbull County. Mahoning County had a median household income of $41,058 compared to Trumbull County’s median of $42,880
during the same period.
Table 3Mahoning and Trumbull County Median Household Incomes by Race, 2014 **
Mahoning CountyMedian Income Rank Trumbull County
Median Income Rank
Black/ African American $20,095 5
Black/ African American $24,954 4
White $44,585 2 White $44,991 2
Asian $53,301 1 Asian $49,137 1
Hispanic/ Latino $28,860 3 Hispanic/ Latino $22,786 5
American Indian & American Indian &
Alaska Native $27,461 4 Alaska Native $27,612 3Sources: Ohio County Profiles (Prepared by Ohio Development Services Agency,
Office of Research and American Community Survey (ACS)**(In 2013 Inflation -adjusted dollars)
Urban League, Mahoning Valley Page v

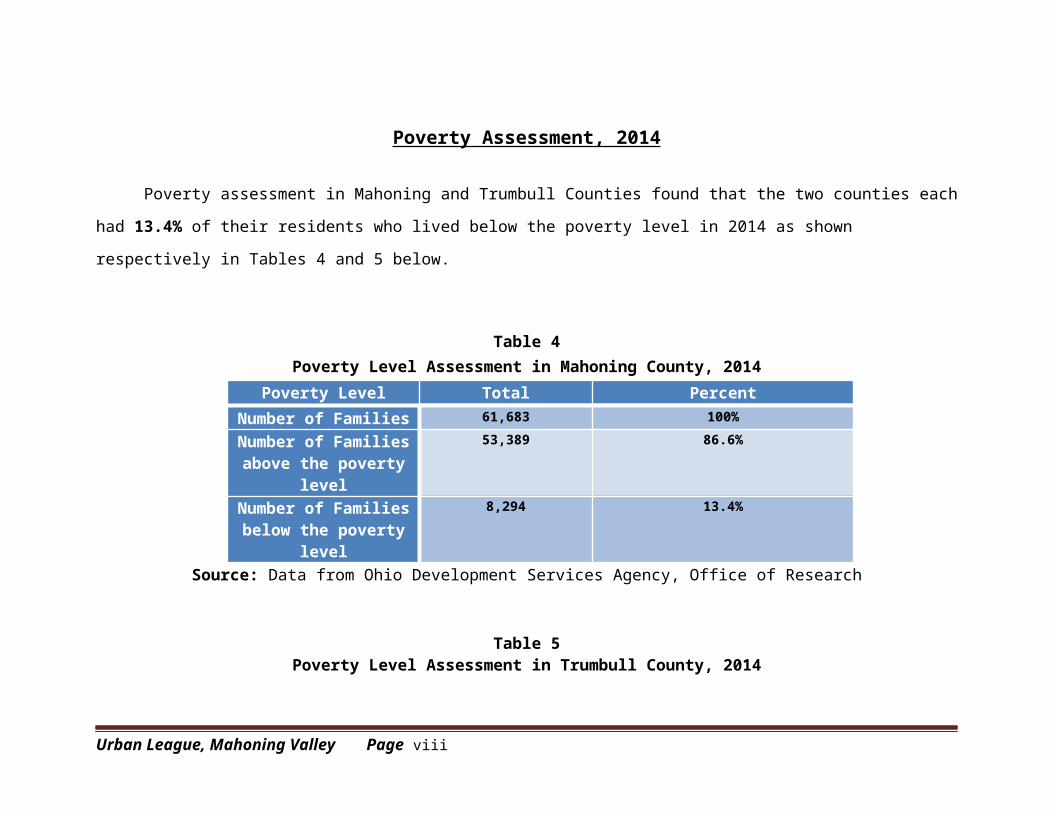
Poverty Assessment, 2014
Poverty assessment in Mahoning and Trumbull Counties found that the two counties each had 13.4% of their residents who
lived below the poverty level in 2014 as shown respectively in Tables 4 and 5 below.
Table 4Poverty Level Assessment in Mahoning County, 2014
Poverty Level Total PercentNumber of Families 61,683 100%
Number of Families above the poverty level
53,389 86.6%
Number of Families below the poverty level
8,294 13.4%
Source: Data from Ohio Development Services Agency, Office of Research
Table 5Poverty Level Assessment in Trumbull County, 2014
Poverty Level, 2014 Total Percent
Number of Families 55,634 100%
Number of Families above the poverty level
48,161 86.6%
Number of Families below the poverty level
7,473 13.4%
Urban League, Mahoning Valley Page vi

Source: Data from Ohio Development Services Agency, Office of Research
Public Assistance/Food Stamp/SNAP, * 2009-2013
Figure 1 below shows that between 2009 and 2013, 54% of Mahoning County residents received Public Assistance compared
to 46% in Trumbull County.
Mahoning County Trumbull County
0.54
0.46
Figure 1. Percent of Households on Public Assistance/Food Stamp/SNAP, 2009-2013 in Mahoning and Trumbull Counties, 2009-2013.
Source: Data from American Community Survey (ACS).*SNAP= Supplemental Nutrition Assistance Program.
Households on Public Assistance in Youngstown and Warren by Race, 2009-2013
Table 6 below shows that between 2009 and 2013, 27% of Black/African American residents received Public Assistance in
Youngstown, and ranked in 2nd place; compared to 40% in the City of Warren even when they ranked in 2nd position also. White
residents in Warren had the highest percentage (56%) among the races on public assistance, while they were 14% in Youngstown.
Also, 35% of the Hispanic/Latino residents in Youngstown received Public Assistance, while 3% of the residents in Warren were on
Urban League, Mahoning Valley Page vii
Public Assistance. 23% of American Indian and Alaska Native residents in Youngstown, received Public Assistance and ranked 3rd,
while only 1% of American Indian and Alaska Native residents in Warren received Public Assistance and ranked 4th during the same
period.
Table 6
Comparison of Households on Public Assistance in Youngstown to Warren by Race, 2009-2013
YOUNGSTOWN % % Rank WARREN % % RankBlack/African
American 27% 2Black/ African
American 40% 2White 14% 4 White 56% 1Asian 1% 5 Asian 0% 5
Hispanic/ Latino 35% 1 Hispanic/ Latino 3% 3American Indian
&American Indian
&Alaska Native 23% 3 Alaska Native 1% 4
Source: Data from American Community Survey (ACS)
Percentage of Mahoning County Residents by Race living below the Poverty Level, 2009-2013
In Mahoning County, an assessment of residents who lived below the poverty level between 2009 and 2013 showed that::
29% of Black/African American residents
9% of White residents
27% of Hispanic or Latino residents
22% of American Indian and Alaska Native residents
13% of Asian residents
Urban League, Mahoning Valley Page viii

Percentage of Youngstown Residents by Race living below the Poverty level, 2009-2013
In the City of Youngstown, residents who lived below the poverty level between 2009 and 2013 were:
75% of the Black/African American population
17% of the White population
7% of the Hispanics/Latino population
1% of the Asian population
Percent of Trumbull County Residents by Race living below the Poverty level, 2009-2013
In Trumbull County, residents who lived below the poverty level between 2009 and 2013 were:
33% of the Black/African American population
12% of the White population
12% of the Hispanic/Latino population
22% of the Asian populations
21% of the Indian and Alaska Native populations
Percentage of Warren Residents by Race living below the Poverty level, 2009-2013
In the City of Warren, residents who lived below the poverty level between 2009 and 2013 were:
42% of the Black/African American population
54% of the White population
4% of the Hispanic/Latino population
0% of the Asian population
Urban League, Mahoning Valley Page ix

None of the American Indian or Alaska Native residents
Business OwnershipIn 2012, an assessment of business ownership in Mahoning County showed that:
11% were Black/African American residents
84% were White residents
2% were Asian residents
3% were Hispanic/Latino residents
American Indian and Alaska Native owned no business as shown in Table 7 below.
Table 7
Mahoning County: Business Ownership by Race, 2012
Race Percent % Rank
Black/ African American
11% 2
White 84% 1
Asian 2% 4
Hispanic/ Latino 3% 3
American Indian &Alaska Native 0% 5
Source: Data from Assets and Opportunity Scorecard, Census Bureau, 2015
Urban League, Mahoning Valley Page x

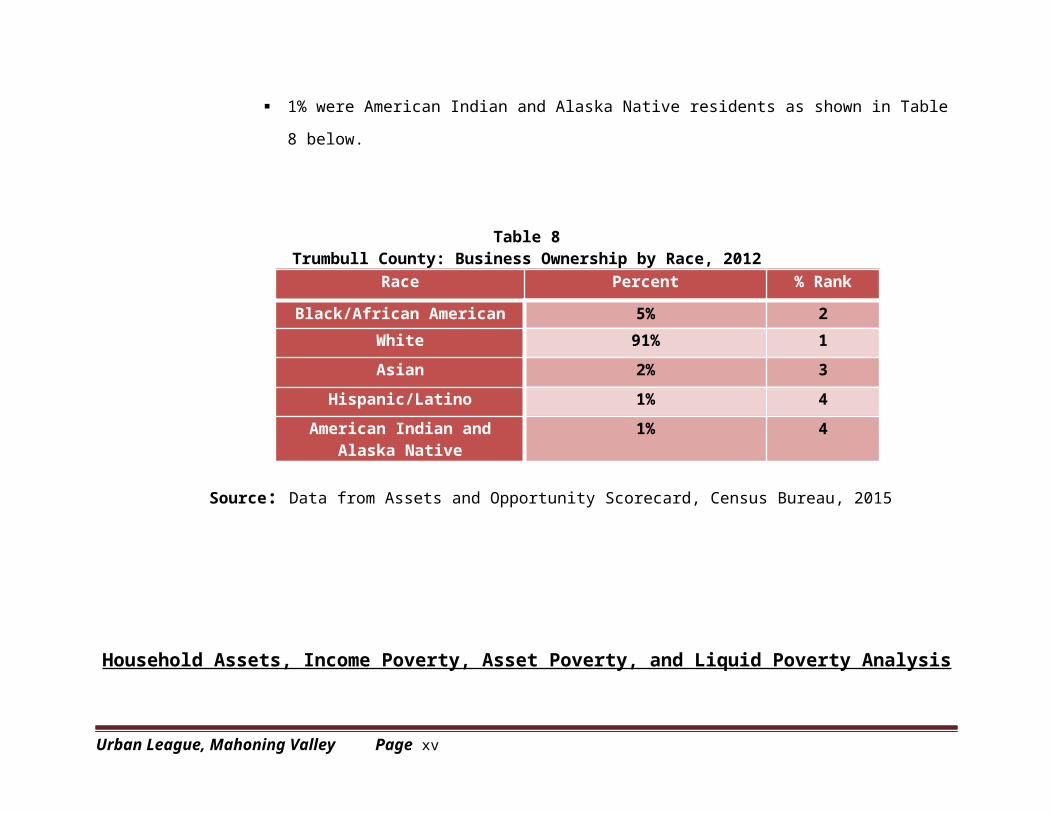
Business ownership assessment in Trumbull County in 2012 showed that: 5% were Black/African American residents
91% were White residents
2% were Asian residents
1% were Hispanic/Latino residents
1% were American Indian and Alaska Native residents as shown in Table 8 below.
Table 8Trumbull County: Business Ownership by Race, 2012
Race Percent % Rank
Black/African American 5% 2
White 91% 1
Asian 2% 3
Hispanic/Latino 1% 4
American Indian and Alaska Native
1% 4
Source: Data from Assets and Opportunity Scorecard, Census Bureau, 2015
Urban League, Mahoning Valley Page xi

Household Assets, Income Poverty, Asset Poverty, and Liquid Poverty Analysis
Unbanked Households
Those households that do not have accounts in insured financial institutions are referred to as unbanked. In 2015,
Youngstown had 16 % of households characterized as unbanked, compared to about 8% in Mahoning County, and 7% in the state of
Ohio, as shown in Table 9 below. In Trumbull County, it was 7%; in Warren, 14%; and in Ohio, 7% as shown in Table 10 below.
Below banked/Underbanked Households
Households that have financial services and/or receive products from non-bank alternative financial services (AFS) are
referred to as below banked/underbanked. In Youngstown, 23% of households were underbanked in 2015, compared to 18% in
Mahoning County, and 20% in the state of Ohio, as shown in Table 9. In Trumbull County, 17% households were impacted, while
20% were in Warren; and 20% in the state of Ohio as shown in Table 10 below.
Asset Poverty
Asset poverty is a condition in which a household’s inability to get access to sufficient wealth resources makes it very difficult
to provide for basic needs over a period of three months. For the City of Youngstown, 41 % of households experienced asset poverty
in 2015, compared to 22% in Mahoning County and 24 % in the state of Ohio as shown in Table 9. For Trumbull County, Table 10,
20% households were impacted by asset poverty; 37% in Warren; and 24% households in Ohio.
Liquid Asset
Liquid asset is defined as asset that is easy to sell or convert into cash without loss in value, e.g. bank notes and checking
accounts. In Youngstown, Table 9, 62% of households had liquid assets in 2015, compared to 43% in Mahoning County, and
Urban League, Mahoning Valley Page xii

45% in the state of Ohio. In Trumbull County, 41% of households were impacted; while 57% were in Warren; and 45% in the state of
Ohio as shown in Table 10 below.
Table 9Percentage of Household Wealth in Youngstown, Mahoning County and Ohio, 2015
Place Asset Poverty Liquid Asset Poverty
Below banked/Underbanked
Unbanked
Youngstown 41% 62% 23% 16%
Mahoning County 22% 43% 18% 8%
Ohio 24% 45% 20% 7%
Source: Data from Assets and Opportunity Scorecard, Census Bureau, 2015
Table 10Percentage of Household Wealth in Trumbull, Warren and Ohio, 2015
Place Asset Poverty Liquid Asset Poverty
Below banked/Underbanked
Unbanked
Warren 37% 57% 20% 14%
Trumbull County
20% 41% 17% 7%
Ohio 24% 45% 20% 7%
Source: Data from Assets and Opportunity Scorecard, Census Bureau, 2015
Urban League, Mahoning Valley Page xiii

Educational Attainment
In general, a higher education level leads to a higher income.
In Mahoning County, of the people age 25 and above with less than high school diplomas between 2009 and 2013:
22% were Black/African Americans
66% were White
1% were Asians
11% were Hispanics or Latinos
None were American Indian and Alaska Natives
In the City of Youngstown, people age 25 and above with less than high school diplomas were assessed between 2009 and
2013. It was found that:
42% were Black/African Americans
41% were White
16% were Hispanic/Latinos
None were Asians
1% were American Indians and Alaska Natives
In Trumbull County, educational attainment was assessed for people age 25 and above with less than high school diplomas
between 2009 and 2013. It was found that:
9% were Black/African Americans
88% were White
Urban League, Mahoning Valley Page xiv
2% were Hispanic/Latinos
1% were Asians
None were American Indians or Alaska Natives
In the City of Warren, people age 25 and above with less than high school diplomas were assessed between 2009 and 2013:
53% were Black/African Americans
45% were White
None were Asians
2% were Hispanic/Latinos
None were American Indians and Alaska Natives
Home Ownership in Mahoning and Trumbull Counties, 2014
There were 52% home owners in Mahoning County compared to 48% in Trumbull County in 2014, as illustrated in Figure 2.
When a five-year homeownership in Mahoning County was assessed by race between 2009 and 2013, it was found that:
10% were Black/African American residents
87% were White residents
1% were Asian residents
2% were Hispanic/Latino residents
No American Indian/Alaska Native residents were home owners as shown in Table 11.
Urban League, Mahoning Valley Page xv

Mahoning County Trumbull County
0.52
0.48
Figure 2. Home Ownership in Mahoning County and Trumbull County, 2014Source: Data from Ohio County Profiles (Prepared by the Office of Research)
Table 11 Mahoning County: Home Ownership by Race, 2009-2013
Race Percent % Rank
Black/African American 10% 2White 87% 1Asian 1% 4
Hispanic/ Latino 2% 3American Indian &
Alaska Native 0% 5
Source: U.S Census Bureau, 2009-2013 American Community Survey
Between 2009 and 2013, the percentage of homeownership in Trumbull County was as follows:
Urban League, Mahoning Valley Page xvi

5% were Black/African American residents
94% were White residents
1% were Hispanic/Latino residents
No home owners were Asian residents
No homeowners were American Indian or Alaska Native residents as shown in Table 12.
Table 12Trumbull County: Homeownership by Race, 2009-2013
Race Percent % RankBlack/ African American 5% 2
White 94% 1Asian 0% 4
Hispanic/ Latino 1% 3American Indian &
Alaska Native 0% 4
Source: U.S Census Bureau, 2009-2013 American Community Survey
Renter-Occupied Housing, 2009-2013
Urban League, Mahoning Valley Page xvii

Between 2009 and 2013 in Mahoning County, the percentage of renter-occupied housing assessment was as follows:
26.8% were Black/African American residents
66% were White residents
2% were Asian residents
5% were Hispanic/Latino residents
.2% were American Indian or Alaska Natives residents as shown in Table 13 below.
Table 13Mahoning County: Percent of Renter-Occupied Housing by Race, 2009-2013
Mahoning County % % Rank
Black/ African American 26.8% 2
White 66% 1
Asian 2% 4
Hispanic/ Latino 5% 3
American Indian &Alaska Native .2% 5
Source: U.S Census Bureau, 2009-2013 American Community Survey.
Between 2009 and 2013 in Trumbull County, the percentage of renter-occupied housing assessment was as follows:
17.9% were Black/African American residents
Urban League, Mahoning Valley Page xviii

80% were White residents
1% were Asian residents
1% were Hispanic/Latino residents
.1% were American Indian and Alaska Native residents
Table 14Trumbull County: Percent of Renter-Occupied Housing by Race, 2009-2013
Trumbull County % % RankBlack/ African American 17.9% 2
White 80% 1
Asian 1% 4
Hispanic/ Latino 1% 3
American Indian &
Alaska Native .1% 5
Source: U.S Census Bureau, 2009-2013 American Community Survey
Labor Force: Unemployment Assessment
Urban League, Mahoning Valley Page xix

In Mahoning County, between 2010 and 2014, the American Community Survey estimated that:
25% of Black/African American population were unemployed
8% of White population were unemployed
11% of Asian population were unemployed
15% of Hispanic/Latino population were unemployed
36% of American Indian and Alaska Native populations were unemployed as shown in Table 15.
Table 15Mahoning County: Unemployment Rate by Race, 2010-2014
Mahoning County % Rate Rank
Black/ African American 25 2
White 8 4
Asian 11 4
Hispanic/ Latino 15 3
American Indian &
Alaska Native 36 1
Source: U.S Census Bureau, 2009-2013 American Community Survey
Youngstown: Unemployment Rate by Race, 2010-2014
Urban League, Mahoning Valley Page xx

Unemployment in the City of Youngstown was assessed between 2010 and 2014 with the following results:
28% of the Black/African American residents were unemployed.
11% of the White residents were unemployed.
29% of the Asian residents were unemployed
21% of the Hispanic/Latino residents were unemployed
70% of American Indian and Alaska Native residents were unemployed
Trumbull County: Unemployment Rate by Race, 2010-2014
Between 2010 and 2014, unemployment analysis in Trumbull County produced the following results:
11% of the Black/African American population were unemployed
8% of the White population were unemployed
14% of the Asian population were unemployed
13% of the Hispanic/Latino population were unemployed
6% of the American Indian and Alaska Natives population were unemployed as shown in Table 16 below.
Table 16
Urban League, Mahoning Valley Page xxi

Trumbull County: Unemployment Rate by Race, 2010-2014
Trumbull County % Rate Rank
Black/ African American 11 3
White 8 4
Asian 14 1
Hispanic/ Latino 13 2
American Indian & Alaska Native
6 5
Source: U.S Census Bureau, 2009-2013 American Community Survey
City of Warren—Unemployment Rate, 2010-14In the City of Warren, between 2010 and 2014, unemployment analysis showed that:
14.5% of the Black/African American population were unemployed
10.7% of the White population were unemployed
No Asian resident was unemployed
11.8% of the Hispanic/Latino population were unemployed
No American Indian or Alaska Native resident was unemployed.
Mahoning County: Crime Index, 2009-2014
Urban League, Mahoning Valley Page xxii

Assessment of crime in Mahoning County between 2009 and 2014 showed that:
31% of crimes committed were by Black/African American criminals, while
69 %. of crimes committed were by White American criminals as shown in Figure 3.
0
100
200
300
400
500
600
700
31%
69%
Black White
Figure 3. Mahoning County --Crime Index, 2009-2014
Source: Data from Ohio Department of Public Safety (ODPS) 2009-2014
City of Youngstown Crime Index, 2009-2014
Crime assessment in the City of Youngstown between 2009 and 2014 indicated that:
83% of crimes were committed by Black/African American criminals
17% of crimes were committed by White criminals
Trumbull County—Crime Index, 2009-2014
Urban League, Mahoning Valley Page xxiii

In Trumbull County, crime assessment between 2009 and 2014 indicated that:
25% of crimes were committed by Black/African American criminals
75% of crimes were committed by White criminals as shown in Figure 4 below.
Black25%
White75%
Figure 4. Trumbull County—Crime Index, 2009-2014
Source: Data from Ohio Department of Public Safety (ODPS) 2009-2014
In the City of Warren, crime assessment between 2009 and 2014 indicated that:
66% of crimes were committed by Black/African American criminals
34% of crimes were committed by White criminals
Healthcare Insurance Coverage
Urban League, Mahoning Valley Page xxiv

In the Mahoning County, between 2010 and 2014, population age 18 and below without healthcare insurance
coverage were:
2% of the Black/African American population
4% of the White population
34% of the Asian population
2% of the Hispanic/Latino population
No data were available for the American Indian and Alaska Native populations
In the City of Youngstown, residents age 18 years and below without healthcare insurance coverage were:
2% of the Black/African American population
3% of the White population
2% of the Hispanic/Latino population
No data were available for the Asian population
No data were available for the American Indian and Alaska Native populations
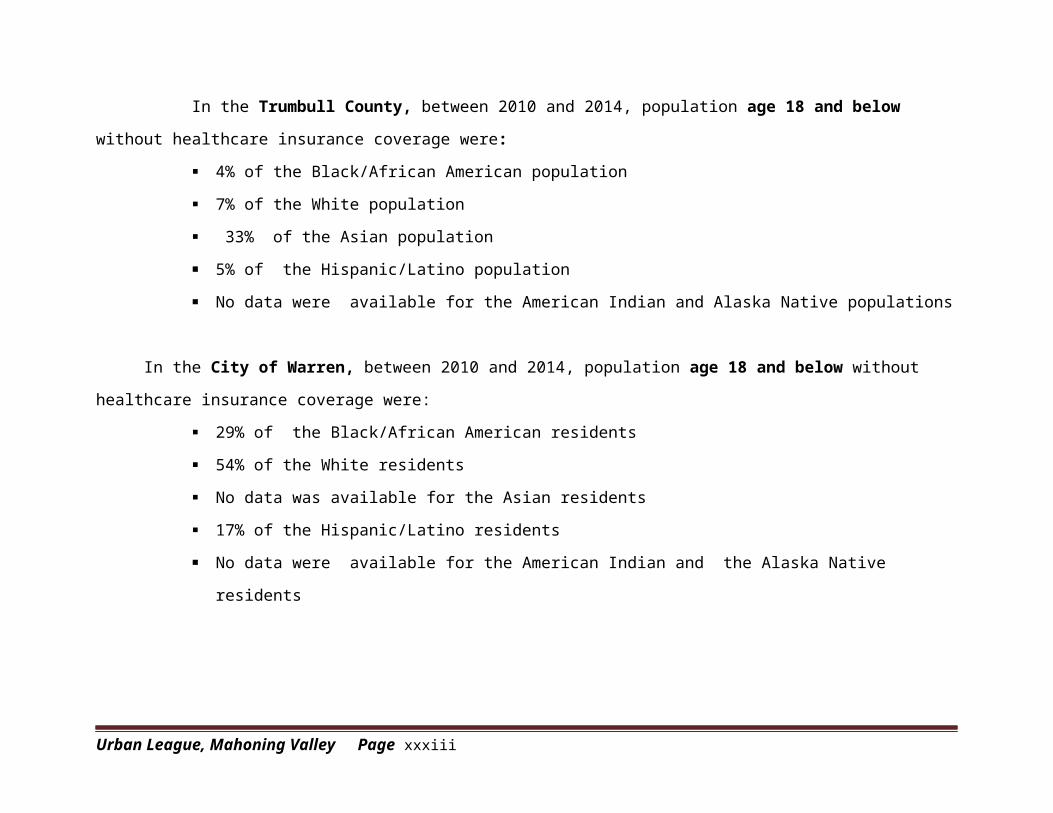
In the Trumbull County, between 2010 and 2014, population age 18 and below without healthcare insurance
coverage were:
4% of the Black/African American population
7% of the White population
33% of the Asian population
5% of the Hispanic/Latino population
Urban League, Mahoning Valley Page xxv

No data were available for the American Indian and Alaska Native populations
In the City of Warren, between 2010 and 2014, population age 18 and below without healthcare insurance coverage were:
29% of the Black/African American residents
54% of the White residents
No data was available for the Asian residents
17% of the Hispanic/Latino residents
No data were available for the American Indian and the Alaska Native residents
Mahoning County: Percentage of Population age 18-64 years by Race without Healthcare Insurance, 2010- 2014
In the Mahoning County, the percentages of the population 18-64 years without healthcare insurance coverage were:
23% of the Black/African American residents
14% of the White residents
23% of the Asian residents
22% of the Hispanic/Latino residents
34% of the American Indians and Alaska Native residents
In the City of Youngstown, the percentages of population age 18-64 years without healthcare insurance coverage between
2010 and 2014 were:
Urban League, Mahoning Valley Page xxvi

25% of the Black/African American residents
21% of the White residents
28% of the Asian population
18% of the Hispanic/Latino residents
57% of the American Indian and Alaska Native residents
Trumbull County: Population by Race age 18-64 years old without Healthcare Insurance Coverage, 2010-2014
In Trumbull County, the percentages of the population 18-64 years old without healthcare insurance coverage between 2010
and 2014 were:
22% of the Black/African Americans residents
18% of the White residents
29% of the Asian residents
20% of the Hispanic/Latino residents
11% of the American Indian and Alaska Native residents
In the City of Warren, the percentages of the population 18-64 years old without healthcare insurance coverage between 2010 and
2014 were:
30% of the Black/African American residents
64% of the White residents
2% of the Asian residents
4% of the Hispanic/Latino residents
Urban League, Mahoning Valley Page xxvii

No data were available for the American Indian and Alaska Native residents.
ConclusionOverall, there exists a measurable disparity in economic achievements between Black/African American residents and White
residents in the Mahoning Valley. While this disparity cannot be explained entirely or in part by this study due to its complexity, this
study concludes that the decision makers and/or stakeholders in the Valley can do something legislatively to create opportunities for
the present and future generations of Black/African American residents. Although there are many ways of tackling this onerous task,
this study suggests that one of the ways of creating opportunities for Black children, and by extension, other children in the Mahoning
Valley is to provide them access to a quality education from kindergarten through high school irrespective of where they live in the
city so that these students can graduate college-ready to go to a university or learn some skilled trades of their choice that would
support and/or facilitate their economic upward mobility.
TABLE OF CONTENTS
Page
Urban League, Mahoning Valley Page xxviii

Acknowledgments______________________________________________________________i
Executive Summary and Key Findings_____________________________________________ii
Economic Analysis____________________________________________________________v
Median Household Income________________________________________________v
Poverty Assessment, 2014_______________________________________________________vi
Public Assistance/Food Stamp/SNAP, 2009-2013____________________________________vii
Households on Public Assistance in Youngstown and Warren by Race, 2009-2013_________vii
Percentage of Mahoning County Residents by Race living below the Poverty Level, 2009-2013_______________________________________________________________________viii
Percentage of Youngstown Residents by Race living below the Poverty Level, 2009-2013________________________________________________________________________ix
Percentage of Trumbull County Residents by Race living below the Poverty Level, 2009-2013________________________________________________________________________ix
Percentage of Warren Residents by Race living below the Poverty Level, 2009-2013________________________________________________________________________ix
Business Ownership____________________________________________________________x
Household Assets, Income Poverty, Asset Poverty, and Poverty Analysis_________________xii
Unbanked Households___________________________________________________xii
Below banked/Underbanked Households_____________________________________xii
Asset Poverty__________________________________________________________xii
Urban League, Mahoning Valley Page xxix

Liquid Asset___________________________________________________________xii
Educational Attainment________________________________________________________xiv
In the Mahoning County_________________________________________________xiv
In the City of Youngstown________________________________________________xiv
In Trumbull County_____________________________________________________xiv
In the City of Warren____________________________________________________xv
Home ownership in Mahoning and Trumbull Counties, 2014__________________________xv
Renter-Occupied Housing, 2009-2013___________________________________________xviii
Labor Force: Unemployment Assessment__________________________________________xx
Youngstown: Unemployment Rate by Race, 2010-2014______________________________xxi
Trumbull County: Unemployment Rate by Race, 2010-2014___________________________xxi
City of Warren: Unemployment Rate, 2010-2014___________________________________xxii
Mahoning County—Crime Index, 2009-2014______________________________________xxiii
City of Youngstown Crime Index, 2009-2014_____________________________________xxiii
Trumbull County—Crime Index, 2009-14________________________________________xxiv
Healthcare Insurance Coverage_________________________________________________xxv
In the Mahoning County_________________________________________________xxv
In the City of Youngstown_______________________________________________xxv
Urban League, Mahoning Valley Page xxx

In Trumbull County____________________________________________________xxv
In the City of Warren___________________________________________________xxvi
Mahoning County: Percentage of Population age 18-64 years by Race without Healthcare Insurance, 2010-2014________________________________________________________xxvi
In the Mahoning County________________________________________________xxvi
In the City of Youngstown______________________________________________xxvii
Trumbull County: Population by Race age 18-64 years old without Healthcare Insurance, 2010-2014_____________________________________________________________________xxvii
In Trumbull County___________________________________________________xxvii
In the City of Warren__________________________________________________xxvii
Conclusion________________________________________________________________xxviii
Inntroduction__________________________________________________________________1
History of the Greater Warren-Youngstown Urban League______________________________2
Study Objective________________________________________________________________2
Population____________________________________________________________________2
Median Household Income in Mahoning County by Race, 2014__________________________8
Median Household Income in Trumbull County by Race, 2014_________________________9
Mahoning County: Poverty Level Assessment, 2014_________________________________10
Urban League, Mahoning Valley Page xxxi

Trumbull County: Poverty Level Assessment, 2014__________________________________11
Percentage of Mahoning County Residents by Race living below the Poverty Level, 2009-13_12
Percentage of Youngstown Residents by Race living below the Poverty Level, 2009-13______13
Percentage of Trumbull County Residents by Race living below the Poverty Level, 2009-13__14
Percentage of Warren Residents by Race living below the Poverty Level, 2009-13__________15
Percentage of Mahoning and Trumbull County Residents Receiving Public Assistance/Food Stamps/SNAP, 2009-13________________________________________________________16
Percentage of Youngstown Residents by Race Receiving Public Assistance/Food Stamps/SNAP,
2009-13_____________________________________________________________________17
Percentage of Warren Residents by Race Receiving Public Assistance/Food Stamps/SNAP, 2009-13__________________________________________________________________________18
Household Assets, Income Poverty, Asset Poverty, and Liquid Poverty Analysis____________20
Comparative Household Assets: Unbanked, Below Banked, Asset Poverty, and Liquid Poverty Analysis in Mahoning County, Youngstown and Ohio, 2015_____________________20
Comparative Household Assets: Unbanked, Below Banked, Asset Poverty, and Liquid Poverty Analysis in Mahoning County, Youngstown and Ohio, 2015____________________________22
Educational Attainment_________________________________________________________23
Mahoning County: Percentage of Population age 25 years and above by Race with Less than High School Diploma, 2009-2013_________________________________________24
City of Youngstown: Percentage of Population age 25 years and above by race with Less
Urban League, Mahoning Valley Page xxxii
than High School Diploma, 2009-2013_____________________________________________25
Trumbull County: Percentage of population age 25 years and above by Race with less than High School Diploma, 2009-2013_________________________________________________26
City of Warren: Percentage of Population age 25 years and above by race with Less than
High School Diploma, 2009-2013________________________________________________27
Percentage of Housing Occupancy in Mahoning and Trumbull Counties, 2014_____________29
Mahoning County: Percentage of Homeownership by Race, 2009-13_____________________30
Mahoning County: Percentage of Renter-Occupied Housing by Race, 2009-2013___________31
Trumbull County: Percentage of Homeownership by Race, 2009-2013___________________32
Trumbull County: Renter-Occupied Housing by Race, 2009-2013_______________________33
Labor Force__________________________________________________________________35
Mahoning County: Unemployment Rate by Race, 2010-2014___________________________35
Youngstown: Unemployment Rate by Race, 2010-2014_______________________________37
Trumbull County: Unemployment Rate by Race, 2010-2014___________________________38
City of Warren: Unemployment Rate by Race, 2010-2014_____________________________37
Mahoning County: Assessing Household Income by Race, 2006-2010___________________40
Trumbull County: Assessing Household Income by Race, 2006-2010____________________41
Urban League, Mahoning Valley Page xxxiii

Mahoning County: Percentage Assessment of Business Ownership by Race, 2012__________42
City of Youngstown: Percentage of Business Ownership by Race, 2012__________________43
Trumbull County: Percentage Assessment of Business Ownership by Race, 2012___________44
City of Warren : Percentage of Business Ownership by Race, 2012______________________46
Crime Index_________________________________________________________________47
Mahoning County: Black and White Crime Index, 2009-2014__________________________47
Crime Index by Race in Youngstown, 2009-2014____________________________________48
Crime Index: Trumbull County Black vs White, 2009-2014____________________________49
City of Warren: Crime Index by Race, 2009-2014___________________________________50
Mahoning County: Percentage of Population age 18 years and below by Race without Healthcare Insurance coverage, 2010-2014_________________________________________51
City of Youngstown: Percentage of Population age 18 years and below by Race, without Healthcare Insurance coverage, 2010-2014_________________________________________53
Mahoning County: Percentage of Population age 18-64 years old by Race without Healthcare Insurance, 2010-2014_________________________________________________54
Youngstown: Percentage of Population age 18-64 years old by Race without Healthcare Insurance, 2010-2014__________________________________________________________55
Trumbull County: Percentage of Residents age 18 years and below without Healthcare Insurance Coverage, 2010-2014__________________________________________________56
City of Warren: Percentage of Population age 18 years and below by Race without
Urban League, Mahoning Valley Page xxxiv

Healthcare Insurance, 2010-14___________________________________________________58
Trumbull County: Population 18-64 Years of Age by Race without Healthcare Insurance, 2010-2014________________________________________________________________________59
City of Warren: Percentage Population 18-64 Years old by Race with no Healthcare Insurance Coverage, 2010-2014__________________________________________________________60
Summary and Conclusions___________________________________________________ ___61
LIST OF TABLES
Table 1—Population Growth Profile, 2010-2014______________________________________3
Table 2__Selected Population Growth Trends in Mahoning County by Race, 2010-2014______4
Table 3__Selected Population Growth Trends in Trumbull County_______________________6
Table 4__ Mahoning County Median Household Income by Race, 2014___________________8
Table 5__ Trumbull County Median Household Income by Race, 2014____________________9
Table 6__Poverty Assessment in Mahoning County, 2014__________________________ ___10
Table 7__ Poverty Level Assessment in Trumbull County, 2014_______________________ _11
Urban League, Mahoning Valley Page xxxv

Table 8__ Percentage Estimates of Household Wealth in Youngstown, Mahoning County and
Ohio________________________________________________________________________21
Table 9__ Percentage Comparative Household Wealth in Trumbull, Warren and Ohio, 2015__22
Table 10__ Mahoning County: Assessing Household Income by Race, 2006-2010_________41
Table 11__ Trumbull County: Assessing Household Income by Race, 2006-2010_______42
LIST OF FIGURES
Figure 1__ Selected Population Growth Trends in Mahoning County by Race, 2010-2014_____5
Figure 2__ Selected Population Growth Trends in Trumbull County by Race, 2010-2014______7
Figure 3__ Percentage of Mahoning County Residents by Race living below thePoverty Level, 2009-2013_________________________________________________12
Figure 4__ Percentage of Youngstown Population by Race Living below the PovertyLevel, 2009-2013________________________________________________________13
Figure 5__ Percentage of Trumbull County Residents by Race living belowthe Poverty Level, 2009-2013______________________________________________14
Figure 6__ City of Warren: Percentage Population by Race with Income
Urban League, Mahoning Valley Page xxxvi

below the poverty level, 2009-2013._________________________________________15
Figure 7__ Percent of Mahoning and Trumbull County Residents on PublicAssistance/Food Stamps/SNAP1, 2009-2013__________________________________16
Figure 8__ Percentage of Residents of Youngstown Residents by Race on PublicAssistance/Food Stamps/SNAP, 2009-2013___________________________________17
Figure 9__ Percentage of Population in the City of Warren who received Public Assistance by Race__________________________________________________________________19
Figure 10__Estimates of Household Wealth in Youngstown, Mahoning County, and Ohio, 2015_______________________________________________________________21
Figure 11__ Estimates of Household Wealth in Warren, Trumbull County, and Ohio, 2015___23
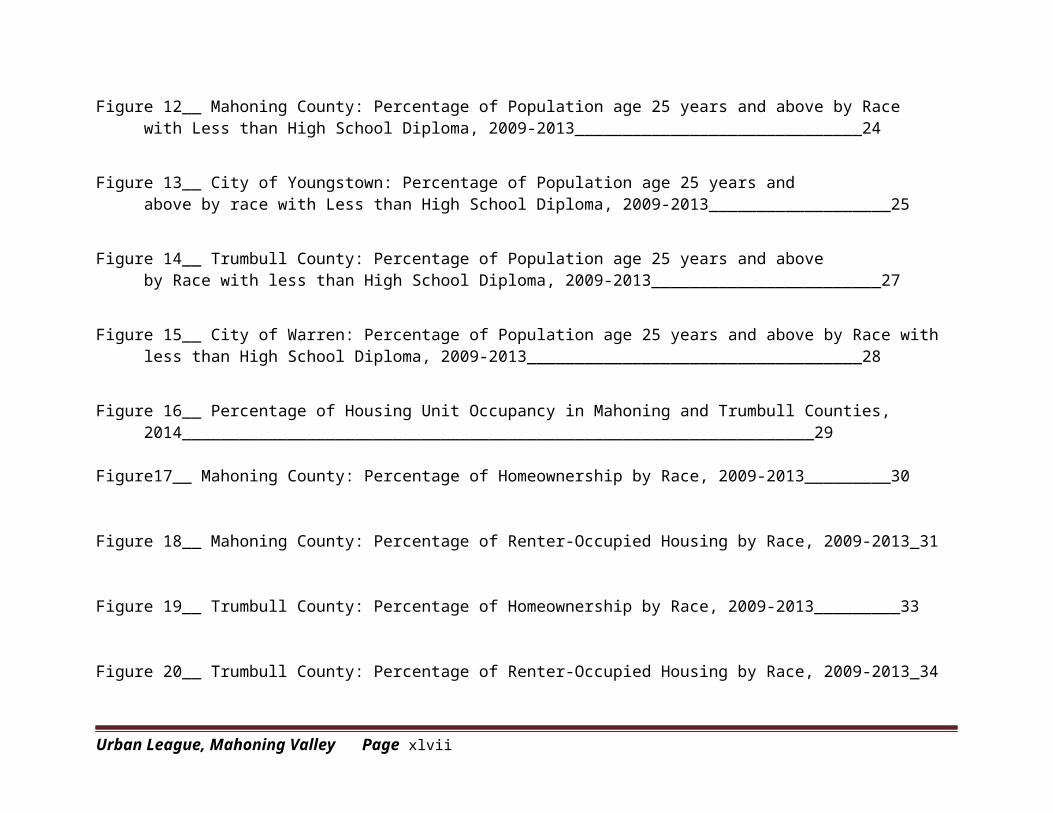
Figure 12__ Mahoning County: Percentage of Population age 25 years and above by Racewith Less than High School Diploma, 2009-2013______________________________24
Figure 13__ City of Youngstown: Percentage of Population age 25 years andabove by race with Less than High School Diploma, 2009-2013___________________25
Figure 14__ Trumbull County: Percentage of Population age 25 years and aboveby Race with less than High School Diploma, 2009-2013________________________27
Figure 15__ City of Warren: Percentage of Population age 25 years and above by Race with less than High School Diploma, 2009-2013___________________________________28
Figure 16__ Percentage of Housing Unit Occupancy in Mahoning and Trumbull Counties, 2014__________________________________________________________________29
Urban League, Mahoning Valley Page xxxvii
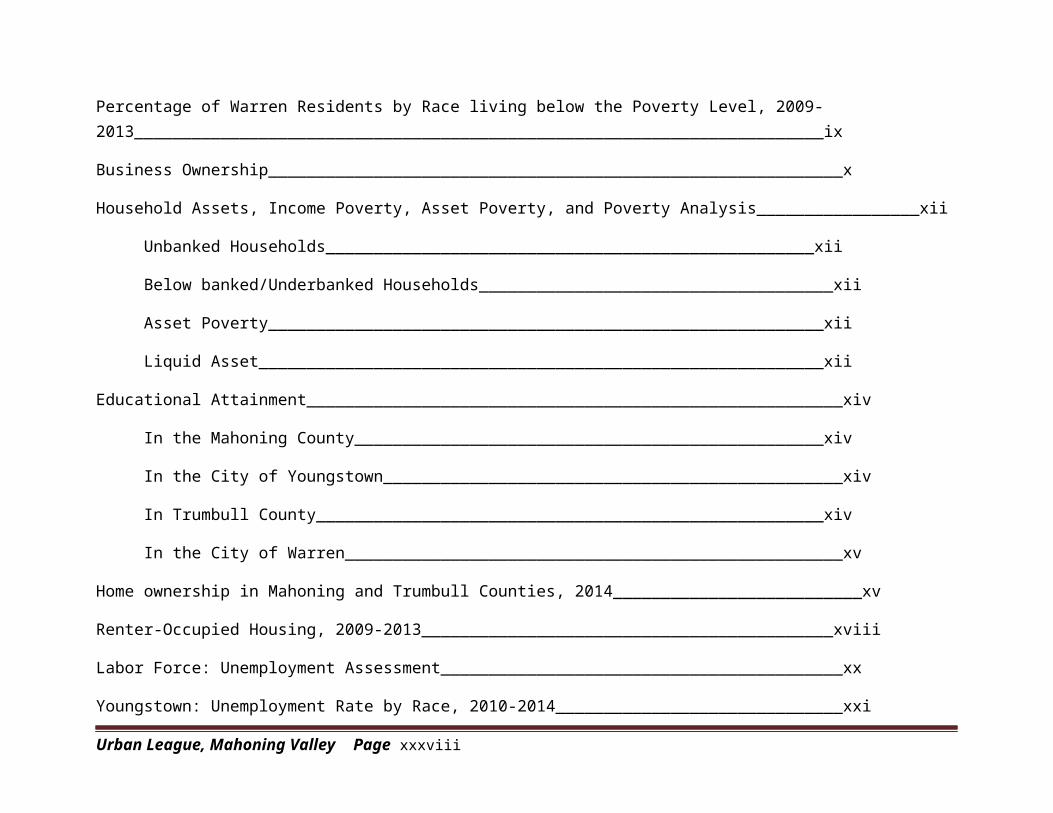
Figure17__ Mahoning County: Percentage of Homeownership by Race, 2009-2013_________30
Figure 18__ Mahoning County: Percentage of Renter-Occupied Housing by Race, 2009-2013_31
Figure 19__ Trumbull County: Percentage of Homeownership by Race, 2009-2013_________33
Figure 20__ Trumbull County: Percentage of Renter-Occupied Housing by Race, 2009-2013_34
Figure 21__ Mahoning County: Unemployment Rate by Race, 2010-2014________________36
Figure 22__ Youngstown: Unemployment Rate by Race, 2010-2014_____________________37
Figure 23__ Trumbull County: Unemployment Rate by Race, 2010-2014_________________38
Figure 24__ City of Warren: Unemployment rate among the races, 2010-2014_____________39
Figure 25__ Percentage of firm ownership by Race in Mahoning County, 2012____________44
Figure 26__ Percentage Assessment of Firm Ownership by Race
in Youngstown, 2012____________________________________________________45
Figure 27__ Percentage of firm ownership by Race in Trumbull County, 2012_____________46
Urban League, Mahoning Valley Page xxxviii

Figure 28__Comparative Assessment of Firm Ownership in Warren, 2012________________47
Figure 29__ Mahoning County: Black and White Crime Index, 2009-2014________________48
Figure 30__ Crime Index: Youngstown--Black vs. White, 2009-2014____________________49
Figure 31__ Trumbull County: Percentage of Black vs White Crime Index,
2009-2014_____________________________________________________________50
Figure 32__ City of Warren: Crime Index by Race, 2009-2014_________________________51
Figure 33__ Mahoning County: Percentage of Population age 18 yearsand below by race without Healthcare coverage, 2010-2014______________________53
Figure 34__ Youngstown: Percentage of Population age 18 years and below by Race with without Healthcare Insurance coverage, 2010-14____________________54
Figure 35__ Mahoning County: Percentage of Population age 18-64 years old by Racewithout Healthcare Insurance, 2010-2014____________________________________55
Figure 36__ Youngstown: Percentage of Population age 18-64 years old byRace without Healthcare Insurance, 2010-2014________________________________56
Figure 37__ Trumbull County: Percentage of Residents age 18 years and below by Racewithout Healthcare Insurance, 2010-2014____________________________________57
Urban League, Mahoning Valley Page xxxix

Figure 38__ City of Warren: Percentage of Population age 18 years and below by Racewithout Healthcare Insurance, 2010-14______________________________________58
Figure 39__ Trumbull County: Population 18-64 years of age by Race withoutHealthcare Insurance, 2010-2014___________________________________________59
Figure 40__ City of Warren: Percentage Population 18-64 years old without Health Insurance, 2010-14______________________________________________________60
Urban League, Mahoning Valley Page xl

Urban League, Mahoning Valley Page xli

THE STATE OF BLACK/AFRICAN AMERICANS IN THE MAHONING VALLEY
Introduction
The National Urban League grew out of the grassroots movement “to enable African Americans secure economic self-
reliance, parity, power and civil rights” in the face of increased discrimination and racism against African American settlers in the
North in the 1800s. Overtime, this organization has transformed into an organic institutional voice of African Americans on socio-
economic issues with branches at all county levels throughout all 50 states in the nation. It is on this platform that this organization is
able to publish what it refers to as the “State of Urban Black America,” an annual publication analytics that statistically bring to
public awareness the socio-economic gap existing in all communities of color in the nation. It does so by comparing Black and White
socio-economic performances side-by-side with other racial minorities, using such socio-economic benchmarks as social justice,
entrepreneurship, employment, income, education, housing, crime and healthcare. The goal is to uncover the root cause of the
widening gap and prevalence of inequality in the Black population on these socio-economic indexes. Where there is prevalence of
these inequalities on the basis of systemic/institutional racism, the organizational leaders are supposed to address the existence and
prevalence of the alleged disparity through a meeting with local government decision makers in the hope that action will be taken
legislatively to ameliorate the status quo.
Following the 2015 National publication of State of Black America, that pointed out the low performances of Black/African
Americans when compared with their White counterparts and other minority groups in nearly all socio-economic indexes, a decision
was made by the local Urban League Chapter of Greater Warren-Youngstown Urban League to gauge into the socio-economic status
of African Americans in the Mahoning Valley.
Urban League, Mahoning Valley Page 1

History of the Greater Warren Youngstown Urban League
The local Urban League was established in Warren in 1930 as the Warren Urban League, and later, as the Warren Trumbull
Urban League. The Youngstown Area Urban League was established later in 1966. Currently, we are known as the Greater
Warren-Youngstown Urban League, with the goal of providing better programmatic and coordinated solutions to such socio-
economic problems as education, employment, housing, homelessness and business development that impact our communities in the
Mahoning Valley.
Study Objective
This study will compare the performances of Black/African American residents vis-à-vis White residents and other racial
minorities living in the Mahoning Valley using such socio-economic variables as demographics, housing, household income,
employment, poverty, welfare, access to capital, crime and overall equality index. Mahoning and Trumbull counties will be analyzed
separately and comparatively to identify any unique set of socio-economic problems facing individuals in these counties.
Population
Mahoning and Trumbull Counties’ populations were compared to their capital cities and the state of Ohio to measure
population growth/decline from 2010 to 2014. In Table 1, Mahoning and Trumbull counties experienced population decline of 2.35%
and 2.44%, respectively. The Cities of Youngstown and Warren encountered the same populations’ decline of 2.88% and 2.22%,
respectively. The state of Ohio showed a slight increase of .5% over this period.
Table 2 shows a selected racial population profile in Mahoning County from 2010 to 2014. It was found that while the
Black/African American population declined by .004% and ranked 3rd in population change, the White population declined by 1.2%
Urban League, Mahoning Valley Page 2

and ranked 4th in population change in the County. The American Indian and Alaska Natives population also experienced a decline of
3.5% and ranked 5th in population change, but the Hispanic/Latino and the Asian populations experienced growth rates of 3.1% and
13.6% respectively, and ranked 2nd and 1st in population change respectively, over the study period as shown in Table 2 and Figure 1
respectively.
Table 1 Population Growth Profile, 2010-2014
2010 2014(Estimate)
2010-14% Change
PlaceMahoning County 238,823 233,204 -2.35
City of Youngstown 66,982 65,051 -2.88
Trumbull County 210,307 205,175 -2.44
City of Warren 41,557 40,633 -2.22
Ohio 11,536,725 11,594,163 0.50
Source: Data from the U.S. Census Bureau, 2010 Census Demographic Profile Summary File, and Ohio County Profiles prepared by the Office of Research, Ohio Development Services Agency
Urban League, Mahoning Valley Page 3
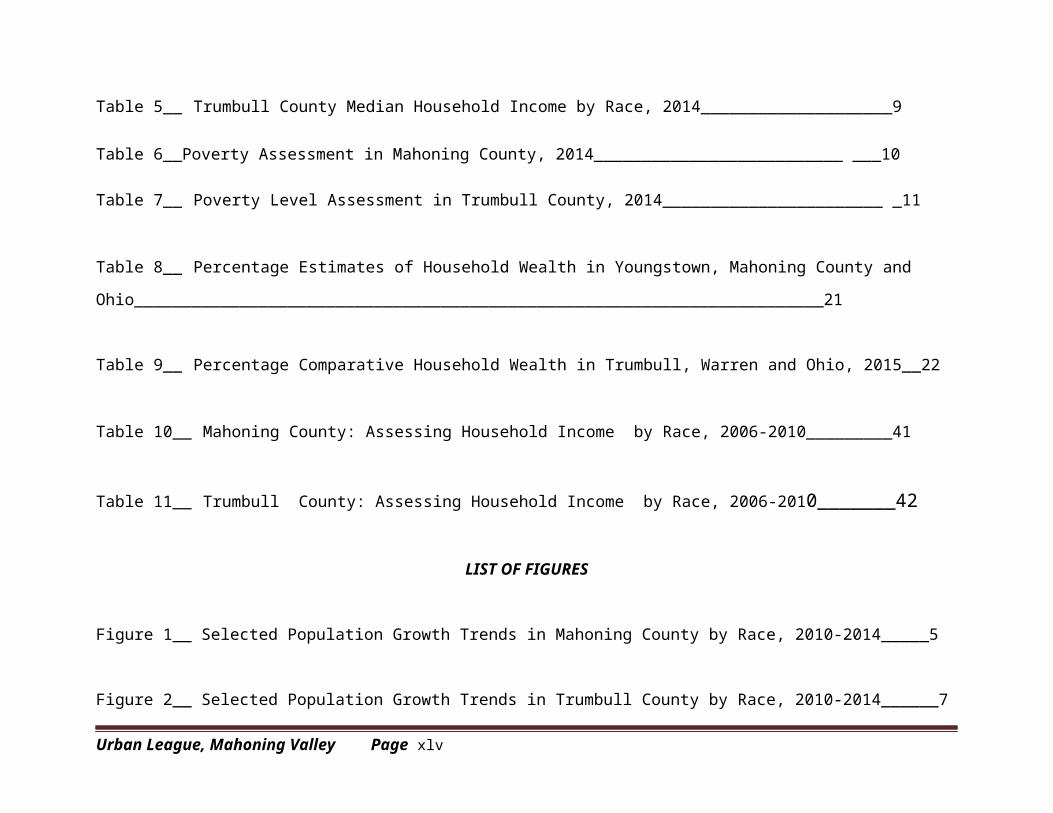
Table 2
Selected Population* Growth Trends in Mahoning County by Race, 2010-2014
Race 2010 2014 (Estimate) 2010-2014 %Change
% Change Rank
Black/African American
37,433 37,132 -.004 3
White 190,848 188,634 -1.2 4
Asian 1,682 1,911 13.6 1
Hispanic/Latino 11,136 11,482 3.1 2
American Indian and Alaska Native
491 474 -3.5 5
Source: Data from the U.S. Census Bureau, 2010 Census Demographic Profile Summary File, and OhioCounty Profiles prepared by the Office of Research, Ohio Development Services Agency
*Five racially-based populations were selected for this study.
Urban League, Mahoning Valley Page 4

Black/ African American
White Hispanic/Latino Amer.Ind.& Alas. Natives
Asian
-5.00%
0.00%
5.00%
10.00%
15.00%
-0.40%-1.20%
3.10%
-3.50%
13.60%
Figure 1. Selected Population Growth Trends in Mahoning County by Race, 2010-2014
Sources: Data from the U.S, Census Bureau, 2010 Census Demographic Profile SummaryFile and Ohio Development Services Agency, Office of Research
As shown in Table 3 below, the Black/African American population in Trumbull County experienced .6% population decline
and ranked 3rd in percentage change, while the White population had a minor increase of .84% and ranked 2nd in percentage change for
the same period. The Asian population ranked 1st in percentage change in the County with an increase of 3.1%, while the
Urban League, Mahoning Valley Page 5
Hispanic/Latino population and American Indian and Alaska Natives population experienced a population decline of 4.6% and 12.9%
respectively as illustrated in Figure 2.
Table 3Selected Population Growth Trends in Trumbull County by Race, 2010-2014
Race 2010 2014 (Estimate)
2010-2014 % Change
% Change Rank
Black/African American 17,422 17,317 -0.6 3
White 184,529 186,070 0.84 2
Asian 997 1,028 3.1 1
Hispanic/Latino 3,128 2,984 -4.6 4
American Indian & Alaska Native 278 242 -12.9 5
Source: Data from the U.S, Census Bureau, 2010 Census Demographic Profile SummaryFile and Ohio Development Services Agency, Office of Research
Urban League, Mahoning Valley Page 6

Black/ African
American
White Asian Hispanic/Latino
Amer. Indian
and Alas. Native
-0.14
-0.12
-0.1
-0.08
-0.06
-0.04
-0.02
0
0.02
0.04
-0.6%
0.0084
3.1%
-0.046
-12.9%
Figure 2. Selected Population Growth Trends in Trumbull County by Race, 2010-2014
Source: Data from the U.S, Census Bureau, 2010 Census Demographic Profile SummaryFile and Ohio Development Services Agency, Office of Research
Urban League, Mahoning Valley Page 7

Median Household Income in Mahoning County by Race, 2014
Generally, household income is an indicator of the well-being of an individual, family, or community. Historically,
Black/African American households experience persistent lower median household income at the state and national levels when
compared to other racial groups. This trend persists in the Mahoning Valley. In 2014, the average median household income of Ohio
residents was estimated at $48,308, compared to $41,058 for the Mahoning County, $24,012 for the City of Youngstown, and $53,046
for the U.S. As shown in Table 4 below, Black/African American median household income of $20,095 was half that of Mahoning
County, and over two times less than that of Ohio and the U.S. in 2014 shown above. On the other hand, the White median household
income of $44,585 was higher than the County’s median income, but lower than that of Ohio or the U.S. Asian median household
income of $53,301 was slightly higher than the U.S., and much higher than Ohio and the Mahoning County respectively.
Table 4Mahoning County Median Household Income by Race, 2014**
Race Median Household Income Rank
Black/African American $20,095 5
White $44,585 2
Hispanic/Latino $28,860 3
American Indian & Alaska Native
$27,461 4
Asian $53,301 1
Sources: Ohio County Profiles (Prepared by Ohio Development Services Agency,Office of Research), and American Community Survey (ACS).
**(In 2013 Inflation-adjusted dollars)
Urban League, Mahoning Valley Page 8

Median Household Income in Trumbull County by Race, 2014
Trumbull County had a median household income of $42,880 in 2014. Table 5 shows that Asian residents had the highest
median household income of $49,137 among all racial groups in the county. White residents had the second highest median household
income of $44,991, while Black/African American residents’ median household income of $24,954 was the third highest of the five
selected races studied. However, Black/African American household income was half that of the Asian household income, and
considerably lower than the White household income as well as that of the American Indian and Alaska Natives ($27,612) in the
county as shown in Table 5.
Table 5Trumbull County Median Household Income by Race, 2014**
Race Median Household Income Rank
Black or African American
$24,954 4
White $44,991 2
Hispanic or Latino $22,786 5
American Indian & Alaska Native
$27,612 3
Asian $49,137 1
Sources: Ohio County Profiles (Prepared by Ohio Development Services Agency,Office of Research), and American Community Survey
**(In 2013 Inflation -adjusted dollars)
Urban League, Mahoning Valley Page 9
Mahoning County: Poverty Level Assessment, 2014
General Poverty Guidelines:
Income Poverty is defined as the percentage of households with income below the federal poverty threshold. Accordingly, in 2014,
A household of one person making below $11,670 in a year, was considered to be living below the poverty level.
A household of four with annual income below $23,850 was considered to be living below the poverty level.
A household of 8 persons with annual income below $40,090; was considered to be living below the poverty level.
In 2014, Mahoning County was home to 61,683 families, of which 53,389 families or approximately 87% were above the
poverty levels. In 2014, an estimated 15.8% of Ohioans lived below the poverty level which was at a higher rate than in Mahoning
County at 13.4% as shown in Table 6 below.
Table 6Poverty Assessment in Mahoning County, 2014
Poverty Level Total Percent
Number of Families 61,683 100%
Urban League, Mahoning Valley Page 10
Number of Families above poverty level
53,389 86.6%
Number of Families below
poverty level
8,294 13.4%
Source: Data from Ohio Development Services Agency, Office of Research
Trumbull County: Poverty Level Assessment, 2014
In Trumbull County, there were 55,634 families in 2014, of which 7,473 or 13% lived below the poverty level. Table 7 below
shows that both Trumbull and Mahoning Counties had equal percentages of families who lived above and below the poverty level.
Table 7Poverty Level Assessment in Trumbull County, 2014
Poverty Level Total Percent
Number of Families
55,634 100%
Number of Families above poverty level
48,161 86.6%
Number of Families below poverty level
7,473 13.4%
Urban League, Mahoning Valley Page 11

Source: Data from Ohio Development Services Agency, Office of Research
Percentage of Mahoning County Residents by Race living below the Poverty level, 2009-2013
In Figure 3, racial populations living below the poverty level in Mahoning County were analyzed over a five year period (2009-2013) with the following results:
29% were Black/African American residents
9% were White residents
27% were Hispanic or Latino residents
22% were American Indian and Alaska Native residents
13% were Asian residents
Urban League, Mahoning Valley Page 12
Black/African Amer-icans 29%
White9%
Hispanic/Latino27%
Asian13%
American Indian/ Alaska Native
22%
Figure 3. Percentage of Mahoning County Residents by Race living below thePoverty Level, 2009-2013
Source: Data from U.S Census Bureau, 2009-2013 5-Year American Community Survey (ACS).
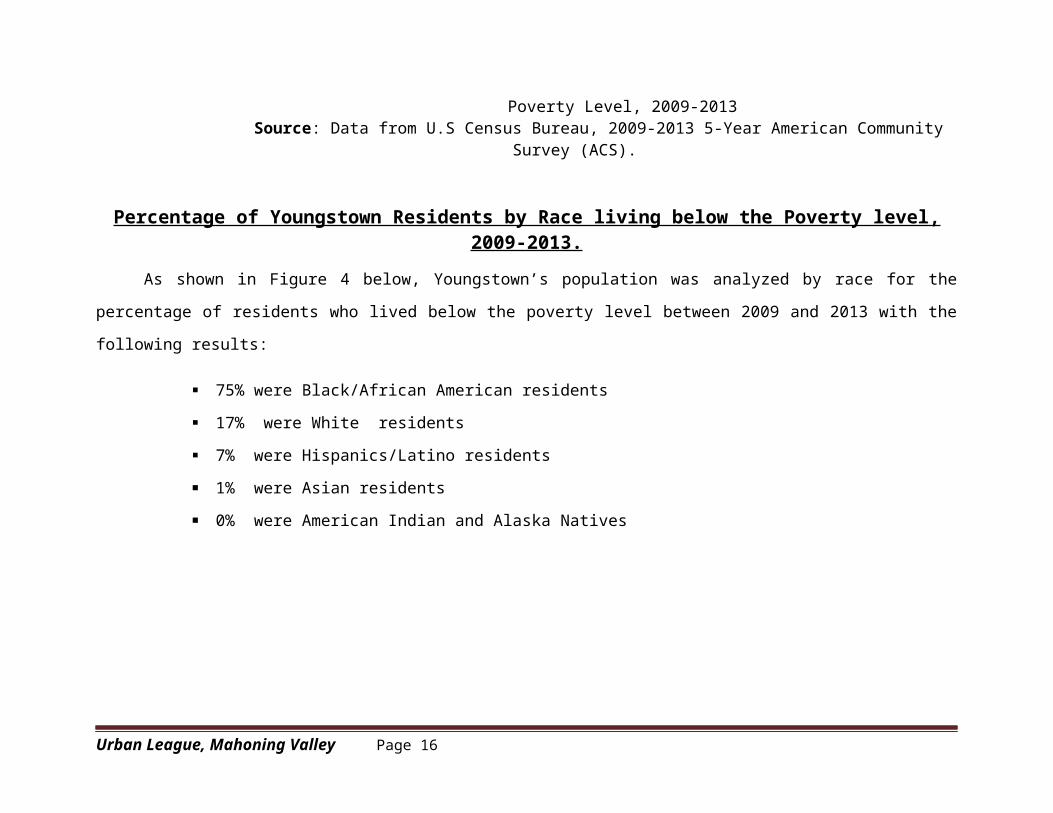
Percentage of Youngstown Residents by Race living below the Poverty level, 2009-2013.
As shown in Figure 4 below, Youngstown’s population was analyzed by race for the percentage of residents who lived below
the poverty level between 2009 and 2013 with the following results:
75% were Black/African American residents
17% were White residents
7% were Hispanics/Latino residents
1% were Asian residents
0% were American Indian and Alaska Natives
Urban League, Mahoning Valley Page 13

Black/African American
75%
White17%
Asian0%
Hispanic/Latino7%
American Indian & Alaska Native0%
Figure 4. Percentage of Youngstown Population by Race Living below the PovertyLevel, 2009-2013
Source: Data from American Community Survey (ACS).
Percent of Trumbull County Residents by Race living below the Poverty level, 2009-2013
As illustrated in Figure 5 below, Trumbull County residents were analyzed between 2009 and 2013 for the percentage of
residents by race who lived below the poverty level. It was found that:
33% were Black/African American residents
12% were White residents
12% were Hispanic/Latino residents
22% were Asian residents.
21% were American Indian and Alaska Native residents
Urban League, Mahoning Valley Page 14

Black/African American
34%
White12%Asian
22%
Hispanic/Latino 12%
American Indian & Alaska Native
21%
Figure 5. Percentage of Trumbull County Residents by Race living below the Poverty Level, 2009-2013
Source: Data from American Community Survey (ACS).
Percentage of Warren Residents by Race living below the Poverty level, 2009-2013.
As depicted in Figure 6 below, Warren residents were analyzed by race, for the percentage of people living below the poverty
level between 2009 and 2013 with the following results:
42% were Black/African American residents
54% were White residents
4% were Hispanic/Latino residents
0% were Asian residents
0% were American Indian and Alaska Native residents
Urban League, Mahoning Valley Page 15

Black/African American
42%
White54%
Asian0%
Hispanic/Latino
4%American Indian & Alaska Native
0%
Figure 6. City of Warren: Percentage Population by Race with income below the Poverty level, 2009-2013.
Source: Data from American Community Survey (ACS).
Percent of Mahoning and Trumbull County Residents Receiving Public Assistance/Food Stamps/SNAP 1 , 2009-2013
Figure 7 shows that between 2009 and 2013, 54% of Mahoning County residents, and 46% of Trumbull County residents
received Public Assistance.
Urban League, Mahoning Valley Page 16

Mahoning County
Trumbull County
0.42
0.44
0.46
0.48
0.5
0.52
0.54
0.56
0.54
0.46
Figure 7. Percent of Mahoning and Trumbull County Residents on PublicAssistance/Food Stamps/SNAP1, 2009-2013
Source: Data from American Community Survey (ACS).
1 SNAP is Supplemental Nutrition Assistance Program.
Percentage of Youngstown Residents by Race Receiving Public Assistance/Food Stamps/SNAP, 2009-2013
Figure 8 shows the percentage of residents in the City of Youngstown by race on Public Assistance between 2009 and 2013:
27% were from Black/African American households
14% were from White households
Urban League, Mahoning Valley Page 17

35% were from Hispanic/Latino households
23% were from American Indian and Alaska Native households
1% were from Asian households
Black/African American
27%
White14%
Asian1%
Hispanic/Latino34%
American In-dian &Alaska
Native23%
Figure 8. Percentage of Residents of Youngstown Residents by Race on PublicAssistance/Food Stamps/SNAP, 2009-2013
Source: Data from American Community Survey (ACS).
Percentage of Warren Residents by Race Receiving Public Assistance/Food Stamps/SNAP, 2009-2013
Figure 9 shows the percentage of households by race in the City of Warren who received Public Assistance between 2009 and
2013:
40% were from Black/African American households
Urban League, Mahoning Valley Page 18

56% were from White households
3% were from Hispanics/Latino households
1% were from American Indians and Alaska Native households
Black/African American
White Asian Hispanic/Latino Amer. Ind. & Alas. Native
0
0.1
0.2
0.3
0.4
0.5
0.6
40%
56%
0%3%
1%
Figure 9. Percentage of Population in the City of Warren who received Public Assistance by Race, 2009-2013.
Urban League, Mahoning Valley Page 19

Source: Data from American Community Survey (ACS)
Comparative Household Assets: Unbanked, Below Banked, Asset Poverty, and Liquid Poverty Analysis in Mahoning County, Youngstown and Ohio, 2015
Unbanked Households: Those households that do not have accounts in insured financial institutions are referred to as
unbanked. In Youngstown, 16 % of households were characterized as unbanked, compared to about 8% in Mahoning County and 7%
in the state of Ohio, as shown in Table 8 below.
Below banked/Underbanked Households: Households /individuals that carry out financial transactions from non-bank
alternative financial services (AFS). In other words, individuals who rely heavily on checks and/or cash as a means of financial
transactions rather than bank-related methods associated with credit cards or loans. In Youngstown, 23% of households were
underbanked in 2015, as compared to 18% in Mahoning County, and 20% in the state of Ohio, as shown in Table 8.
Asset Poverty: An Asset poverty is a condition in which a household’s inability to get access to sufficient wealth resources,
making it very difficult to provide for basic needs over a period of three months. For the City of Youngstown, 41 % of households
experienced asset poverty in 2015, compared to 22% in Mahoning County and 24 % in the state of Ohio as shown in Table 8 below.
Liquid Asset: A Liquid asset is defined as asset that is easy to sell or convert into cash without loss in value, e.g. bank notes
and checking accounts. In Youngstown, 62% of households had liquid assets in 2015, compared to 43% in Mahoning County, and
45% in the state of Ohio as shown in Table 8 and illustrated in Figure 10.
Urban League, Mahoning Valley Page 20

Table 8Percentage Estimates of Household Wealth in Youngstown, Mahoning County and Ohio
PlaceAsset
Poverty
Liquid Asset
PovertyBelow
bankedUnbanke
dYoungstow
n: 41% 62% 23%16%
Mahoning County 22% 43% 18%
8%
Ohio 24% 45% 20% 7%
Source: Data from Assets and Opportunity Scorecard, Census Bureau, 2015
Comparative Estimates of Household Wealth
Urban League, Mahoning Valley Page 21

Asset Poverty Liquid Asset Underbanked Unbanked0
0.1
0.2
0.3
0.4
0.5
0.6
0.7
Youngstown:
Mahoning County
Ohio
Figure 10. Estimates of Household Wealth in Youngstown, Mahoning County, and Ohio, 2015
Source: Data from Assets and Opportunity Scorecard, Census Bureau, 2015
Comparative Household Assets: Unbanked, Below Banked, Asset Poverty, and Liquid Poverty Analysis in Trumbull County, Warren and Ohio, 2015
A comparative household wealth assessment in connection with Asset Poverty, Liquid Assets, and Unbanked and Below
banked issues was conducted for Trumbull, Warren, and Ohio with the results as shown in Table 9 below.
Table 9Percentage Comparative Household Wealth in Trumbull, Warren and Ohio, 2015
Urban League, Mahoning Valley Page 22

Place Asset Poverty Liquid Asset Poverty Unbanked Below Banked
Warren 37% 57% 14% 20%
Trumbull 20% 41% 7% 17%
Ohio 24% 45% 7% 20%
Source: Assets and Opportunity Scorecard, Census Bureau, 2015
Asset Poverty: In Trumbull County, 20 % of households experienced asset poverty in 2015, compared to 37% in Warren, and
24% in the state of Ohio, as shown in Table 9 above.
Liquid Asset Poverty: In the City of Warren, 57% of households experienced liquid asset poverty, compared to 41% in the
county, and 45% in the state of Ohio.
Unbanked: In Trumbull County, 7% of households were considered unbanked, compared to 14% in Warren, and 7% in the
state of Ohio.
Below banked/Underbanked: In Warren, 20% of households were considered below banked/underbanked, compared to
about 17% in the county, and 20% in Ohio, as illustrated in Figure 11 below.
Urban League, Mahoning Valley Page 23

Warren Trumbull County
Ohio0%
10%
20%
30%
40%
50%
60%
Asset PovertyLiquid AssetUnbanked
Figure 11. Estimates of Household Wealth in Warren, Trumbull County, and Ohio, 2015Source: Data from Assets and Opportunity Scorecard, Census Bureau, 2015
Educational Attainment
Though education is viewed as an opportunity equalizer, not everyone has access to a quality education. This is especially true
for those born into poverty, and attends a poorly equipped school system. Quality education allows one to not only secure a good
paying job, but more importantly, it enables individuals to make informed decisions. Between 2009 and 2013, people aged 25 years
and above with less than high school diplomas in Ohio were estimated to be 8.3%, with men at 8.6% and women at 7.9%.
Mahoning County: Percentage of Population age 25 years and above by Race with Less than High School Diploma, 2009-2013
In general, a higher education level leads to a higher income. In Mahoning County, of the people age 25 and above with less
than high school diplomas between 2009 and 2013:
Urban League, Mahoning Valley Page 24

22% were Black/African Americans
66% were White
1% were Asians
None were American Indian and Alaska Natives
11% were Hispanics/Latinos as illustrated in Figure 12 below.
Black or African American
22%
White66%
Asian0%
Hispanic/Latino11%
American Indian & Alaska Native0%
Figure 12. Mahoning County: Percentage of Population age 25 years and above by Race with Less than High School Diploma, 2009-2013
Source: Data from American Community Survey (ACS).
City of Youngstown: Percentage of Population age 25 years and above by race with Less than High School Diploma, 2009-2013
The City of Youngstown was analyzed for population with less than a high school diploma. The study found that between
2009 and 2013:
Urban League, Mahoning Valley Page 25
42% were Black/African Americans
41% were White
16% were Hispanic/Latinos
0% were Asians
1% were American Indians and Alaska Natives as illustrated in Figure 13 below.
Black/African Americans
42%
White41%
Asian0%
Hispanic/Latino16%
American Indian & Alaska Native1%
Figure 13. City of Youngstown: Percentage of Population age 25 years andabove by race with Less than High School Diploma, 2009-2013
Source: Data from American Community Survey (ACS)
Trumbull County: Percentage of population age 25 and above by Race with less than High School Diploma, 2009-2013
When Trumbull County was assessed for the percentage of the population age 25 and above with less than high school
diplomas between 2009 and 2013:
Urban League, Mahoning Valley Page 26

9% were Black/African Americans
88% were White
2% were Hispanic/Latinos
1% were Asians
None were American Indian or Alaska Natives as illustrated in Figure 14 below.
SIDE BAR:
By comparison, there were a higher percentage of White residents in Trumbull County with less than high school diplomas (88%) than
in Mahoning County (66%) between 2009 and 2013.
Black/African American9%
White88%
Asian1%
Spanish/Latino2%
American Indian & Alaska Na-tives0%
Figure 14. Trumbull County: Percentage of Population age 25 years and aboveby Race with less than High School Diploma, 2009-2013Source: Data from American Community Survey (ACS).
Urban League, Mahoning Valley Page 27

City of Warren: Percentage of Population age 25 years and above by Race with Less than High School Diploma, 2009-2013
In the City of Warren, analysis of population age 25 years and above by race with less than high school diplomas was carried
out from 2009 to 2013 with the following results:
53% were Black/African American residents
45% were White residents
2% were Hispanic/Latino residents
None were American Indian or Alaska Native residents
None were Asian residents as illustrated in Figure 15 below.
Black/American53%
White45%
Hispanic2%
Urban League, Mahoning Valley Page 28

Figure 15. City of Warren: Percentage of Population age 25 years and above by Race with less than High School Diploma, 2009-2013
Source: Data from American Community Survey (ACS).
Percentage of Housing Occupancy in Mahoning and Trumbull Counties, 2014
It was found that 88% of Mahoning County were occupied, compared to 90% in Trumbull County as shown in Figure 16
below.
Urban League, Mahoning Valley Page 29

Mahoning County
Trumbull County
0.87
0.875
0.88
0.885
0.89
0.895
0.9
0.905
0.88
0.9
Figure 16. Percentage of Housing Unit Occupancy in Mahoning And Trumbull Counties, 2014
Source: Data from Ohio County Profiles (Prepared by the Office of Research)
Mahoning County: Percentage of Homeownership by Race, 2009-2013
Homeownership in Mahoning County was assessed by race from 2009-2013 with the following results:
10% were Black/African American residents
Urban League, Mahoning Valley Page 30

87% were White residents
1% were Asian residents
2% were Hispanic/Latino residents
No American Indian or Alaska Native residents were home owners as illustrated in Figure 17 below.
Black/ African American
White Asian Hispanic/latino Amer. Ind.& Alas. Native
0
0.1
0.2
0.3
0.4
0.5
0.6
0.7
0.8
0.9
1
10%
87%
1% 2% 0%
Figure 17. Mahoning County: Percentage of Homeownership by Race, 2009-2013
Source: U.S Census Bureau, 2009-2013 American Community Survey
Mahoning County: Percentage of Renter-Occupied Housing by Race, 2009-2013
Renter-occupied housing by race in Mahoning County was assessed between 2009 and 2013 with the following results:
26.8% were Black/African American residents
66% were White residents
Urban League, Mahoning Valley Page 31

2% were Asian residents
5% were Hispanic/Latino residents
.2% were American Indians and Alaska Native residents as illustrated in Figure 18 below.
Black /African American
26.8%
White66%
Asian2%
Hispanic or Latino5%
American Indian & Alaska Native .2%
Figure 18. Mahoning County: Percentage of Renter-Occupied Housing by Race, 2009-2013
Source: U.S Census Bureau, 2009-2013 American Community Survey
Trumbull County: Percentage of Homeownership by Race, 2009-2013
An assessment of the percentage of home ownership by race in Trumbull County was conducted between 2009 and 2013
with the following results
4.9% were Black/African American residents
Urban League, Mahoning Valley Page 32

94% were White residents
1% were Hispanic/Latino residents
No home owners in Trumbull County were Asian residents
.1% home owners in Trumbull County were American Indian or Alaskan residents as illustrated in Figure 19 below
African Amer-ican
White Asian Hispanic/Latino
Amer.Ind. & Alas. Native
00.10.20.30.40.50.60.70.80.9
1
4.9%
94%
1% 0%
Figure 19. Trumbull County: Percentage of Homeownership
Urban League, Mahoning Valley Page 33

by Race, 2009-2013Source: U.S Census Bureau, 2009-2013 American Community Survey
Trumbull County: Renter-Occupied Housing by Race, 2009-2013.
Figure 20 shows renter-occupied housing in Trumbull County between 2009 and 2013 as follows:
18% were Black/African American residents
80% were White residents
1% were Asians residents
1% were Hispanic/Latino residents
0% were American Indian or Alaska Natives.
Urban League, Mahoning Valley Page 34

Black/ African American
White Asian Hispanic or Latinos
American Indian & Alaska Natives
18%
80%
1% 1% 0%
Figure 20. Trumbull County: Percentage of Renter-Occupied Housing by Race, 2009-2013Source: Data from American Community Survey
Labor Force
Urban League, Mahoning Valley Page 35

The Civilian Labor Force is defined by the U.S Bureau of Labor Statistics as “a subset of population who has jobs or is
seeking a job, are at least 16 years old, are not serving in the military and are not institutionalized.” In this study, the emphasis is on
the unemployment rate among the races in the Mahoning and Trumbull Counties.
Mahoning County: Unemployment Rate by Race, 2010-2014
Between 2010 and 2014, the American Community Survey estimated that:
25% of Black/African American population were unemployed
8% of White population were unemployed
11% of Asian population were unemployed
15% of Hispanics/Latino population were unemployed
36% of American Indian and Alaska Native populations were unemployed as illustrated in Figure 21 below.
Urban League, Mahoning Valley Page 36

B/African Am...
WhiteAsia
n
Hispani
c/ La...
American
India
n ...
0
0.05
0.1
0.15
0.2
0.25
0.3
0.35
0.25
0.080.11
0.15
36%
Figure 21. Mahoning County: Unemployment Rate by Race, 2010-2014
Source: Data from American Community Survey
Urban League, Mahoning Valley Page 37

Youngstown: Unemployment Rate by Race, 2010-2014
Figure 22 depicts unemployment rate in the City of Youngstown between 2010 and 2014 as follows:
28% of Black/African American population were unemployed
11% of White population were unemployed
29% of Asian population were unemployed
21% of Hispanic/Latino population were unemployed
70% of American Indian and Alaska Native populations were unemployed.
Black
/Afr
ica.
..
Whi
te
Asian
Hisp
anic
/La.
..
Amer
ican
Indi
an...
0.00%
10.00%
20.00%
30.00%
40.00%
50.00%
60.00%
70.00%
80.00%
28%
11%
29%
21
70%
Figure 22. Youngstown: Unemployment Rate by Race, 2010-2014
Source: Data from American Community Survey
Urban League, Mahoning Valley Page 38

Trumbull County: Unemployment Rate by Race, 2010-2014
The American Community Survey between 2010 and 2014 estimated that in Trumbull County
11% of Black/African American population were unemployed
8% of White population were unemployed
14% of Asian population were unemployed
13% of Hispanic/Latino population were unemployed
6% of American Indian and Alaska Native populations were unemployed as illustrated in Figure 23 below.
B/African American
White Asian Hispanic/Latino
Amer. Indian & Alaska Native
0
0.02
0.04
0.06
0.08
0.1
0.12
0.14
0.16
11%
8%
0.140.13
0.06
Figure 23. Trumbull County: Unemployment Rate by Race, 2010-2014Source: Data from American Community Survey
Urban League, Mahoning Valley Page 39
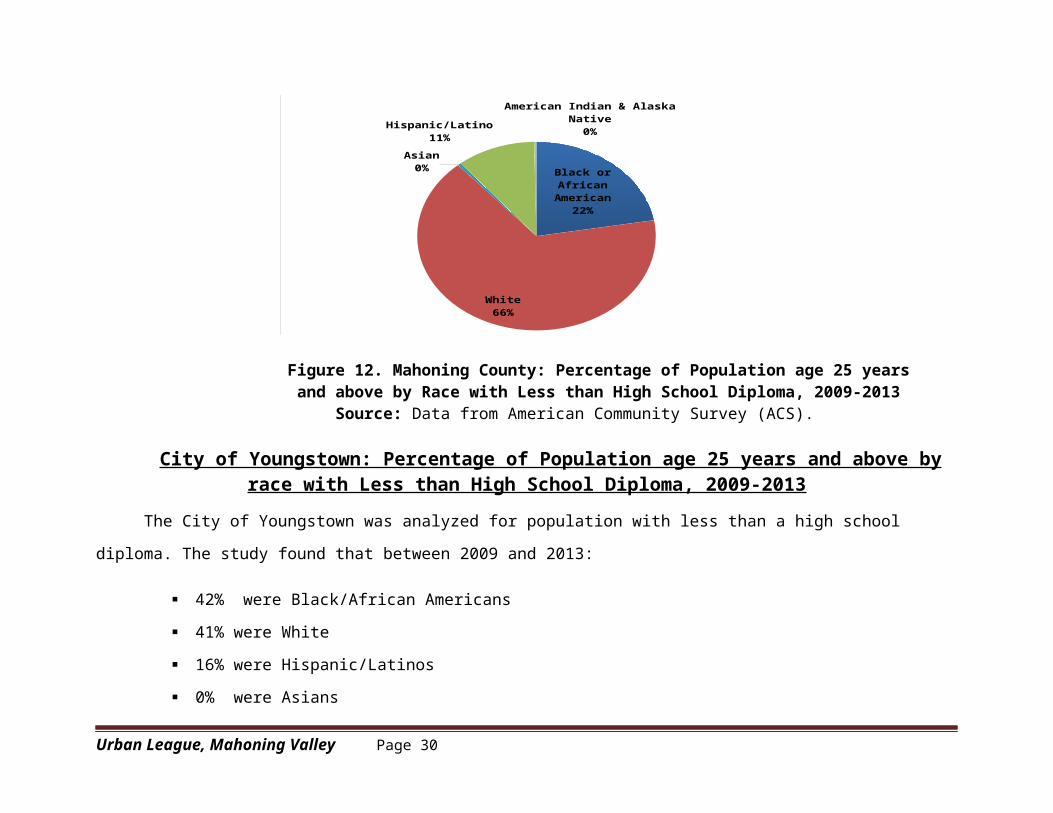
City of Warren: Unemployment Rate by Race, 2010-2014In the City of Warren, the American Community Survey (ACS) estimated that between 2010 and 2014
14.5% of the Black/African American population were unemployed
10.7% of the White population were unemployed
No Asian was unemployed
11.8% of the Hispanic/Latino population were unemployed
No American Indian or Alaska Native resident was unemployed as illustrated in Figure 24 below.
Black/African American
White Asian Hispanic/Latino American Indian &Alaska Native
14.5%
10.7%
0.00%
11.8%
0.00%
Figure 24. City of Warren: Unemployment rate among the races, 2010-2014
Source: Data from American Community Survey
Urban League, Mahoning Valley Page 40

Mahoning County: Assessing Household Income by Race, 2006-2010
In Mahoning County, household income was assessed by race between 2006 and 2010.
For the Lowest Income bracket of ($1-$14,999):
3,765 of the Black/African American households were identified
24,355 of the White households were identified
180 of the Asian households were identified
755 of the Hispanic/Latino households were identified
80 of the American Indian and Alaska Native households were identified as shown in Table 10.
For the Highest Income bracket of ($125,000+):
65 of the Black/African American households were identified
2,150 White households were identified
90 of the Asian households were identified
No data was available for the Hispanic/Latino households
No data was available for the American Indian and Alaska Native households as shown in Table 10 below.
Urban League, Mahoning Valley Page 41

Table 10
Mahoning County: Assessing Household Income by Race, 2006-2010
Race $1-
14,999
$25,000-
$34,999
$35,000-
$49,999
$50,000-
$74,999
$75,000-
$99,999
$100,999-
125,999
$125,000+
Black/African
American
3,765 1520 985 830 125 70 65
White 24,355 12,955 15,580 13,165 2,930 1,410 2,150
Asian 180 25 130 15 10 15 90
Hispanic/Latino
755 355 180 165 35 35 0
American Indian/Alaska
Native
80 30 75 15 20 0 0
Source: Data from American Community Survey
Trumbull County: Assessing Household Income by Race, 2006-2010
In Trumbull County, household income assessment by race was conducted between 2006 and 2010.
For the Lowest Income bracket of ($1-$14,999):
1,985 of the Black/African American households were identified
18,480 of the White households were identified
130 of the Asian households were identified
245 of the Hispanic/Latino households were identified
Urban League, Mahoning Valley Page 42

15 of the American Indian and Alaska Native households were identified as shown in Table 11 below.
For the Highest Income bracket of ($125,000+):
15 of the Black/African American households were identified
1,415 of the White households were identified
30 of the Asian households were identified
30 of the Hispanic/Latino households were identified
No data was available for the American Indian and Alaska Native households as shown in Table 11.
Table 11
Trumbull County: Assessing Household Income by Race, 2006-2010Race $1-
14,999
$25,000-
$34,999
$35,000-
$49,999
$50,000-
$74,999
$75,000-
$99,999
$100,999
-125,999
$125,000
+
Black/African American
1,985 1,085 710 740 220 90 15
White 18,480 10,475 11,895 11,200 3,985 1,225 1,415
Asian 130 40 20 15 110 25 30
Hispanic/Latino
245 200 135 80 30 30 30
American Indian/Alaska
Native
15 30 10 25 0 0 0
Source: Data from American Community Survey
Mahoning County: Percentage Assessment of Business Ownership by Race, 2012
Urban League, Mahoning Valley Page 43

As a source of income generation and self-sufficiency, this study conducted an assessment of business ownership in Mahoning
County. In 2012, this study found that:
11% were owned by Black/African American residents
84% were owned by White residents
2% were owned by Asian residents
3% were by Hispanic/Latino residents
No business/firm was owned by American Indian and Alaska Native residents as illustrated in Figure 25 below.
Urban League, Mahoning Valley Page 44

Black/ African American11%
White84%
Asian2%
Amarican Indian & Alaska Native0%
Hispanic/ Latino3%
Figure 25. Percentage of firm ownership by Race in Mahoning County, 2012
Source: American Community Survey: Statistics for all U.S. firms by Industry,Gender, Ethnicity and Race, 2012.
City of Youngstown: Percentage of Business Ownership by Race, 2012 In the City of Youngstown in 2012, the percentage of business ownership by race was distributed as follows:
27% were owned by Black/African American residents
38% were owned by White residents
1% were owned by Asian residents
Urban League, Mahoning Valley Page 45

3% were owned by Hispanic/Latino residents
None of the businesses in Youngstown was owned by American Indian or Alaska Native residents
31% were owned by All Minorities (includes women of all races) as illustrated in Figure 26 below.
Black/ African American
27%
White38%Asian
1%
Amarican Indian & Alaska Native
0%
Hispanic/ Latino3%
All Minority firms31%
Figure 26. Percentage Assessment of Firm Ownership by Race in Youngstown, 2012
Source: Data from American Community Survey: Statistics for all U.S. firms by Industry, Gender, Ethnicity and Race, 2012.
Trumbull County: Percentage Assessment of Business Ownership by Race, 2012
When Trumbull County was assessed for the percentage of business ownership by race, it was found that:
5% were owned by Black/African American residents
Urban League, Mahoning Valley Page 46

89% were owned by White residents
2% were owned by Asian residents
1% were owned by Hispanic/Latino residents
1% were owned by American Indian and Alaska Natives residents.
B/African American
White Asian Hispanic/Latino
A.Indian and Alas.
Native
0.05
0.89
0.02 0.01 0.01
Figure 27. Trumbull County: Percentage of Business Ownership by Race, 2012
Source: American Community Survey: Statistics for all U.S. firms by Industry,Gender, Ethnicity and Race, 2012.
Urban League, Mahoning Valley Page 47
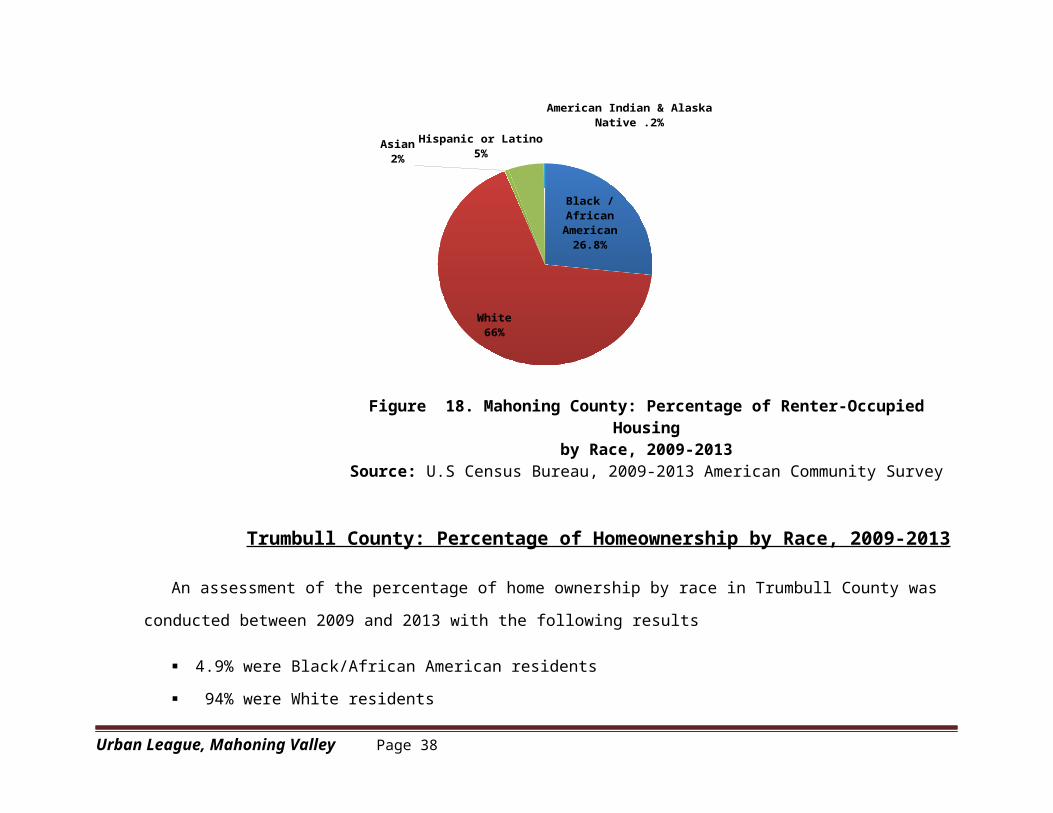
City of Warren: Percentage of Business Ownership by Race, 2012In assessing the City of Warren for business ownership by race in 2012, it was found that:
13% were owned by Black/African American residents
64% were owned by White residents
3% were by Asian residents
1% were owned by Hispanic/Latino residents
1% were owned by American Indian and Alaska Native residents, and
18% were owned by All Minorities (includes women of all races) as shown in Figure 27 below
Black/ African Amer-ican14%
White64%
Asian3%
American Indian & Alaska Native 1%
Hispanic/ Latino1%
AllMinority firms
18%
Figure 28. Comparative Assessment of Firm Ownership in Warren, 2012
Source: Data from American Community Survey (Statistics for all U.S. firms byIndustry, Gender, ethnicity and Race, 2012.
Urban League, Mahoning Valley Page 48

Crime IndexMahoning County: Black and White Crime Index, 2009-2014
This section of the study analyzes only Black vs. White crime percentages in the Mahoning County between 2009 and 2014
since the Ohio Department of Public Safety (ODPS), reports on these two races. Figure 28 depicts that:
31% of crimes committed were by Black/African American criminals
69 %. of crimes committed were by White American criminals.
Black White0%
10%
20%
30%
40%
50%
60%
70%
80%
31%
69%
Figure 29. Mahoning County: Black and White Crime Index, 2009-2014
Source: Data from Ohio Department of Public Safety (ODPS) 2009-2014
Urban League, Mahoning Valley Page 49

Crime Index by Race in Youngstown, 2009-2014Crime index was assessed for the City of Youngstown between 2009 and 2014. It was found that
83% were committed by Black/African American criminals
17% of crimes were by White criminals as illustrated in Figure 29 below.
Black White0%
10%
20%
30%
40%
50%
60%
70%
80%
90%83%
17%
Figure 30: Crime Index: Youngstown--Black Vs. White, 2009-2014
Source: Data from Ohio Department of Public Safety (ODPS) 2009-2014
Urban League, Mahoning Valley Page 50

Crime Index: Trumbull County Black vs White, 2009-2014
Between 2009 and 2014 in Trumbull County:
25% of crimes committed were by Black/African American criminals
75% of crimes committed were by White criminals as illustrated in Figure 30 below.
Black White 0%
10%
20%
30%
40%
50%
60%
70%
80%
25%
75%
Figure 31. Trumbull County: Percentage of Black vs White Crime Index,2009-2014
Source: Data from Ohio Department of Public Safety (ODPS) 2009-2014
Urban League, Mahoning Valley Page 51

City of Warren: Crime Index by Race, 2009-2014
In the City of Warren, between 2009 and 2014:
66% of the crimes were committed by Black/African American criminals
34% of the crimes were committed by White criminals as illustrated in Figure 31below.
Black White0%
10%
20%
30%
40%
50%
60%
70% 66%
34%
Figure 32. City of Warren: Crime Index by Race, 2009-2014
Source: Data from Ohio Department of Public Safety (ODPS) 2009-2014.
SIDE BAR:
Between 2009 and 2014, crimes committed at the county levels (Mahoning and Trumbull) were committed by White criminals.
Also, between 2009 and 2014, crimes committed at the city levels (Youngstown and Warren) were committed by Black criminals.
Urban League, Mahoning Valley Page 52

Mahoning County: Percentage of Population age 18 years and below by Race without Healthcare Insurance coverage, 2010-2014
This study analyzes healthcare coverage for people age 18years and below by race between 2010 and 2014 in the Mahoning
County. It was found that:
2% of Black/African American residents had no health care insurance
4% of White residents had no health care insurance
34% of Asian residents had no health care insurance
2% of Hispanic/Latino residents had no health care insurance
American Indian or Alaska Native populations had no health care insurance coverage as illustrated in Figure 32
below.
Urban League, Mahoning Valley Page 53

Black/ African
American
White Asian Hispanic/Latino
Amer. Ind & Alas. Native
0
0.05
0.1
0.15
0.2
0.25
0.3
0.35
0.4
2%4%
34%
2%0%
Figure 33. Mahoning County: Percentage of Population age 18 yearsand below by race without Healthcare coverage, 2010-2014
Source: Data from the American Community Survey, 2010-2014.
City of Youngstown: Percentage of Population age 18 years and below by Race, without Healthcare Insurance coverage, 2010-2014.
In the City of Youngstown, residents age 18 years and below were assessed for health care insurance coverage with
these results:
2% of Black/African American residents had no healthcare insurance
3% of White residents had no healthcare insurance
Urban League, Mahoning Valley Page 54

2% of Hispanic/Latino residents had no healthcare insurance
No data was available for Asian residents
No data was available for American Indian and Alaska Native residents related to healthcare insurance coverage as
illustrated in Figure 33 below.
Black/African American
White Asian Hispanic/Latino Amer. Indian & Alaska Native
0
0.005
0.01
0.015
0.02
0.025
0.03
0.035
2%
3%
0%
2%
0%
Figure 34. Youngstown: Percentage of Population age 18 years and below by Race with without Healthcare Insurance coverage, 2010-14
Source: Data from American Community Survey, 2014-2014
Mahoning County: Percentage of Population age 18-64 years old by Race without Healthcare Insurance, 2010-2014
In Mahoning County, the population between ages 18 and 64 were analyzed for healthcare insurance coverage from
2010 to 2014. It was found that:
23% of Black/African American residents had no healthcare insurance coverage
14% of White residents had no healthcare insurance coverage
23% of Asian residents had no healthcare insurance coverage
Urban League, Mahoning Valley Page 55
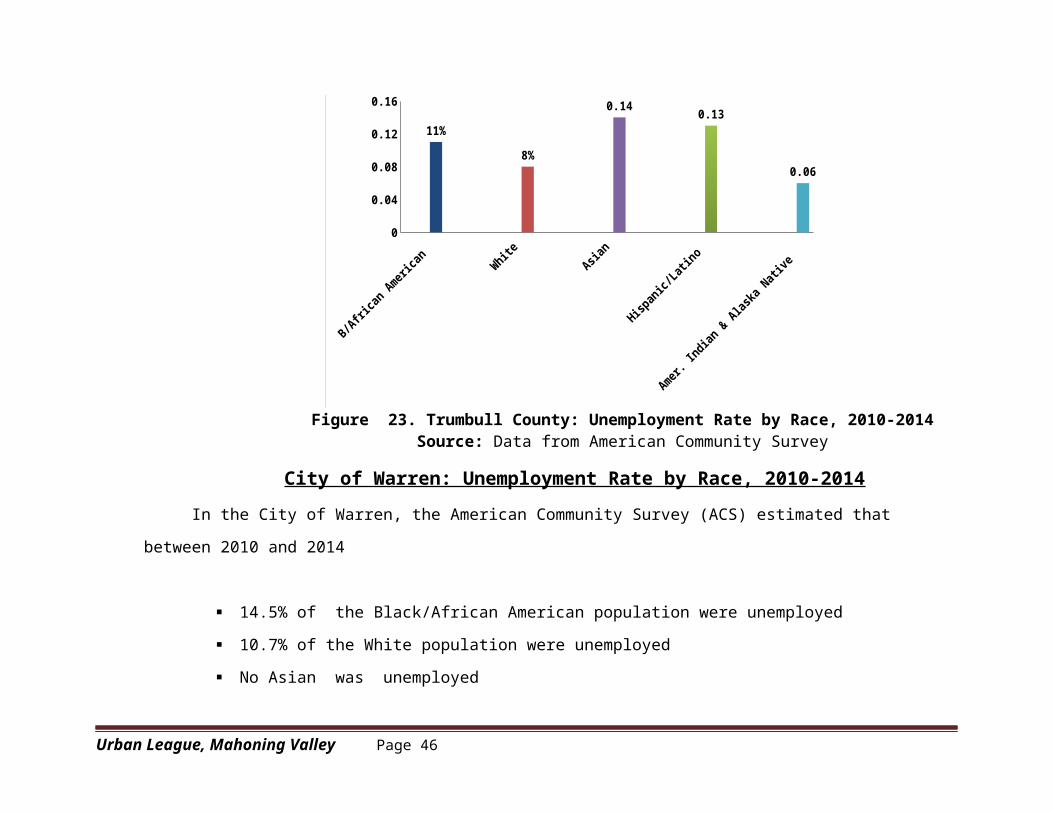
22% of Hispanic/Latino residents had no healthcare insurance coverage
34% of American Indians and Alaska Native residents had no healthcare insurance coverage as illustrated in Figure 34
below.
Black/African American
White Asian Hispanic/Latino
Amer. Indian & Alas. Native
0
0.05
0.1
0.15
0.2
0.25
0.3
0.35
0.4
23%
14%
23% 22%
34%
Figure 35. Mahoning County: Percentage of Population age 18-64 years old by Racewithout Healthcare Insurance, 2010-2014
Source: Data from American Community Survey, 2014-2014
Youngstown: Percentage of Population age 18-64 years old by Race without Healthcare Insurance, 2010-2014
In Youngstown, Figure 35 illustrates the percent of population age 18-64 years old without healthcare insurance coverage
between 2010 and 2014 as follows:.
25% of Black/African American residents
21% of White residents
Urban League, Mahoning Valley Page 56

28% of Asian residents
18% of Hispanic/Latino residents
57% of American Indian and Alaska Native residents
Black/African American
White Asian Hispanic/Latino Amer. Indian & Alas. Native
0
0.1
0.2
0.3
0.4
0.5
0.6
25%21%
28%
18%
57%
Figure 36. Youngstown: Percentage of Population age 18-64 years old byRace without Healthcare Insurance, 2010-2014
Source: Data from American Community Survey, 2010-2014.
Urban League, Mahoning Valley Page 57
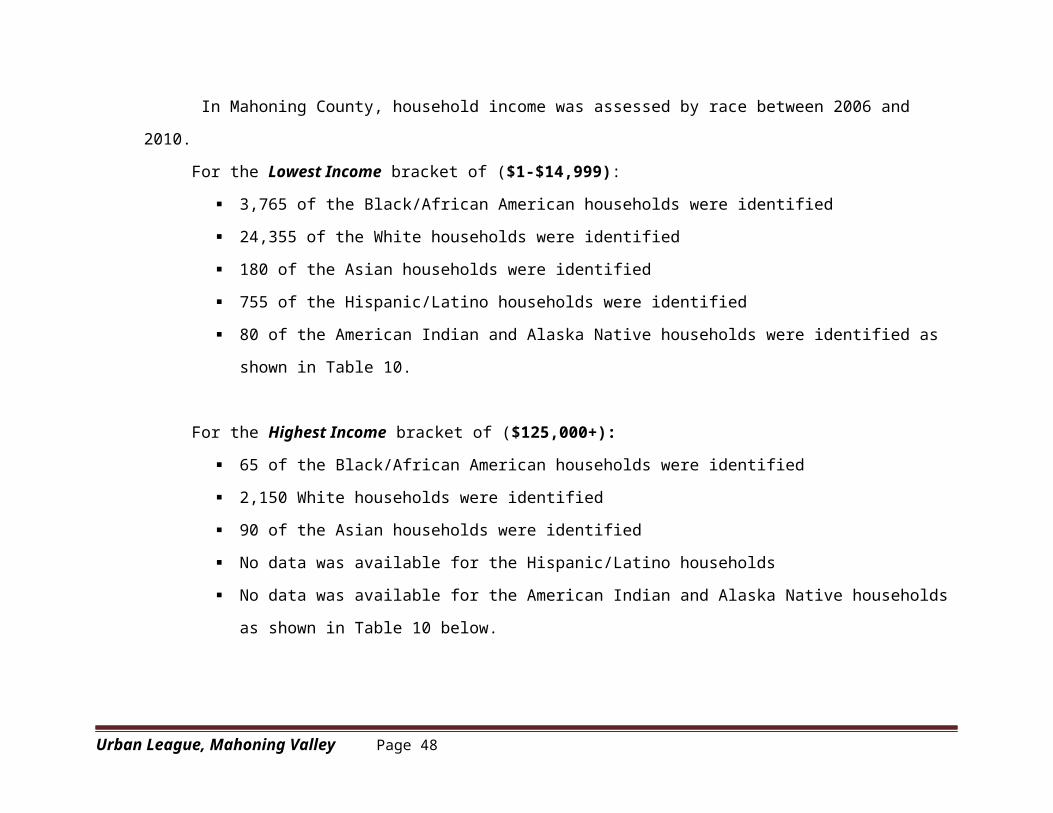
Trumbull County: Percentage of Residents age 18 years and below without Healthcare Insurance Coverage, 2010-2014
Trumbull County was assessed for residents age 18 and below without healthcare insurance between 2010 and 2014 with these results:
4% of Black/African Americans residents had no healthcare insurance coverage
7% of White residents had no healthcare insurance coverage
33% of Asian residents had no healthcare insurance coverage
5% of Hispanic/Latino residents had no healthcare insurance coverage
No healthcare insurance coverage data was available for American Indian and Alaska Native residents as illustrated in
Figure 36 below.
.
Black/ African American
White Asian Hispanic/Latino
Amer. Indian & Alas. Native
0
0.05
0.1
0.15
0.2
0.25
0.3
0.35
4%
7%
33%
5%
0%
Figure 37. Trumbull County: Percentage of Residents age 18 years and below by Racewithout Healthcare Insurance, 2010-2014
Source: Data from American Community Survey, 2010-2014
Urban League, Mahoning Valley Page 58

City of Warren: Percentage of Population age 18 years and below by Race without Healthcare Insurance, 2010-14
For the City of Warren, population age 18 and below was assessed for healthcare insurance coverage between 2010 and 2014.
Based on American Community Survey,
29% of Black/African American residents had no healthcare insurance coverage
54% of White residents had no healthcare insurance coverage
All Asian residents had healthcare insurance coverage
17% of Hispanic/Latino residents had no healthcare insurance coverage
All American Indian and Alaska Native residents had healthcare insurance, as illustrated in Figure 37 below.
B/African Amer-ican
White Asian Hispanic/Latino Amer. Indian. & Alas. Native
0
0.1
0.2
0.3
0.4
0.5
0.6
29%
54%
0%
17%
0%
Figure 38. City of Warren: Percentage of Population age 18 years and below by Racewithout Healthcare Insurance, 2010-14
Source: Data from American Community Survey, 2010-2014
Urban League, Mahoning Valley Page 59

Trumbull County: Population 18-64 Years of Age by Race without Healthcare Insurance, 2010-2014
For the cohort 18-64 years old in Trumbull County between 2010 and 2014, the study showed that:
22% of Black/African Americans residents had no healthcare insurance coverage
18% of White residents had no healthcare insurance coverage
29% of Asians had no healthcare insurance coverage
20% Hispanic/Latino residents had no healthcare insurance coverage
11% American Indian and Alaska Native residents had no healthcare insurance coverage as shown in Figure 38.
Black/ African American
White Asian Hispanic/Latino Amer. Indian & Alas. Native
0
0.05
0.1
0.15
0.2
0.25
0.3
0.35
22%
18%
29%
22%
11%
Figure 39. Trumbull County: Population 18-64 years of age by Race withoutHealthcare Insurance, 2010-2014
Source: Data from American Community Survey, 2010-2014.
Urban League, Mahoning Valley Page 60
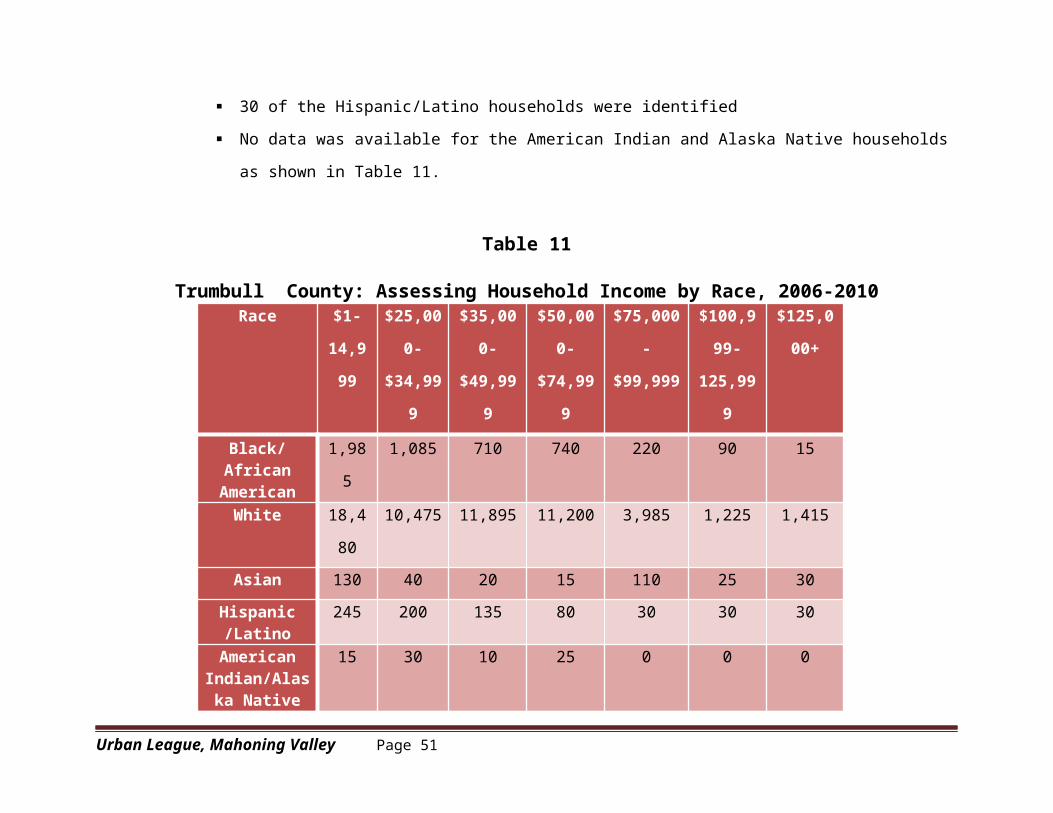
City of Warren: Percentage Population 18-64 Years old by Race with no Healthcare Insurance Coverage, 2010-2014
An assessment of Warren population cohort aged 18-64 years old was below taken to find out the percentage without
healthcare insurance coverage between 2010 and 2014. The analysis showed that:
30% Black/African American residents had no healthcare insurance coverage
64% White residents had no healthcare insurance coverage
2% Asian residents had no healthcare insurance coverage
4% Hispanic/Latinos had no healthcare insurance coverage
American Indian and Alaska Natives had healthcare insurance coverage as illustrated in Figure 39.
B/African American
White Asian Hispanic/Latino
Amer. Indian & Alas. Native
0
0.1
0.2
0.3
0.4
0.5
0.6
0.7
30%
64%
2% 4%0%
Figure 40. City of Warren: Percentage Population 18-64 Years old without Health Insurance, 2010-14
Source: Data from American Community Survey, 2010-2014
Urban League, Mahoning Valley Page 61

SUMMARY AND CONCLUSIONS
This study sought to use economic mobility along with social justice, to assess how Black/African American residents in the
Mahoning Valley compared to other racial groups, as a basis for evaluating the so-called Equality Index. Accordingly, this study used
such variables as Median Household Income, Income below poverty level, Households on Public Assistance/Food Stamps/SNAP,
(Household Assets, Income Poverty, Asset Poverty and Liquid Poverty: County and city level comparison only), Educational
attainments with respect to Population with less than High School Diplomas; Household Income; Home ownership and Affordable
Housing Problems, Labor Force with reference to unemployment rates; Business Ownership; Crime Index, and finally Healthcare
Insurance coverage.
Both Mahoning and Trumbull Counties, and where appropriate, their central cities, were included in the discussions to show
comparative performances of individual racial groups or the lack thereof. We found that in nearly all measurements, the
Black/African American residents in both county and city levels were economically outperformed by other racial groups.
Median Household Income
In 2014, Mahoning County’s median household income was $41,058, the City of Youngstown’s median household income
was $24,012, and Ohio’s median household income was $48,308. Black/African American residents had the lowest median
household income ($20,095), while Asian residents’ ($53,301) was the highest.
In Trumbull County, the median household income was $42,880, while the City of Warren had $27,612. The Black/African
American median household income ($24,954) while being higher than that of Youngstown ($20,095), was outperformed by both
Asian ($49,137) and White ($44, 991) residents.
Urban League, Mahoning Valley Page 62

Income below the Poverty Level, 2009 -2013
In Mahoning County, at 29%, Black/African American residents were the highest percentage of people with income below the
poverty level. By comparison, 27% of the Hispanic population, 22% of the American Indian/Alaska Native population, 13% of the
Asian population, and 9% of the White population had household income below the poverty level.
In the City of Youngstown, at 75%, Black/African American residents were the highest percentage of people with incomes
below the poverty level. 7% of the Hispanic/Latino population, 1% of the Asian population, and 17% of the White population had
household income below the poverty level.
In Trumbull County, at 33%, Black/African American residents were the highest percentage of people with income below the
poverty level. Also, 12% of the Hispanic population, 21% of the American Indian/Alaska Native population, 22% of the Asian
population, and 12% of the White population, had household income below the poverty level. Also, Black/African American
residents in Trumbull County were 4% more in the percentage of people below the poverty level than in Mahoning County.
In the City of Warren, at 54%, White residents had the highest percentage of people with income below the poverty level.
Also, 42% of Black/African American residents, 4% of the Hispanic/Latinos residents, 0% of the Asian population, and 0% of the
American Indian and Alaska Native population had household income below the poverty level.
Households on Public Assistance/Food Stamps/SNAP, 2009-2013
In Mahoning County, 54% of its residents were on public assistance. In the City of Youngstown, 27% of Black/African
American residents, 14% of White residents, 1% of Asian residents, 35% of Hispanic/Latino residents, and 23% of American Indians
and Alaska Native residents received Public Assistance.
In Trumbull County, 46% of its residents were on Public Assistance. In the City of Warren, at 56%, White residents were the
highest percentage of people on Public Assistance. There were 40% of the Black/African American residents, 3% of the
Urban League, Mahoning Valley Page 63

Hispanic/Latino residents, 0% of the Asian residents, and 1% of the American Indian and Alaska Native residents that received some
types of aid from the government.
Educational Attainment, 2009-2013
An assessment of educational attainment in Mahoning County, found that 22% of Black/African American residents age 25
years and above, 11% of the Hispanic/Latino residents, 1% of the Asian residents, 0% of the American Indian and Alaska Native
residents, and 66% of the White residents had less than a high school diploma.
In the City of Youngstown, the percentage of the population with less than high school diploma was nearly equal between the
Black/African American (42%) and the White (41%) residents. Next, were the Hispanic/Latino (16%) residents with less than high
school diploma, followed by the Asian (0%) residents, and the American Indian and Alaska Native (1%) residents had less than high
school diploma.
In Trumbull County, 88% of White residents age 25 years and above, had less than a high school diploma, compared to 9% of
Black/African American residents, 1% of Asian residents, 2% of the Hispanic/Latino residents, and 0% of American Indian and
Alaska Native residents.
In the City of Warren, 53% of Black/African American residents, 45% of White residents, and 2% of Hispanic/Latino residents
had less than high school diploma compared to 0% of Asian residents or American Indian and Alaska Native resident.
Housing, 2009-2013
Home ownership is a measure of one’s economic achievement. Hence, the percentage of home ownership of members of these
racial groups was a measure of their economic well-being. In Mahoning County, it was found that 10% of Black/African American
residents were home owners, compared to about 87% of White residents. For the Asian residents in the county, about 1% owned their
homes, while 2% of the Hispanic/Latino residents and 0% of the American Indian and Alaska Native residents owned their homes.
This study also found that 27% of Black/African American residents and 66% of White residents rented their living space. For the
Urban League, Mahoning Valley Page 64

Asian community, 1% rented, while 5% of the Hispanic/Latino residents and .2% of the American Indian and Alaska Native residents
did the same.
In Trumbull County, 5% of Black/African American residents owned their homes, while 94% White residents also owned their
homes. While 1% of the Hispanic/Latino residents owned their homes, no Asian residents and American Indian and Alaska Native
owned their place of residence. The renter-occupied housing in the county included 18% of Black/African American residents; 80% of
Whites residents; 1% of Asian residents; 1% of Hispanic/Latino residents; and 0% of American Indian and Alaska Native residents.
Labor Force
Unemployment rates at the county and city levels were assessed. From 2010 to 2014, Mahoning County had the following
unemployment rates by race: 25% for Black/African American residents; 8% for White residents; 11% for Asian residents; 15% for
Hispanic/Latino residents; and 31% for American Indian and Alaska Native residents.
In the City of Youngstown, 28% of Black/African Americans were unemployed, followed by 11% of White residents. The
Asian population had 29% unemployment rate, followed by 21% of Hispanic/Latino residents, while American Indian and Alaska
Native residents, had the highest unemployment rate of 70% for the 5-year period analyzed.
In Trumbull County, Black/African American population unemployment rate was 11% between 2010 and 2014, followed by
8% for the White population, and 14% for the Asian residents. The Hispanic/Latino residents experienced 13% unemployment rate,
while the American Indian and Alaska Native residents recorded 6% during the period.
In the City of Warren for the same period, Black/African American unemployment rate was 14.5%, while White residents had
10.7%. Neither the Asian nor the American and Alaska Native residents had any unemployment rates, but the Hispanic/Latino
residents had 11.8%.
Urban League, Mahoning Valley Page 65

Business Ownership
Business assessment’s goal in this study was to see what percentages of businesses in each of the two counties were owned by
which racial group. Accordingly, in Mahoning County, 84% of the businesses assessed in 2012 were owned by White residents,
compared to 11% by Black/African American residents; 2% by Asian residents; 3% by Hispanic/Latino residents; and none by
American Indian and Alaska Native residents.
In Youngstown, 27% of the businesses in the city were owned by Black/African American residents, while 38% were owned
by White residents. The Asian community owned 1% of the businesses, while the Hispanic/Latino residents owned 3%, and the
American Indian and Alaska Native residents owned none of the businesses. Altogether, 31% of all the businesses in the City of
Youngstown were owned by Minorities (which included women of all races).
In Trumbull County, 91% of the businesses were owned by White residents, 5% by the Black/African American residents; 2%
by the Asian residents; 1% by the Hispanic/Latino residents; and 1% by the American Indian and Alaska Native residents.
In the City of Warren, 64% of the businesses were owned by White residents; 13% by Black/African American residents; 3%
by the Asian residents; 1% by the Hispanic/Latino residents; 1% by the American Indian and Alaska Native residents; and 18% by All
Minority groups.
Crime Index, 2009-2014
When the crime index was assessed in Mahoning County, it was found that crime in the county as a whole was predominately
committed by White criminals at 68.5%, while Black/African Americans committed 31.5% of the crime. In the City of Youngstown,
crime was predominately committed by Black/African Americans at 83%, while White criminals committed 17%.
In Trumbull County, White criminals committed 75%, while Black/African American criminals were responsible for 25%. In
Warren, 66% were committed by Black/African American criminals, while 34% were committed by White criminals.
Urban League, Mahoning Valley Page 66

Healthcare Insurance Coverage, 2010-2014
For healthcare insurance coverage for the population age 18 and below in Mahoning County, 2% of Black/African American
residents had no coverage, as were 4% of the White residents; 34% of the Asian residents; and 2% of the Hispanic/Latino residents.
There were no data for American Indian and Alaska Native residents. For this age cohort in Youngstown, 2% of Black/African
American residents had no coverage, as were 3% of the White residents, and 2% of the Hispanic/Latino residents. There were no data
for the Asian and the American Indian and Alaska Native residents.
For the population cohort 18-64 years old in Mahoning County, 23% of Black/African American residents had no healthcare
insurance coverage; as were 14% of the White residents; 23% of the Asian residents; 22% of the Hispanic/Latino residents; and 34%
of the American Indians and Alaska Native residents. In the City of Youngstown for the same cohort, 25% of the Black/African
American residents; 21% of the White residents; 28% of the Asian residents; 18% of the Hispanic/Latino residents; and 57% of
American Indian and Alaska Native residents had no insurance coverage.
In Trumbull County, for the population age 18 and below, 4% of the Black/African American residents had no healthcare
insurance coverage as were 7% of White residents. Also, 33% of the Asian and 5% of the Hispanic/Latino residents had no healthcare
insurance coverage. There were no data for the American Indian and Alaska Native.
In Warren for the same age group, 29% of the Black/African American residents had no healthcare coverage, including 54%
of White residents, and 17% of Hispanic/Latino residents. No data were available for either the Asian or the American Indian and
Alaska Native residents.
For the population cohort 18-64 years old in Trumbull County, 22% of the Black/African American residents; 18% of the
White residents; 29% of the Asian residents; 20% of the Hispanic/Latino residents; and 11% of the American Indian and Alaska
Native residents, had no healthcare coverage between 2010 and 2014.
Urban League, Mahoning Valley Page 67

In the City of Warren for the same cohort, 30% of the Black/African American residents; 64% of the White residents; 2% of
the Asian residents; and 4% of the Hispanic/Latino residents had no healthcare coverage. There were no data for the American Indian
and Alaska Native residents.
Recommendations Based on this study, a significant socio-economic equality gap exists between Black/African American and White residents in
the Mahoning Valley. It would require heavy lifting among all stake holders in the Valley to come up with innovative and strategic
action plans and mandates to narrow the gap and/or change the status quo for the following reasons:
Income Inequality: There is this persistent phenomenon called household income inequality, which the 2006-2010 data showed to be
completely dominated by the White residents per capita.
Household Wealth/Assets: This study found that a significant percentage of Black/African American households in both counties and
cities were characterized as unbanked. In other words, they are households that do not have accounts in insured financial institutions.
These households carry out their financial transactions of daily living in non-banking institutions which are inherently predatory in
nature.
In order to reduce the percentage of unbanked households in the Valley, bank managers in the Mahoning Valley would have
to come up with some affordable threshold amount for opening a checking/saving account in order to lure members of these unbanked
households. This threshold policy change would help those families save on high, and revolving door interest loans charged by
predatory lending institutions. The cumulative savings by these households, would be used for other necessary domestic
equipment/tools that these families would otherwise have borrowed from these predatory lending institutions with high annual
percentage rates (APR) that would take years to pay off.
Unemployment: A one-year unemployment rates (2015-2016) analysis, stratified by race, sex, and age, was published by the
Bureau of Labor Statistics, to show the existence of unemployment rate disparities between Black/African American population and
their White counterparts nationally. It was shown that while Whites’ civilian noninstitutionalized population unemployment rates were
Urban League, Mahoning Valley Page 68

4.5% and 4.4% respectively, Black/African American unemployment rates were double at 9.9% and 8.1%. For White men 20 years
and above, unemployment rates were 3.8% and 4.1% respectively; and for Black/African American age 20 and above, unemployment
rates were 9.1% and 7.6% respectively for the same period. Again, for White women 20 years old and above, unemployment rates
were 4.4% and 3.9% respectively; and for Black/African American women age 20 and above for the same period, unemployment rates
were 8.9% and 7.1% respectively.
Prospectively in the Mahoning Valley, unemployment rate between the two races mimics the national trends. For an example, data
from the American Community Survey (2010- 2014) showed that in Mahoning County, unemployment rate of the Black/African
American population was 25% compared to 8% for their White counterparts. In the City of Youngstown, Black/African American
unemployment was 28% compared to 11 % for the White population.
In Trumbull County, for the same period (2010-2014), when the Black/African American population unemployment rate was
11%, the White population had an unemployment rate of 8%. In the City of Warren, both Black/African American and White
unemployment rates were 14.5% and 10.7% respectively.
Poverty: The high unemployment rates among Black/African Americans mirror the high percentage rate of households below the
poverty level and/or that receiving government assistance. In this circumstance, this study’s viewpoint is that unemployment and
poverty are two sides of the same coin for those impacted.
Educational Attainment: Even when Black/African Americans posted lower percentage of people age 25 years and above without a
high school diploma than their White counterparts, unemployment is still higher among Black/African Americans than among their
White counterparts comparatively.
This study affirms that one solution to high Black /African American resident unemployment in the Valley may lie in giving
children a quality educational foundation in a properly equipped school system from kindergarten up through high school. Students
from such schools must graduate with rudimentary knowledge of English, Mathematics, Arts, and General Science that would enable
Urban League, Mahoning Valley Page 69

them to go to college or learn trades following their high school graduation. Access to a good educational foundation, would enable
them to secure literacy skills that would open doors of opportunities for good paying jobs in which they would contribute to society.
This study’s emphasis on quality educational foundation is supported by the YSU’s JAMBAR editorial publication of October
6, 2016 titled “No Justice No Pease” with the following statement: “The students attending Youngstown City Schools are not
receiving the same quality education as their suburban counterparts in Poland and Canfield.”
The study also concludes that although Black/African American residents in the Mahoning Valley may be competitive with
White residents on very few economic metrics, there is a measurable socio-economic gap and/or disparity in economic achievements
between the two largest races in the Mahoning Valley at nearly all levels of analysis. This gap may be caused by a plethora of reasons
too complicated for this study to even begin to engage into any form of analytics.
However, this study strongly recommends access to quality educational opportunities for the present and future generations of
Black students in the Mahoning Valley, and by extension, to all children in the region through a well-equipped and disciplined school
system if the Valley is to reduce the existing generational socio-economic gap and/or economic disparity between Black/African
American residents and their White counterparts.
Urban League, Mahoning Valley Page 70

References
Fellows, Gabrielle, 2016. The YAMBAR, Youngstown State University, Editorial: “No Justice, No peace,” October 6, 2016.
Urban League, Mahoning Valley Page 71