urban hydrogeology and improved management of contaminated ... · urban hydrogeology and improved...
TRANSCRIPT

Urban hydrogeology and improved management of contaminated
highly productive alluvial aquifers
Joerg Prestor, Brigita Jamnik, Mitja Janža, Nina Mali Geological survey of Slovenia
Final conference MAGPlan
CLEAN GROUNDWATER FOR STUTTGART
„Haus der Wirtschaft“, Stuttgart 3. 7. 2015

City of Ljubljana - vision of development
GREEN WEDGES between
Three of GREEN WEDGES are also groundwater resources
STAR-LIKE settlement

Ljubljansko polje and Barje aquifers
Dolomite Sandstone,… Limestone Clay, silt,… Gravel/sand
Ljubljansko polje is alluvial aquifer, dominantly from sandy gravel sediments.
Ljubljansko Barje is dominantly agricultural.
¾ of Ljubljansko polje aquifer area are urbanized and agricultural.
Groundwater is 4 – 30 m bellow the surface. It is recharged from precipitation and from
Sava river.
Although the atrazine was used more than 20 years ago, we still detected high desethylatrazine conc.
Ljubljansko Barje is confined alluvial aquifer, covered by silty and clayey sediments.
Groundwater is just bellow or even above the surface. It is recharged from precipitation and
deep flows from wider mountainous hinterland built up of limestone and dolomite rocks.

4 10.7.2015
Geological model
Numerical hydrological model
From geostatistical model to numerical hydrogeological model
Gravel and sand Silt clay gravel Silt clay Conglomerate

Typical spatial distribution pattern of hydraulic conductivities (K m/s) in the aquifer
Vertical plane (e.g. in three cross-sections)
Horizontal plane (e.g. 280 m a.s.l.)

High velocities of goundwater flow
TCE pollution in 2004 was detected in VD Hrastje-1a well. In the period 2005-2008 the concentration of TCE decrees and it was on the end of 2008 under 1μg/l (Bračič-Železnik, 2009).
TCE pollution has caused many problems to Ljubljana waterworks. It was indispensable to provide some avdanced tools and to become capable for measures and interventions.
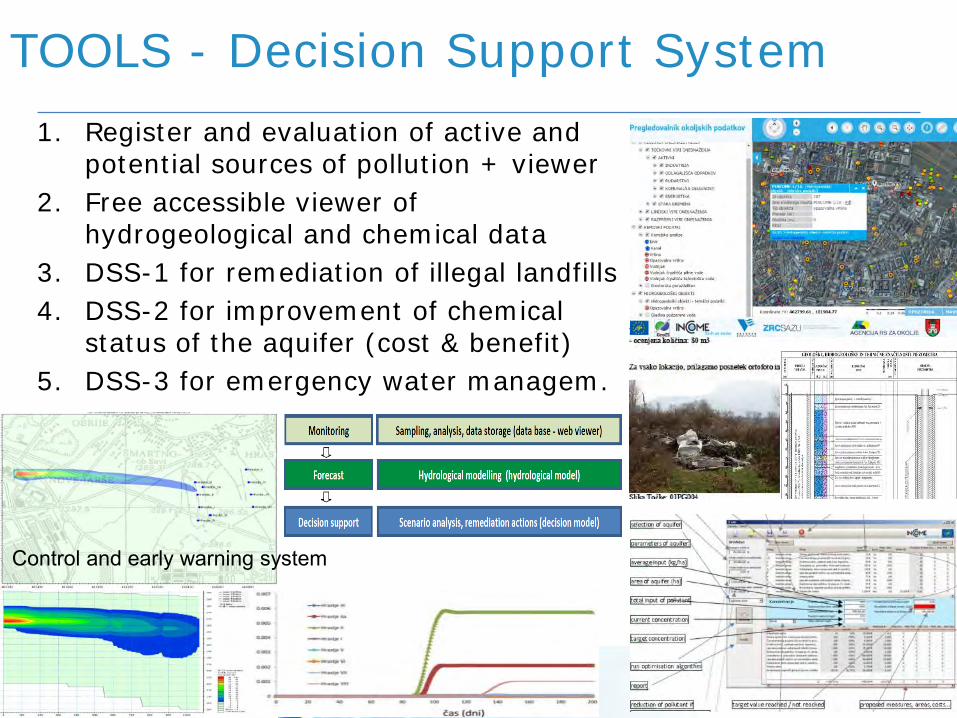
TOOLS - Decision Support System
1. Register and evaluation of active and potential sources of pollution + viewer
2. Free accessible viewer of hydrogeological and chemical data
3. DSS-1 for remediation of illegal landfills
4. DSS-2 for improvement of chemical status of the aquifer (cost & benefit)
5. DSS-3 for emergency water managem.
Control and early warning system

Significant contaminants and their origin Name CAS Origin/use
nitrate - mixed (agriculture/municipal wastewater/industrial)
chromium (VI) - industrial / metal plating tetrachloroethene 127-18-4 industrial / degreasing trichloroethene 79-01-6 industrial / degreasing atrazine 1912-24-9 agricultural / herbicide desethylatrazine 6190-65-4 degradation product of atrazine metazachlor 67129-08-2 agricultural / herbicide dechlorometazachlor* - degradation product of metazachlor 2,6-dichlorobenzamide 2008-58-4 degradation product of pesticide
dichlobenyl carbamazepine 298-46-4 drug /municipal wastewater 2-methyl-2H-
benzotriazole*
16584-00-2 ?
2,4-dimethyl-2H-
benzotriazole*
- ?
*compounds were discovered during period of INCOME project (Auersperger, 2012). .

Pollution of groundwater by urban contaminants
1. The current contamination pattern of the groundwater indicates a diffuse pollution of the aquifer with chlorinated solvents in low concentrations (Schüth et al., 2014).
2. This group of contaminants, they are prone to spread by atmospheric processes and can then be washed out and infiltrated into the subsurface by precipitation (Schüth et al., 2014).
3. Significant and sustained longterm trends are rarely observed for volatile halogenated aliphatic hydrocarbons – LHCH (Kranjc, 2011).
4. The pollution of groundwater by urban contaminants is originating also from the sewage system (Urbanc et al., 2012).

Increasing trends (NaCl)
• 116 monitoring points, (24000 analysis, 81 parameters…).
Mo
nit
ori
ng
po
int
tetr
ach
loro
e
than
e
Al
AO
X
AT
Cu
Ca
Cr
6+
Cr-
filt
.
Fe-
filt
.
flu
ori
de
HC
O3
K
Cl
con
du
ctiv
ity
(20
oC
) co
nd
uct
ivit
y
(25
oC
) K
PK
byK
Mn
O4
ESA
me
taza
chlo
r
Mg
Na N
NO
3-N
o
glj.
ksl
.
Pro
sta
ort
ho
ph
osp
hat
e
pe
stic
ide
s -
tota
l
stro
nti
um
SO4
TOC
1 ● ● ● ●
2 ●
3 ● ● ● ● ●
4 ●
5 ●
6 ● ● ● ●
7 ● ● ●
8 ● ● ● ● ●
12 ●
13 ●
14 ●
16 ●
21 ●
22 ● ● ●
25 ● ● ● ● ● ● ●
29 ● ● ● ● ●
30 ●
31 ● ●
32 ● ● ● ●
35 ● ● ●
36 ● ● ● ● ●
37 ● ●
39 ● ●
41 ● ● ● ● ●
42 ● ● ● ●
43 ● ● ● ● ● ● ● ●
44 ● ● ● ● ●
46 ● ●
47 ● ● ● ● ● ●
48 ● ●
53 ● ●
59 ● ● ●
60 ● ● ●
62 ●
63 ● ● ●
68 ● ● ● ●

Significant regional decreasing trends (AT, SO42-)
1996 partial restriction
2003 total restriction
ATRAZIN:
SO2 concentration in the air of Ljubljana city
SULPHATE

Model of environmental pressures and impacts
mg NO3/l – average concentration in observation wells (inverse distance interpolation)
Janža, M
(Prestor et al., 2012)
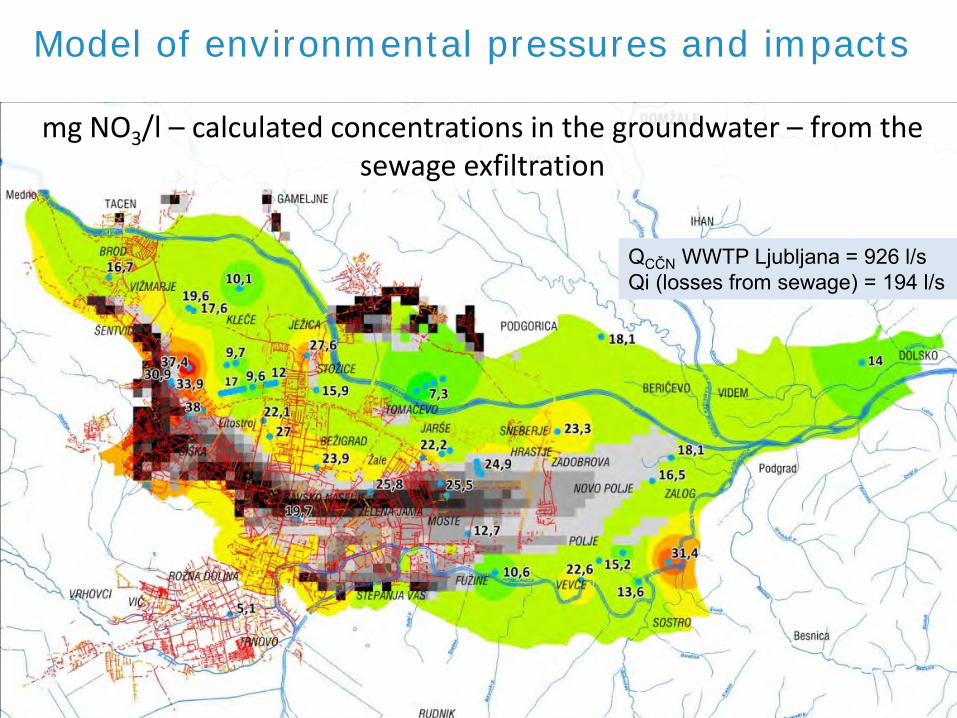
Model of environmental pressures and impacts
QCČN WWTP Ljubljana = 926 l/s Qi (losses from sewage) = 194 l/s
mg NO3/l – calculated concentrations in the groundwater – from the sewage exfiltration

mg NO3/l – calculated concentrations in the groundwater – from the N surpluses in the agriculture

Average nitrate concentration in groundwater 17,61 mg/l from sewage system 7,03 mg/l from agriculture 10,58 mg/l.
38
25 20 18 15 10 7,3 7 7 0
10203040
2005 2015 2025 2035 2045 2055
mg
/l N
O3
(Prestor et al., 2012)

Model of environmental pressures and impacts
kg/year
Measured at
WWPT
Ljubljana
kg/year
Calculated
by the
model
House-
holds
Industry
by
monitoring
obligation
Urban
areas /
traffic
Unknown
sources
Ntot 1.191.824 1.121.246 87,7% 3,0% 3,4% 5,9%
Ptot 186.026 189.889 92,9% 7,7% 1,5% -2,1%
TOC 2.551.195 3.325.322 109,0% 13,8% 7,6% -30,3 %
Estimation of shares of the main polutants in the sewage system (inflow to the WWPT Ljubljana)

Significant polutants in the waste water from sewage
Industry - by
monitoring
obligation Urban areas, traffic
Households +
other sources
*Phenols 1,9% 13,6% 84,4% *Zn 6,7% 17,8% 75,5% *Cu 8,7% 49,2% 42,2% *Cl
- 4,1% 43,7% 52,2% *AOX 12,9% 115,1% Triklorometan 3,9% 96,1% Ni 4,4% 15,9% 79,7% Cd 0,1% 49,7% 50,2% Cr tot 12,2% 56,9% 30,9% Pb 8,6% 78,2% 13,1% Hg 0,4% 169,7% PAH 0,0% 103,1%
Estimation of shares of sources (inflow to WWPT Ljubljana).

µg Cr(VI)/l – calculated concentrations from sewage system losses in comparisson with the results from observation wells
Input from the losses along sewage system – from known industrial sites that report Cr(VI) emissions

Comparison of organic compound, identified by GC-MS qualitative method showed, that the same compound are mostly present in aquifer like before year 2009.
New coming pollutants
Prevailing contaminants are pesticides, but some other contaminants could become relevant, mostly drugs and benzotriazoles.

ORGANIC POLLUTANTS
Challenges
Determination of organic pollutants
Setting of standards
Development of strategies to reduce inputs into the aquatic environment
Development of new methods for observing
How to determine emerging contaminants in water To identify pollutants
To identify the possible source of these pollutants
Development of analytical methods to the lowest levels
Determination the presence in the environment

FURTHER CHALLENGES AND ACTIONS
• Setting specific objectives – – nitrates, chromium, organic polutants
• Gradually & progressively decreasing pressures – Yearly / Till 2020 / Till 2050
• Cooperation of sectors: Spatial planning & Water management
– implement the measures to progressively reduce pollution of groundwater

Thank you for your attention!
www.geo-zs.si

• Auersperger, P. 2012. Project INCOME. Action A.2.8: The hydrochemical analysis - sampling and performing. Final report. • Bračič-Železnik, B., 2009. Projekt INCOME. Report on groundwater chemical status: Local monitoring data. • Jamnik, B., Smrekar, A., Janža, M., 2014. Skrb za pitno vodo. Geografija Slovenije 31. GIAM ZRC SAZU. Ljubljana. (http://giam.zrc-
sazu.si/sites/default/files/gs31.pdf) • Janža, M. 2014: A decision support system for emergency response to groundwater resource pollution in an urban area (Ljubljana,
Slovenia). Environ Earth Sci 73:3763–3774. doi: 10.1007/s12665-014-3662-2 • Kranjc, M., 2011. Project INCOME. Action A.2.3 Data from national monitoring. Technical report January – March 2011. • Prestor, J., Pestotnik, S., Meglič, P., Janža, M., 2012. Project INCOME. A.3.3. Model of environmental pressures and impacts (Final
report) • Schüth, C., Piepenbrink, M., Cosma, C., Janža, M. 2014:. Prstni odtisi onesnaževal z uporabo stabilnih izotopov in večnivojskim
vzorčenjem s pasivnimi vzorčevalniki (Contaminant fingerprinting methods). In Jamnik, B. et al. Skrb za pitno vodo, (Geografija Slovenije, 31). Ljubljana. Založba ZRC, 2014, str. 54-59.
• Urbanc, J., Jamnik, B., Janža, M., Cerar, S., Prestor, J., 2012. Project INCOME. A 4.1. Pollution Source Localization. Final report.
• http://www.life-income.si • http://ppmol.org/urbanizem5/submain2.php?get=122 • http://www.geopedia.si/?params=T105_L5833_F1345#T105_F5833:1307_x461982.5_y100811.5_s17_b4 • Program varstva okolja Mestne občine Ljubljana, http://www.ljubljana.si/si/zivljenje-v-ljubljani/okolje-prostor-bivanje/program-varstva-
okolja/ • Skupna izhodišča in cilji projekta Vizija 2025 in SPR MOL: RAZVOJ LJUBLJANE. Dopolnjujoče prepletanje dejavnosti, prestrukturiranje
prometa, zdravje in varnost, dostopnost, zgoščevanje mesta, prenova in umirjanje, povezava zelenih in športno rekreacijskih površin mesta ter obmestne krajine v sistem, razpoznavnost in središčna vloga Ljubljane.