urban 11024 tran spc)rt - world...
TRANSCRIPT

let, *-4 60,3
URBAN 11024TRAN SPC)RTSector Policy Paper FILEn
Dr,24 444... 4 . .} ..10 P( ,,1 iC R,4
44 ?,SS-,4:s- si>4$'s33 gS'4S >.'..sS 4 .S 44 '4 kS':?Sf s S?'gB'; ?:S..S3< 4" 44f 44
Ou .'f'men.de po'x4'.4K.-z ,..
Do4-,4wur' 4 .L'nyo de P), .~ : '~4<7
'74.444 ... ~( de p-Aiif..444% 4ec4
44 4444 ~ ) .,e>. Sed .4-,.w P lh~ , .
ow P .'." licy' .. 4$. 4*
Se. tor ""r4...xm , .
: . 4 ;S;'scoi p.'ss 5, > a,i§S 4 4S'7 .S 4 ,v. S ' s +is6ss S,f.,, 4S?, 4 .S .,. 4 ..
4454;444'44' S fX ¾.4..4.x:''.' .4.> g s " t .4...3 S g 'S 45 4 4, .+ S s44'
W?s *S;<; f47.4 4 . 4 S.. f4 ,Rfi£ 5. 4 3S fs; ,
.4,4 7 . 'a 4'4. .4 4g a ... * 4 s' :fi o i0 y v tsUs>* ?s ssr *?fs 4gs i> fs5 ,; g e . ,,*. 4 4
?°e 'S,f j r g Sg.,sr.s*3gs 3 t;.jg. {;.e<;si3gissffi4s>fi>to<utfa344
e44.'S 'g'fa<a fS>S''S3'sk fs' ss3 f.r*gf 2Sg 'S'Af' , S'fa 's < aa s>s;zat t'f
§;'Q'.*S'Si 4'a4*e>4 6 t> ''''':";°a? 's ' 'N° S 4 . > s f 48 's''f'744 ."',s ? ','i.f * s4,'
f.44, 4S24'74.44' ' ¢ s* ia+f3**ag's'*"f''fO''f ?;r':Sf '' ,,' *',s 4,.s,ssSfy sfsi
.4,., a6 > W;S$*g.? 444 ... . 44s.4+ s&3¢3;Sf* ,sg>. f stf g.4. 44 . '..' X 4e f
*'..§ss*Sef3 *ag.s.+s, a'* , .; ff g 2 :.Saia,4s " ., ,."*'s::-f *> H'f Ss23:,. j rsS
'e'" '.4&? re>,g,84-> ffvgf4'ff4gSf)fl>f ;2. :,,;eS,
May 1975 ,
Pub
lic D
iscl
osur
e A
utho
rized
Pub
lic D
iscl
osur
e A
utho
rized
Pub
lic D
iscl
osur
e A
utho
rized
Pub
lic D
iscl
osur
e A
utho
rized
Pub
lic D
iscl
osur
e A
utho
rized
Pub
lic D
iscl
osur
e A
utho
rized
Pub
lic D
iscl
osur
e A
utho
rized
Pub
lic D
iscl
osur
e A
utho
rized


URBAN TRANSPORTCONTENTS Page
Introduction ................................................. 3Sum m ary ............ ................................... 6
Chapter 1: Current Conditions in Developing Countries ... 16Deficiencies of Urban Transport Systems . . .16
Contributing Physical Factors . . .21The Pressure on Resources . . .21
Chapter 2: The Prospects for Urban Transport . . .25Impact of Population Growth . . .25
Impact of Higher Incomes . . .25The Rising Cost of Central Area Roads . .26Effects of Congestion on Costs of Road Vehicle Operation ... 27
The Possibilities of Mass Transit . . .29
Chapter 3: Rationalizing the Use of Transport Facilities ... 32Pricing Measures . . .32Measures of Physical Control . . .36
Chapter 4: Promoting Efficiency and Coordination among Agencies ... 41
Public Transport Operations .41
Subsidies for Public Transport .42Development of Intermediate Personal Transport Services .44
Problems of Coordination and Regulation .45
Chapter 5: Transport and Urban Form .47The Achievement of Better Urban Patterns .49
Difficulties of Methodology and Measurement .53
Chapter 6: Activities of the World Bank .56
The Bank's Experience .56The Bank's Policy .57The Five-Year Program, FY1975-79 .60
Annexes1. Automobile Numbers and Income Levels .67
2. Transport Data for Selected Cities .68
3. Lending Program for Urbanization, FY1970-74 .704. Urban Lending Program, FY1969-74 .715. Characteristics of Urban Transport Modes .72
6. Taxation of the Ownership and Use of Automobiles .887. Problems of Methodology and Measurement .94


INTRODUCTION
It may be useful to place this paper on urban transport in a some-what broader context.' It is customary to treat the rapid spread ofurbanization as a critical problem for developing countries. And thisis of course so. The appalling conditions in the major cities, particu-larly in their poorer districts, are familiar. So is the severity of many ofthe urban transport problems with which the paper deals. Morefundamentally, it is evident that growth rates of urban population,exceeding 4% overall and more than 7% in many large cities, con-flict with the shortage of resources available to meet the costs ofurban expansion.
Rapid urbanization, however, deserves to be considered not onlyas a problem, but also as a solution, as a way of absorbing productivelythe growing totals of rural labor that are surplus to the requirementsof agriculture. Few people 25 years ago would have dared predict thatthe cities could possibly absorb so much additional labor as in factthey have-in jobs where productivity may be very low, but on theavailable evidence is generally higher than in the case of marginalrural labor. The deficient living conditions of the urban poor, thoughmore visible than those of the rural poor, are nonetheless a distinctimprovement for most migrants.
In this context, urban development and rural development comple-ment each other; and the potential role of urban transport in copingwith rapid population growth is accentuated. Urban transport canprovide the mobility and accessibility needed to integrate newcomersinto the urban economy, thereby indirectly helping to relieve thepressures of surplus rural population on rural poverty.
As the paper shows, the reduction of costly inefficiencies in trans-port, and the correction of misguided priorities, can particularly helpthe urban poor, promoting equity as well as economic efficiency. Thepaper also brings out that new physical urban patterns will inevitablybe required to absorb the much larger urban populations of the future.In this respect, the development of transport networks can be a majorinfluence in providing the enlarged populations with both more effi-cient and more livable towns and cities.
The importance of this positive aspect of urban development be-comes more evident in the light of the latest population projections
.AII references to the World Bank in this paper are to be deemed to refer also to theInternational Development Association, unless the context requires otherwise. The fiscalyear (FY) of the two institutions runs from July 1 to June 30.
3
made by the United Nations.2 Taking its medium forecast, in the next25 years twice as many persons as during the last 25 years will beadded to the urban population of the developing world. This increaseis dramatic: urban populations in Africa rising from under 100 millionnow to over 300 million by the end of the century; in Latin Americafrom under 200 million to over 450 million; and in South Asia fromwell under 300 million to over 800 million. By the turn of the century,India may have more than 20 cities of over a million inhabitants, whileLatin America can be expected to have a higher proportion of urbanpopulation than Europe has today.
These estimates are unavoidably rough, and the detailed assump-tions can be challenged. But given the inevitable time lags in changingmajor trends, it seems unlikely that migration and urban growth willbe very substantially slower than projected, at least over the nearterm. Indeed, the U.N. report implies that the pressures toward urbangrowth may, if anything, be stronger. Despite the migration to thetowns, the rural population is still projected to grow rapidly. In thenext 25 years, as many people will be added to the rural population inAfrica and South Asia, as to the urban. But as the U.N. report pointsout, pressure on land is already severe and extension of cultivablearea is becoming much more difficult. In South Asia, it is estimatedthat the agricultural population already averages 230 persons persquare kilometer of arable land, compared with 60 in Europe and fivein North America; yet a further increase of more than 50% in therural population is projected for the next 25 years.
In this perspective of the necessary role of urban development inabsorbing a large part of the overall increase in population, the im-portance of urban transport contrasts sharply with the relative neglectof the policy issues involved and of feasible solutions. On presenttrends, the cities of the developing world risk to repeat, and in anexaggerated manner, the shortcomings of urban transport and urbanphysical patterns of the cities of the developed world.
The paper is purposely tentative in regard to both its conclusionsand the scale of the programs recommended. Surprisingly little isknown about analyzing the long-term implications of alternativeurban transport strategies and investments; and the effort required forwidening the framework and scope of urban transport projects isvery large.
2United Nations, Concise Report on the World Population Situation in 1970-1975 and itsLong-range Implications, July 1974, Sales No. E.74.XIII.4. Urban data are based on nationaldefinitions. In this context, "South Asia" includes the Indian subcontinent, Indonesia,Malaysia, the Philippines and Thailand.
4

But these limitations should not mean that action is inhibited. Totake an example, and one that is not exaggerated, it may be found thata third of the buses of a bus system are out of service at the beginningof the day, and a third of those that take the road break down duringthe day; that waiting times at busy terminals average three-quartersof an hour or more; or that transport management, traffic officials andurban planners rarely, if ever, meet. In such circumstances, it does notneed a superior methodology to devise projects and associated poli-cies that could produce major benefits and high rates of return-evenif all the implications cannot be traced, and even if further adaptationsare required later. This does not, of course, mean that such projectsare easy; there are many institutional and sociopolitical obstacles. Butthe more proficiency is gained in the nuts-and-bolts preparation ofsuch projects, the more time and opportunity will be available todevelop methodology and to produce evaluations of increasing depth.
5

SUMMARY
The importance of urban transport lies fundamentally in its con-tribution to the large economies of scale and specialization associatedwith urban growth. Though only about one-quarter of the developingworld's population is urban, typically more than half the nationaloutput is produced in the towns, mainly in the major cities. Urbantransport is not only essential to the requisite concentration ofemployment and production within urban areas; it also provides thenecessary links with the transport network serving the hinterland.From a wider viewpoint, the transport facilities expand the optionsfor work and give access to health, educational and other amenitieswhich, because of scale economies, can often be effectively providedonly in urban areas. Provision of minimum transport inputs for thesevarious purposes within the very limited resources available is thebasic problem of urban transport in developing countries.
There is, however, another aspect of urban transport which accen-tuates the basic problem of shortage of resources in developingcountries. A large proportion of expenditures on personal travel, thelargest component of urban transport, is for additional comfort, con-venience and saving of leisure time above those provided by theminimum transport levels available. To this extent, urban transportis akin to other consumer goods and services rather than just anintermediate product or an input into production to be provided ascheaply as possible. It is where the provision of such additional per-sonal convenience in transport conflicts with provision of basic trans-port inputs for essential purposes, including not only commercial andpublic transport, but also pedestrian and cyclist traffic, that the mostdifficult policy issues arise.
Urban transport and urban physical form are closely related. Physi-cal urban patterns greatly influence the relative merits of differenttransport systems; urban transport facilities greatly influence the de-velopment of physical urban patterns. Though other influences onurban form and urban transport such as provision of public utilitiesand industrial sites or land use policies are also important, the linksbetween urban physical patterns and urban transport are so close asto merit their being considered together. That the potential for influ-encing urban form purposely rather than haphazardly has been littleused makes it no less desirable to conceive of urban transport in therole of promoting urban patterns that are economically efficient and!enhance standards of living.
6

The Current Situation and Prospects
The current situation of urban transport in the developing worldis alarming. Despite still low levels of private automobile ownership,congestion in the cities is already severe in degree, in daily durationand in size of areas affected. Public transport is inadequate both inlevels of service and in the areas served. The fact that a large part ofthe population of the poorer cities cannot afford any form of motor-ized transport underlines the seriousness of reductions in facilitiesfor pedestrians and cyclists in meeting the requirements of othertraffic. Commercial transport suffers heavy expense from severe con-gestion, poor road surfaces and inadequate terminal facilities. Con-tributing to these deficiencies are often low proportions of urbanarea devoted to roads, the mix of slow and fast vehicles, and patternsof built-up areas that hamper traffic flows.
Underlying the severity of the urban transport problems of devel-oping countries is their acute shortage of resources. Provision ofexpensive long-life urban transport infrastructure sufficient to matchthe large additions to population is proving impossible despite allo-cations that are often the largest item in, and sometimes take over aquarter of, public budgets for urban areas. High foreign exchangecosts of private automobiles are a salient feature of overall resourceuse, a feature which is being amplified by current motorization trendsand t'he rise in fuel costs.
A rapid deterioration in urban transport conditions in developingcountries is in prospect, if present trends are allowed to continueunchecked. Current exceptional rates of urban growth are unlikelyto diminish in the near future and may well accelerate. Moreover,as towns grow and workers live farther from their work, a more thanproportional expansion of transport facilities is required. Demand forroad space is accentuated by higher incomes which enable more peo-ple to travel by bus instead of walking, and more to afford privateautomobiles in place of public transport.
The high rate of growth in demand for urban transport which is tobe expected is made more serious by inherent tendencies towardincreasing costs of supply. Additional road capacity in congestedcentral areas can only be provided at progressively higher expense.This also means that, for any given road use policy, an intensificationof congestion must be expected; a greater degree of congestion willneed to be tolerated before the benefits rise sufficiently to justify thehigher road construction costs.. Increasing congestion raises vehicle operating costs and also per-
sonal travel time and discomfort. Due to the high element of labor
7

in costs of commercial transport, heavy expenses are incurred asdelays increase. Buses are particularly adversely affected as comparedwith automobiles, even though in terms of passengers carried theyuse much less of the expensive road space. At very high levels of trafficdensity, mass transport on separate rights-of-way may become themost economical method of expanding personal and total transportcapacity. Where subways are involved, however, trip costs will gen-erally be well beyond the ability of the poor to pay.
The cities of the developing world are accordingly faced with aconflict between the benefits of the increased productivity and amen-ities to be derived from continuing concentration of production andcommerce, and the rising costs of expanding urban transport suffi-ciently for these benefits to be secured. Put another way, unless newapproaches to the urban transport problems are adopted, the im-provement in output and living conditionswhich should be associatedwith the rise in urban population will be jeopardized.
Possibilities for ImprovementFortunately, possibilities do exist for combating the threatened
deterioration in urban transport if strong action is taken in threeinterrelated fields. Firstly, more rational use of transport facilities,particularly of road space in congested areas, must be ensured.Secondly, large improvements are needed in the efficiency of trans-port undertakings and their coordination. Thirdly, transport require-ments should be considerably reduced by closely relating transportfacilities to improvements in urban physical patterns. Great oppor-tunities for effective action in these three fields are provided bycurrent low levels of motorization, the large potential for manage-ment improvement and the rapidity of expansion of urban areas.
Rationalizing the use of transport facilities: The worldwide strengthof demand for private automobiles reflects the great convenience andthe expanded opportunities they provide. These benefits should notbe unnecessarily forfeited; but neither should they be provided atthe expense of the less fortunate majority of the urban populations.At present, extravagant use of road space per passenger by privatecars imposes heavy costs of exclusions, delays and discomfort onother road users that are not adequately reflected in the chargesmade for use of congested roads. Charging for peak-hour use, similarin principle to the higher charges made in some countries for peak-period use of telephones, is needed. Such pricing would eliminatevehicle trips, the benefits of which are valued at less than the costsinflicted on others. Appropriate charges for use of congested roadsduring peak periods might amount to upward of $1 per vehicle a
8
day. Economic charges for parking would also be above presentlevels. Road user charges should also cover environmental costs, suchasair pollution and noise, inflicted on others.
Difficulties of introducing appropriate congestion pricing are bothpolitical and technical. The political problems are severe for decisionmnakers dependent on car-owner support. Technically it is difficult todesign systems without serious drawbacks such as heavy trip restraintat times and places where spare transport capacity exists. Supple-mentary monthly or daily licenses for use of central area roads duringpeak periods and heavier parking charges seem essential ingredientsof a feasible charging package.
Early and progressive action is needed if the rapid rise in automo-bile ownership is not to intensify the political difficulties. Failingcongestion pricing, supported by physical measures discussed below,the only effective way to achieve more economic levels of road usewill be to restrict automobile ownership by higher general taxesand/or quotas. This second-best solution involves unnecessary andsevere restriction of automobile use on uncongested roads but maypossibly be favored from fiscal considerations.
More appropriate pricing of congested road use can alleviate, butcannot be expected to cure, congestion. Even with much highercharges than at present, the latent demand for more road space inthe cities of developing countries, the speed of urban expansion, andthe basic shortage of resources, ensure that the number of vehicleswill soon catch up with the road capacity released by better pricing.
The importance of congestion charging lies primarily in the changeproduced in the traffic mix in favor of public transport, commercialtraffic, and lower-cost forms of private transport, thereby increasingthe number of persons, particularly poorer persons, carried. Chargingof economic prices for the use of congested roads also reduces mis-allocation of resources by lessening the pressures to purchase andrun private vehicles for uneconomic trips, to construct expensiveurban roads and to develop urban sprawl.
Highly skewed income distribution and large uncharged "externali-ties" create a need to supplement congestion charging by adminis-trative action and physical restraints if the transport functions mostessential to the efficient running of cities are to be adequately pro-vided. Staggering of work hours can help spread the peak load.Through traffic using central areas can be diverted by physical barriersto longer but less congested routes. It is also often practical at lowinvestment cost to increase road capacity significantly by better sig-nals, one-way streets, parking prohibitions, and other measures oftraffic engineering and management. It is surprising how frequently
9

such possibilities are neglected in favor of much more costly roadexpansion.
More direct action is also needed to establish priorities for essentialtransport, and particularly for low-cost, high-volume public transportto carry workers to their employment. Specific physical measures arenecessary to shield buses from the interference and delays caused byother traffic. Methods include reserved lanes or streets in highlycongested areas for buses and other essential vehicles, priorities atintersections and access points, and facilities for quick bus turn-roundat terminals.
Recognition that in developing countries pedestrians and cycliststypically account for the majority of all urban trips has importantimplications for traffic management and urban transport system plan-ning. In the poorer developing countries large sections of the urbanpoor will continue to be unable to afford motorized transport of anykind. The domination exercised by motorized transport, and reflectedin curtailment of sidewalks, needs to be curbed. Closing some centralarea streets to vehicular traffic at peak periods merits serious atten-tion. Of the greatest importance in its potential for cheap, and rela-tively fast, high-volume transport, is the provision of separate tracksfor cycles and motor-assisted cycles.
Management improvement and coordination: Improvements in ef-ficiency of transport undertakings and their coordination are heavilydependent on better management. Standards of public transportservice in terms of speed, comfort and fares need to be tailored moreclosely to income levels. The poorer the travelers, the greater theimportance of the level of fares relative to time and comfort. Butenforcement of low fares by regulatory authorities is not, by itself,generally conducive to efficiency. The consequent lack of financialresources often indeed results in obsolete vehicles and inadequatemaintenance, leading to high rates of breakdown and poor service.A more direct attack on costs and standards is required. So is actionto remedy inefficient regulating methods which, combined with man-agement weaknesses in municipal bus companies, are reflected inthe failure to develop new routes.
Specific subsidies for public transport may be justified in somecases, particularly where conditions of decreasing unit costs prevailand alternatives would be more expensive. But other pressing callson public finance and the very high cost of even a small subsidy perpassenger, most of whom are not from the poorest groups, argueagainst general subsidies. So do the dangers of supporting manage-ment inefficiency. When capital for expansion is a major problemfor private bus companies and smaller municipal undertakings that
10

are otherwise financially viable, development of financial intermedi-aries deserves consideration.* The wide gap between levels of bus service that the poorer popu-
lation can afford and those of the private car makes the provision ofintermediate levels of personal transport, such as minibuses andshared taxis, more important than in developed countries. Regulationswhich hinder the development of such services frequently stand inurgent need of revision. The impact of additional types of service onthe existing systems of public transport requires analysis, however,on an individual city basis.
Roads, ports, airports, individual bus routes, railways, markets andother parts of the transport system are generally run by separateagencies. Responsibility for municipal transport services is divorcedfrom that for corresponding intercity services. Consideration of theurban transport system as a whole is consequently generally lacking.The advantages of coordinating local bus and rail routes and ensuringadequate links between urban and intercity commercial and passen-ger services are obvious. Unfortunately, independent action oftenfails to overcome the obstacles to such links.
Considerable scope exists for making the various measures of re-form self-reinforcing. For example, congestion pricing of automobileswill be more acceptable if accompanied by improved services ofshared taxis. Bus priorities are unlikely to be effective unless accom-panied by other measures of traffic engineering and management.Fare increases may be best timed to coincide with improvementsin service.
Institutional frameworks vary too greatly to permit valid generaliza-tions on appropriate institutional forms for securing the requisitecoordination. Monolithic transport authorities involve dangers ofovercentralization and overregulation of operations. Transport plan-ning units, if set up near the centers of decision making, should beable to resolve the value judgment issues necessarily involved andsecure the authority needed for implementation.
Relating transport to urban form: The rapid expansion of urbanareas and flexibility in employment location provide great opportuni-ties for less transport-intensive, less costly, and more efficient andcongenial urban patterns. Current policies and investment programsare implicitly based on questionable assumptions that existing trafficflows are rational, that efficient alternative locations for offices andother work places do not exist, and that single concentrated centralbusiness districts are viable and inevitable. There is no simple solutionto the question of the best urban pattern, since local conditions andfunctions of cities vary so greatly. But various considerations strongly
11

suggest that alternative urban structures could with advantage beadopted.
The most important of such considerations is the desirability Qflocating workers and their work in close proximity. The poor cannotafford either long distances or high rents. The urban structures shouldallow commercial traffic to avoid congested areas and promote publictransport efficiency. More generally, the need to economize resourcespoints to maintaining higher population densities than in developedcountries. The resulting smaller urban areas will require fewer streetsand provide greater access with fewer motorized trips, lower vehiclespeeds and hence lower road and track design standards. Possiblenegative effects of high densities, on building and sewerage costs,for example, must also be taken into account.
Such considerations point to advantages from city structures en-compassing several secondary employment centers and a greater mixof work places and residences than found in the cities of developedcountries. Reduced average trip lengths, more balanced traffic flowsand high densities along public transport corridors are among thepotential benefits. Important economies are also possible in the lay-out and road standards of local neighborhoods.
Market forces will not by themselves produce desirable urban formslargely because land and transport prices do not adequately reflectsocial costs and benefits. In these conditions, pressures to ensurecontinued accessibility tend to reinforce the dominance of existingbusiness centers despite increasing costs and rents that force outresidences. In the process, the transport system generally developsradially from the existing center with little stimulation of secondarycenters.
To promote new activity centers with adequate levels of accessi-bility for businesses not strongly dependent on central city locationrequires secondary nodal points of the transport system and largeinitial infrastructure investments. Congestion pricing and other ap-propriate adjustments to prices and taxes can provide favorableunderlying conditions. But it is also necessary to use transport invest-ments to guide location, and to reform and simplify land use regula-tions. A less exaggerated pattern of rents and better mix of residencesand economic activities in the old as well as the new centers shouldresult.
The failure to grasp the potential of improved urban physical pat-terns has been accentuated by serious weaknesses of urban transportmethodologies and models stemming largely from the intricacies ofthe urban transport networks, and the complexity of interactionswith other urban services. These drawbacks are amplified by the
12

unprecedented and largely unpredictable rates of change of the citiesof developing countries. A shift in focus to clarify the main objectives
-and opportunities and to develop broad alternative strategies appearsessential. Transport planning should be an integral phase of generalurban planning.
A Bank ApproachThe importance of the sector, both directly and in its impact on
returns from projects in related fields such as intercity transport,ports, airports, industry and tourism, contrasts with its relative neglect.Many obvious possibilities exist for urban transport improvementswhich would both increase productivity and improve the position ofthe urban poor. It is indeed the urban poor who suffer most fromexisting distortions and inefficiencies. Furthermore, urban transportprojects provide a natural point of entry into the wider aspects ofplanning and promoting urban forms efficient in both economicand social aspects. The inherentcomplexities and inadequate method-ologies and information, however, dictate a pragmatic approach inwhich programs and policies are developed and adapted in the lightof experience.
The World Bank has only recently taken an active interest in theurban transport sector. Long preparation times for projects-includ-ing the requisite understanding of the urban context within which theprojects will operate-heavy staff requirements, and general lack ofadequate expertise both within and outside the Bank, make it inevit-able that the Bank's contribution in this field will continue to beconstrained. The number of projects will probably not average morethan two or three a year for some years to come. It is all the moreimportant that the Bank's program be highly concentrated whereexperience will be most valuable and where wide demonstrationeffects will be achieved.
Policy considerations: Fundamental to the Bank's approach is theneed to place the physical elements of urban transport projects in thecontext of policy measures, institutional development and manage-ment solutions. Willingness of the appropriate authorities to developand undertake broad programs encompassing a wide variety of re-forms to improve urban transport and to achieve more efficient andcongenial urban physical patterns is hence a sine qua non for Banksupport. Action to promote more rational use of road space is ofparticular concern. A flexible attitude will be maintained towardsubsidy policies within the overall perspective of promoting eco-nomic, financial and managerial efficiency.
13

The practical difficulties of implementing reforms in the urbantransport sector are fully recognized. Progressive application of policymeasures and institutional reforms is generally indicated. Conse--quently, continuity of association is envisaged with cities in whichurban transport projects are undertaken; support over an extendedperiod may encompass several projects linked to a sequence ofmeasures. To help plan and implement such a strategy, projects willfrequently include an important element of technical assistance andstudies to support further policy measures.
Physical components: The wide variations in physical conditions,resources and needs of cities, and in their institutions, require con-siderable flexibility in the choice of physical project components.Primary emphasis will, however, be placed on low-cost public trans-port providing greater access to job opportunities, and on facilitiesfor commercial traffic, cyclists and pedestrians.
Rehabilitation and expansion of bus and urban rail systems willaccordingly be a priority area including vehicles, maintenance, andrepair shops and terminal facilities. Bicycle tracks and pedestrianfacilities will also be strong candidates for support either separatelyor as constituent parts of wider projects. Projects centering on im-proved efficiency of commercial transport are likely to include termi-nals, markets and goods transit facilities.
Roadways may either form part of wider projects or constituteseparate projects as, for example, linkages between intercity roadsand urban networks, or roads to provide better access to port areasand new industrial locations. The emphasis in urban road projectswill be on facilitating cheap personal transport and commercial traf-fic; financing of roads primarily benefiting automobile users is notcontemplated. It is recognized, however, that private car owners maybe among the beneficiaries of any major road expansion undertakenprimarily for other purposes. Traffic engineering and control schemesare expected to offer good prospects for acceptable projects.
Bank participation in general urban development programs con-taining transportation elements will also be considered. Help toprivate and small municipal transport undertakings may be giventhrough financial and technical assistance to support financialintermediaries.
Other activities: This effort will be backed by a continuing programof investigatorystudies of urban transport requirements and transport/land use planning. In the development of more appropriate meth-odologies, the Bank will be prepared to assume a larger role than inthe past in stimulating more rapid development of expertise inthis field.
14
Increasing attention will also be given on a selective basis to urbantransport impacts and requirements of Bank projects in other sectorssuch as ports, airports, industry, tourism and intercity transport. Moregenerally, the relationship of such projects to problems of urbangrowth, including those of urban transport, will be increasingly
.emphasized in their evaluation.
15

Chapter 1: CURRENT CONDITIONSIN DEVELOPING COUNTRIES
To summarize the situation of urban transport in developing coun-tries is difficult. Physical conditions, income levels, and economicand social structure vary greatly. Important exceptions to anygeneralizations must, therefore, be expected. Nevertheless, urbantransport conditions in the larger cities, where the majority of theurban populations live, have enough in common to justify some broadcharacterizations. Transport problems in the smaller towns, thosebelow 100,000 population, are much less critical due mainly to shortertrips and to much more limited levels of economic development.
Deficiencies of Urban Transport SystemsLevels of congestion: In relatively wealthy cities like Caracas or
Rio de Janeiro, as in very poor cities such as Bombay or Jakarta, trafficcongestion is chronic. In a disturbing number of cases, to judge bythe frequency of stalled traffic, conditions on individual road seg-ments have deteriorated to the point where additional vehiclesreduce speeds more than in proportion, thus lowering the vehicle-miles produced on the road network in a given time period. In suchconditions, average road speeds in central areas eventually level offat between 7 and 10 miles per hour; but the length of roadwaysseriously congested rapidly increases and periods of congestionlengthen. In Bangkok, Sao Paulo, Lagos and many other cities, peaktraffic pressures now extend with remarkably little variation overperiods of more than 12 hours a day.
What the traffic data do not reveal is the number of trips abandonedor transferred to much less convenient times as a result of the acutecongestion. This suppressed or latent demand is undoubtedly largeand growing. Because of this latent demand, possibilities of reducingcongestion by either increasing transport capacity or by restrainingexisting users are limited.
The most alarming feature of current congestion is that it is happen-ing while private automobile ownership is still low. As Annex 2indicates, the degree of motorization is closely related to levels ofincome. The poorer Asian and African cities typically have fewer thantwo automobiles per 100 persons. In the much richer Latin Americancities the number rises to around 10. Even such levels are far belowthe 20% or 30% customary in Western European cities, let alone themuch higher levels of North America.
16

Private vehicle ownership, nevertheless, varies to a greater extentthan can be accounted for simply by income or city size. With similar-income levels, Tunis has almost nine times as many cars per 1,000population as Seoul, where car ownership is exceptionally low, andNairobi some 30% more than Tunis. The motorization ratio for Kuala.Lumpur is not much less than for Buenos Aires, where per capitaincome is three times larger. Such differences persist even when thecomparison is limited to cities of similar size. As in most other aspects,the data need to be treated with great care; licensing records fre-quently fail to account adequately for retirement of vehicles. Thevariations are, nevertheless, too large to be readily attributed to in-adequacies in the data.
Differences in rates of taxes and import quotas obviously playsome part in explaining these variations; but it is not possible to sayhow much since population densities, the adequacy of public trans-port, income distribution and many other factors also play a role. AsAnnex 2 indicates, import taxes vary from under 30% to over 300%and gasoline prices now range from under 20 U.S. cents per gallonto over $2. The virtual suspension of imports of private automobilesover several years has clearly been a major factor in the low motoriza-tions ratios of Seoul, Taipei and Bogota. It is relevant that whateverthe inconvenience caused, there has been no apparent adverse influ-ence on economic growth; the Republics of China and Korea andColombia have all been high in the league of rates of economicdevelopment.
Varying levels of car ownership are reflected along with other in-fluences in widely differing proportions of private vehicles in trafficflows. Automobiles account for over 60% of vehicle traffic in Caracasbut only about 15% in Madras. Even where private automobiles areonly a small part of traffic, it cannot be assumed that their role in con-gestion is small. Private automobile use tends to be concentrated onpeak hours when even small additions to traffic on crowded andnarrow streets can have large adverse effects on other vehicles.
Public transport: Public transport1 in the cities of the developingworld is generally and evidently deficient. Inadequate capacity isreflected in long queues and extreme overcrowding during longperiods of peak traffic. Waiting periods at bus stops in busy locationsoften average over half an hour and sometimes more than an hour.Particularly vulnerable in this respect are transfer points from onetype of transport to another-from rail to bus, or from interurban
."'Public transport" is used in this paper to cover modes of collective personal transportother than private automobiles. The undertakings concerned may be, and often are,private, e.g., private bus companies.
17

bus to local urban services. Clearly, the public transport system israrely conceived as a whole by those who supply the parts.
Less readily apparent is the failure to extend public transport net-works in relation to urban growth. Squatter settlements, often ac-counting for well over a quarter of city populations, frequently lackany effective public transport service. Where, as is usual, squatters arelocated on the outskirts of the city, inadequacies of the public trans-port system and long journey times can effectively preclude partici-pation in many employment opportunities and thus aggravate incomemaldistribution.
Of all public transport deficiencies, the state of bus services is themost prominent. Though constituting a small proportion of the totalnumber of vehicles on the roads, buses typically account for abouttwo-thirds of motorized trips and in many poorer cities four-fifths.Inadequate fleet capacities are accentuated by low speeds as a resultof congestion and frequent breakdowns that in turn contribute tofurther congestion. More than a third of municipal bus fleets is oftenimmobilized; poor servicing and maintenance compound the morebasic problems of obsolescence.
Conditions on urban rail services, which are of considerable im-portance in many cities, particularly major ports, are no better. InBombay, for example, railways carry more than a third of the publictransport load. Almost always developed from old intercity lines,urban railways suffer from obsolete rolling stock which often is over50 years old, poor track conditions and faulty signaling.
To some extent, deficiencies of bus and rail services are beingalleviated by "intermediate" personal transport services. Communaltaxis, auto-rickshaws, "jitneys," "peseros," "por puestos," "dolmus"
Table 1
Modal Split of Motorized Trips in Selected Cities
Other OtherAutomobile Bus motorized(') Automobile Bus motorized(')
City % % % City % % %
Kuala Lumpur 47 35 18 Hong Kong 22 55 23Caracas 46 35 19 Mexico City(2) 19 65 16Kinshasa 33 58 9 Bogota 17 71 12Bangkok 29 59 12 Karachi 16 63 21San Jose 23 74 3 Seoul(2 ) 8 89 3
Note: The data for this sector are generally weak and not closely comparable.
(') Includes taxis, jitneys, etc.
(2) Rail servicesare alsoimportant.
Source: Annex 2.
18

and many improvised types of transport such as "mammy trucks" arebased mainly on automobiles and minibuses. Over the last few years,ihey have assumed, where permitted, an expanding role for thosewhom the bus or urban rail systems do not adequately cater for andwho cannot afford private cars. In Tehran, for instance, some 2,000jitney-taxis running on fixed routes carry about 100 million passengersa year, compared with 700 million carried by buses. In Manila, "jeep-neys" (shared jeeps) carry as many passengers as do buses. Their costsand fares, however, are generally somewhat above those of busesand a large proportion of the poorer residents consequently cannotafford them. In the richer cities, ordinary taxis may make a significantcontribution. Though much fewer in numbers, their total of persontrips per day may exceed that of private automobiles as, for example,in Mexico City.
Ridership of public transport and intermediate personal transportvaries greatly even between cities of comparable size and income. Asindicated in Annex 2, well over half of all motorized trips are by publictransport in Kinshasa but only about one-third in Kuala Lumpur. Notonly in many poorer cities, but also in some of the richer LatinAmerican cities such as San Jose and Mexico City, the proportion ofpublic transportation is two-thirds or more. Low rates of public trans-port use may, it should be noted, reflect either high levels of privateautomobile ownership or poor public transport availability, or in-comes too low even to afford the public transport available.
Pedestrians and cyclists: Essential to an understanding of the urbantransport problems of the developing world is the fact that a largepart of the urban population, particularly in the poorer cities, simplycannot afford any form of motorized transport on a regular basis. TenU.S. cents a working day-fairly typical of fares for two bus rides oftwo or three miles-represents about 10% of an income of $300 ayear. Many of the poorer wage earners earn less than this. Nor canthey generally afford such a high proportion of income for transportafter meeting costs of food and other necessities for the family.
Not surprisingly, therefore, walking and cycling are even moreimportant than public transport in terms of number of trips, thoughusually not in distance traveled. Most trips in most cities of develop-ing countries, including travel to work, are made on foot or cycle.Though difficulties of ensuring comparability of data are great, it isindicative that in large African cities such as Kinshasa and Dar esSalaam as much as two-thirds of trips have been recorded as on foot.In many cities, particularly in India and Africa, cycling also accounts
-for a high proportion of total trips. In Madras, for example, a third ofvehicles entering the central business district each day are cycles as
19
are more than 25% of vehicles passing a cordon some 10 miles out.What is surprising is the great variation between cities of apparentlyclosely comparable characteristics.
The facilities for walking are poor. In cities such as Singapore orCaracas, sidewalks have been extensively cut to make way for auto-mobiles. Crowded bus stops increase the hazards. Pedestrian cross-ings are almost nonexistent. New roads are constructed withoutadequate provision for pedestrians. In some instances, pedestriansare forced to find their way on unpaved paths and along railwaytracks, as in Bangkok for example. As a result, walking and crossingstreets in many cities have become highly dangerous.
Conditions for cyclists are, if anything, worse than for pedestrians.In many cities, cycles outnumber automobiles, and, in some citiesin the middle-income range, the same is true of power-assisted bicy-cles. But bicycle riding is increasingly hazardous. As a result, thischeap and potentially very important mode of transport tends to begrossly underutilized.2
Commercial traffic generally represents a much larger proportionof total urban traffic than in the developed countries. Exact propor-tions are difficult to establish as many automobiles are used partly forcommercial purposes. The number of vehicles registered as commer-cial, typically about 20% of all vehicles-the proportion is higher inthe poorer and is lower in the richer countries-is often an under-estimate. Since daily mileage is greater than the daily mileage forprivate automobiles, their part in traffic flows is typically probablyover 30%.
Costs of urban goods transport are generally high. Expenses aregreatly increased by congestion delays, and by wear and tear ofcommercial vehicles due to "stop-go" conditions and poor road sur-faces. In the poorer cities of South Asia and Africa, hand and animal-drawn carts are a substantial part of the total of commercial traffic.The growing difficulties for such vehicles and their incompatibilitywith motorized vehicles as congestion grows are very evident. Urbangoods traffic by water is also significant in many port cities; here, too,expansion of traffic has often led to severe congestion.
Adding to the difficulties of commercial traffic, facilities for trans-ferring goods between transport modes, for example from rail toroad, or ship to road, are generally seriously inadequate. Warehousesand truck terminals for breaking of bulk are often rudimentary, theircondition contributing to high breakage and pilferage losses. Poormarket facilities also cause high costs. Not only is their capacity2A similar potential for cheap personal transport that exists in some cities but is usuallyneglected is the ferryboat service.
20

usually overstrained but their siting typically contributes substantiallyto congestion and delays.
Contributing Physical FactorsRoad space: The prevailing high degree of congestion, despite rela-
tively low numbers of automobiles, is often attributed to the smallproportion of urban space devoted to roads. Available data indicatethat whereas in the cities of developed countries roads typicallyoccupy 15% to 25% of total urban area and over 30% in newer low-density American cities, in the developing world the ratio often fallsbelow 10% and ratios much above 15% are rare. Due partly todiffering definitions, the evidence is not conclusive and needs in anycase to be related to city size, larger cities tending to need a higherroad ratio.
The mixture of traffic: There is no doubt that, particularly in thepoorer countries, the wide variety of traffic sharing the limited right-of-way, and ranging at times from camels and bullock carts to thelatest models of private cars, is a serious factor in congestion. Thegreater the pressure on road space, the more speeds tend to bereduced to those of the slowest moving vehicles; the potential offaster public, commercial and private vehicles is wasted. Often,pedestrians and market activities intrude on the road space even ofmajor arteries. Effective road capacity is generally further reducedby extensive uncontrolled parking of vehicles of all kinds, and byineffective signaling and other traffic controls.
Urban patterns: Physical patterns of cities often compound thedifficulties. Central business districts are typically not so clearlydemarcated as in the developed world. The main activity centers are,however, often concentrated in narrow streets prone to intense con-gestion. High densities of intersections, winding configurations andchanging road widths reduce capacity further. Frequently, too, themajor cities with histories of export-based economic development arelocated at river mouths, often on islands, where areas of water andmarshy soil hamper development of efficient urban transport systems.Many of these cities, such as Bombay, Abidjan, Calcutta, Jakarta, orLagos, are plagued by difficult communication between the combinedport, manufacturing and central business district, and the rest of thecity and hinterland.
The Pressure on ResourcesIt is, however, the rapidity of urban growth and motorization in
relation to the acute shortage of resources that most clearly underlies
21

the current urban transport difficulties of most developing countries.Over the last two decades, populations of the large cities of devel-oping countries have increased at rates generally in excess of 5% perannum and frequently over 7%, doubling within 10 years. Privateautomobile numbers have risen even faster, the records showing over10% a year growth for the developing countries as a whole, and 20%in some major cities-a spectacular rate even allowing for probableoverestimations. Commercial vehicle registrations have risen onlyslightly less spectacularly.
Investment levels: Urban transport infrastructure is long-life andcostly. Heavy immediate investment per head of additional popula-tion is required to maintain service standards. Resources have simplynot been available on a scale adequate to meet the escalating demandeven though, on the basis of meager evidence, over one-fifth of totalpublic investment in city areas has frequently been directed to roadsand other transport facilities.
Even higher levels of public investment in transport are contem-plated in some cities. In Bombay, a recent study indicates plannedrates of transport investment of $30 million a year, or 26% of,pro-jected public investment expenditures over the next few years. Thisallocation substantially exceeds those to other sectors includingpublic housing, sewerage, education and health, and represents $200per head on the additional populations expected during the period,or $5 per annum per head of the present population. Since averageannual income is only about $200 per head and total municipalrevenues about $10 per head, maintenance of such high transportoutlays on a continuing basis must be considered doubtful. Yet in
Table 2
Growth of Population and Automobiles in Selected CitiesAnnual Rate of Growth, 1960-70
Population Automobiles Population AutomobilesCity % % City S %
Abidjan 11.0 12.7 Istanbul 6.0 12.2
Seoul(') 8.5 22.0 Mexico City(3) 5.8 10.5Lagos(2) 7.9 15.5 Bombay 3.7 8.2
Kuala Lumpur 6.5 11.3 Singapore(4) 2.6 6.7
Bangkok 6.2 12.0 Buenos Aires(5) 2.4 12.1
Note: The data for this sector are generally weak and not closely comparable.
(I) Figures for 1961-70 (3) Figures for 1960-71(2) Figures for 1964-69 (4) Figures for 1966-71
Source: Annex 2. (5) Figures for 1960-69
22

Calcutta, with still lower income levels, projected transport invest-ment per head is even higher.3- To the totals of public transport investment have to be addedprivate investment, particularly in vehicles and parking space, andancillary investments such as gasoline stations and repair facilities.Costs of vehicle operation and road maintenance are in addition.Unfortunately, data on private expenditures are too scanty to be ofmuch use. For the richer developing countries, however, it appearsthat private investment in automobiles in urban areas substantiallyexceeds public investment in urban roads and even more that inpublic transport.4 Data on family budgets indicate that the share oftransport in the expenditures of urban families rises with income froma negligible level to over 5%, with a large jump, frequently to over10%, on purchase of a private car-an indication of the large benefitsperceived.
Foreign exchange requirements: The most salient feature of foreignexchange requirements of urban transport is the generally predomi-nant role of private automobiles. However, though large in relationto the limited number of persons benefited, the total foreign ex-change cost of private automobiles is less than is often supposed.Including fuel requirements, a figure of not more than 4% or 5% ofoverall imports appears typical. As private automobiles are so heavilyconcentrated in the urban areas, this is probably a close enoughestimate for urban automobiles.
Bus imports are relatively very small and in most cases cannot beseparately identified in the statistics.5 In terms of foreign exchangecosts per passenger-mile, buses are clearly much more economicalthan automobiles. A bus costing $40,000 or 13 times more than atypical automobile, may average over one million passenger-miles ayear or over 40 times the passenger-mileage of a typical automobile;the bus is also likely to run for more years. Comparison of foreignexchange costs of the vehicles alone, however, somewhat exaggeratesthe advantages of the bus. Foreign exchange costs of fuel per passen-ger-mile show less variation between buses and automobiles; the
'in Kuala Lumpur, for comparison, investments in roads and buses to 1990 recently pro-posed by consultants amount to $350 million, or $300 per person added to the populationduring this period. This is in the context of proposals to restrain private automobile use.4A recent study of Bogota, for example, estimates transport at about one-third of totalexpenditures, both public and private, on urban services (including housing, education,utilities, health, etc.). Private vehicles comprise considerably more than half of the trans-port expenditures.
'lmports are often limited to chassis. The foreign exchange costs of bodywork, spares,'etc., cannot be separately distinguished. Imports of commercial vehicles are generallymuch larger than for buses but urban use cannot be separated from use outside urbanareas.
23

heavy weight of standard buses compared with the light automobilestypical in the cities of developing countries largely offsets the differ-ence in effective passenger capacity.
Many reasons for the limited foreign exchange requirements ofurban transport in developing countries at the present time are,of course, to be found in the low level of urbanization and of automo-bile ownership as compared with developed countries. With muchgreater dependence on public transport, cycling and walking, theenergy crisis and the rise in prices of fuel used in urban transport hasso far had only a limited impact. The impact of higher costs of fuel forother uses hasgenerally been much more significant. Current trends inlevels of urbanization and motorization, considered in greater detailin the next chapter, make it probable, however, that foreign exchangecosts of urban transport in developing countries will grow at a fasterrate than can generally be expected for their national economies. Theimplications, both in terms of foreign exchange stringency and fuelconservation problems of urban transport requirements, may, hence,become considerably more important.
24
Chapter 2: THE PROSPECTSFOR URBAN TRANSPORT
Impact of Population GrowthIf the present situation of urban transport in developing countries is
serious, the prospects, if existing trends are allowed to continueunchecked, are even more disquieting. Dominating the outlook fromthe side of demand is the probability of continuing exceptional ratesof urban expansion. Roughly half of the current growth in urbanpopulation is from natural increase; and in the short term, any declinein birth rates will probably be largely offset by declines in death rates.Nor is the flow of migrants likely to fall. Unprecedented rates of popu-lation growth in rural districts as well as in towns, and ever-decreasingreserves of cultivable land, mean that for many developing countriesit is at least as likely that migration will accelerate as that it will fall off.Existing trends indicate that most of the large cities will double in sizewithin 15 years and many in less than 10 years.'
An even faster rate of growth is to be expected in urban transportrequirements. Average trip distances lengthen as a result of increasedsize of urban areas combined with concentration of activities. Com-muting-to-work trips, which customarily represent nearly half of alltrips and a much higher proportion at peak hours, are particularlyaffected. Where walking previously sufficed, cycles and motorized orrail transport are increasingly needed simply to reach work. Diversi-fication of amenities reinforces the tendency.2
Impact of Higher IncomesGrowth in incomes will further accentuate the growth in demand
for urban transport facilities. The highly skewed income structure ofmost cities in developing countries means that a general rise in in-
'Improvements to national transport and communications systems, by reducing the rel-ative importance of small and intermediate towns as marketing, stock-holding anddistribution centers, may tend to reinforce the predominance of major metropolitan areas.
'Average lengths of motorized trips are strongly related to physical size of the city.The extent of physical expansion with growth in population depends in turn on howpopulation densities vary. Initially, densities may rise, thus restraining the increase inaverage trip length-though not the growing complexity of living, and hence number oftrips desired. Higher densities mean that more pairs of origins and destinations arebrought within walking distance. At a later stage of higher incomes and lower populationgrowth, densities usually decrease, particularly where expansion in transport capacityallows higher speeds that ease longer commuting distances.
25

comes produces a more than proportional increase in the number offamilies which are able to afford a car. This tendency is reinforced bythe worldwide trend for automobiles to absorb a larger share of per- -sonal expenditures at given income levels, reflecting the strong ben-efits which car owners derive and the increasing familiarity withmotorized transport from one generation to the next. Hence, theextremely rapid growth in private automobiles already noted must beexpected to continue. Recent projections indicate that the car popu-lation of the developing world will jump from about 17 million in1970 to 117 million by the turn of the century.3
Unlike the more developed countries, however, the main growthin demand for urban transport in the poorer of the developing coun-tries for many years will be at the frontier between the bus andwalking or cycling rather than between the bus and the automobile.Though this has so far received much less attention, the number ofbuses is likely to increase greatly.
As private automobiles take roughly nine times more road spaceper passenger than buses, and bus travel will be replacing walking,demand for road space can be expected to rise very sharply in thedeveloping countries with income growth. Savings and municipalrevenues that can be devoted to urban transport will also rise withincomes, but not with such rapidity.
A fast growth of urban commercial traffic must also be expectedto result from rising income levels and relatively rapid expansion ofmodern manufacturing and retailing sectors. If the experience ofdeveloped countries is followed, as seems likely, the number of com-mercial vehicles will rise more slowly than the ton-miles, due mainlyto use of larger vehicles as trade expands.4
The Rising Cost of Central Area RoadsThe prospects of rapidly increasing pressures of demand for urban
transport in developing countries are coupled with prospects ofrapidly rising costs of supply. Particularly important are costs of roads,since roads are usually by far the most important component of in-vestment in urban transport infrastructure. Whereas the network oflow volume neighborhood roads can be expanded at relatively low
3Gerald Leach, The Motor Car and Natural Resources, Organization for EconomicCo-operation and Development (OECD), 1973. Estimates are for "rest of the world"covering all countries except those of OECD4The OECD projections referred to above show the commercial vehicle population (busand goods) oi the "rest of the world" rising irom 13.7 million in 1970 to 18.5 million in1985 but the rate of increase then tailing off rapidly to give a total of 21 million in use inthe year 2000.
26

cost as the cities grow,5 the costs of expanding road capacity in cen-tral congested areas rise sharply with urban growth. Costs of centrally,situated land, whether reckoned in financial or economic terms,increase rapidly with city expansion as also do construction costs,including property acquisition, demolition and dislocation costs.
Physical limitations on land availability as well as the rise in costsof enlarging existing roads may eventually warrant construction oflimited access highways. Offsetting much larger costs, which mayexceed $2 million per lane-mile, the higher speeds of uninterruptedand more uniform traffic result in much greater effective capacity.Even so, the direct construction costs for a stretch of urban express-way, say five miles long, if attributed to the peak-hour traffic for whichthey are primarily incurred, are likely to exceed $2.50 per vehicleper working day at a 10% rate for amortization and maintenance.Additional social costs in the form of breakup of neighborhoods are,moreover, much greater than for expansion of existing arterials.
One important consequence of the sharp increases in costs of con-structing additional road capacity in central areas is that much higherbenefits are required to justify the construction. What this means inpractice is that, progressively, a higher degree of congestion has to betolerated before more road construction to alleviate the situation canbe justified. Since a large part of the benefits to be secured are timesavings which are, in general, valued at less than in developed coun-tries, more hours of time need to be saved to balance the expense;a higher level of congestion than in developed countries is accord-ingly warranted.6 With so many urgent needs to be met, uncongestedstreets in city centers at peak hours would be a sign of serious imbal-ance in the use of scarce resources.
Effects of Congestion on Costs of Road Vehicle OperationWith greater congestion, higher operating costs of all types of road
vehicles are to be expected as well as increased losses of personaltime, discomfort and pollution. The impact of congestion varies,however, between different forms of urban transport. Buses are par-ticularly adversely affected, lessening their relative attraction as com-pared with private automobiles. The deteriorating conditions of roadtransport may also cause switches to urban rail and other forms ofnonroad transport.
5They may indeed be subject to increasing returns in terms of the volume of traffic theycan and do accommodate. Annex 5 provides a further analysis.6Actual congestion levels in developed countries, as in developing countries, are, how-ever, generally well above those which would be warranted with rational road pricing.
27

The vulnerability of buses to congestion is in part due to the com-position of their costs. More than three-quarters of the total costs perbus-mile now typically somewhat over 50 cents-are accounted forby operating costs in which labor costs for driving, ticket collection,maintenance and administration form the main part. The delays ofcongestion cause both labor and fuel costs to rise sharply. Moreover,congestion is particularly severe on the main bus routes where mostbus passengers are to be found. Congestion delays to buses are, inany case, greater than for automobiles; to the increased difficultiesof pulling into and out of bus stops is added "bunching" of buseswhich greatly increases average time at stops. Capital costs also risesince with lower speeds and "bunching" more buses are required tomove the peak-hour passenger volume. Costs per passenger-mile,now typically a little over 2 cents, may, however, rise proportionatelyless than costs per bus-mile. During peak periods, the greater numberof passengers carried per bus may offset the lower number of bustrips. Passengers suffer from congestion primarily through longertimes spent in waiting, boarding and traveling and considerablygreater discomfort.
Travel by private automobile is, of course, much more expensive.Typical costs now probably fall in the range of 15 to 20 cents perautomobile-mile in most cities of developing countries, or an averageof around 9 cents per passenger-mile. This is about five times the costof bus travel per passenger, or three times if cars are loaded near tocapacity, as, for example, when car pools are formed. Differentialsare still larger if allowance is made for parking expenses.
Once a car is owned, however, the difference between the runningcost of using the car and the bus fare is generally much too small toattract car users to the bus. Unlike buses, capital costs of automobilesrepresent a high proportion of total costs largely because automobilesrun for fewer miles and the driver is not paid. The running costs whichvary with car use generally do not exceed 9 cents a mile giving anaverage of about 4 cents a passenger-mile. This is not so much abovethe level of bus costs and fares as to offset the automobile's greatadvantages of convenience and speed. Moreover, "perceived" auto-mobile costs are below actual running costs since some costs whichvary with mileage, such as part of depreciation, are usually under-estimated by owners.
In the "stop and go" conditions of congestion the advantages ofautomobiles are greater in comparison with buses. Fuel costs rise,but not by more than one or two cents a passenger-mile; total costsare proportionately little affected. Passengers lose less time than in thecase of buses, partly due to the automobile's ability to use less con-
28

gested routes, and comfort is relatively little affected. The dangers ofencouraging the use of private automobiles at uneconomic rates arethus increased. in the cities of developing countries, where publictransport typically accounts for a high proportion of trips other thanwalking, a shift of even a few percent of passengers to private auto-mobiles can cause a dramatic intensification of congestion and furtherincrease bus and commercial traffic operating costs.
Commercial vehicles, like buses, are severely affected by conges-tion. Labor costs represent a large part of operating costs and con-gestion delays increase this element and at the same time necessitatea larger fleet of vehicles to move the same quantity of goods. "Stop-go" conditions raise fuel costs substantially and also depreciation.increased uncertainty of delivery times can also have important reper-cussions on production and selling costs. Moreover, congestion isoften particularly acute around such areas as docks and marketswhich are primary destinations of commercial traffic.
The Possibilities of Mass TransitIn this dilemma of higher track and operating expenses for road
vehicles, attention is inevitably directed toward the separation ofdifferent types of traffic, and particularly public transport, so as toreduce interferences between vehicles of differing characteristics andensure essential services. The potential of reserved lanes and trafficengineering for partial segregation of public transport is consideredin the following chapter. It may be noted here that this potential isimportant but, beyond a certain point, is subject to many limitations.More radical is the provision of mass transit on separated rights-of-way, either above or below ground, so that public transport canoperate unimpeded while releasing road capacity for other traffic.
The basic difficulties with mass transit solutions are two. First, theminimum capacity of any separate right-of-way established for publictransport is very large while costs of construction are inevitably high.Construction costs of metros, for instance, typically average in excessof $10 million a lane-mile and are much higher than this where tun-neling conditions are difficult. Capital costs for surface tracks areless, but costs per passenger-mile are still likely to be prohibitiveunless traffic volumes are very large, including substantial volumes atoff-peak periods to help defray the costs of rolling stock and staffneeded for the peaks.
The second difficulty is that separated rights-of-way, particularlyfor rail traffic, are constrained in the sense that once a route has beendeveloped, it is fixed in location and limited as to type of traffic. In
29

combination with the cost/capacity constraint, several consequencesfollow. Feeder services are required to extend the segregated trackservice into areas of low traffic density. Further, the need for inter-changes, and the necessary delays caused by starting, stopping, andtaking on passengers mean that average speeds of travel by masstransit do not in practice rise much above 20 miles an hour, at leastwhere stops are frequent.
The space specificity of urban railways and metros can create aserious danger of accentuating the traffic problems that they aredesigned to reduce. Employment location around central area stationsis at a premium since transfers to other modes are thereby avoidedwhile maximum benefit is derived from the speed and other con-veniences of the railway or metro. Workers traveling by other modes,however, are then also attracted to this small highly concentratedarea by the increased employment opportunities. Road congestionmay eventually increase rather than decrease as a result of providingrail or metro facilities.7
These characteristics are considered in greater detail in Annex 5.As a reflection of the inherent constraints, however, it may be notedthat there are only 25 major metro systems currently in operation,though nearly half of them have been added in the last two decades.Of these, all but five are in cities with populations above 2 million.All but six have an annual ridership in excess of 100 million rising, inthe case of Moscow, to over 1,500 million. The only two in this rangein the developing countries are those of Buenos Aires and MexicoCity, though these can be expected shortly to be joined by Sao Pauloand Seoul. The fares charged on the more recent systems vary froma minimum of about 12 cents for a short journey in the case of MexicoCity to 30 cents in the case of Toronto. Fare levels such as these areclearly beyond the incomes of the poorer classes of population inmost of the larger Asian and African cities.
To escape from the constraints of urban rail and metro systems andyet reap the advantages of separated rights-of-way, segregated bus-ways may provide an attractive alternative for coping with high vol-umes of passengers. Practical implementations of busways have sofar been few. They appear, nevertheless, to offer considerable poten-tial, particularly for the developing countries where volumes of buspassengers in relation to urban populations should be much higherthan in developed countries. Ordinary buses can be used, which can
'Some of these difficulties may be avoided by the use of streetcars and other light railwayswhich have greater flexibility and certain other advantages; but these modes are particu-larly prone to interference by other traffic at intersections and consequently lose muchof the advantage of segregation.
30

enter and leave the busway to provide feeder services. Moreover, aseparate right-of-way may not be needed for anything like the wholelength of the route, nor for the entire day, nor to be so exclusive asfor rail. Other public vehicles such as minibuses and taxis, or essentialservice vehicles such as ambulances, can be permitted to use the sametrack where excess capacity above bus use is available, as it normallywill be. As to costs, the available evidence indicates that high capacitybusways may often be more economical than new railways for devel-oping countries. Recent studies in several cities indicate costs of trackof the order of $1 million to $2 million a lane-mile as typical, com-paring favorably with new rail track, while costs per passenger ofvehicles and signaling are also lower.
Busways tend to require considerably more surface area thanmetros and ventilation to evacuate exhaust fumes may greatly increasethe cost of any deep tunneling involved. These factors may precludebringing busways into the heart of the business district. It may alsoprove administratively difficult to exclude other traffic in conditionsof some developing country cities.
To summarize, if events are allowed to take their course, the pros-pects for urban transport in developing countries are of seriouslydeteriorating conditions. Shortage of resources, rapidly increasingdemand and rising road costs threaten to lead to more congestion anda strong upward trend in the general level of urban transport costs.Because of high infrastructure costs, metros and other forms of masstransit on separated rights-of-way can at best only contribute to asolution. Higher transport costs will be reflected in higher costs ofproduction,or reduce the gains from increasing productivity. Personalstandards of living also stand to be adversely affected by delays,reduced comfort of travel and deterioration of physical and socialenvironment.
31

Chapter 3: RATIONALIZING THE USE OFTRANSPORT FACILITIES
The prospect of sharply deteriorating conditions, if present trendsare allowed to continue unchecked, makes urgent a reconsiderationof policies affecting urban transport. Three main directions for im-provements are evident. They are: first, securing more rational use oftransport facilities and particularly road space; second, improving theefficiency of transport undertakings and their coordination; and third,reducing transport requirements through improvements in the physi-cal structure of urban development.
In each of these fields, practical opportunities for effective actionare often larger in developing than in developed countries. Levels ofmotorization are still relatively low; hence, a wider choice of alterna-tives exists for future patterns of urban transport. Efficiency of urbantransport operations is often very poor; the scope for improvements iscorrespondingly large. As half of the city area of 10 years hence hasnot yet been built and changes in land use are extremely rapid, theoptions of future physical form are much wider despite the shortageof resources.
This chapter examines the potential for policy changes to securemore rational use of transport facilities. In all countries, restraintsare placed, to a greater or lesser degree, on the rights of individualsto use road space-particularly when such use impinges on the extentto which others can use the road, as happens in conditions of con-gestion. Current conditions, nevertheless, indicate an urgent need toexamine more closely the justification and effects of differing typesof restraints. Of these, pricing measures for charging the economiccosts involved merit, and are given, first consideration. As pricingmeasures appear unlikely to be sufficient by themselves to ensureessential transport services, it is also necessary to consider variousmeasures of physical restraint that can help produce a better balance.If basic commuting services are to function adequately, specific roadpriorities must be accorded to public transport, cyclists and pedes-trians to reduce interference from other traffic.
Pricing MeasuresPrivate automobiles require a disproportionate amount of road
space per passenger as compared with other modes of passengertransport. As a result, in congested areas private automobiles inflicCheavy costs on other road users as well as nonroad users. These costs
32

are not reflected in higher charges for use of congested roads by auto-mobiles. In such conditions where vehicle owners do not bear thefull costs of their use, the market mechanism does not work to pro-duce efficiency. Each individual using the road may be making thecorrect decision so far as he is concerned but not so far as all roadusers or the community is concerned.
Congestion pricing: There is by now broad agreement on therationale for estimating appropriate pricing for use of congestedroads. Where traffic volume is such in relation to capacity that eachvehicle interferes significantly with the functioning of others, eco-nomic efficiency would be gained by making each vehicle on the roadbear the costs that its addition on the road imposes on others. Alltrips the value of which to the persons making them is less than thevalue of delays and other operating costs caused to others wouldthereby be eliminated. To compensate for other inconveniencescaused to nonroad users such as pollution, noise, and environmentaldegradation, an additional element should be included in the conges-tion charge. Any lower level of pricing results in too many vehiclesusing the high cost facilities with consequent excessive congestionand loss of efficiency. That taxes on private vehicles in total oftenexceed the current level of public road expenditures is not, in thesecircumstances, relevant.
The precise formulation of appropriate levels of congestioncharges raises difficulties.' But these are generally not of importancein practice since existing charges are so far below the optimum foreconomic efficiency that the choice of any of the alternative criteriaput forward would result in a very marked improvement. Various esti-mates indicate that vehicles should typically be charged at least adollar a day for the use of central area roads at peak hours; and mostestimates are for several times this amount.
No country has yet instituted a satisfactory system of charging foruse of congested roads, although various schemes are now underconsideration both in developed and developing countries. Politicaland technical difficulties are involved, with the former probably themore important. Decision makers are under strong pressure fromcar owners who are naturally averse to higher charges and discountpossible benefits. There is also a more general opposition to rationingroad space provided for public use by the power of the purse. In pre-
'The difficulties include estimating in advance how much traffic levels will fall withincreased charges. This is needed for determining the appropriate charges. An alternative*s sometimes suggested of levying charges in accordance with the cost per vehicle ofexpanding capacity in the area concerned, or of expanding capacity elsewhere to giverelief to that area.
33

vailing conditions of income distribution, the rich could readily ab-sorb charges that would weigh heavily on the politically powerfulmarginal car owners many of whom will have invested in automobilesand based their residence location on the use of the automobile forcommuting. The benefits from congestion pricing of cheaper andfaster travel for those who do not use private cars are rarely give;adequate consideration.
It has proved technically difficult to devise systems of congestioncharging that are efficient in incidence, feasible in terms of implemen-tation and without important adverse side effects. Annex 6 reviewsthe merits of various forms of vehicle and road use charging. A pack-age of measures including a system of daily charges for the use ofroads in central areas at peak hours in combination with economicparking charges may be the most appropriate.
The case for starting immediately with a program for progressivelyraising charges for the use of congested roads is strong; delay in-creases the political difficulties since the number of private automo-bile owners is growing rapidly. Both the opportunity for introducingcongestion charging at an early stage of motorization and the overallshortage of resources make such charging far more desirable in thedeveloping countries than even in the developed. In principle, busesshould also be subject to congestion charging. However, at least untilthe private automobile is rationally charged, exempting buses fromcongestion charges appears justified; the charge per passenger wouldin any case be quite small compared with the private automobile.
Where congestion charges cannot for any reason be introduced,higher general taxes on ownership of automobiles and/or quotas arelikely to provide the only effective alternative pricing method forensuring adequate road space for essential purposes. With automo-bile ownership in developing countries so heavily concentrated onthe urban centers and use in peak hours, the losses involved fromunnecessarily restricting automobile use of uncongested roads maybe more than offset by the advantages of restraining use on congestedroads. Overall fiscal and foreign exchange considerations, too, oftenfavor use of general ownership taxes. From the point of view ofrational use of roads, however, this is a distinctly "second-best" solu-tion. Off-peak use is in practice likely to be more restrained than therelatively essential peak use for work trips. At high tax rates, the im-pact on use of private automobiles for business becomes an increas-ingly important drawback. If commercial vehicles are excluded fromthe taxes, they tend to be used increasingly for passenger trips.
Just how much effect congestion charges or more general taxeswill have in reducing peak-hour congestion cannot be readily deter-
34

mined in advance. There is no real experience and little accurateknowledge of the latent demand, and too much depends on the pre-cise method of charging and efficiency of implementation. Hence,effects need to be monitored and charging policies adaptedaccordingly.* It would, nevertheless, be unwise to anticipate any spectacularreduction in levels of congestion as a result of such charges, as it maybe politically feasible to introduce at any one time. Such is the extentof latent demand and the underlying rate of increase of requirementsfor urban transport in most cities of developing countries that theimpact on the total flow of vehicles may not be very obvious. Demandis likely to catch up quickly with road space released by betterpricing.2
To deduce that increased charges are irrelevant would, however,be wrong. The main benefits lie in changes in traffic composition, inreductions in underlying demand and in impacts on urban form.Buses and other public transport vehicles will gain in speed and costsrelative to private vehicles as a result of congestion charges; a largertotal volume of passengers will be transported for any given degreeof congestion. Reductions in private vehicle peak-hour volume willlessen pressure for additional transport infrastructure. Financial re-sources will be mobilized through the charges. In the longer run, thelargest beneficial results may well be the influence on location, par-ticularly in reducing pressures to urban sprawl. This aspect is dis-cussed in greater detail in the chapter, "Transport and Urban Form."
Congestion charges also place the authorities in a much betterposition to assess what additional transport facilities are economicallyjustified. The apparent advantages of additional transport capacityare exaggerated by unnecessary congestion on existing roads-but byan amount which it is difficult to analyze in the absence of charges.Moreover, the subsidization of road users limits the fares that can becharged for rail transport, contributing to the lack of profitability ofrail systems and deterring investment in them. These points are con-sidered further in the discussion of methodology in Annex 7.
Fare differentiation: Higher public transport charges at peak hoursare also often advocated as a method of curbing travel at peak hourswhen costs are highest. Operating costs per public transport vehicle
'Several studies have indicated possibilities of congestion and parking charges reducingtraffic flows by about one-fifth. But automobile ownership is frequently increasing at ratesof 10% to 20% a year so that, if incomes continue to grow, the trend will only temporarilybe halted. Moreover, in some cities, official and company cars are a high proportion ofIotal private vehicles and, at least in the short run, their use is likely to be inelastic to taxincreases or congestion charges. It is indicative that increases in gasoline prices of 50%seem to have produced reductions in gasoline use of less than 10% in many countries andhave had probably even less effect on peak-hour automobile use.
35

are indeed substantially higher at peak hours due to delays. But asthese costs are shared by the many more passengers squeezed intothe vehicles at peak hours, costs per passenger may move either way-Put another way, peak-hour pricing does in fact occur through themuch lower levels of comfort and speed offered for the same fare-thus effectively dissuading those passengers who can convenientWytravel at another time. Remaining passenger travel demand for trans-port at peak hours is likely to be relatively inelastic, being confinedlargely to essential travel such as journeys to work. The major effectof raising prices will then simply be to force the poorest passengersto walk.3
To maximize the use of fixed investment in urban transport does,on the contrary, require consideration of reduced fares during slackperiods providing that the fares cover the marginal costs of vehicleoperation. The lower fare will not attract many travelers from peakperiods due to the essential nature of most peak-hour traffic. But theywill greatly increase travel opportunities for many citizens who can-not afford the regular fares. Overall, off-peak demand for publictransport should be much more elastic to fare reductions than indeveloped countries, where price is a lesser limitation and the auto-mobile is much more available.4
Economic efficiency also points to varying fares with the distancetraveled. Flat rate fares subsidize passengers traveling longer dis-tances at the expense of those traveling shorter distances, thusencouraging longer trips and urban spread. If routes are short, how-ever, the delays caused and other costs of fare differentiation mayoutweigh the gains.
Measures of Physical ControlFor reasons indicated earlier, pricing measures generally cannot
be expected to be introduced to the full extent indicated by economicefficiency considerations and, in any case, substantial congestionneeds to be tolerated if benefits are to justify expensive new transportcapacity. The highly skewed income distributions favoring privateautomobile traffic, and the large uncosted "diseconomies" adverselyaffecting the physical and social environment, translate into a needfor additional measures to ensure the transport functions most vitalto the city's efficiency. Such additional measures may be of an admin-istrative nature including variation in hours of work, or general physi-
31f, however, fares are too low to cover costs, so that numbers of buses and service arecurtailed due to lack of finance, a general increase in fares may nevertheless be indicated.'See also the discussion of subsidies in the following chapter.
36

cal restraints designed to allocate road space more efficiently, ortraffic engineering to improve traffic flows and give priority to publictransport and other essential traffic.
Staggered work hours: Staggering hours of travel, lengthening thepeak period but reducing the intensity of congestion, occurs to someVxtent naturally as congestion increases. A more efficient spreadingof the travel loads is also possible through the phasing of hours ofwork, particularly of government offices, shops and schools.5 Thescope for such improvement depends on the extent and intensity ofthe peak period and may not be large where peak periods are alreadylong. The inconveniences and costs involved in differentiated workinghours must be carefully weighed against the advantages of reducingthe costs of additional peak-hour transport capacity.
Regulations limiting hours for deliveries of goods in congestedareas may also be justified, particularly as parking charges have muchless effect on commercial than on private automobile traffic. Suchregulations can also be extended on environmental grounds to limitnoise and nuisance at night. While regulations on commercial trafficare in extensive use, it is by no means apparent that the economiccosts have been sufficiently weighed against alternative restraintson other traffic.
General physical restraints: Because of the complexity of speciallicenses for the use of congested roads, general physical restraintsor prohibitions of private vehicles at peak times in specified areas arebeing increasingly resorted to.6 The practical difficulty in developingcountries of collecting charges for street parking may itself justifycomplete prohibition of parking in congested areas. Like speciallicenses and parking charges, complete parking prohibitions disad-vantage vehicle owners who live and work in the controlled areas.Vehicles driving through the area or vehicles which are providedwith parking on private premises are, on the contrary, favored. In thisconnection, some municipalities are now setting maximum limits onnew parking space provided in new office buildings, an approach thatdeserves more general consideration. Diversion of through traffic byphysical obstructions and signaling to roads outside the main con-gested area also merit consideration as also the use of signals to dis-suade traffic by increasing the time required to reach destinations indistricts particularly vulnerable to congestion.
'In Singapore, the spacing of school and commuter travel allows school buses to be usedalso for carrying commuters to and from work.6Quota systems on imports can also be regarded as an extreme form of physical prohibi-tion. Quota systems are considered in Annex 6.
37
The largest restraint to traffic in most big cities, however, remainsthat of congestion itself. Given the extent of demand, congestionappears likely to retain this role in the foreseeable future. The controlexercised by congestion on the pattern of urban growth is automatic.Difficult decision making is minimized-but at the cost of an uneco-nomic, time-consuming system of rationing. As congestion does notreduce latent demand, political pressures for large, and often uneco-nomic, highway expenditures remain. Congestion can, however, bemore or less inefficient in its impact. If signaling and other physicalrestraints are used purposely to create bottlenecks at places wherethe queuing that results has little further impact, speeds and capacityof roads beyond the bottlenecks may be increased and the overalllevel of delays diminished.7
General physical restraints have certain inherent disadvantages.Traffic is impeded at times when this serves no purpose. It is difficultto ensure that congestion is not just transferred elsewhere. Inevitably,too, the incidence of physical restraints varies from one traveler toanother, often in ways which are inequitable or politically unaccept-able. Business contacts and, more generally, trips traversing the sectormay be seriously disrupted even when reasonable transport alterna-tives do not exist.
Traffic engineering and priorities: A more positive approach topromoting efficient use of transport facilities is by traffic engineeringto reduce the obstruction that different flows of traffic cause to eachother, particularly at intersections.8 Effective road capacity can, insome cases, be increased by 500/o or more by installation of coordi-nated signal control, by intersection redesign or elimination, and byother control measures. Similar opportunities exist in the upgradingof urban rail systems. It is surprising how often such possibilities areneglected in favor of much more costly road expansion.
Traffic engineering, however, needs to be associated much moreclosely than in the past with ensuring the adequacy of basic transportservices. Road capacity in terms of passengers rather than vehiclescould be increased even more if improvement in public rather thanprivate transport became the focus of attention. Specific measures todisentangle buses from traffic congestion such as priorities for buses7Various schemes have been developed in European and American cities to meter trafficon to congested roads so as to prevent conditions of hypercongestion irom emerging andto maximize traffic flows. It is often difficult, however, to find locations for restrictingflows so that the benefits are not offset by the resulting back-ups.8'ntersections generally have half or less of the combined capacity of the intersectingroads- Prohibition of street parking without measures to increase intersection capacitymay, therefore, have limited advantages for traffic flows. One-way street solutions needto be treated with caution as the increased distance traveled may more than offset theincrease in speed achieved.
38

at intersections, reserved bus lanes and limited access streets are ofparticular importance. Buses can also be allowed to traverse physicalbarriers arranged to prevent through traffic of other vehicles. Streetarrangements permitting quick turn-round of buses and reducedboarding times can also be effective. It may be possible, by suchmeans, to offset a significant part of the inherent time disadvantagesof travel by bus as compared with travel by private automobile.9 Un-fortunately, priorities for buses in congested areas often raise severeproblems of traffic management, and may not be easy to implementwithout undue inconvenience to others.'0 This inconvenience canbe somewhat lessened by limiting priorities to peak periods ofcongestion.
The requirements of pedestrians and cyclists clearly deserve fargreater attention than they have received. In the poorer cities of thedeveloping countries, large sections of the population will continueto be unable to afford public transport. Curtailment of sidewalks toincrease road vehicle capacity should only be undertaken after muchmore careful evaluation than is customary. Indeed, considerationneeds to be given to closing of some streets to vehicular traffic at peakperiods where this will increase total person flows. Shopping pre-cincts such as are being increasingly adopted in many European citiesin recent years, and which already exist in the suks and bazaars ofmany cities of developing countries, have also many advantages."1
Separate tracks for cycles and motor-assisted cycles offer consider-able potential both for the cyclists and to other traffic. As noted inAnnex 5, cycling has great advantages as a cheap and relatively fastform of transport, but in mixed traffic these advantages are greatlyreduced and interference with other traffic grows. The simplicity ofcycle tracks does not reflect their importanceS, though it often leadsto neglect of their potential. Failure to provide adequately for pedes-trians and cyclists will on the one hand unnecessarily increase thedemand for more expensive motorized transport and, on the other,greatly reduce accessibility for those who cannot afford motorized
'Reduction of congestion for buses increases reliability and reduces the time that has tobe allowed for failure of the bus to arrive or for it to be full. Bus stops more convenientto bus passengers may also be warranted even if some additional delay is caused to privatevehicles.
"0Several experiments are now in progress, particularly in the United Kingdom, to provideunobstructed but not necessarily exclusive rights-of-way for public transit vehicles bypriority of entry onto roads on which the total flow is restricted to free-flow conditions bymonitoring. Reserved lanes for buses and taxis in the contraflow direction on one waystreets or approach roads to central areas may also help.
"I/nitial opposition by shop owners to these schemes has generally been replaced byenthusiasm in the longer run. However, particularly in large cities, requirements for alter-native routes for vehicle through traffic generally limit the schemes to fairly small areas.
39

transport. This is most clearly seen in cases such as Jakarta whereroad widening in central districts has been accompanied by failure toprovide adequate pedestrian ways and the banning of "bekjas"-acheap but slow-moving cycle-powered taxi. The mobility of the poorhas been greatly reduced in consequence. Provision of separate trackfor cycles and other slow-moving traffic, rather than their banning forthe convenience of motorists, is rarely in practice given the seriousconsideration it deserves.
40

Chapter 4: PROMOTING EFFICIENCY ANDCOORDINATION AMONG AGENCIES
The measures discussed above to promote a more rational use oftr'ansport facilities by economic pricing, physical restraints, andpriorities for essential services require supporting action to strengthenthe agencies involved in supplying transport services. Purposefulaction over considerable periods is involved in achieving efficiencyof individual transport undertakings, in ensuring a more appropriatebalance between different forms of public transport, and in develop-ing methods of coordination that result in an economical integratedtransport system in which the different elements complement eachother.
Public Transport OperationsStandards of management and efficiency of publicly run transport
undertakings in developing countries vary greatly but are in generalpoor. Lack of finance and outdated regulations are contributorycauses, but so also are more general problems of neglect. Urban rail-ways in particular often suffer from low management attraction dueto reputations of being the most problem-ridden and loss-makingsections of national railway systems. Such aspects point to the needfor a concerted attack on several fronts to reverse current neglect andimprove efficiency.
In municipal bus and urban rail companies possibilities for im-proved efficiency are very evident. Variations in standards of service,costs, and operating ratios are too great to be justified solely by theinevitably differing conditions from city to city. Wide variations instaffing ratios-employees per bus may vary from around 3 to over10-and maintenance and repair schedules provide further evidence.Technical assistance can be of great value here in spotlighting defi-ciencies, and, if given sufficient political backing, in promoting reme-dies. Private bus and intermediate personal transport undertakingsgenerally appear more efficiently run.
In this context, attention urgently needs to be focused on the finan-cial situation of public transport agencies. Cheapness of public trans-port services is of primary concern in most cities of the developingworld. The emphasis must, however, be on reducing costs and notsimply on keeping down fares. For the majority of the urban inhabi-tanrits, speed and comfort are certainly of low importance comparedwith fares, and lower levels of service than in richer countries are
41
hence appropriate. But reluctance to permit fare increases when costshave risen results, in all too many cases, in the decapitalization of thecompanies even with extreme overcrowding of serviceable vehicles.Neglect of finance for municipal bus and urban rail undertakingsby national and international institutions has clearly not helped.
The consequent lack of resources is a major cause of continueduse of obsolete vehicles, very high rates of breakdown, of workshopsconcentrated on emergency repairs to the exclusion of routine main-tenance, and of vehicles standing idle for want of spare parts. In thecase of bus companies, repair facilities have not been expanded orreequipped in line with the increase in bus fleets; they often becomepoorly located as the cities continue to expand.
These conditions greatly accentuate problems of raising fares toadequate levels. Opposition to fare increases must in any case beexpected to be politically more explosive in developing than in devel-oped countries, such is their importance to the urban poor. Butdeteriorating services inevitably further strengthen the opposition.Improvements of efficiency and fare increases should hence be re-lated where possible; this may require "bridging" finance.
By no means all the troubles, however, are attributable to inade-quate fares and shortage of external finance. The fares which areinadequate for public undertakings are often profitable for inde-pendent bus companies with lower overheads. Overstaffing is fre-quently a major cause of poor performance of municipal bus andurban rail companies; strong political backing is required for its reso-lution. General management weaknesses are an important contribut-ing factor and to resolve them requires official action as also in thecase of inadequacies of the regulatory authorities discussed later inthis chapter.
Subsidies for Public TransportIt is in the wider context of operating efficiency rather than of
financial difficulties that subsidization of public transport deservesprimarily to be considered. First, however, it may be noted thatwhere, as is prevalent in developing countries, public transport under-takings are required to provide some services free or at fares belowcosts, for example to school children or police, financial transfers frompublic funds to cover the extra costs borne by the undertaking aregenerally justified. The requirement to carry such passengers belowcost may itself be questioned, however, as it is by no means evidentlythe best way to promote welfare even when instituted on sociialgrounds.
42

More difficult to judge are cases where the costs of carrying addi-tional passengers are less than average operating costs, so that a lossis.or would be incurred at fares which meet "efficiency" tests of mar-ginal pricing. Such cases may occur, for instance, when surplus trackcapacity exists in mass transit systems. Fares higher than the efficiencyprice, such as fares based on average costs, may in such circumstancesincrease net revenues but cause a more than corresponding loss inconsumer benefits-from less use of the service and from the highercharges on those who do not use the service.'
A case for subsidies to public transport can also be made whereabsence of congestion charges strongly favors the private car. A sub-sidy reducing bus fares may, in these circumstances, result in a closerapproximation to relative real costs and a better allocation of re-sources between modes-and even, in certain circumstances, to animproved allocation between urban transport and other sectors. Simi-lar arguments can be made in favor of subsidizing rail fares to com-pensate for implicit subsidies to underpriced users of congested roads,thereby promoting a more efficient division between road and rail.
Although these arguments for subsidies have considerable weightin specific circumstances, it is always important to ask what will beachieved by the subsidy in the precise form proposed, what the alter-natives and the practical drawbacks are. A general subsidy coveringa deficit creates the risk of producing financial irresponsibility ratherthan promoting efficient operation. Hence, any subsidy should be tiedto the achievement of precise objectives in terms of development ofnew services, frequency and reliability of services, possible loweringof fares, or other specific improvements.
In assessing what the subsidy will achieve, long-term as well asshort-term effects must be considered. Provision of transport belowcost, whether public or private, increases transport use and exertsadditional pressures on resources. People will choose more outlyingresidences. Employment eventually tends to become more dispersed.Pressures to build more and higher-standard roads are accentuated.The addition of urban transport riders to the ranks of subsidized trav-elers accentuates tendencies to urban sprawl and may, as suggestedlater, have serious adverse impacts on urban patterns.
Nevertheless, failure to provide financial support to public trans-port when no feasible alternative exists in the short run for maintain-ing or improving the public transport service certainly can prove more
'Account should also be taken of the congestion caused by transfers of public transportpassengers to private automobiles due to fares above marginal costs. More congestion, intuin, leads to greater expenditure on roads and a reduction in quality of bus service. Thiseffect, however, appears unlikely to be of great importance except in the richer devel-oping countries.
43

costly than a well designed subsidy from both economic and socialviewpoints. This is particularly true if subsidies are tied to expansionof the service rather than designed primarily to help existing riders.Even so, a careful assessment of the local conditions is needed beforea case for the subsidy can be substantiated. Who gets the subsidy andwho pays for it are, in this respect, of particular importance. The caseis greatly weakened if the subsidy would effectively come from gen-eral taxes falling particularly heavily on the poor, many of whomcannot afford public transport anyway. In practice, moreover, theremay well be other public expenditures, for example on water supplyor health, that the poorwould prefer.
Development of Intermediate PersonalTransport Services
The wide income range between automobile owners and the urbanpoor of developing countries presents a need for a correspondinglywide spectrum of intermediate transport services. A bus service suffi-ciently cheap to be affordable by the large poorer groups of thecommunity involves standards of comfort and service very muchbelow those of the private automobile. Accordingly, if potential auto-mobile users are to have a reasonably attractive alternative, forms ofpersonal transport giving significantly better service than the normalbus but at costs appreciably below those of the automobile arerequired. At the other end of the spectrum, public transport usingolder vehicles with more standing room to provide even cheaper, ifslower, service than the regular bus may be advantageous for largegroups of poor citizens. Personal transport vehicles smaller than aregular bus can also fill an important need in districts where trafficis too low or roads are too difficult for regular bus services.
In the development of such intermediate personal transport sys-tems as minibuses with ensured seating, shared taxis and jitneys, theflexibility of small private enterprises can play a significant role. Butthis potential is often reduced by regulations designed largely to pro-tect bus systems from competition. Within the context of bus priori-ties and management improvement discussed earlier, there seemsoften no valid reason to deter competing intermediate personal trans-port services. On the contrary, the case is generally strong for givingthem some of the priorities accorded to buses, such as use of reservedlanes in congested areas, where this does not interfere with the busservice. Similar priorities may, under favorable circumstances, alsobe used to encourage private car pools. However, individual cityconditions vary so considerably that the impact of additional types of
44

transport services and priorities on existing public transport systemsneeds to be assessed on a case by case basis.
Problems of Coordination and RegulationIt is perhaps not surprising, since institutions tend to adapt slowly,
that the exceptional rates of urban expansion of the last two or threedecades have greatly increased the evidence of failures to developcomplementarity among urban transport services. Intercity roads aregenerally constructed with little attention to balancing capacity in theurban road distribution system; intercity bus and freight lines sufferalso from inadequate terminals and linkages with correspondingurban facilities. The wide variety of regulatory bodies involved greatlyincreases the difficulties of securing improvements. With urban trans-port systems so fragmented, it is often nobody's specific responsibilityto study the most advantageous interconnections and complementaryservices, or to iron out the physical difficulties and those of reallo-cating routes.
Perhaps less obvious, yet no less serious, are the failures of coordi-nation between transport operators and the public works departmentor other road building agencies. Bus routes, for example, are often notsupplied where most needed, as in outlying squatter areas, due inpart to inadequate roads. Traffic engineering usually gives scant atten-tion to the special needs of public transport and commercial vehicles.
No less important is the scope for making the various measures forurban transport improvement self-reinforcing by coordinated timing.Appropriate charging of congested roads will, for example, be morereadily acceptable if accompanied by promotion of intermediate per-sonal transport. Bus priorities are unlikely to be fully effective unlessaccompanied by other measures of traffic engineering and manage-ment. Fare increases can be timed to coincide with improvementsin service.
Institutional, political and legal frameworks vary too greatly topermit valid generalizations on the most appropriate institutionalforms for securing the requisite coordination. Urban transport author-ities covering all branches of the transport network are by no meansnecessarily the most effective answer. The dangers of slow-movinglarge bureaucracies involved in the actual operation of transportundertakings are evident. Critical examination of basic weaknessesin the transport system is apt to become more difficult if conductedby the entity responsible for operations. A single agency for operatingall bus and urban rail routes may provide great advantages in terms6f resolving problems of complementarity and raising capital. It mayalso succumb to the temptation of subsidizing unprofitable routes by
45

profitable ones to the detriment of the expansion of the more efficientservices. Restriction of more efficiently run private bus companiesmay then appear necessary to preserve financial viability.
Dangers in overregulation of urban transport services by regula-tory agencies are indeed evident. The development of new routes oradaptation of old ones is in practice often hampered by out-of-date.restrictions, a matter of particular concern in conditions of very rapidgrowth of cities and change in land use patterns. Intermediate per-sonal transport services tend to suffer particularly from inflexibleregulations. Here, as in many other aspects of urban transport plan-ning and regulation, consumer participation at some stage in thedecision-making process and the questioning of consumer prefer-ences have obvious importance.
Solutions to problems of coordination which avoid the dangers ofovercentralization and overregulation will often be found to includethe establishment of a small analytical and policy unit close to thecenter of municipal decision making. The major issues are not merelytechnical; they generally involve evaluation of gains and losses todifferent groups of citizens and the performance of managementsof the different agencies. Such a unit should ensure adequate contactsbetween the agencies and also provide a link with the wider aspectsof urban planning discussed below. The inevitable limitations of sucha unit need, however, to be borne in mind in allocating responsibil-ities, if it is not itself to become a bottleneck. Clearly, there is no shortor simple answer since local political conditions and personalitiesmust in practice also be taken into account.
46

Chapter 5: TRANSPORT ANDURBAN FORM
The third main field for urban transport improvements is perhapsthe most fundamental, the achievement of urban physical patternswhich economize on costs of transport and other infrastructure butprovide improved access and living conditions. In developed coun-tries where changes in urban land use may amount to not more than1% or 2% a year, and where existing infrastructure is very large ascompared with annual additions, changes in urban form can be con-sidered as essentially long-term in nature. In the cities of developingcountries, land use change is many times more rapid, and urban areaand infrastructure often double in less than 10 years. The situation isthus radically different. Opportunities exist for greatly altering physi-cal urban patterns within a few years by closely relating the expansionof urban transport facilities with other measures for promoting de-sired patterns of land use.
The physical patterns of the cities of developing countries are, likethose of the developed countries, largely characterized by a centralbusiness district which accounts for a high proportion of total em-ployment-even though this district may be less well demarcated orconcentrated than in the developed countries and contain a lowerratio of office to other activities. At the focal point of the transportsystem, the central business district has the highest accessibility ofthe city area both in terms of ready access from anywhere in the cityand indeed places outside the city, and in terms of proximity of onebusiness to others. More and more activities tend to locate there solong as the great advantages of accessibility are maintained.
Laissez-faire policies accentuate tendencies to centralization. Inparticular, enlarging transport capacity to cope with already emergeddemands is likely to reinforce the relative accessibility advantages ofthe city center. Particularly, in conditions of infrastructure backlogtypical of the cities of developing countries, further demand is createdwherever new capacity is provided as people and businesses locateto derive benefit from the improved facilities. What tends to occur isan urban pattern based upon an increasing number of radial roadslike the spokes of a wheel. Such a pattern promotes concentrationon, and congestion in, the central business district. In the process,rents in the central area become too high for residences, particularlyof the poor, while low-density residential development at the periph-ery is encouraged, including areas of high income housing largely
47

dependent on automobile transport. Difficulties are created for cross-town traffic. Commercial traffic experiences increasing difficulty inavoiding the congested central area. Despite the congestion there,however, no other district has comparable access.
It is not at all evident, particularly in developing countries anddespite the obvious advantages gained by concentration of activities,that the predominance of the central business district is justified tothe extent found in the large cities. Most individual decisions to locatein the central area are based on expenses which do not reflect the fullcosts involved, including adverse impacts on others. The pricing ofurban services such as water and sewerage, or electricity and tele-phones, are rarely differentiated sufficiently to reflect the varyingcosts of supply in high- and low-density areas, near and far locations.Similarly, a decision to build a new office block in the central businessdistrict does not reflect the cost imposed on others through additionalcongestion and pollution. Betterment charges and land property taxesare not in practice adequate substitutes.
As the cities rapidly grow in size, many activities found in centralbusiness districts no longer need access to all parts of the city. Formany businesses, a smaller activity center with a transport networkserving a smaller population area and containing a small range ofactivities would suffice just as well. Indeed, such a location, if avail-able and with lower rents, would often be advantageous. Secondarycenters do indeed tend to emerge in the course of time. They arefavored where land use constraints are enforced on central districtbuildings and where alternative transport focal points are availabie-as in many North American cities where extensive suburban roadnetworks are combined with the mobility of private automobile trans-port. In a few cases, such as Croydon in the metropolitan Londonarea, the development of a subsidiary center may be carefully plannedand promoted. More frequently, selection of location is haphazard,but becomes self-reinforcing as in the case of the main city center.
For the developing countries the problem posed by the predomi-nance of the central business district and lack of secondary centerswith adequate transport networks are much graver than for the devel-oped countries due to lack of resources and competing claims. Thetendency toward a predominant single central district not onlyimposes long average trips but also means that the transport neededto support its growth is, as has been noted, progressively more expen-sive. With capital so scarce, it is prima facie undesirable that the trans-port infrastructure should frequently be used intensely in only onedirection at peak hours with large surplus capacity in the oppositedirection. That so much of the transport and public utility facilities
48

is concentrated in the central area and, in many cases, is largelyunused out of office hours on weekdays and at weekends also raisesquestions of the appropriateness of the system.
What is, in any case, clear is that the multimillion cities of poorerdeveloping countries cannot possibly afford the expressway and sub-way infrastructure required to support the degree of employmentconcentration in central business districts typical of major metropoli-tan areas in most of the developed world. Even if transport costs areeconomized by emphasis on public transport on ordinary roads withperhaps a few busways, the transport network costs and capacitieswill impose a maximum employment capacity of city centers at amuch lower level than in developed countries which can afford moreexpensive very high-volume mass transit systems to supplement nor-mal road traffic. The question of where other employment is to locateand of which type is, therefore, unavoidable.
In brief, the acute shortage of resources in the developing coun-tries makes it much more urgent than in developed countries to deviseless costly urban structures than the predominant single businessdistrict, automobile-oriented urban patterns of developed countries-while sacrificing as little as possible of the advantages of produc-tivity to be derived from specialization and close proximity of relatedactivities.
The Achievement of Better Urban PaUternsThere is no simple solution to the question of what is the best urban
form for the developing countries. Even if it were possible to startafresh from a "green field" situation, the functions of cities vary toogreatly to permit a single optimum pattern. What is appropriate fora relatively small industrial city based, say, on a steel plant will varyfrom one that is primarily a government center or from a metropolitancity area encompassing a wide range of functions. Differences inincome levels, customs and aspirations similarly require differentsolutions. The immediate needs and resource limitations of an Indiancity are further removed from those of the richer Latin Americancities than the latter are from those of European cities. Physical loca-tion and climate dictate other variations. Moreover, the existing citypatterns strongly affect what can and should be done in the way offuture expansion. In the developing countries much fnore than in thedeveloped, care needs to be taken not to waste existing capital.Schemes involving extensive reconstruction should be treated withcaution.* In the absence of a general optimal pattern, emphasis needs to beplaced on promoting urban structures which meet specified desired
49

criteria through urban expansion from the existing city layout; at-tempts to detail physical layouts of general applicability are likely tobe much less productive. This is not the place to discuss in depth the'many considerations involved in determining appropriate urban struc-tures to relate the very varied urban activities to the chosen objectives.The previous analysis, however, emphasizes certain aspects particu-.larly relevant to urban transport.
A primary consideration for developing countries is that a reason-ably close proximity of work and residence should be ensured, par-ticularly for the poor. So far as is economically reasonable, poorfamilies should be located within walking or cycling distance ofemployment centers. Possibilities of employment not only for theprincipal wage earner but also other members of the family need tobe taken into account. The urban structure should also allow publictransport to operate under favorable load and speed conditions.More generally, low population densities and consequent dispersedbuilt-up areas should be avoided since, as noted earlier, higher densi-ties can provide equivalent access with shorter street lengths, fewermotorized or urban rail trips, lower vehicle speeds and consequentlylower road or track design standards.'
Easier urban freight movement must also be a major consideration.Often the major cities are ports serving large parts of the nation.Adequate access to port areas from the intercity road and rail net-work, or from industrial estates, may require special trucking routesto bypass the existing center. Truck terminals and loading areas, andwholesale and retail markets, are required at locations which areefficient in terms of accessibility and avoidance of congestion. Relo-cation of existing markets, often centrally situated for historic reasonsand with inadequate capacity, is frequently needed. Particular atten-tion also needs to be given to the location of additional business andgovernment offices, educational establishments and the like for whicha central location is not so very important but which cause heavypeak-hour traffic in congested areas.
In what way, and to what extent, these various considerationsshould be reconciled and reflected in detailed urban physical plan-ning depends on many other factors, social as well as economic. Theeconomic factors include the influence of higher densities on costsof residential and other buildings, and on costs of sewerage and otherinfrastructure. Such relationships vary considerably from locality tolocality. Social factors include the importance attached to preserva-tion of open spaces and historic districts. Some promising general
'it is to be noted that high densities do not necessarily involve "high-rise" buildings.
50

lines of approach, and some important elements of required policychanges of wide applicability affecting urban transport, can neverthe-Jless be discerned.
For large metropolitan areas in developing countries, the promo-tion of new centers of activity near the present urban periphery
.deserves careful examination. Relatively high proportions of resi-dences should be contained in their land use. To provide a sufficientlyattractive level of accessibility, transport services radiating from thenew centers need to be provided and also improved public transportto join the new centers to the existing central business district.
Multinuclear urban forms should indeed have many advantagesfor the developing countries. While promoting close location ofmajor work centers and residences, they should also allow minorindustry to be located within residential areas without loss of contactwith the major centers. Peak-hour traffic flows on main arteries wouldbe in both directions to a much greater extent than with a singlebusiness district; cross traffic to other areas should be absorbed moreread ily.2
More generally, population groupings of 75,000 or more can inprinciple, if planned to integrate employment and residences, formcommunities within a city with a large degree of self-sufficiency. Byreducing transport to other city areas, overall transport needs wouldbe substantially lowered. Where expansion of urban areas has incor-porated small outlying centers, a basis may already exist for develop-ing such new nuclei. An alternative approach is through "activitycorridors" which should have many advantages for the operationof high-capacity, low-cost public transport. Given the urgency ofurban problems in developing countries, much more determinedefforts are now required to test the potential of such approaches inspecific localities.
Promotion of new activity centers with adequate accessibility toattract at least a part of the activities crowding into the central busi-ness district requires, however, a high minimum level of investmentin infrastructure including transport facilities to radiate from the newnodal points. As noted earlier, such facilities are available to a muchlesser degree outside the central area than in the cities of developedcountries where new activity centers can hence evolve much moreeasily.3 It has also to be noted that an incremental approach will often
2Economies should also occur through greater interchange of parking facilities.35imilar considerations apply to the difficulty of establishing new regional growth centersin developing countries where existing infrastructure, including the transport network,is sparse.
51

not suffice to attract enough businesses sufficiently quickly for theirmutually supporting activities to develop satisfactorily. This feature,combined with the costs involved, makes it apparent that not morethan one or two additional activity centers can generally be promoted'at a time. Similarly, it is unlikely that individual businesses can readilybreak away from the central area, despite the increasing rents, withoutthe help of appropriate land use and transport policies.
To remedy this situation and to use market forces to greater ad-vantage, action at several levels is required. It is necessary to relateboth urban land use regulations and urban transport developmentto the desired urban patterns; to ensure timely minimum levels ofinvestment in chosen centers of growth; and to adjust charges ortaxes so that costs to individuals more adequately reflect the fullsocial costs involved. The following paragraphs consider these aspectsin turn.
All towns have land use regulations but they are usually outdatedand poorly implemented. In developing countries, limitations onadministrative capacity no less than the rapidity of change make con-centration on effective broad frameworks of control more productivethan on detailed land use specification. Land use regulations need,in any case, to be supplemented by more positive action designatingnew growth centers and ensuring adequate infrastructure for them.As an interim measure, it may be desirable to introduce land usemeasures designed to preserve for the time being as high a level ofresidents in the central area as at present, for example, by increasedrestrictions on conversion of residential land to office building uses.
The use of urban transport to foster desired patterns of urbangrowth is closely allied to land use regulation. Transport has alwaysa strong influence on location; but the weaker the land use controls,the more important is the role of transport policy and investment asa guiding force. New transport facilities, by increasing accessibility,provide a positive inducement to location of activities; restrictionson use of existing transport facilities, or refusal to expand them, canprovide a negative one. Continuing city growth will require betterpublic transport and further concentration of at least some activitiesin central areas. But caution should be exercised in making majorimprovements to central access routes. Unless accompanied by meas-ures to make land use controls and planning more effective and bya conscious policy of promoting rational use of transport facilities,their effect may be to accentuate existing weaknesses in city structure.
The effectiveness of both land use regulations and transport facili-ties in promoting better urban patterns can be greatly helped by more.appropriate pricing. Congestion charging and greater differentiation
52
of prices of transport are of great importance in this respect, generallyfavoring employment concentration in central areas, but only to thepoint that is economically warranted. Public utility charges also needto be revised to reflect more accurately the differential costs involved.Property taxes provide a further wide field for relating charges moreclosely to the social costs and benefits involved. One possibility*deserving closer attention is for a special tax on those businesses incentral congested areas, such as many types of office work, wherevisitors during the day and local business trips by staff-an indicationof the essentiality of the location-are low as compared with thestaff employed.
At the local neighborhood level, much can be achieved by morecareful layout of urban extension areas to reduce the lengths of sur-faced roads required and to facilitate pedestrian, cyclist and publictransport. In many cases, surfaced road widths can appropriately belimited for some years while new settlements grow, so long as rights-of-way and foundations are planned for subsequent upgrading.Though individual schemes for local roads are generally small, in totalthey amount to a significant proportion of road expenditure and thusjustify a degree of attention to design cost control that is often lacking.Here as elsewhere, standards based on European or American prac-tice and dominance of the automobile are often adopted whenshorter-life, more economical standards and reserved ways wouldbe preferable.
Difficulties of Methodology and MeasurementAchievement of more appropriate urban transport and urban pat-
terns is seriously hampered by difficulties of evaluation. Costs oftransport should clearly be assessed at an early stage in preparingurban physical plans and in the context of alternative urban patternsand prospects for future urban growth. All too often, physical trans-port relationships based on supposed needs are established withinsufficient attention to the costs involved and possibilities of securingbetter alternatives by varying the urban form. Opportunities are there-by missed of major transport economies. The limitations of compre-hensive urban physical plans for periods of 20 or more years intothe future are by now increasingly recognized as is the need for lessambitious regulatory frameworks continuously adapted in the lightof experience. But as yet there is little evidence of effective planningof public transport services and facilities for walking and cycling asthe backbone of the transport system in new urban extension areas.* In part, the lack of effective consideration of alternative transportsolutions and their interrelation with urban form and costs of urban
53

expansion is due to problems of methodology and measurement.What cannot be measured is often ignored even though this mayexclude social effects of the greatest importance. Conventional urbantransport models, moreover, have basic weaknesses which stemlargely from the intricacies of the transport network, the complexity ofthe factors influencing demand, and the sequential treatment of in;fluences which are, in fact, interdependent. Congestion charging andother policy variables cannot be readily introduced, nor can the extentof suppressed demand and effects on traffic of acute congestion. Inbrief, the models are poorly adapted to major changes of urban form,function and transport modes. Periods of preparation generally ex-ceeding two years, and high costs, typically well over $500,000, addsubstantially to the basic drawbacks of spurious accuracy.4
For the cities of developing countries, the abruptness and rapidityof change in social and economic structure must, in any case, greatlylimit the usefulness of predictive methodologies. In such conditions,even in the unusual case of accurate time series being available, useof past relationships can readily lead to serious cumulative errors inprojections. The small proportion of current built-up area and infra-structure in the next 20 years widens the probable degree of error.In brief, conditions prevailing 20 or even 10 years from now can beforeseen even less clearly than in developed countries.
A strong case accordingly exists for developing strategic models toprovide in outline a series of widely differing alternatives of mutuallyconsistent future patterns of land use, incomes and transport designedto meet minimum objectives. Such models do not yet exist in satis-factory form. But transport relationships derived from a variety ofcities should be of considerable help in their development. Most ofthe different scenarios produced would be eliminated by examina-tion of their policy and investment implications and the extent towhich they meet or exceed the minimum objectives. To the remainingalternatives more complex tests, using parts of current methodologiesand models but also incorporating greater attention to secondaryeffects and social impact, would then be applied.
In view of the inevitable uncertainties of the future, a premiumshould be given to solutions for which the immediate investment pro-gram would also reasonably serve other alternatives, or could easilybe adapted to do so. The program should then be kept under reviewto introduce modifications as experience of actual developmentis gained.
4Annex 7 gives a more extended discussion of problems of models and methodology.
54

Such a process requires close coordination between planning unitsand other agencies, and also with the policy makers. Without somepolitical consensus on the urban form desired, long-term urbantransport investment decisions tend to be self-fulfilling in that theycreate the demand they are designed to satisfy. The requirementsand opportunities provided in related sectors may also be ignored.For example, improvements in the telephone system may signifi-cantly reduce the need for business trips. Furthermore, it needs to beadmitted frankly that there is no known way of accurately measuringall the considerations involved, let alone of welding them into a singlemeasure that will provide adequate comparison between alterna-tives. Value and political judgments are inevitably involved in comingto decisions; these are too important to be left to either the econo-mists or the planning technicians.
Care is particularly required in evaluating savings and losses oftime. If current income distribution is considered to be perverse andit is the intention to improve it, then it is illogical to use levels ofincome of different social groups as the basis for evaluation of bene-fits and losses such as those of travel time. To value savings of leisuretime of a poor man at one-tenth of leisure time savings of a man earn-ing ten times more-as is often done in current methodology-implicitly involves value decisions which are, or should be, outsidethe responsibility of the urban planner or model builder. Such prac-tices, and failure to test the assumptions, tend to lead to effectivepriority being given to the needs of automobiles in investment andpolicy packages. As pointed out in Annex 7, time savings must, ofcourse, be calculated as an important part of benefits, and for pur-poses of establishing consumer choices; but the effect on the calcu-lation of total benefits of using alternative values for time saved andlost should be made clear.
55

Chapter 6: ACTIVITIES OFTHE WORLD BANK
The Bank's ExperienceThe World Bank has had little experience in the field of urban
transport. Prior to 1972, several urban highways had been financed,but mainly as constituent parts of intercity highway projects. Experi-ence in urban railways had similarly been limited to a few com-ponents of railway projects of wider scope. In preparing theseprojects, the need for greater attention to their impact on system-wide urban traffic and on land use, and to their social effects,became apparent. The severity of the institutional and coordinationproblems, the complexity of the issues, and the importance of rela-tionships with more general urban planning problems, made it clearthat future urban transport projects would benefit from more com-prehensive treatment.
Since 1972, the Bank's interest in the urban transport sector hasgrown considerably. The assistance approved for three urban trans-port projects in 1973 and 1974-in Kuala Lumpur, Tehran and Tunis-is indicative of the growth. In addition to physical components ofroad building, traffic engineering, rehabilitation of bus and suburbanrail undertakings, and repair facilities, all three projects have beenassociated with important reforms in preparation and coordinationof urban transport programs. The projects are also providing tech-nical assistance and studies to aid management reform and longer-term policy formulation in the context of the physical pattern of urbangrowth. More broadly, the projects have dealt with immediate needsbut focused on longer-term issues.
The Bank has also recently acted as executing agent for the UnitedNations Development Programme (UNDP) in supervising urban trans-port studies in Singapore, Costa Rica and Bogota. Similar assistanceis being provided in Abidjan, Istanbul, Bangkok and Amman. Thesestudies involve several innovations. The Istanbul studies, for example,attempt some simplification of modeling to provide more rapid com-parisons of broad transport/land use alternatives. Many other urbantransport projects have been the subject of preliminary investigation.
The recent experience has demonstrated that wide opportunitiesdo exist for viable improvements in urban transport, but has alsoshown the absence of satisfactory, well-prepared projects ready for'early financing. In addition to severe management and coordination
56

problems and weaknesses of methodology, problems of financialviability of public transport undertakings have proved extremely-complex, sometimes being intensified by high-cost local assembly ofvehicles. Problems of ensuring competitive pricing of supplies arealso raised by small numbers of suppliers, potential economies from
,vehicle standardization and, in some cases, the specificity of designrequirements consequent on characteristics of the existing transportsystem.
Above all, the experience so far has emphasized the importanceof policy measures in achieving the full benefits of urban transportinvestments-as also the practical difficulties of adopting significantreforms. Though most evident in relation to policies concerning pri-vate automobiles, similar difficulties extend to the choice betweentypes of public transport, including intermediate personal transport,and to land use regulation. Opposition to new policies, while largelyof a political or social nature, also derives from absence of relevantexperience, or convincing studies, demonstrating the benefits thatmight be secured.
A no less pervasive lesson has been the size of the inputs of exper-tise required in preparing projects and the accompanying policymeasures. Long gestation periods appear inevitable due to the in-herent complexities and the long-run importance of the decisionstaken, not least the influence on the structure of urban development.The problem lies, however, even more in the shortage of expertise,locally and worldwide.
As a consequence of the complexity of the issues and the limita-tions of expertise, the burden on the Bank in the preparation andsupervision of the projects has proved particularly great. Insofar asextensive studies and technical assistance are required both beforeproject formulation and as an integral part of the projects in devel-oping longer-term policies, this supervision burden is roughlydoubled.
The most promising aspect of the experience so far has been thepolicy initiative engendered by project preparation and preliminarystudies. Significant institutional and policy changes, including meas-ures involving automobile restraint in congested areas, have resultedfrom these activities. The technical assistance and the studies incor-porated in recent projects seem likely to result in further progressin these directions.
The Bank's PolicyThe Bank's policy towards the urban transport sector was outlined
in the Urbanization: Sector Working Paper published in June 1972.
57
What follows is essentially an amplification of the basic approachoutlined earlier.
Major reasons for the hesitation in undertaking projects in theurban transport sector had been the size of the sector in relationto the Bank's resources, the difficulties of analysis and lack of exper-tise, the evident weakness of the institutions involved, and pricingand procurement problems. A contributing factor was the danger thatprojects for expansion of transport facilities would, directly or indi-rectly, largely serve the needs of the minority of the populationowning automobiles with possible adverse impact on the pattern ofurban expansion, general living standards and social balance.
On the other hand, the growth of the Bank's program in sectorssuch as agriculture, industry, intercity transport, ports and tourism,all of which add to the requirements for urban transport facilities andare dependent on them for full success, has made the exclusion ofurban transport projects appear increasingly illogical. Cities spendmore on the infrastructure and operation of urban transport, and willcontinue to do so in the foreseeable future, than on any other urbanservice. Waste and inefficiency in this expenditure cannot but haveserious consequences not only on the quality and level of urbantransport, but also on the efficiency of the whole urban and nationaleconomy. That the obvious deficiencies in this sector appear to bedue in part to neglect by both national and international agenciesgives added emphasis to this concern.
Perhaps the most cogent reason for involvement in this sector isprecisely its vital interconnection with the wider aspects of urbandevelopment that cause many of the difficulties of involvement.Urban transport is in many respects a leading influence in deter-mining urban patterns both physical and social. As such, projects andpolicies in this field lead directly into general policies and plans forimproving urban structure and productivity, and reducing urbanpoverty. The favorable impact of the projects can accordingly bemuch wider than the direct benefits in the transport sector, not leastin alleviating the conditions of the urban poor. In this connection,project packages for improvements in urban transport operationsand reductions in underlying distortions are not only justifiable ongrounds of efficiency but also in terms of social equity, since it is thepoor who, lacking the finance for alternative means of accessibility,inevitably suffer most from the inefficiencies and distortions.
Despite, however, the strong reasons for Bank involvement, onlya rather limited project program can be envisaged for the urban trans-port sector at the present time. This limitation stems less from thefinancial resources available-though the Bank's contribution will
58

inevitably remain very small in comparison with total investments inthis sector-than from the limitations of staff and consultants. The.desirability of more experience in a new and very difficult field beforeany major expansion provides a further reason for caution.
As a consequence, Bank operations in this sector must be highly.selective, and chosen for their potential demonstration impact andwidening of experience. A pragmatic approach, in which results aremonitored and programs and policies adapted in the light of theresults, is also indicated if effective action is to be initiated withoutundue delay. It has to be recognized that in the circumstances of thegreat complexities of the sector and weak methodologies, it is simplynot possible to evaluate all significant interlinkages and side effects.But this should not mean that action to secure greatly needed andobvious improvements is paralyzed by the search for a still betterbut elusive optimum solution.
Within these constraints, the most fundamental aspect of the Bank'sapproach must continue to be explicit recognition that policy devel-opment is at least as important as physical investment in the currentsituation of urban transport in developing countries. Accordingly,policy considerations must be given an essential role in the prepara-tion of all Bank projects in this field. Similarly, in view of the seriousinadequacies of institutions in this sector, the improvement of coor-dination and planning mechanisms, and reform of management ofpublic transport undertakings, must be basic elements in the justi-fication of the projects.
Current financial weaknesses make it necessary that close con-sideration also be given to measures to improve the financial viabilityof public undertakings in urban transport. It is recognized that sub-sidies may be justified. Nevertheless, in view of the importance ofmobilizing resources, and in the interest of promoting efficiency,support of subsidies will require specific justification.
In brief, urban transport projects presented to the Bank will beconsidered in the context of their contribution, direct and indirect,to the wider problems of improving the basic urban transport systemand the form of urban growth. Unless attention is concentrated onthese longer-term interlinkages, attempts to solve the urban transportproblems based on existing needs can easily aggravate the futuresituation.
In practice, this means that Bank lending for urban transport willbe concentrated in cities where the authorities demonstrate willing-ness to consider and implement bold measures progressively to adapttheir policies to the mounting pressures of rapid urban growth. It isnot possible in the abstract to define what constitutes satisfactory
59

actual or prospective progress in these fields of policy development,institutional reform and financial viability. It is obvious that policychanges in this sector involve not only serious difficulties but also.inevitable uncertainties. In the field of efficient charging of roadusage, no country has yet introduced a satisfactory scheme. There arefew guidelines of experience. It would, therefore, be unrealistic toexpect the rigor of a full congestion pricing policy to be adopted in asingle measure even where differentiated pricing of other publicgoods and services to cover full costs is habitual. Nevertheless, inview of the wide dependence of the success of projects to improvepublic transport on appropriate road pricing and supplementarymeasures, a demonstrable willingness to advance in this direction,must be regarded as a sine qua non for Bank support of such projects.
Even more evidently than in many other sectors, neither the policiesnor the institutions involved can be transformed in a period of a fewmonths, not least because so many agencies and interests are in-volved. These considerations point to the need for extended pro-grams of progressive improvements and also to two further aspectsof Bank policy in this sector. The Bank is prepared to consider con-tinuing relationships with cities in implementing a series of suitableurban transport projects combined with policy and institutional de-velopments that maintain initial momentum. Furthermore, as basis fora continuing program, technical assistance for management andpolicy formulation, and further studies which may be necessary willbe given consideration as an integral part of initial projects. The favor-able impact of the Bank's association should thereby be considerablystrengthened not only in the city concerned but also, through thedemonstration of the potential for improvements, in others.
The Five-Year Program, FY1975-79Against this background of general policy considerations and be-
cause of the length of time required to build up a pipeline of projectsin this sector, a considerable part of the program for the fiscal years1975-79 will consist of continuing studies and other preparatory work,and technical assistance. Physical projects seem likely to be limitedto an average of probably two per year, rising perhaps to three peryear by the end of the period. The program is expected to includefurther projects in two of the three cities to which urban transportloans have recently been made. However, given the small number ofprojects, only general indications of the balance and content of theproject program can be given until the outcome of current studies.and policy discussions becomes available.
60

In the perspective of promoting a continuing relationship, the pre-cise area of initial Bank involvement is to be considered less impor-tant than the prospect for building an effective relationship that canbe expanded over time to cover wider aspects of urban transport andurban planning. Nevertheless, the main areas of interest are suffi-ciently clear.
Priority will be given to projects supplementing basic transportsystems directed primarily to the needs of the great majority of urbanpopulations who cannot afford a private automobile, and for goodstraffic. Consideration will accordingly be given to bus and urban railsystems, including vehicles, repair shops, terminals, and road andtrack improvements required for efficient functioning. To reach thesmaller private and public enterprises providing communal transportservices, help may be routed through financial intermediaries; tech-nical assistance to build up suitable institutions for this purpose maybe included.
Particular attention will be given to projects catering for the manycyclists and pedestrians who cannot afford even low-cost public trans-port. Facilities for pedestrians and cyclists are generally sufficientlymodest in cost to be most conveniently included as components ofmore comprehensive projects; their importance is nonetheless high.Technical assistance on longer-term aspects of urban development isalso expected to stress these modes of travel.
Projects to expand facilities for commercial traffic are likely toinclude road access to port and industrial areas, including routesaround urban areas to avoid heavily congested districts. Linkagesbetween interurban or arterial roads and local networks are particu-larly relevant. Improved terminal and goods transit facilities are alsostrong candidates for consideration, including freight terminals whicheconomize on sorting and consolidation of goods shipments. Whole-sale markets are expected to offer a similar interest.
Particular attention will be paid to the potential for extracting themaximum advantage from existing transport infrastructure by trafficengineering and management projects. These may be separate proj-ects or components of larger projects.
The advantages of synchronizing action in several mutually rein-forcing aspects of urban transport, such as measures to increase roadcapacity, expand public transport services and introduce physical andpricing restraints on peak-hour traffic, have been stressed above. Inthis context, consideration will be given in suitable cases to Bankparticipation in financing more generalized urban transport programsand also urban development programs in which urban transport isa constituent part.
61

The Bank is currently involved in urban transport studies in some12 cities. New projects are likely to incorporate additional studies,particularly with regard to longer-term urban transport/land usepolicies and management, including location economies throughintegration of transport facilities into the planning of new urban ex-tension areas. In consequence, the total of studies in which the Bankis involved is scheduled to increase even though the heavy super-vision requirements of such studies are recognized.
Many Bank projects in other sectors, such as ports, airports, indus-try, public utilities, tourism and intercity transport have importantimplications for urban transport. It is not possible to assess all theseprojects for their impact on urban transport and urban physical form.But where such impact appears likely to be substantial, and particu-larly where cities are involved in which urban transport projects arecontemplated, an attemptwill be made to evaluate the impact; wheresuch evaluation indicates it to be desirable, complementary projectsin urban transport may be undertaken. Such activities will be con-ducted within the more general context of continuing efforts to ex-pand the evaluation of all Bank projects in urban areas to includewider economic and social aspects of urban development.
In view of the inadequacies of current methodology for analyzingurban transport problems and designing solutions, an attempt will bemade to stimulate further development of methodologies specificallyrelated to conditions in developing countries, though they are prob-ably of much wider interest. The Bank's effort will be directed towardthe integration of policy variables and alternative future conditions insimplified transport/land models, and to the more detailed assessmentof the socioeconomic impact of chosen strategies. This may involvea more pronounced and leading role for the Bank in this field if itappears that the necessary skills to support the rest of the programin this sector will not otherwise be developed within a reasonabletime. Operations research is also contemplated on the role of inter-mediate public transport in the provision of alternatives to both tra-ditional bus services and the private automobile.
Monitoring efforts will be emphasized in view of present defi-ciencies in experience. As more project packages are implemented,it should be possible to benefit increasingly from experience and toreduce project preparation time. The Bank is already providing helpin monitoring one ambitious urban transport scheme outside its ownproject program, that for supplementary central district licensingand other traffic restraint currently being undertaken in Singapore.Further research into practical experience in the urban transport field,in cooperation with several other agencies, is contemplated. In this
62

connection, close links are envisaged with the Organization forEconomic Co-operation and Development in studying practical ex-perience in the introduction of various types of measures to promotemore rational utilization of urban roads.
63


ANNEXES


Annex 1
Automobile Numbers and Income Levels
100
90 ~~~~~~~~~~~~~~~~~~~~~~~~~~~~~~~Caracas
30 * Mexico City
Singaporeo s~~~~~~~~~~ ~ ~~~~~~~Casablanc * Buenos Aires
70
* Sao Paulo60
NairobiON = Nairobi * Kuala Lumpur14 = 50 . *Bangkok
San Jose *Tehran
E.2 40
* Dar en Salaam
30* Hong Kong
* Lagos
20 - . Jaka*rta Istanbul
* Bombay
10 Karachi
MadrasAon 2SeoulT
a 400 o00 1,200 1,600 2,000
Per capita income (US$)

Annex 2Transport Data for Selected Cities
Price ofNumber of regular
Rate of Income Number of Rate of Number of commercial Impart import grade Modal splitof motoriBed farePopu- growth of per automobiles growth buses vehicles/ duty oo duty on gasoline/ trips (%)o for alation population capita per 1000 of automo- per 1000 1000 economy luxury US gallon 3-mile trip(1000) (%) (US$) population biles (%) population population cars (F.) cars ( US) (U$) Automo- Buses Other (US cents)City (1970) (1960-70) (1970) (1970) (1960-70) 1970) (1970) (Oct. 1974) (Oct. 1974) (Oct. 1974) biles motorized (Oct. 1974)(1) (2) (3) (4) (5) (6) (7) (8) (9) (10) (11) (12)
Calcutta 7,402 2.2 270 13.0 7.2 0.3 4.0 150 150 1.76 8 34 5803) 3Bombay 5,792 3.7 390 13.5 8.2 0.3 4.5 150 150 1.76 11 41 48(s) 3Madras 3,438 4.5 180 7.9 5.8 0.6 1.9 150 150 1.76 _(1) 54 46(8) 3Seoul 5,536 8.5 440 6.3 22.0 0.9 3.5 100 150 1.65 8 89 3) -Jakarta 4,312 5.3 325 18.0 8.8 1.1 4.3 200 200 0.44 29 49 22(9) 4Hong Kong 3,350 2.9 850 26.2 7.1 2.1 7.0 - - 1.10 22 55 23(2) 4-10Karachi 3,460 5.6 360 10.4 (0.6) 0.3 - 300 150 0.89 16 63 21(8) 1Tehran 3,600 7.0 950 44.4 (15.4) 1.0 6.8 30 62 0.35 37 42 21(7) 3-8
CIN Bangkok 3,090 6.2 525 49.7 12.0 1.2 16.3 80 80 0.50 29 59 12(7) 500 Singapore 2,110 2.6 1,100 73.0 6.7 1.3 17.9 25 25 0.98 24 43 33(5) 6.5
Kuala Lumpur 755 6.5 660 51.9 11.3 1.0 21.8 35 60 1.40 47 35 18(7) 5Mexico City 8,600 5.8 1,275 78.3 10.5 1.3 9.0 212 212 0.45 19 65 16(3) -Buenos Aires 8,400 2.4 1,800 73.9 (12.1) 1.6 25.6 140 140 1.29 17 60 23(e) -Sao Paulo 8,400 6.4 785 62.3 - 1.3 10.6 70 105 1.30 26 60 14(4) -Bogota 2,551 7.3 760 22.0 - 1.4 25.0 350 350 0.10 17 71 12(0) 2.5Caracas 2,277 5.4 1,600 91.0 8.3 0.6 27.3 135 135 0.13 46 35 19(3) -San Jose 435 5.4 430 47.9 10.9 1.0 34.0 100 100 0.98 23 74 3(10) 4Cairo 6,500 5.7 275 - - 0.3 - 100 200 - - - - 2Istanbul 2,800 6.0 810 21.0 12.2 0.2 13.1 25 25 0.80 57 28 15(4) 10Casablanca 1,505 4.5 820 72.9 (6.1) 0.4 26.1 120 120 1.46 - - - 10-20Lagos 1,448 7.9 555 22.8 15.5 1.0 8.3 75 150 0.52 12 - 88(2)Kinshasa 1,134 12.1 660 - - 0.4 - 20 20 1.52 33 58 9(7) 6Tunis 746 2.5 500 57.6 6.0 0.5 12.1 33 33 1.50 15 75 10(9) 1.5Beirut 600 2.9 1,000 153.0 9.1 2.3 17.3 32 32 0.54 60 10 30(7) 6Nairobi 567 8.1 495 52.7 (6.8) 1.5 40.6 40 100 1.12 72 28 -(7) 10Abidjan 424 11.0 500 75.5 (12.7) 1.7 35.4 58 58 1.31 40 47 13(10) 5Dar es Salaam 350 9.0 710 33.0 - 0.6 17.3 75 150 - 7 40 53(4) 3.5Lusaka 225 3.1 660 45.7 - 1.1 22.1 10 10 - 66 7 27(6) . 11

Tokyo 14,900 3.4 2,775 83.3 16.0 1.3 134.5 40 40 1.46 35 8 57(5) 25London 10,547 -0.7 2,550 222.0 5.2 0.6 22.0 15.4 15.4 1.29 59 24 17(8) 25Paris 8,448 1.3 3,530 248.0 6.5 0.4 44.4 11 11 1.40 36 21 43(2) 30Athens 2,416 3.0 - 60.8 12.8 2.5 18.2 25 25 2.15 - - - 10Washington, D.C. 757 -0.1 5,390 316.0 2.0 2.9 24.1 3 3 0.55 68 32 -(7) 40
(1) Included in "Other Motorized" (5) Figures for 1968 (8) Figures for 1971(2) Figures for 1965 (6) Figures for 1969 (9) Figures for 1972(3) Figures for 1966 (7) Figures for 1970 (10) Figures for 1973(4) Figures for 1967
Notes:Becauseof the variety of sources, differencesor definition and general weaknesses of collection,the data, though indicating orders of magnitude, have only limited comparability.
ae Caution is accordingly required in their use. See following page for general notes and sources.sO The data in the table were obtained from several publications in cated below, supplemented by information in various urban and transport studies available in the Bank. Information was also
collected by World Bank missions and from government authorities. Since the sources and methods of data collection are extremely diverse, the table indicates only in rough measure conditionsof urbanization and motorization.Data for columns 1, 3, 4, 6, and 7 are for 1970, except in the case of a few cities for which data for 1969 or 1971 had to be used.Rates of growth in columns 2 and 5 are for 1960-70, except for a few cities where growth rates were available for a shorter period only. Growth rates in parentheses are for the country and notthe city.For columns 8 and 9, a Toyota Corona was used to represent an economy car and a Mercedes-Benz 280 a luxury car.In column 11, the data are for different years, depending on the most recent traffic survey available to the Bank. The different years are shown in the footnotes.Sources:United Nations, World's Million Cities, 1972 (for columns 1 and 2).Motor Vehicle Manufacturers Association, Digest of lm,oort Daties for Metor Vehicles Levied by Selected Countries, 1974 (columns 5 and 6).Wilfred Owen, Brookings Institution, Automobiles and Cities-Strategies for Developing Countries. Bank Staff Working Paper No. 162, September 1973. Data supplied by Bank missions and gov-ernment authorities (columns 10 and 12).
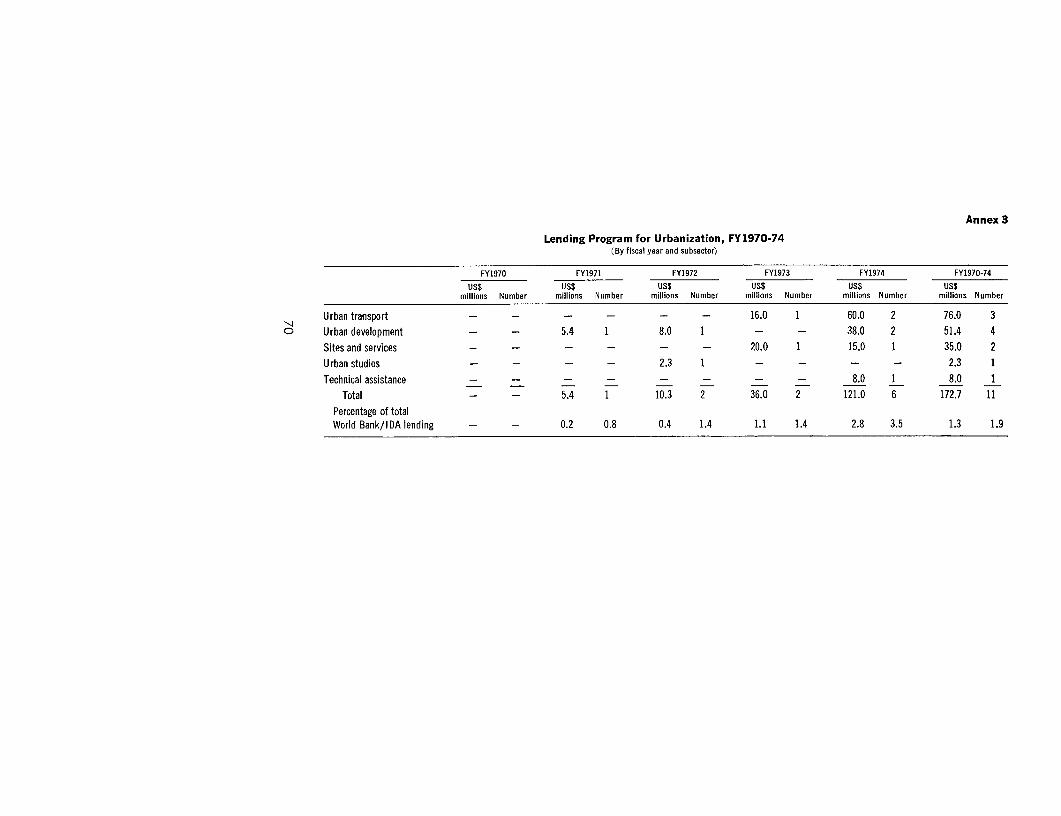
Annex 3
Lending Program for Urbanization, FY1970-74(By fiscal year and subsector)
FY1970 FY1971 FY1972 FY1973 FY1974 FY1970-74USS US$ USS US$ US$ USS
millions Number millions Number millions Number millions Number millions Number millions Number
Urban transport - - - - - - 16.0 1 60.0 2 76.0 3
O) Urban development - - 5.4 1 8.0 1 - - 38.0 2 51.4 4
Sites and services - - - - - - 20.0 1 15.0 1 35.0 2
Urban studies - - - - 2.3 1 - - - - 2.3 1
Technical assistance - - - - - - - - 8.0 1 8.0 1
Total - - 5.4 1 10.3 2 36.0 2 121.0 6 172.7 11
Percentage of totalWorld Bank/IDA lending - - 0.2 0.8 0.4 1.4 1.1 1.4 2.8 3.5 1.3 1.9

Annex 4
Urban Lending Program, FY1969-74
Other sectors with direct urban impact(5 ) Other sectors with urban impact(')Urbanization Water Development
(including urban supply & Tele- financeCity technical assistance) Power Transportation sewerage communications Industry companies
pop ulatinn US$ UJSUS .S$ US$u$ US$ US$Country City (millions) millions Number millions Number millions Number millions Number millions Number millions Number millions Number
Botswana(2) Francistown 0.02 3.0 1 - - 2.0 1 3.0 1 - - 40.0 3 4.0 1Senegal(2) Dakar 0.65 8.0 1 - - 22.7 4 - - 6.3 1 0.6 1 3.0 1lran(3) Tehran 3.15 42.0 1 169.0 3 168.0 4 - - 118.0 2 - - 240.0 5Tunisia0a) Tunis 0.64 18.0 1 12.0 1 57.0 4 48.5 3 - - - - 34.0 3Turkey(3) Istanbul 2.25 2.3 1 229.5 6 47.0 1 37.0 1 - - 140.0 3 145.0 4Malaysia(3) Kuala Lumpur 0.74 16.0 1 31.5 2 51.6 3 17.1 2 23.1 2 - - - -
>4 India(3) Calcutta 5.84 35.0 1 160.0 2 293.0 4 55.0 1 213.0 3 138.0 4 195.0 4Guyana(2) Georgetown 0.17 5.4 1 6.0 1 4.4 1 - - - - - - - -
Jamaica(z) Kingston 0.12 15.0 1 - - 9.3 1 5.0 1 - - - - - -
Nicaragua(2) Managua 0.32 20.0 1 24.0 1 11.0 1 6.9 1 - - - - - -
Jordan Amman 0.50 - - 10.2 1 6.0 1 8.7 1 - - - - - -
Singapore Singapore 2.10 - - 20.5 1 - - 18.0 2 11.0 1 - - 5.0 1
Colombia(2) Bogota 2.50 8.0 1 126.3 3 92.5 4 117.6 4 15.0 1 - - 125.0 3Costa Rica San Jose 0.22 - - 18.5 2 17.1 2 - - 47.5 3 - - - -
Ivory Coast Abidljan 0.40 - - - - 45.5 3 - - 25.0 1 - - - -
Brazil Curitiba 7.00 - - 484.9 8 357.0 6 73.0 2 - - 242.0 4 25.0 1Venezuela Caracas 2.30 - - 31.0 1 37.0 2 - - 35.0 1 - - - -
Total 172.7 11 1323.4 32 1221.1 42 389.8 19 493.9 15 560.6 15 776.0 23
(1) Refers to lending to the country concerned.(2) Countries which have received World Bank loans for urbanization.(a) Countries which have received World Bank loans for urbanization and have ongoing World Bank urban studies.
Unnumbered countries have ongoing World Bank urban studies.

Annex 5
CHARACTERISTICS OF URBANTRANSPORT MODES
In considering the characteristics of different forms of urban trans-port, it is necessary to consider both the rights-of-way and the usemade of them. The analysis is complicated by the joint use of roadsby many types of vehicles and by complementarities between them.Buses need pedestrian ways for passengers to reach them, urban rail-ways need feeder services such as buses, automobiles require parkingspace, expressways require subsidiary roads to give access to indi-vidual buildings, and so on. It is necessary to consider the urbantransport system as a whole.
The capacity of footpaths, roads and railways, or "track" for short,can most conveniently be considered in terms of the number of per-sons (or vehicles) that "flow" past a given point in a period of say anhour and their speed-the two are in fact closely related. Under mostpractical conditions, speed decreases as flow increases; the ratio ofthe flow to the speed gives the number of vehicles per unit lengthaccommodated on the road. The number of passengers that a givenlength of track can accommodate usually increases as speed decreases(providing speeds are above a lower limit of about 5 miles an hour inthe case of roads'). Conversely, high speeds, which require largerdistances between vehicles and wider lanes, lower the flows and thenumber of vehicles and passengers a given area of track can accom-modate-but, of course, enable those who are accommodated on thetrack to travel a longer distance in a given period or the same distancein less time. It is, therefore, flow multiplied by speed which mostclosely indicates the "output" or efficiency of the track. This "output"is in turn reflected in the time savings which constitute often themain benefit of a transport infrastructure investment.
One other preliminary remark on terminology may be useful. Sincea bus evidently takes more road space than an automobile, it is oftenconvenient to discuss road capacity characteristics in terms of pas-senger car units or PCUs. In the congested conditions of central urbanareas a heavy truck or double-deck bus can typically be consideredas roughly equivalent to about 3 PCUs, single-deck buses with shorterloading times to 2 PCUs and collective taxis to perhaps 11/2 PCUs.Exceptionally slow or clumsy vehicles, such as bullock carts, may beequivalent to 6 PCUs or more. An analysis of actual conditions is,however, generally required to confirm PCU equivalents in specific
'Below this speed, increased numbers of vehicles on the track reduce both flows anaspeeds until traffic may come to a complete standstill.
72

Annex 5
study areas as the degree of congestion and level of speeds appre-ciably affects the PCU values.
The following paragraphs consider the characteristics of pedestriantraffic, and cyclists on bicycle tracks. Road transport is then consid-ered in terms first of the roads and then the vehicles that use them.Next passenger transport on separate rights-of-way, such as urban rail-ways and busways, are discussed. A final section considers some ofthe wider aspects of the urban transport system as a whole includingcongestion costs.
To avoid repetition, many points dealt with in the main text arenot again treated here. It should be emphasized that all figures givenare illustrative only. Though derived from actual conditions in urbanareas, and although broad relationships are often remarkably similarfrom city to city, local conditions vary too greatly for the data to beused as a basis for decisions on individual situations. Costs are giventhroughout in U.S. dollars or cents.
Pedestrian FootpathsA footpath can carry more people per foot of width in an hour than
any other form of track except exclusive bus or rail track. As indi-cated in Table 5:1, about 1,100 persons can be accommodated at anaverage speed of 2.1 miles an hour; as many as 1,200 can be accom-modated at a speed around 11/2 miles an hour. Pedestrians can walkvery close to each other, even in opposite directions, make turns orstop without seriously interfering with flows, at least up to the levelsindicated.
The disadvantages of walking are obvious. Speeds are low, lessthan 3 miles an hour, and comfort in hot weather or rain is at bestpoor. In crowded conditions, speeds and flows may be substantiallyreduced and discomfort raised. Low speeds and fatigue in any caseeffectively limit pedestrian trips to about 2 miles in most cities thoughlonger distances may prevail for poorer groups of the community.Nevertheless, the total passenger-miles traveled in an hour is muchgreater per foot-width than can be achieved by automobiles at normaltown speeds, and is in the same range as can be achieved by bus.
Costs of track per foot of width are much less than for other modes,comprising mainly costs of land; construction costs are very low.Since there are no operating costs to be taken into account except asmall expense for shoes, etc.,2 walking stands out as by far the cheap-
2For both walking and cycling an allowance should theoretically be made for additionalfobd intake required when using these modes. This, however, is likely to amount to onlya fraction of a cent a mile.
73

Annex 5Illustrative Costs of Urban Travel by Different Modes Table 5:1
Persons Track capital costs(') Track maintenance caats(') Vehicle aperatingcosts(') Total costsSpeed per foot-widthn(') Per hear PLer person Per vehicle Per persen Per vehicle Per person Pei. person
(miles per hour) per hour US cents per mile US cents per mile US cents per mile US cents per mile
Footway, 4 feet wide 2.1 1,100(5) 2 0 0 0 0 0 negligibleBicycle track, 4 feet wide 8 450 50 0 0.3 0.3 0 0 0.3Urban street, 24 feet wide, mixed traffic
Car with driver only 15(6) 29 120 4.1 0.4 0.4 13.0 13.0 17.510 51 120 2.4 0.4 0.4 14.6 14.6 17.4
Taxi with 4 passengers 12 120 120 1.0 0.4 0.1 13.6 3.4 4.58.6 200 120 0.6 0.4 0.1 15.4 3.8 4.5
Minibus with 10 passengers 10 150 120 0.8 0.6 0.1 20.0 2.0 2.97.5 250 120 0.5 0.6 0.1 24.0 2.4 3.0
Bus with 30 passengers 8.6 300 120 0.4 1.0 0 50.0 1.7 2.16.7 500 120 0.2 1.0 0 60.0 2.0 2.2
Urban street, 44 feet wide, mixed traffic> Car with driver only 15(e) 39 120 3.1 0.4 0.4 13.0 13.0 16.5
10 55 120 2.2 0.4 0.4 14.6 14.6 17.2Taxi with 4 passengers 12 160 120 0.8 0.4 0.1 13.6 3.4 4.3
8.6 220 120 0.5 0.4 0.1 15.4 3.8 4.4Minibus with 10 passengers 10 190 120 0.6 0.6 0.1 20.0 2.0 2.7
7.5 280 120 0.4 0.6 0.1 24.0 2.4 2.9Bus with 30 passengers 8.6 410 120 0.3 1.0 0 50.0 1.7 2.0
6.7 550 120 0.2 1.0 0 60.0 2.0 2.2Urban expressway (capacity per foot-width is
independent of width)Car with driver only 40 180 900 5.0 0.4 0.4 11.0 11.0 16.4Taxi with 4 passengers 40 720 900 1.2 0.4 0.1 11.2 2.8 4.1Minibus with 10 passengers 40 1,200 900 0.8 0.6 0.1 17.0 1.7 2.6Bus with 40 passengers 40 2,000(7) 900 0.4 1.0 0 43.0 1.1 1.5
Metro (22,500 passengers per hour) 21 1,700(i) 4,400(8) 2.6 43.0 0.7 37.0 0.6 3.9Urban railway (22,500 passengers per hour) 30 1,700(7) 1,600(8) 0.9 43.0 0.7 37.0 0.6 2.2Note: For footnotes, see following page.

(U This column is adapted from Professor R, J. Smeed's presentation in "The Traffic Problem in Towns" (Manchester Statistical Society, 1961), with the data on road cQpacities updaled by him
on tile basis of more recent work by J. G. Wardrop. PCU values assumed: Urban Street Expressway
Car I I
Taxi I I
Minibus 2 i112Bus 3 2
(2) Track costs per hour, which are subject to wide variation, have been calculated on the basis of a 2,000-hour per year track utilization, infinite track life, and a 12% per year interest charge.
Figures given are for a strip one mile long and one foot wide. Urban street is assumed to cost US$240,000 and urban expressway US$1,800,000 per 12-loot lane-mile, inclusive of land and all
services. Capacity of expressway is assumed to be 2,200 PCU per lane per hour.
(a) Maintenance costs are assumed suflicient to keep track in good condition indefinitely, and also include the costs of lighting, cleaning and traffic control. Figures are based on data collected by
Alan M. Voorhees and Associates in the Bank-financed Caracas Road User Charges Study.
(4) Vehicle operating costs, which inciude depreciation and interest charges, are also subject to wide variation. The 13 cents a mile for a car represents a U.S. "compact" car under relatively
favorable road conditions. Taxis are assumed to have the same costs as cars, plus drivers' wages of 70 cents an hour. Minibuses are represented by the 14-seat Hong Kong "Public Light Bus"
and costs are adapted from Richard Butiler's Bus Operation in the Colony of Hong Kong. Bus costs are assumed as in Kuala Lumpur's 40-seat buses, as calculated by Wilbur Smith and Associ-
ates. Railway operating costs, which relate to London, are supplied by London Transport. Speed reductions from 15 to 10 miles per hour are assumed to raise operating costs by 12% in the
case of cars and taxis, 15% in the case of minibuses, and 20% in the case of buses. Speed rises from 15 to 40 miles per hour are assumed to result in vehicle operating cost savings of 15%
in all cases.
'...j (5) Data on footways are obtained from "Movement of Pedestrians on Footways in Shopping Streets" by S. J. Older, Traffic Eugileuring and ContrOl, August 1968.
(05 Mixed traffic on urban streets are assumed to move at 15 or 10 miles per hour. Taxis are assumed to stop 1 minute, minibuses 2 minutes, and buses 3 minutes per mile traveled.
(7) Bus-on-expressway figures are based on observations on the 1-495 bus-lane leading to the New York Port Authority bus terminal, recording 597 buses in one hour. Higher rates of flow were
observed over five-minute periods. Railway passenger flows are based on conditions on Mexico City's Metro, overall average loadings are assumed to be 62 people per car compared with 16 in
London. These volumes should not be taken as maximum capacities of mass transport: passenger flows in excess of 60,000 per hour have been observed in New York and Tokyo subways,
under conditions of crush loading. Similar volumes of passengers, even all seated, could be moved by high capacity buses on exclusive lanes. Few traffic corridors generate such volumes.
(3) Metro track is assumed to cost US$8,000,000 per lane-mile, as in Mexico City. Urban railway line is assumed to be at ground level and to cost US$3,000,000 per lane-mile.

Annex 5
est mode of travel and one of great capacity in terms of the limitedspace requirements.
Cycle TracksBicycle tracks are also relatively inexpensive to build. Under favor-
able conditions they can achieve a flow of persons per foot-widthof about half that of a pedestrian footway. This is still considerablyhigher than the flows achieved by automobiles or roadways-exceptperhaps for fully loaded automobiles on motorways-and of thesame order of magnitude as achieved by buses in mixed traffic. Atspeeds of about 8 miles per hour, the total hourly "output" of travelproduced by this track, i.e., the product of flow and speed, can reach3,600 per foot-width. This level of efficiency or "output" easily ex-ceeds that of automobiles except on motorways, equals that of busesand is nearly twice the rate for pedestrians on footpaths. Operatingexpenses are very low, amortization of the bicycle, tires, etc., amount-ing to only a fraction of a cent per mile, while parking and otherrequirements are negligible as compared with motorized traffic.
The range of cycling is probably about 8 miles, sufficient for mostjourneys to work. Minimum efficient track width is no more than 2.5feet for unidirectional and 5.5 feet for two-directional bikeways.Overcrowding, particularly on two-directional tracks, can reducespeeds and flows below those indicated in Table 5:1.
Cycle tracks offer a great potential for the developing countries inreducing public outlays for transport infrastructure, particularly ifmeans can be found for encouraging bicycle use by better supplyand financing facilities. Cycle tracks do, however, cause serious diffi-culties at intersections. Penetration of cycle tracks into central areas,unless planned from an early stage of growth, may be difficult toincorporate at a later stage.3
Urban RoadsThe characteristics of urban roads, including capacity and costs,
vary greatly with the locality and standards of the roads and the typesand numbers of vehicles they are designed to carry. For a given urbanroad, as traffic grows, the hourly flows rise, but speed falls, at firstslowly and then more rapidly. At automobile speeds of around 10miles an hour, a maximum level of road output per mile is reached.'See, for example, Bikeways Planning Criteria and Guidelines, Institute of Transportationand Traffic Engineering, University of California, 1972, for additional detail on cycle tracks.The range of cyclists is here placed somewhat above the range in most developed couL'n-tries but information is scarce. Flat land obviously increases range and sharp gradientsdeter use.
76
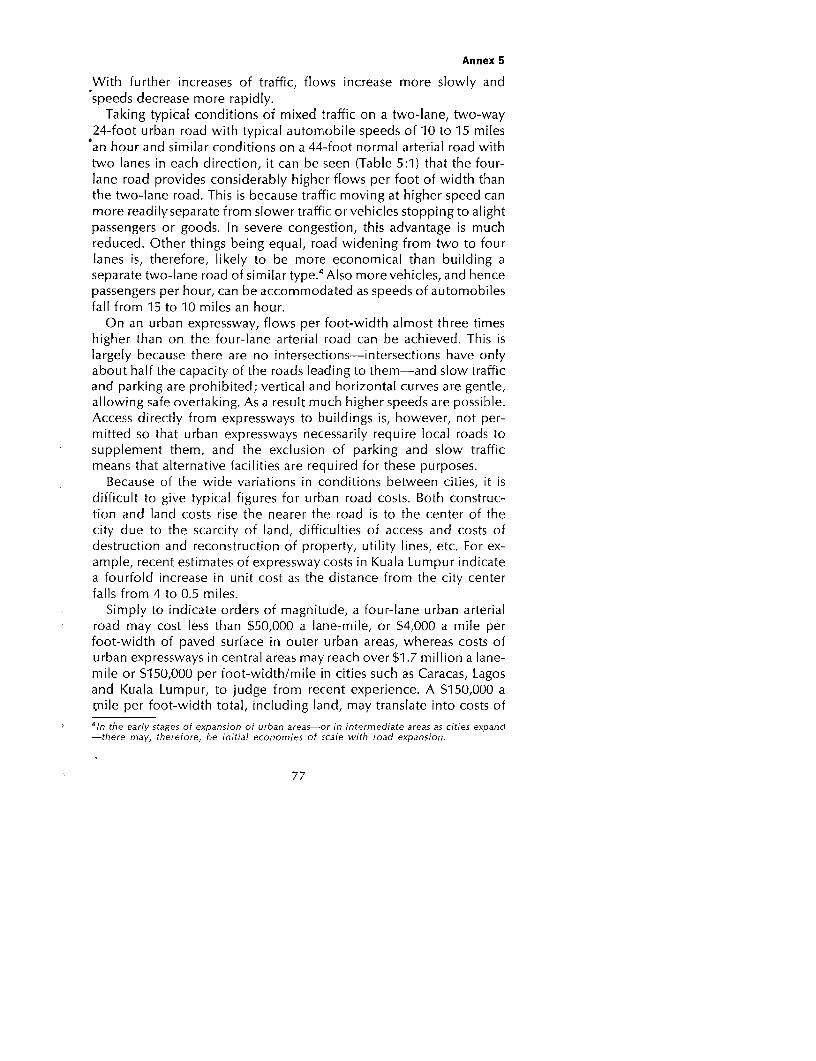
Annex 5
With further increases of traffic, flows increase more slowly andspeeds decrease more rapidly.
Taking typical conditions of mixed traffic on a two-lane, two-way24-foot urban road with typical automobile speeds of 10 to 15 milesan hour and similar conditions on a 44-foot normal arterial road withtwo lanes in each direction, it can be seen (Table 5:1) that the four-lane road provides considerably higher flows per foot of width thanthe two-lane road. This is because traffic moving at higher speed canmore readilyseparate from slower traffic or vehicles stopping to alightpassengers or goods. In severe congestion, this advantage is muchreduced. Other things being equal, road widening from two to fourlanes is, therefore, likely to be more economical than building aseparate two-lane road of similar type.4 Also more vehicles, and hencepassengers per hour, can be accommodated as speeds of automobilesfall from 15 to 10 miles an hour.
On an urban expressway, flows per foot-width almost three timeshigher than on the four-lane arterial road can be achieved. This islargely because there are no intersections-intersections have onlyabout half the capacity of the roads leading to them-and slow trafficand parking are prohibited; vertical and horizontal curves are gentle,allowing safe overtaking. As a result much higher speeds are possible.Access directly from expressways to buildings is, however, not per-mitted so that urban expressways necessarily require local roads tosupplement them, and the exclusion of parking and slow trafficmeans that alternative facilities are required for these purposes.
Because of the wide variations in conditions between cities, it isdifficult to give typical figures for urban road costs. Both construc-tion and land costs rise the nearer the road is to the center of thecity due to the scarcity of land, difficulties of access and costs ofdestruction and reconstruction of property, utility lines, etc. For ex-ample, recent estimates of expressway costs in Kuala Lumpur indicatea fourfold increase in unit cost as the distance from the city centerfalls from 4 to 0.5 miles.
Simply to indicate orders of magnitude, a four-lane urban arterialroad may cost less than $50,000 a lane-mile, or $4,000 a mile perfoot-width of paved surface in outer urban areas, whereas costs ofurban expressways in central areas may reach over $1.7 million a lane-mile or $150,000 per foot-width/mile in cities such as Caracas, Lagosand Kuala Lumpur, to judge from recent experience. A $150,000 acnile per foot-width total, including land, may translate into costs of41n the early stages of expansion of urban areas-or in intermediate areas as cities expand-there may, therefore, be initial economies of scale with road expansion.
77

Annex 5
about 5 cents a vehicle(PCU)-mile at a conservative 12% allowancefor interest and depreciation and high rates of utilization.5 By con-trast, at $20,000 a mile per foot-width, which is much more typicalof normal urban arterial roads away from the central district, the costper vehicle(PCU)-mile is likely to represent only about half that ofthe expressway despite the much smaller rate of traffic flow. For com-parison, taxes on automobiles equivalent to 50% of import price plus50 cents per gallon of gasoline may work out at about 31/2 cents pervehicle-mile for an automobile covering 20,000 miles a year-wellbelow the costs of the central expressway though above those of theoutlying roads.
Maintenance costs of urban roads are, in comparison with capitalcosts, very low but not insignificant. They comprise traffic control,road repair, lighting, cleaning, etc. To illustrate the order of magni-tude, a study in Caracas in 1971 estimated maintenance costs at 0.4cents an automobile(PCU)-mile or 1 cent for a bus.6
Operating Costs of Road Transport VehiclesThe "running costs" of operating motorized road vehicles, such as
fuel and tire costs that are incurred only as a result of the vehiclemoving, vary with the speed of the vehicle. Running costs are gener-ally lowest at speeds of 30 to 40 miles per hour. In conditions ofcongestion, at speeds below 20 miles per hour, running costs oftenincrease roughly in proportion to changes in journey time. The dia-gram showing vehicle operating costs at different speeds is takenfrom conditions in Singapore to illustrate this point. Other costs ofoperation, including capital costs, administration and paid drivers'time may also be influenced by speeds, but generally to a much lesssignificant extent.
AutomobilesWith two persons traveling-a typical average for many cities in
developing countries-the automobile is relatively expensive in termsof road space used. As illustrated in the examples given in Table 5:1,the flow of persons an hour per foot-width of road is well belowother modes. This is fundamentally because an automobile, while
'This would be the cost if attributed to 2,000 hours per year of flows of 180 vehicles(PCUs) per hour per foot-width. With the allowance for maintenance discussed in thefollowing paragraph, it is assumed that the life of the roadway is infinite and hencedepreciation is negligible.6Alan M. Voorhees and Associates. An earlier London study gave similar results includingalso 1.35 cents for a truck-mile.
78

Annex 5
requiring only about a third of the road space of a bus in congestedconditions, carries very much less than a third of the passengers. Eventhough the automobile travels almost twice as fast as a bus on con-gested roads, this is not sufficient to offset the difference in loadcarried; total passenger distances achieved in an hour are well belowthose for buses. On an urban expressway, the higher speeds andseparation of traffic permit the hourly passenger-miles achieved byautomobiles per foot-width to rise several fold; but a bus using theexpressway will achieve a similar increase.
Costs of operating an automobile in developing countries are nowtypically somewhat in excess of 15 cents a mile in relatively congestedconditions and with speeds averaging around 10 miles an hour. Thereis a small improvement in total operating costs at speeds of 15 milesan hour and on urban motorways the operating costs may come downto around 12 cents a mile at an average speed of 40 miles an hourbefore rising again at higher speeds. This means, since only a partof travel can be on an urban expressway, the costs per automobilepassenger for an average of two persons per automobile are likely tobe in the 6 to 9 cents a mile range but can fall to 3 or 4 cents a mileif the car fills up with four passengers.
These totals of automobile costs exclude any allowance for thecost of the road which, as has been noted, may vary from little over2 cents a vehicle-mile in outlying urban areas to 5 cents a mile for anexpressway near the city center or 1 to 3 cents per passenger-mile ataverage loading. Nor are the costs of parking included. If automobilesare parked on the road, and take 100 square feet of space, then thecost per hour may amount to 20 cents in central areas of cities suchas Bangkok, using a land rental value of 10% and 4,000 hours of usea year as base for the calculation.
jitneys and MinibusesNext in size in terms of passengers carried and road space required
per vehicle are the various types of jitneys and minibuses. Thosebased on modified automobiles have many characteristics similar toautomobiles. Road space requirements per vehicle are, however, alittle higher because of more frequent stops, which also lower averagespeeds; but because of the higher number of passengers carried(usually not far short of the full capacity of five) road requirementsper passenger are substantially less than for the automobile though'still above those of the bus. This is reflected in the figures of flow ofpersons per foot of road-width given in Table 5:1.
79

Annex 5Figure 5:1
Vehicle Operating CostsUS cents per mile at Different Speeds
500
375 -
250 \
\ \ea~~~~Hevy truck,
125 -
Light true;
o 5 10 15 20 25 30 35 40 45 50
Miles per hour
US cents per mile
12
8 _ \
4
05 10 15 20 25 30 35 40 45 50
Miles per hour
'Also indicative of variation of bus costs with speed.
Source: Wilbur Smith and Associates, Singaaooe Mass Transit Study, 1974.Cost figures are for 1972.
80

Annex 5
Operating costs per vehicle-mile of jitneys are increased by theremuneration of the driver as compared with the automobile butthese costs are shared by a large number of passengers per day. Asthe vehicles are, on average, operated for many more miles than
'private automobiles, capital costs per mile per passenger are muchless than for the automobile. On balance, total costs per passenger-mile work out at substantially less than for an automobile but can beabove those for the bus-where capital and driver costs are sharedby a substantially greater number of passengers.
Minibuses are at present used on a large scale in relatively fewcities though the trend is upward. In terms of passenger capacity,they provide a convenient half-way house between the automobileor jitney and the regular bus. Costs are similar to those of jitneys.Like the automobile and jitney they can penetrate into areas that aregular bus cannot, and also operate efficiently with far fewer pas-sengers. In outlying areas these forms of collective transport havetherefore considerable advantages. But in central areas their greaterroad space requirements per passenger as compared with buses area disadvantage. Costs of the road space required per vehicle, aboutone and one-half times that for an automobile, work out at up to3 cents a passenger-mile for jitneys and 1 cent a passenger-mile forminibuses on normal arterial roads.
BusesThe road requirements of buses in mixed traffic vary considerably
according to traffic conditions but something less than 3 PCUs seemstypical. They can, and in rush hours often do, carry as many as 70passengers, or 120 passengers on the new double-decker buses thatare used in Hong Kong. Even with 40 passengers, buses can achieveflows of over 500 persons per hour per foot-width of road. Speed isvery sensitive to the time taken at stops for passengers to board andalight. In practice, average commercial speeds much above 8 milesan hour for regular bus services are rare. Close attention is, therefore,warranted to the potential for limited stop express buses which canachieve speeds more closely comparable with those of automobiles,with consequent saving in running costs as well as in passengers'time. Reserved lanes for buses can increase their speed up to 17miles per hour in some instances. On urban expressways, bus speedsoften approximate those of automobiles.
Costs of bus operation are largely affected by costs of labor, bothactually on the buses and for administration and maintenance; thesevary substantially from country to country. However, on the basis of
81

Annex 5
several recent estimates, it appears that total costs of the order of50 to 75 cents a vehicle-mile or a little below 2 cents per passenger-mile are typical in many developing countries. Under conditions ofcongestion the higher level of passenger loadings may compensatefor higher operating costs per bus.
Costs of road requirements per passenger for buses are much lowerthan for other passenger transport vehicles. Even at the top level ofroad costs of 5 cents per PCU vehicle-mile, the cost per bus passenger-mile is below 1 cent in the typical situation of loadings above 30persons; at the lower end of the scale, road costs fall below one-tenthof 1 cent. Parking costs are also much below those of automobiles.
The relatively large capacities of buses as compared with otherroad transport vehicles and low road space requirements per pas-senger-even when half full-make buses particularly suitable forservice along heavily populated corridors where reasonably full loadsat short frequencies of service can be obtained. On expressways,their speeds can rise substantially and their costs fall correspondingly.
Separate Track SystemsThe great advantages of separate track transport systems is that
interference from other traffic is largely removed, permitting higherspeeds with increased safety. Their disadvantages are twofold. First,the minimum width of track feasible provides a very large capacitywhich, in the absence of other traffic, is difficult to utilize fully; capitalcosts of track per passenger accordingly tend to be high. If tunnelingis involved, track costs are very high. Second, once track location isdetermined, this part of the transport system is largely inflexible andcan only with difficulty be adapted to changing conditions. Takentogether, these two features tend to mean that subsidiary, smallercapacity feeder services are required involving transfers and conse-quent loss of passenger time.
RailwaysA surface urban rail line, providing 20 to 25 eight-car trains an hour,
can handle a unidirectional crush condition flow of over 60,000 pas-sengers an hour. This is equivalent to well over 4,500 persons perfoot-width per hour7 though in normal conditions for the system asa whole, only about one-half of these levels would be typical. Evenso this is about eight times the capacity of automobiles carrying a
'The estimate is based on Tokyo experience of 300 people per rail car and a train capacityof 2,400.
82

Annex 5
typical passenger load on motorways, and four to five times buscapacity in typical mixed traffic. A single train capacity of over 600passengers is itself so large as to limit service frequencies outsidepeak periods. Average speeds and overall capacity are to a great ex-tent determined by the spacing of stations since, due largely to theheavy weight of trains and the use of steel wheels on steel track,braking power is relatively poor. Accordingly, acceleration and de-celeration are slow and large distances are required between trainsfor safety. Even in unusually favorable conditions with stations onemile apart and stops averaging less than a minute, average speedsmay be not much above 20 miles an hour, even if the top speed is50 miles an hour.
Unfortunately, data on capital costs of surface rail track in currentconditions in developing countries is too scanty to be of much useas most rail tracks were laid many years ago. Moreover, local condi-tions of passenger volume over different hours of the day, particularlythe volume in off-peak hours relative to peak hours, are of paramountimportance in determining railway costs per passenger mile. Condi-tions of physical terrain are also important: high gradients and sharpcurves can be accommodated only at considerable expense. Suchfeatures need to be closely investigated before any assessment canbe made. But it seems probable that where conditions are favorable,including passenger volumes that are very heavy over long periodsof the day, expansion and extension of urban railways may providepersonal transport at costs per passenger-mile at least comparablewith those of buses in mixed traffic and with low space requirements.Often, however, a more appropriate comparison will be with bus-ways considered below.8
Where tunneling is involved as in metros, costs of rail track risesharply. Subway costs vary greatly according to the difficulty of tun-neling but are rarely much below $10 million a lane-mile and caneasily exceed $25 million. Including above ground portions, the re-cent Mexico City metro cost over $8 million a lane-mile. Capacityand maximum speeds are similar to the urban railway but somewhatcloser headways may be obtained with the lighter vehicles, morerapid loading and more elaborate signaling and safety devices. Evenso, it is difficult to lessen headways between trains below 3 minutes.It is moreover very difficult to introduce limited stop subway trains
'There is no space here to consider streetcars and other forms of light urban railwayswith partially separated rights-of-way to offer considerable potential, particularly if timesof stops can be reduced, for example by platform loading; nor the potential for convertingrail track to routes reserved for buses.
83

Annex 5
since costs of providing passing loops are likely to be prohibitive.Passengers per hour can theoretically reach 60,000 assuming 200 cars-an hour at crush loadings of 300 people, or between 4,000 and 5,000per foot-width.
The advantages of underground metros are clear. Fast and withvery high capacity, they greatly reduce the surface area needed fortransport in the most congested districts. If the aim is to perpetuatehigh density central areas, subways may provide the only solution.They are however expensive. To judge by the recent experience inMexico City and preliminary estimates elsewhere, fares will needsubstantially to exceed 10 cents for an average trip of two or threemiles if full costs are to be covered-even where very high densitytraffic is encountered. This feature, and the high initial capital costsinvolved, largely explain why only two cities in the developing coun-tries at present possess major metro systems-Mexico City andBuenos Aires.9
BuswaysOne alternative to the metro or surface railway that is receiving
increasing attention is the segregated busway. Track constructioncosts are likely to be appreciably less than for an urban railway, unlesstunneling is required. Rolling rock requirements are cheaper thanfor railways; ordinary buses can be used. The lighter weight andsuperior braking power of individual buses as compared with trainscan, moreover, permit closer headways. Buses can leave the buswayand need not stop on it for loading and unloading, lowering thecosts of "stations" and permitting through buses to continue withlittle loss of speed. Speeds can average 45 miles per hour on the trackitself even during peak hours. As a result, capacity of busways perfoot-width is as great as can be provided by any other mode. Ratesof over 700 buses an hour have been recorded, equivalent to over3,000 seated passengers per foot-width. Passenger costs are low andcan be roughly calculated at around 11/2 cents per mile.
As the same vehicle can be used both on the busway and for thecollection or distribution routes, busways obviate much of the prob-lem of transfers of rail systems.'0 Because of this feature, buswayscan be built in discrete parts and extended over time with less dis-location than caused by metros or urban rail. The smaller capacity of
9Large metro systems are also being constructed in Sao Paulo and Seoul.
"'Insofar as the buses are used for distribution services in central districts, the buswaycapacity will, in practice, be limited by the capacity of the exits in the central district.
84

Annex 5
the unit bus as compared with the train unit of railways also permits,a more frequent service and less waiting time at stops. A furtheradvantage is that surplus track capacity not required for buses canbe used for other vehicles. At peak periods, there may be room only
-for other collective passenger vehicles such as minibuses and jitneysand essential vehicles such as ambulances and police cars; out ofpeak periods, it may be possible to admit private automobiles with-out interfering with bus speeds.
Against these considerable advantages of cost and conveniencehas to be set the limitation on busways of surface space requirementsas compared with a metro-arising out of the technical difficultiesof operating buses underground. Ventilation to evacuate fumes maygreatly increase the costs of deep tunneling for busways.1" Thesefactors may preclude bringing busways into the heart of businessdistricts. It may also be difficult, in practice, to exclude other trafficto the extent required for efficient bus operation, in which case thebusways will degenerate into all-purpose roads. This danger is par-ticularly great where motorists on highly congested roadways can seeapparently underutilized road space on nearby busways.
The Urban Transport SystemIn the early stages of urban growth, low capacity local roads can
provide very cheaply for all kinds of traffic and parking. The varioustypes of vehicles and pedestrians get in each other's way only margin-ally. Costs of the rights of way are greatly reduced as compared withproviding a separate track for each category.
With more traffic, the various uses tend increasingly to conflict.Initially, this conflict can be resolved fairly cheaply by road widening,traffic signals and the like. There may indeed be increasing returns ofscale at this stage, the extra costs being proportionately less than theextra capacity created-and this may also apply at a later stage for therapidly expanding peripheral and local neighborhood road networks.
Further urban growth greatly increases transport requirements asaverage trip distances lengthen and incomes grow. As noted in themain text, increasing congestion is to be expected due to both higherdemand and the increasing costs of expanding central roads. Costsof delays that individual vehicles impose on others can then exceedall other costs attributable to the individual vehicle. Pollution andsocial disruption increase. Great changes in the mix of transportmodes occur as the transport system and land use adapt, with increas-
"The extent of addition to costs is a matter of dispute.
85

Annex 5
ing difficulty, to this changing situation. The response is in part con-ditioned by the perceived costs and benefits involved in the use ofvarious transport modes, and in part by general pricing policies andother influences on urban form.
Fundamental to the selection of appropriate urban transport modes,in the conditions of rapid growth of the cities of developing countriesare, first, that shortage of space in central areas is rapidly intensifyingand land costs are rocketing; and second, that resources are veryrestricted. The effective central area space can be increased by rela-tively speedy underground transport needing little surface area. But,as has been noted, the cost of subway construction is very high; onlyin large cities exceeding two million population with very high densi-ties providing large traffic volumes over many hours a day and favor-able tunneling conditions do subways appear a feasible solution.Even then, the costs may only be affordable in the richer developingcountries and fares are likely to be too high for the poorer strata ofsociety. Where a subway is feasible, account must be taken of theneed to reorient the whole public transport system so that bus routesand subways complement each other.
For the great majority of cities in developing countries and thegreat majority of their populations, the choice is, and will remain,between either very cheap walking and cycling-providing inde-pendence of timing but disadvantages of poor comfort and, for thepedestrians, very limited speed and distance-and the considerablymore expensive public or collective transport by bus, surface railwayor intermediate public transport. Walking, cycling and regular sizebuses all provide high capacities in relation to space requirementsand low or very low pollution effects. Railways have disadvantages ofinflexibility. Capacity of bus routes can be greatly increased by sepa-rate rights-of-way, and with the high loadings and volumes of passen-gers characteristic of the developing countries may be competitivewith metros at any traffic volume. Shortages of surface space in cen-tral areas however remain a limiting factor.
Minibuses and collective taxis can supplement regular buses bothin terms of greater comfort, lower efficient capacity and greater flexi-bility. However, they take up more road space than regular buses, adisadvantage for central areas. There may, therefore, be a case forencouraging their use for outlying areas but for limiting their use, bycharging or other means, on congested trunk bus routes of highpassenger density. Against this, however, as they are much more eco-nomical than private cars, their obvious potential for substitution for.private cars in central areas also needs to be considered.
86

Annex 5
The advantages and disadvantages of intermediate transport modesin terms of the overall transport system apply a fortiori to privateautomobiles. Comfort, convenience and speed of total trips are somuch greater than for other modes as to represent a quantum differ-ence. The independence and liberty of movement they provide rep-resent an emancipation for many owners; hence, the great appeal andtenacity with which their use is defended. However, in terms of roadspace and total costs to the community their benefits are provided atvery high cost. In developing countries, so long as resources availablefor infrastructure are so limited, the benefits of the few in automobilesusing roads at peak hours are inevitably accompanied by intensifieddifficulties for many traveling by public transport, walking or cycling.The conflict could, however, at least in principle be considerablyreduced by higher occupancy rates of automobiles.
What may be noted, in conclusion, is that the resource limitationsof developing countries appear in any case likely to limit very seri-ously the possibilities of increasing transport capacity in central areas.The advantages of developing a multicenter urban form are corre-spondingly increased.
87

Annex 6
TAXATION OF THE OWNERSHIP ANDUSE OF AUTOMOBILES
General Taxes and QuotasIt is useful to distinguish charges that relate to vehicle ownership
from charges that relate to vehicle use. Charges that relate to owner-ship, such as import duties, influence the size of the vehicle popula-tion, but not the usage of vehicles once bought. Charges related tovehicle usage, such as fuel taxes, primarily affect the use of a vehicleonce bought, but only indirectly the total size of the automobilepopulation.
Ownership taxes comprise principally import duties (or purchasetaxes where there is local manufacture) on vehicles and parts, andregistration and annual license fees. From the fiscal, foreign exchange,and resource economizing points of view, such taxes can be veryimportant. Relatively easy to collect, these taxes have a much higherelement of progressivity than in developed countries since privateautomobile owners generally constitute a small rich class. Progressiv-ity is often increased by higher rates for more luxurious cars or forheavier cars of high horsepower. In many developing countries, suchtaxes are regarded as a partial substitute for more difficult to collecttaxes on income. They often provide a third to a half of the yield oftotal taxation of automobiles.
From an urban transport point of view, ownership taxes are asomewhat blunt instrument for limiting traffic congestion. By limitingownership, they limit automobile use not only in congested but alsoin uncongested conditions where restraint is not required. They donot particularly discourage automobile use at peak periods. Theireffect on total automobile population, moreover, is only temporaryif incomes continue to rise, unless supported by other measures.'If the tax rates vary with horsepower or value, use of small cars maybe promoted but this has only a limited effect on requirements forroad space.
However, since private automobiles in developing countries arehighly concentrated in large urban centers with severely congestedconditions, these drawbacks may be outweighed by the advantagesof increasing ownership taxes, at least from the relatively low levelsprevailing in many developing countries. If congestion and other user
'The effect of ownership taxes on registrations is, in practice, difficult to distinguish fromquota restraints since high ownership taxes have tended to coincide with quota restrictions.
88
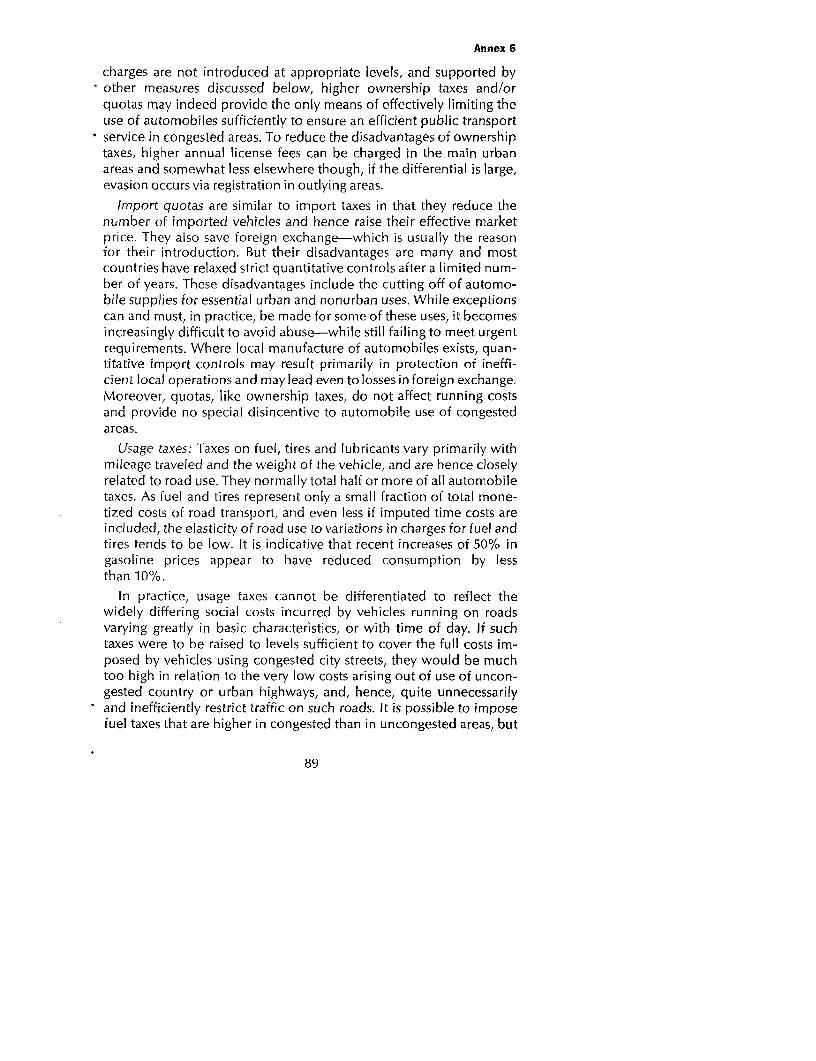
Annex 6
charges are not introduced at appropriate levels, and supported by- other measures discussed below, higher ownership taxes and/or
quotas may indeed provide the only means of effectively limiting theuse of automobiles sufficiently to ensure an efficient public transportservice in congested areas. To reduce the disadvantages of ownershiptaxes, higher annual license fees can be charged in the main urbanareas and somewhat less elsewhere though, if the differential is large,evasion occurs via registration in outlying areas.
Import quotas are similar to import taxes in that they reduce thenumber of imported vehicles and hence raise their effective marketprice. They also save foreign exchange-which is usually the reasonfor their introduction. But their disadvantages are many and mostcountries have relaxed strict quantitative controls after a limited num-ber of years. These disadvantages include the cutting off of automo-bile supplies for essential urban and nonurban uses. While exceptionscan and must, in practice, be made for some of these uses, it becomesincreasingly difficult to avoid abuse-while still failing to meet urgentrequirements. Where local manufacture of automobiles exists, quan-titative import controls may result primarily in protection of ineffi-cient local operations and may lead even to losses in foreign exchange.Moreover, quotas, like ownership taxes, do not affect running costsand provide no special disincentive to automobile use of congestedareas.
Usage taxes: Taxes on fuel, tires and lubricants vary primarily withmileage traveled and the weight of the vehicle, and are hence closelyrelated to road use. They normally total half or more of all automobiletaxes. As fuel and tires represent only a small fraction of total mone-tized costs of road transport, and even less if imputed time costs areincluded, the elasticity of road use to variations in charges for fuel andtires tends to be low. It is indicative that recent increases of 50% ingasoline prices appear to have reduced consumption by lessthan 10%.
In practice, usage taxes cannot be differentiated to reflect thewidely differing social costs incurred by vehicles running on roadsvarying greatly in basic characteristics, or with time of day. If suchtaxes were to be raised to levels sufficient to cover the full costs im-posed by vehicles using congested city streets, they would be muchtoo high in relation to the very low costs arising out of use of uncon-gested country or urban highways, and, hence, quite unnecessarilyand inefficiently restrict traffic on such roads. It is possible to imposefuel taxes that are higher in congested than in uncongested areas, but
89

Annex 6
any large differences will lead to evasion by uncontrollable move-ments of fuel from high-tax to low-tax areas.
Congestion ChargesThe advantages of charging automobile users directly for the use
of congested roads, instead of indirectly by the methods describedabove, is that action can be more effectively concentrated on theproblem with less adverse side effects. Work is now proceeding ontwo main methods of congestion charging, by daily licenses and bydirect metering.
Daily licenses: In this system, vehicles entering or circulating withina congested central area are required to display permits. A recentCaracas study, for example, recommended charges equivalent to$1.32 per day for a private car, $4.40 for a shared taxi and $3.30 for agoods vehicle.2 The authorized permits to be placed on the vehicle'swindshield could be purchased in bulk by road users, either for useon specific dates, or with validation by users themselves for a specificdate. The system provides for refunds, so that automobile ownerswould be charged only for days in which their cars were used in thepriced areas. A similar scheme is under consideration for Singapore.3
In the Caracas scheme, buses were to be exempted; in Singapore,both buses and car pools are to be exempted. The Caracas reportestimated benefits from the scheme, in traffic conditions similar tothose prevailing in 1971, equivalent to $3.4 million per annum, risingto $68 million per annum by 1980. Gross annual revenues were esti-mated at over $25 million in 1971 conditions.
Tolls can be regarded as a variation of the daily license system. Tollscan be levied at the entry points to congested areas, the difficultiesvarying greatly with urban configurations and space available for tollbooths. Collection slows traffic and those vehicles that move in thecity without passing the entry points are missed.4 These drawbackswould be overcome if charging points could be spread throughoutthe congested area and if vehicles could be debited without havingto stop. Hence, the interest in automatic metering systems.
2Alan M. Voorhees and Associates, Inc., Caracas Road User Charges: Opportunities andPotentialities, prepared for the Venezuelan Government with the World Bank's assistance.3Singapore Road Transport Action Committee, A Plan for the Relief of Traffic Congestionin the City.4A separate case may exist for tolls at entry points to urban expressways to help counterthe effect of such facilities on costly urban spread.
90

Annex 6
Meters for charging for the use of roads: Meters have been.designed to charge directly for the use of roads, whether congestedor uncongested. The systems currently being developed are similarto that used for charging for telephone calls. Vehicles passing "pricingpoints" are identified by sensing equipment. A central computerwould count electrical impulses, actuated by passage of the vehiclesand generated by electrical cables carrying very low currents laidacross the roads, and bill owners accordingly. Tests of electronicidentification have proved very satisfactory.5 It is now proposed toequip hundreds of vehicles using toll roads in New York and SanFrancisco with these devices, and to give their owners the option ofpaying tolls on monthly account instead of by the traffic-delayingmethod of paying cash at the toll gates. Although being developedprimarily for revenue collection at present, a great potential existsin using such systems for bus priorities, monitoring changing trafficpatterns, identifying stolen vehicles, automatic parking charges, andlocation of buses and trucks for fleet control. Problems of protectingprivacy are involved.
Parking taxes: Parking charges and taxes can serve two purposesbesides raising revenues. They can be set to reflect the economic costof the space used for parking: they can also be used as a proxy forother methods of charging for use of congested urban streets.6 In thesecond function, such charges are open to the objection that theydiscriminate against people who shop, work, and live in city centers,and do nothing to discourage road users who drive through them.
In practice, few cities in developing (or developed) countries levyfull charges for parking according to the space and other facilitiesinvolved. Yet, in developing countries the case for full economiccharging is doubly strong. Economy in the use of scarce transportresources is encouraged. Users belong to the richer segment of thepopulation. Without such charges, the persons parking their vehiclesare, in fact, being subsidized and such use is correspondinglyencouraged.
The key to economic parking charges is generally in the hands ofmunicipal authorities through control of street parking. When eco-nomic charges are made for street parking, it becomes a commercial
'The systems operated at an accuracy exceeding 98%, with lengthy periods in excess of99.8%, in tests on buses using the New York Bus Terminal over a period of a year.6Complex technical issues are involved including evaluation of alternative uses of roadspace, effects of vehicles cruising to find parking space, and advantages of curb parkingto car owners compared with off-street parking.
91
Annex 6
proposition to provide parking off the street-and the private sectorcan usually be relied upon not to undercharge. In sum, while parking.taxes for congestion control may or may not be desirable, there is inmost cities a strong case for raising charges to economic levels, firston the street and then off it.
It is also possible to restrict parking by time, as is commonly doneat parking meters. Such restrictions, which are only necessary whencharges are too low to equate the demand for parking spaces to thesupply, are easy to evade and generally have little to commend themover the alternative of restriction by economic parking charges, i.e.,charges just high enough to leave a few vacant spaces available atmost times for would-be parkers.
Problems in congestion charges: The correct level of congestioncharges is difficult to determine. In theory, they should equal theexternal costs imposed by the use of one vehicle on others, under theconditions prevailing after the imposition of the charge. Such a levelwould involve at least a doubling of total nontax running costs effec-tively falling on the automobile.7 As noted above, the Caracas studyindicated an optimal charge of about $1.50 a day. Other estimatesgo considerably higher. Charges based on rent of valuable central cityland might be of the order of $3 a day.
Difficulties of implementation include the tendency to create"minipeaks" of congestion in areas just outside the controlled areasor at times just outside the period during which the charges are levied.Some gradation may be desirable in terms of an outer zone withlighter charges, and a heavily charged inner zone, or a heavily chargedfull peak period and lower charged surrounding period. The advan-tages of gradation have to be weighed, however, against the addi-tional complexity.
While the introduction of special charging for use of urban roadsduring periods of congestion stands out as a high priority among themeasures needed, it is not possible to introduce economic chargesin the short-term without imposing heavy burdens on many of thosewho have adapted their living to existing conditions. In general, therich can pay such charges without serious loss of welfare; indeed,some may experience a net gain as a result of faster trips. It is thepoorer of the private vehicle users who will be forced to abandonthe use of the automobile, though those poorer still will tend to gain
'Such a doubling of costs to the owner of running automobiles in congested areas mightresult, according to various analyses, in a net reduction of about 20% in total vehicle use,a higher reduction in private automobiles being partially offset by an increase in thenumber of public transport vehicles.
92

Annex 6
from increased speeds of public transport. The burden on marginalusers can be reduced by increasing the charges in stages over severalyears and by measures to improve the alternatives to private vehicleoperation, particularly public transport by train, bus, minibus orshared taxi. More importantly, perhaps, at higher levels of charging,problems of enforcement may be insuperable in many cities of devel-oping countries.
93

Annex 7
PROBLEMS OF METHODOLOGYAND MEASUREMENT
Urban transport planning has been carried out in considerabledetail for several decades in most large cities of the developed coun-tries and has more recently been extensively adopted in the cities ofthe developing world. Because of the complexity of an urban trans-port network with its range of transport modes and changing condi-tions from one part of the system to another, mathematical modelingand computer technology have been increasingly applied. A widevariety of refinements to the basic models is now available. In generalterms, however, the process has consisted firstly in modeling or"simulating" the existing situation, then extrapolating transport re-quirements into the future and then introducing into the modelchanges in the transport system capacity as a result of proposed in-vestments to accommodate the increased requirements.
Many sequential steps often involving considerable margins ofjudgment are involved in preparing conventional urban transportmodels. The existing or base-year demand, in terms of the numberof trips generated for major purposes in different zones of the city,is derived from socioeconomic data on population, density, income,location and car ownership. Trip attractions by zone are similarlyestimated with reference to such factors as employment, schoolsand shopping centers. Distribution of the trips between differentzones and times is derived from origin/destination matrices usingdata on travel time and costs to establish preferences. The split be-tween the various private and public transport modes and assign-ment of the trips by route are finally estimated by reference to thecapacity of the detailed portions, or links, of the transport networkand vehicle operating costs in relation to the lengths and timing ofthe trips. How good a fit is provided to real world conditions is meas-ured by comparisons with traffic counts and household surveys.These are used to adjust the initially assumed relationships so as to"calibrate" the model. Changes in trip generation and attraction fora future or "design" year when the contemplated new investmentswill have been built are then estimated from changes in population,income, employment, etc. Finally, alternative programs to changethe capacity of the transport system are tested to see whether theycan cope at satisfactory speeds, and in accordance with estimatedmodal split and route assignment in the new conditions, with the.predicted increases in demand.
94

Annex 7
For favorable conditions of relatively stable growth in highwayrequirements and economic structure, the models have providedappreciable assistance in predicting the conditions to be expected asa result of highway investments. In the context of the developingcountries, however, these methods have serious limitations both be-cause of weaknesses in the models and because of the more dynamicchanges in the cities of the developing world and data inadequacies.
The difficulties stem in part from the interaction between changesin the transport system and the requirements for trips. Facilities pro-vided to meet demand induce additional demand. Short-term effectson the number of trips may be highly important as is frequentlyapparent when a new major link is introduced such as a new bridge.Longer-term effects on land use, as people and companies adjusttheir locations to take advantage of changes in transport conditionsshould also be incorporated. However, no satisfactory way has yetbeen found to incorporate feedbacks into the models so that thenumber of trips adjusts automatically to the conditions of transportsupply. The models are also weak in simulating traffic behavior underconditions of acute congestion such as are encountered over largeareas and long periods in developing countries. The models, in ex-trapolating one static position to another in a future year, may also bebiased towards preservation of highly unbalanced and unsatisfactoryconditions. Difficulties also exist in modeling the interactions be-tween different parts of the road network and, in particular, deter-mining necessary speed/flow relationships on minor arterial and localstreets. Complex though the grid used customarily is, a more detailedcomplex of linkages is needed for studying local traffic managementschemes such as one-way streets.
Furthermore, the models cannot readily handle major changes inpolicy such as introduction of congestion charges. Problems arise notonly from absence of data establishing the impact of price changeson demand but also from the increasing model complexity. Themodels are already highly complex and costly to prepare and run asa result of the numerous zones and system links required. Iterativeand other processes to introduce additional factors affecting demand,supply and interactions between them, and involving changes in in-puts and further reruns, are likely to be prohibitively expensive. Al-ready feedbacks of system supply changes on modal split and tripdistribution are proving very costly. Even to evaluate a simple invest-ment plan with existing methodology and computer techniques gen-erallycostswell above $500,000 and takes at least twoyears to becomeoperative. The developing countries may well hesitate on these
95

Annex 7
grounds alone. Attempts to reduce financial and time costs of prepa-ration by borrowing existing models are, in practice, likely to lead tduse of models little suited to the particular task or conditions.
For the developing countries, the current conventional urban,transport models have further serious limitations due to the rapidityand uncertainty of change. To allow for long time periods neededfor technical studies, design, and building of major urban transportinvestments, the "design year" is often as much as 20 years ahead.Over 20 years, the population and area of a city of a developingcountry may have more than quadrupled; the urban pattern and theeconomic and social characteristics of the population will havechanged drastically. The growth of income is subject to great unpre-dictable variation. Alternative estimates of numbers of families ableto afford private cars in the design year may, validly, vary by 100%or more. Past data and trends, even if much more accurate than ihfact they are, cannot unfortunately provide a reliable guide for futuredemand conditions either in total or, even less, by city zone. In brief,extrapolation techniques that may be valid for relatively gradual andsmall changes of urban population, land use and mores cannot berelied upon to yield similar accuracy with the abrupt and largechanges encountered in developing countries. There are additionaldifficulties in evaluating the choice of transport modes. Over 20 yearsthe additions to the transport system in developing country cities willbe so large in comparison with the existing system that greater varia-tion in future urban transport patterns is feasible; the existingcapacities, which can be measured, are likely to be only a small frac-tion of the total.
The urban transport conditions in the developing countries, there-fore, call for use of somewhat different methodologies. More useshould be made of a broad-brush approach to investigate the pos-sibility of considerable changes in the availability of different typesof transport facilities in relation to wide alternatives in land use andpopulation characteristics. The desirability of such an outline ap-proach or "strategic planning" as a basis for major changes is, infact, also becoming increasingly felt in the developed countries.'The current emphasis on attempts further to refine computer tech-niques for extrapolating trends and producing single optimum trans-port or land use solutions-with all the risks of cumulating errors that
'As the complexities and costs of existing urban transport computer models effectively,limit the testing of more than three or four alternatives, the initial selection of alterna-tives to test becomes of critical importance.
96

Annex 7
this involves-needs to be reexamined. More productive wouldgeem to be the construction of outline scenarios related to minimumobjectives and comprising a series of alternative future urban patternswith transport systems corresponding to their density and work-resi-tHence location characteristics and closely interrelated with demand.
For the purpose of testing investment alternatives and policy op-tions, trips and speeds by differing modes need to be related tolengths of road and other infrastructure capacity, and with populationdensities. Observed relationships in a variety of cities can be used toestablish such rough relationships and the extent of variations.2 Socialsurveys are needed to investigate more thoroughly the extent of latentdemand, including particularly households ready to pay for but notserviced by public transport, so as better to establish public transportobjectives.
With such an approach, the extent of policy changes and costs ofinvestments involved can be roughly assessed and compared withrelative advantages and ease of implementation, substantially narrow-ing the field before more detailed investigations are undertaken. Sinceactual developments will, in any case, differ from those assumed, andsince what now appears the best choice may cause unforeseen diffi-culties within very few years, a premium should be placed on keepingoptions open. Where comparable in other respects, investment alter-natives that would be at least reasonable if conditions in fact ap-proximate to a variety of the other scenarios considered should bepreferred. Similarly, programs and investments that are sufficientlyflexible to be easily adapted to changed conditions deserve specialconsideration. Road transport systems, for example, should, on thesegrounds, be generally preferred to fixed track systems, and segregatedbusways to metros, in view of greater ease of route changes, unlessstrong cost and location arguments exist favoring the less flexiblealternatives.
The long time periods and large changes involved pose furtherproblems in evaluation of costs and benefits of alternative packagesof urban transport investments and policies. In urban transport it isdifficult to define a "do nothing" situation which would prevail with-out the proposed investment and against which the situation withthe investment can be compared. If the population is doubling orquadrupling, it is inconceivable that no important transport invest-ments will be made in, say, 20 years; in the absence of new and2See the note on urban transport relationships at the end of this annex.
97

Annex 7
sizable investments, the population growth could not occur. More-over, failure to maintain existing standards of transport availabilitywould result in important changes in urban location which cannotreadily be predicted; people seek to minimize the deterioration withwhich they are faced. In these circumstances, a comparison of bene'-fits from the investment with a "do nothing" situation can be eithermeaningless or lead to considerable overestimates of both costs andbenefits. Insofar as policy changes are involved, it is in any casedifficult to apportion the benefits between investment and policychange. It is usually difficult to say what policy changes would havebeen introduced and what they might have achieved in a "mostlikely" state without the investment.
A minimum cost approach, in which the least-cost alternative ofachieving a stated objective is chosen, may therefore be required.However, if the objectives might be surpassed, a cost-effectivenessapproach, in which the additional benefits above the minimum objec-tives and corresponding additional costs are also taken into account,may be preferable. Even so, difficulties remain in evaluating the addi-tional investments and policies in the transport system which will becarried out or deferred on the basis of alternative projects; for ex-ample, what the level of road construction will be under alternativesof a metro or busway project.3
A particular problem is involved in determining the value to beplaced on time savings. Savings in time usually constitute a large partof calculated benefits. For purposes of estimating the timing of tripsand choice of mode, conventional techniques which impute a valuefor time spent in direct relation to the income of the traveler appearjustifiable-provided they are checked against actual behavior. Adifferent set of values will, however, generally be appropriate fordetermining net time-saving benefits of a project or in the choicebetween alternative new investments.4 The highly skewed distribu-tion of income typical of the cities of developing countries can makesimple evaluations of benefits of time saving or losses based on in-3A further difficulty arises when evaluation of separate parts of a package of measuresand investments for improving city structure (e.g., transport elements of an area develop-ment package) may result in a smaller total of benefits than evaluation of the package asa whole. This may occur where interactions between the parts are important but cannotbe calculated.41n other words, it is desirable to use shadow prices or valuations in assessing the benefitsoi alternative solutions to urban transport problems but not in their design. Actual mone-tary prices or valuations expected to prevail must be used in assessing the physical out-come oi projects, levels of ridership, the effects on financial positions, etc. It would,therefore be ambiguous to talk of using shadow prices in the design of projects; they arerather to be used to evaluate the results of different designs based on actual prices.
98

Annex 7
come levels unsuitable in relation to the basic objectives of urbantransport policies. With current methodologies, for example, smalltime savings for automobile passengers can outweigh much largertime losses imposed on bus passengers. Leisure time of richer travel-ers is treated as much more important than of poor travelers. Suchimplicit social value decisions are more in the realm of politiciansthan of planners or model builders. Time savings and losses must,of course, be calculated. But the time saved or lost should be shownseparately by income group. The pricing of the time savings can thenbe treated as a policy variable by showing the implications of assum-ing different values for the time of the various groups involved.5
Even greater difficulties in evaluation of alternatives, however,arise from the importance of the "nonmeasurable" repercussions ofurban transport projects. Just because they are difficult or impossibleto measure in monetary terms, the impacts of transport projects onthe physical and social environment tend to be unduly neglected informal evaluations. It is, of course, necessary to measure and compareeconomic efficiency insofar as possible. But lack of similar monetarymeasures for say deterioration or improvement of neighborhoodliving conditions does not make such aspects any less important.Sometimes, different alternatives have much the same impacts inthese respects; for example, two different road alignments may havequite similar social impacts. If in such cases the impact appears onbalance favorable, it may be reasonable to ignore these aspects ofthe evaluation. When the impacts differ considerably, for example,between road and subway alternatives or in comparisons with alter-native investments in other sectors, this is not justifiable. Often, itshould be possible to provide information in physical units, for pollu-tion and noise levels; for example, even where monetary values arenot available. Accordingly, "balance sheets" indicating not onlymonetary costs and benefits but the degree to which physical objec-tives are attained should be included in the evaluation.6
The desirability of developing, implicitly if not explicitly, a set ofminimum objectives, the limitations of the methodology, and theimportance of taking "nonmeasurables" into account in the evalua-
'Other problems of evaluating time savings arise from the fact that persons tend to have"travel time budgets." Their own valuation tends to rise the greater the amount of traveltime in the day already preempted. Conversely, higher speeds may not save total dailytravel time but rather induce more or longer trips. This phenomenon is not taken intoaccount in current models where the number of trips is taken as a fixed total.6Similar difficulties arise in determining the appropriate social rate of discount particularlywhere provision is being made for future generations.
99

Annex 7
tion, all point to the need for urban transport planners to secure thecooperation of the decision makers at an early stage in developmentof programs and in subsequent stages. Political as well as technicaldecisions must be involved.
It should be noted finally that it is generally not possible, becauseof the multitude of interlinkages involved and other influences thatintervene, to measure directly the effects of urban transport invest-ment on urban productivity or efficiency in any general sense. Thealternative of measuring cost reductions can be applied in relationto commercial traffic and for operating costs of other road transport.For other aspects of costs of time and discomfort and the impact onurban patterns, the problems are much greater.
The difficulties involved in evaluating urban transport projects andpolicies are, as indicated, formidable. Conventional cost/benefitanalysis needs to be supplemented by many further considerations fora fully adequate assessment of the balance of benefits. Fortunately,however, even minimal evaluation of benefits and a conservativeevaluation of costs will in most practical cases provide a sufficientlypronounced balance to indicate the desirability or otherwise ofurban transport projects. While, therefore, it is extremely difficult,and probably impossible, to be sure of achieving optimal urbantransport investments, it is generally quite feasible to be reasonablysure of attaining major, though inevitably suboptimal, improvements.
Note on Urban Transport RelationshipsAn initial study has been made based on data collected from a
number of cities of the effect of different levels of motorization andpopulation densities on road requirements, speed and number ofmotorized trips for cities of various sizes.7 The available data arestill too few to permit definitive conclusions on the relationships,but there are indications of sufficient consistency in the results towarrant further development of the methodology. It should also benoted that the data reflect actual conditions, not what might beachieved by more purposeful measures to develop economical urbanpatterns such as would, for instance, reduce commuting distances.
With the reservation that results from the preliminary investiga-tions should be regarded as illustrative only, the following deductionsfrom the data may be noted. Some of the relationships are indicatedin the diagram.
'Y. Zahavi, Travel Characteristics in Developing Countries, a Bank Staff Working Paper.
100

Annex 7
Figute 7:1
Arterial RoadD
and PopD~~ Densit, by Motorization
6 ~~~~~~(For a vehicle ti rat aS.r
CiY Size
ot
6
PaPWtfati°o. mll UoioaJ
801
101~~~~~~~~~~~~~~~~1

Annex 7
Average Trip DistanceWhen a city grows in population and size, average trip distances
lengthen. The analysis indicates that for a given population densitytrip distances increase roughly in proportion to the square root ofthe radius of the city. For instance, growth in city population, sayfrom 1 to 2, 4 and 8 million, with population density remaining con-stant, may be expected to increase average trip distance by roughly20%, 40% and 65%, respectively, from the initial level.
Decreasing population density tends to increase the trip distance,since a lower density implies a larger area for the same population.Thus, if two cities have the same population, say 2 million, but onehas a population density of 12,000 people per square mile, while theother has a density of 6,000, the average trip distance in the latter casewill be found to be longer by about 20% than in the first case.
When cities grow in population, population densities tend after atime to decrease. Thus, the adverse effects of increase in populationand decrease in density tend to cumulate. For instance, if a city growsfrom 2 to 4 million while its population density decreases from 10,000to 8,000, the average trip distance may be expected to increase byabout 25%. If an average vehicle in the first case makes five tripsduring its daily travel time of 1.2 hours at a speed of 12.5 miles perhour, the same vehicle will probably have to travel at a speed of 16.5miles per hour to make the same number of trips in the second case.Furthermore, the same vehicle in a city of 8 million with a populationdensity of 6,000 will need a speed of about 20 miles per hour toachieve the same trip rate. This explains why travel speeds have toincrease in expanding cities if vehicle trip rates are to be maintainedwithin the same travel time per vehicle per day.
The Effect of Speed on the Need for More Roads
For a given flow of vehicles, higher speeds require more (and/orbetter) roads. By considering the relationship between flow, speedand arterial roads for the previous example, it can be shown thatwhile the ratio of road length to population in a city of 1 million islikely to be about 0.42 miles per 10,000 people for a populationdensity of 10,000 and a motorization level of 5 cars per 100 people,the ratio of road length per 10,000 people is likely to increase toabout 1.48 in a city with 8 million and population density of 6,000per square mile, even if the level of motorization remains the same.Some 3.5 times more roads per inhabitant will be required to keepthe same level of mobility at the same level of motorization. This
102

Annex 7
appears to be one explanation of the increasing difficulties in provid-ing adequate mobility in larger cities, particularly those that expandrapidly.
Very high densities of arterial roads are impractical since roads willbecome too closely spaced to allow efficient land use development.Furthermore, traffic speeds cannot be increased above, say 30 milesper hour, by the addition of further arterials because of operationaland safety constraints. There is therefore a practical limit to the extentto which additional arterial roads can increase speeds. After a certaincity size (depending on population density and motorization level),it becomes necessary to use high-speed roads such as expresswaysand/or reserved track for railways or busways to maintain the samelevel of mobility in an expanding city.
Effect of MotorizationWhen the factor of motorization is added, travel conditions are
aggravated even further since more cars per hundred population willrequire more roads if speeds are to be maintained within the sametravel period.
Thus, under the conditions of this example, if motorization levelswere to increase from 5 to 10 cars per 100 inhabitants, the roaddensity would have to be increased from 0.42 to 2.49, namely a sixfoldincrease.
ConclusionsHeavy investments in urban infrastructure can be deferred if closer
attention is given to population density, land use arrangements, masstransport and level of motorization. Highly compact cities with rapidpublic transport will not only need less motorized travel by cars butwill also discourage a rapid increase in motorization. If, on the otherhand, a city is allowed to grow freely in both size and motorization,the transportation burden on its inhabitants is likely to become pro-hibitively high, resulting in congestion and self-strangulation.
In developing countries, where all the factors such as populationarea and motorization increases at a rapid pace, planners should beaware of the probable impacts of these factors on the physical, eco-nomical and social development of the cities. Policies and plansshould be reevaluated in the light of the factors illustrated above.
103

World Bank OfficesHeadquarters: 1818 H Street, N.W., Washington, D.C. 20433, U.S.A.
New York Offices: c/o United Nations, Room 2245, Secretariat Buildings,New York, N.Y. 10017120 Broadway (15th Floor), New York, N.Y. 10005, U.S.A.
European Office: World Bank, 66, avenue d'lena, 75116 Paris, FranceLondon Office: World Bank, New Zealand House (15th Floor),Haymarket, London, SWI Y4TE, England
Tokyo Office: World Bank, Kokusai Building, 1-1 Marunouchi 3-chome,Chiyoda-ku, Tokyo 100, Japan
Eastern Africa: World Bank Regional Mission, Extelcoms House,Haile Selassie Avenue, Nairobi, Kenya;mailing address-P.O. Box 30577
Western Africa: World Bank Regional Mission, Immeuble Shell, 64, avenue Lamblin,Abidjan, Ivory Coast;mailing address-B.P, 1850
Afghanistan: World Bank Resident Mission, P.O. Box 211, Kabul, AfghanistanBangladesh: World Bank Resident Mission, Bangladesh Bank Building (4th Floor),
Motijheel Commercial Area, G.P.O. Box 97, Dacca, BangladeshColombia: Resident Mission Banco Mundial, Edificio Aseguaradora del Valle,
Carrera 10 No. 24-55, Piso 17, Bogota D.E., ColombiaEthiopia: World Bank Resident Mission, I.B.T.E. New Telecommunications Building
(First Floor), Churchill Road, Addis Ababa, Ethiopia;mailing address-IBRD Mission, P.O. Box 5515
Ghana: World Bank Resident Mission, c/o Royal Guardian Exchange Assurance Building,Head Office, High Street (5th Floor), Accra, Ghana;mailing address-P.O. Box M27
India: World Bank Resident Mission, 53 Lodi Estate, New Delhi 3, India;mailing address-P.O. Box 416
Indonesia: World Bank Resident Staff, Jalan Wahid Hasyim 100/102, Jakarta, Indonesia;mailing address-P.O. Box 324/IKT
Nepal: World Bank BIBRD) Resident Mission, R.N.A.C. Building (First Floor),Kathmandu, Nepal;mailing address-P.O. Box 798
Nigeria: World Bank Resident Mission, 30 Macarthy Street, Lagos, Nigeria;mailing address-P.O. Box 127
Pakistan: World Bank Resident Mission, P.O. Box 1025, Islamabad, PakistanSudan: World Bank Resident Mission, 2B Block 2H, Baladia Street, Khartoum, Sudan;
mailing address-P.O. Box 2211Tanzania: World Bank Resident Mission, N.I.C. Building (7th Floor, B),
Dar es Salaam, Tanzania;mailing address-P.O. Box 2054
Thailand: World Bank Regional Mission, Udom Vidhya Building,956 Rama IV Road, Sala Daengh, Bangkok 5, Thailand
Upper Volta: World Bank Resident Mission, B.P. 622, Ouagadougou, Upper VoltaVenezuela: World Bank Resident Mission, Centro Andres Bello, Avenida
Andres Bello, 113-E, Mariperez, Caracas, VenezuelaZaire: World Bank Resident Mission, Building UZB, avenue des Aviateurs,
Kinshasa 1, Republic of Zaire;mailing address-P.O. Box 14816
Zambia: World Bank Resident Mission, P.O. Box 4410, Lusaka, Zambia

I

World BankHeadquarters:1818 H Street, NW.Washington, D.C. 20433, U.S.A.
Telephone: (202) 393-6360Cable Address: INTBAFRAD
WASHINCTONDC
European Office:66, avenue d'1ena75116 Paris, France
Tokyo Office:Kokusai Building,1-1 Marunouchi 3-chomeChiyoda-ku, Tokyo 100, Japan