upstream biomass energy
TRANSCRIPT

Upstream Biomass Energy
Michael Weatherl

Background Shell is investigating several unproven
lignocellulosic biomass-derived fuel and energy technologies
These could provide sources of Hydrogen, liquid fuels, and other valuable chemicals
The logistical and economic aspects of the processes are not yet fully understood

Advantages of Biomass Energy Clean, renewable source of energy Does not release additional CO2 into the
atmosphere Utilizes waste material Creates local jobs and decreases
foreign imports Several areas of high biomass
availability near areas of high demand for the end product

Project Description Identify key parameters governing bio-energy
economics, especially in the USA, Canada, and Brazil
Quantification of costs for upstream biomass collection and handling
Review several biomass conversion processes to establish economic baselines for comparison
Document the energy balance of the process Develop a simple economic model to help
guide decision making

The Bio-Energy Process
Collection & Densification Handling/Storage Transportation Conversion Distribution of End-Product
‘upstream’

Feedstock Resources - USA
Corn Stover (non-food portion): 100+ million tons
Forest Thinnings: 40+ million tons Primary Mill Residues: 40+ million tons Urban Wood Wastes: 35+ million tons Other Agricultural Waste: 50+ million tons
Estimated Sustainable Annual Supply
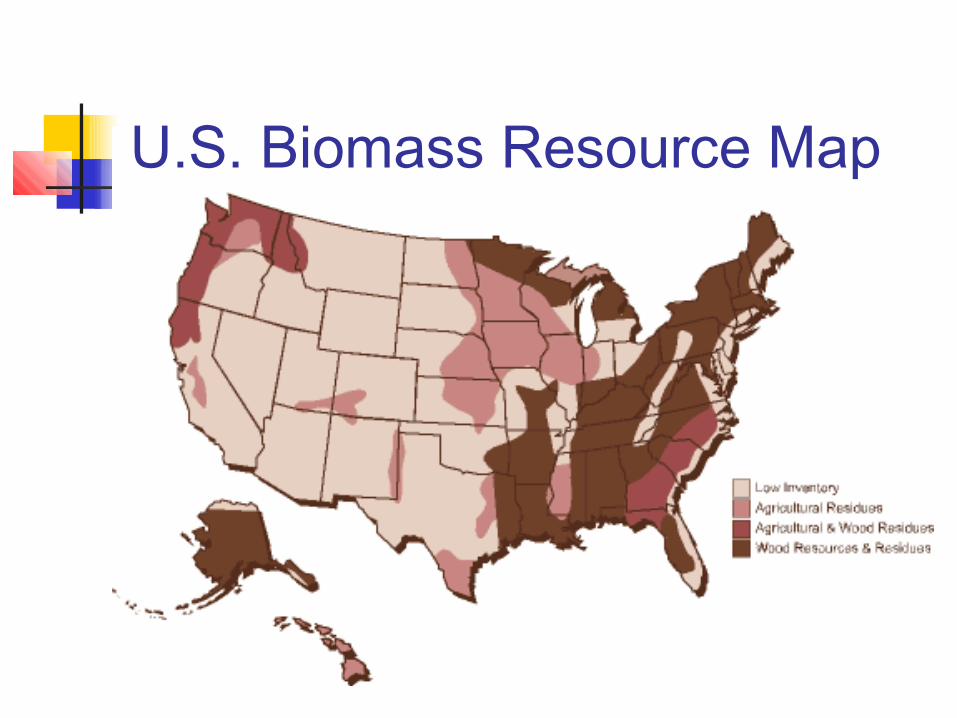
U.S. Biomass Resource Map
Feedstock Resources - Canada
Wheat Straw: 20+ million tons Forest Residues: 90+ million tons Mill Residues: 10+ million tons
Estimated Sustainable Annual Supply

Canadian Forestry Biomass

Canadian Agricultural Biomass

Feedstock Resources - Brazil Bagasse: 60+ million tons annually Highly developed sugarcane-to-ethanol
program

Brazilian Agriculture

A Note on Feedstocks… These numbers are conservative, and
take into account the main parameters of sustainable collection
Less than 10% of all agricultural residue is used
Pre-collected residues (bagasse & mills) tend to be used for inefficient boiler firing, but are still very low cost
What if? ‘Efficient Energy Crops of the Future’
Technology will yield more and more appealing products as time progresses. Agriculture is no different.
ORNL estimates that ‘Dedicated Energy Crops’ could provide nearly 200 million tons of biomass in the U.S. annually.

Feedstock Productivity
Corn Stover: 1.5 Wheat Straw: 1.2 Forestry Waste: 5 Energy Crops: >10
Annual tons of Biomass per acre:

The Bio-Energy Process
Collection & Densification Handling/Storage Transportation Conversion

Biomass Collection: Case Studies
Agricultural Residue: Harvest & Collection Costs ($/ton)
Approximate Farm-Gate Cost: $27/ton
Mowing Baling Stacking TotalSource 1: Rice Straw 6 14 7 27
Source 2: Wheat Straw 7 8 11 26Source 3: Corn Stover 10 12 5 27

Biomass Collection: Case Studies
Collect/Bundle Foreward/Load Chipping TotalSource 1 16 5 3 24Source 2 7 8 11 26Source 3 10 12 5 27
Forestry Waste: Collection Costs ($/ton)
Approximate Roadside Cost: $26/ton

Biomass Collection: Conclusions One-Pass harvest of both grain and
waste biomass would eliminate several steps.
Sustainable collection is important Agricultural Residue: $27/ton Forestry Residue: $26/ton For centrally located feedstocks,
purchase cost is $5-$15/ton (based on LHV, alternate uses)
The Bio-Energy Process
Collection & Densification Storage/Handling Transportation Conversion

Biomass Storage Agricultural waste that is only harvested once
or twice annually requires storage Large bales stored field side and covered by a
tarp will resist damage. This costs about $5/ton.
Forestry waste is generated year-round, and does not require storage
Mill residues and bagasse are stored at the site where they are generated.

Biomass Handling Agricultural waste is transported to a
local pickup/storage point. Forestry waste is forwarded to the side of
the road to await transport Mill residues and bagasse are loaded
directly onto trucks and sent to the conversion center

The Bio-Energy Process
Collection & Densification Storage/Handling Transportation Conversion
Biomass Transport
Truck Train Barge Pipeline?
Main Options:

North American Rail System

Transport Cost: Agricultural WasteFixed Cost ($/ton) Variable Cost ($/ton-mile)
Source 1: Rice Straw Bales 5.5 0.09Source 2: Wheat Straw Bales 4.5 0.19
Assumed Trucking Cost 5 0.14Source 3: Freight by Rail 11 0.03
Agricultural Waste Transport
0
5
10
15
20
25
30
35
0 50 100 150 200Distance (miles)
Tra
nsp
ort
Co
st (
$) Trucking
Rail

Delivered Cost: Agricultural WasteDelivered Cost of Agricultural Feedstock
0
10
20
30
40
50
60
0 50 100 150 200
Distance
Co
st ($
/ton
)
Cost After Storage
Delivered Cost (Trucks)
Delivered Cost (Rail)

Transport Cost: Forestry WasteFixed Cost ($/ton) Variable Cost ($/ton-mile)
Truck Transport 4 0.2Barge Transport (if possible) 15 0.02

Delivered Cost: Forestry WasteDelivered Cost of Forestry Residue
0
10
20
30
40
50
60
70
0 50 100 150 200
Distance
Co
st (
$/to
n)
Flat Costs
Delivered Cost
Barge (w here available)

Pipeline Transport

Pipeline Transport? Short term: probably not Long term: more likely Allows for economies of scale and
integrated processes

Biomass Transport: Conclusions
Agricultural Waste: <$50/ton Forestry Waste: <$42/ton Centralized Feedstocks: <$30/ton
Delivered Price:

The Bio-Energy Process
Collection & Densification Storage/Handling Transportation Conversion

Conversion Technologies Combustion (gasification)
Fermentation (MixAlco)
Scale is everything!

Gasification into HydrogenPlant Scale (tons of bioimass/day) Cost of Hydrogen ($/GJ)
345 17.081150 15.391730 14.29
Gasification
0
2
4
6
8
10
12
14
16
18
0 500 1000 1500 2000Plant Scale (tons of biomass/day)
Co
st
of
Hy
dro
ge
n (
$/G
J)
Predicted Plant-GateHydrogen Selling PriceCurrent WholesaleHydrogen Price
MixAlco MixAlco is a fermentation process which
utilizes cellulosic feedstocks (non-food sources such as waste from agriculture and forests)
Yields chemicals that can be made into acids, alcohols, and hydrogen
Developed by Dr. Mark Holtzapple of Texas A&M University

Primary Alcohol Selling Price per Capacity, for different Feedstock costs
0
0.2
0.4
0.6
0.8
1
1.2
1.4
0 1000 2000 3000 4000 5000
Tons of Biomass per Day
Sel
lin
g P
rice
($/
gal
)
$11/ton
$22/ton
$33/ton
$44/ton
$55/ton
Today
MixAlco Costs
A healthy skepticism… 15% ROI may not be high enough for
such a high-risk investment Feedstock quantity and quality are
inconsistent These numbers are educated guesses
and may overlook some unseen costs

Energy Balance
Lignocellulosic-derived ethanol has a higher NEV (Net Energy Balance - an estimated 60,000 Btu) because of a less energy-intensive conversion process, when compared to traditional ethanol sources like corn
Hydrogen will have even higher NEV because it does not require a fuel-grade liquid

Conclusions: Centralized residues appear to be the
most viable option presently Forestry waste also appears feasible,
but not as cost-effective Agricultural waste appears to be the
least economical feedstock presently Transport costs have the greatest
impact on optimal scale Infrastructure is the only showstopper

Acknowledgements:I’d like to thank the members of Shell Gamechanger for giving me the opportunity to take part in this project and learn so much this summer.
Special thanks to Jerry Morris, Jack Hirsch, Scott Wellington, Brendan Murray, Ron Reinsfelder, Jingyu Cui, Rebecca Hubbard, Russ Conser, Don Maynard, Tim O’Gorman, Jochen Marwede, Lori Glassgold, Jair Guarda, Jaison Thomas, and the rest of the Gamechanger team.
It’s truly been a pleasure!