upper ridge induced mcs and severe weather by richard h
TRANSCRIPT

Upper ridge induced MCS and Severe Weather By
Richard H. Grumm National Weather Service State College PA 16803
1. INTRODUCTION A large upper level ridge (Fig. 1a) with anomalous 500 hPa heights to include a close 594dm contour implied a heat wave was in place over the eastern United States. The 850 hPa temperatures were also above normal (Fig.1b). The closed 594dm contour is a good indicator of heat waves and 1 to 2 SD above normal 500 hPa heights in the summer months. The 03-hour forecasts showed that the ridge and warm
temperatures were would persist into the overnight period. Figure 2 shows the high temperatures for 7 August 2007. Note the large are affected by the 100+ temperatures from Oklahoma to North Carolina with many locations in the 90s surrounding that region. An above normally warm day over much of the southern and eastern United States. As with many eastern US heat events,
Figure 1 NAM 500 00-hour forecast initialized at 08/0000 UTC showing a) 500 hPa heights (m) and anomalies and b) 850 hPa temperatures and anomalies. Left side is valid at 00000 UTC and the right side is the 3-hour forecast valid at 0300 UTC 8 August 2007.

Figure 2 High temperatures valid for Tuesday 7 August 2007. Courtesy of the PSU ewall page at http://www.meteo.psu.edu/~gadomski/SFCUS/yesmax.html
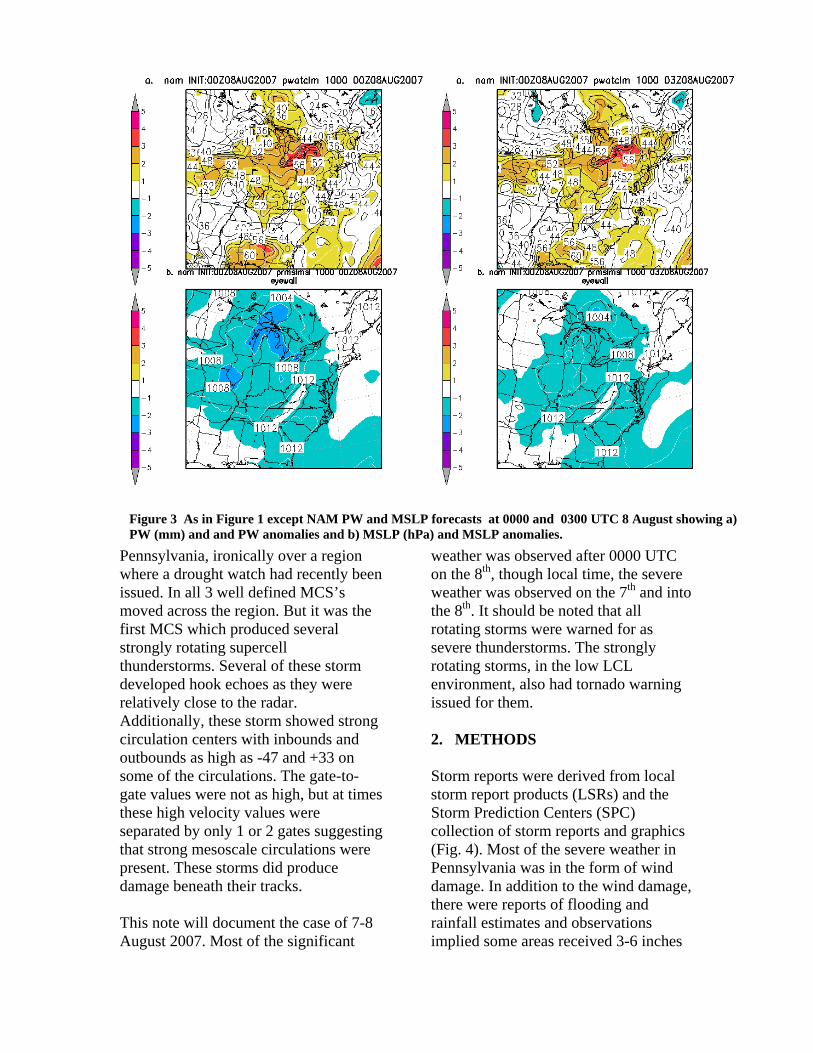
warm moist air, often associated with high and anomalously high precipitable water (PW) values moves over the ridge as shown in Figure 3a (both left and right panels). Note that the PW anomalies were over 2 SDs above normal over the Great Lakes and pockets of +3.5 SD above normal air were present. These high PW situations are conducive to producing convection and the potential for heavy rainfall. In addition to the high PW values, a strong impulse, marked by a strong low-level jet moved over the region and likely contributed to the organization and strength of the convection. No attempt has been made to examine whether or not this was infact a ridge roller (Galarneau and Bosart 2005). However, it was clear that the convection occurred
over the ridge centered over the eastern United States (Fig.1). The data in Figure 3 also show that low pressure dominated the eastern United States at the surface. MSLP anomalies were near -2SDs below normal over the Great Lakes region. The convection that developed over Pennsylvania came on the heals of a weakening MCS that moved over the State during the day on the 7th. That system precluded extremely high temperatures due to clouds and light rain. But it also served to moisten the atmosphere. Late on the 7th, a series of MCS’s moved across the State. This resulted in locally heavy rainfall in northwestern
Pennsylvania, ironically over a region where a drought watch had recently been issued. In all 3 well defined MCS’s moved across the region. But it was the first MCS which produced several strongly rotating supercell thunderstorms. Several of these storm developed hook echoes as they were relatively close to the radar. Additionally, these storm showed strong circulation centers with inbounds and outbounds as high as -47 and +33 on some of the circulations. The gate-to-gate values were not as high, but at times these high velocity values were separated by only 1 or 2 gates suggesting that strong mesoscale circulations were present. These storms did produce damage beneath their tracks. This note will document the case of 7-8 August 2007. Most of the significant
weather was observed after 0000 UTC on the 8th, though local time, the severe weather was observed on the 7th and into the 8th. It should be noted that all rotating storms were warned for as severe thunderstorms. The strongly rotating storms, in the low LCL environment, also had tornado warning issued for them.
Figure 3 As in Figure 1 except NAM PW and MSLP forecasts at 0000 and 0300 UTC 8 August showing a) PW (mm) and and PW anomalies and b) MSLP (hPa) and MSLP anomalies.
2. METHODS Storm reports were derived from local storm report products (LSRs) and the Storm Prediction Centers (SPC) collection of storm reports and graphics (Fig. 4). Most of the severe weather in Pennsylvania was in the form of wind damage. In addition to the wind damage, there were reports of flooding and rainfall estimates and observations implied some areas received 3-6 inches

Figure 5 As in Figure 1 except NAM winds at 0000 and 0300 UTC 8 August showing a) 850 hPa winds and u-wind anomalies and b) 850 hPa winds and V-wind anomalies.
of rain. Southeastern areas were spared most of the convection and rainfall. All radar and satellite data were obtained from the real-time AWIPS archive and made using the AWIPS software. The focus is on the central Pennsylvania radar (KCCX) and infrared imagery over the northeastern United States. Model data was used from our local ingest and is often shown in relation to how the field departed from normal in standard deviations (SDs) from normal. For brevity times will be written as day and UTC hour such as 08/0000 UTC implying 8 August 2007 at 0000 UTC. All times are UTC unless specified otherwise.
3. RESULTS Figure 5 shows the SREF winds initialized and valid at 08/0300 UTC. Note the strong west-southwesterly winds and the anomalous westerly flow. The 850 hPa winds were forecast to be +2 to +3SDs above normal. The winds were forecast to be on the order of 35 to 45 kts over the region. Though not shown, high resolution models implied low-level wind near 50 kts. Previous work has shown a relationship of strong and anomalous winds with organized convective events and heavy rainfall. It is clear from Figures 3 & 5 that some of the key ingredients associated with both severe weather were present. High PW and anomalous winds were observed over the region. Though not shown, high

B
A
C
a) 0132 UTC
Cape values were also forecast over the
B C
A
b) 0325 UTC
Figure 6 GOES IR images showing key convective areas labeled as A,B, and C valid at a) 0132 and b) 0325 UTC.
region during this time period. a. MCS evolution The first cluster of thunderstorms and a small MCS was over central Pennsylvania (A) at 0132 UTC (Fig 6a). There was a significant lightning with this system and radar images of this system will be shown in the next section. This system produced the severe weather over Centre, Clinton, and Union Counties. Note the second MCS over Ohio (C) and developing convection (B) over southwestern New York. By 08/0225 UTC MCS A grew and had moved eastward. Cluster B began to take shape as an MCS and MSC C moved into eastern Ohio (not shown). By 08/0325, MCS A began to weaken
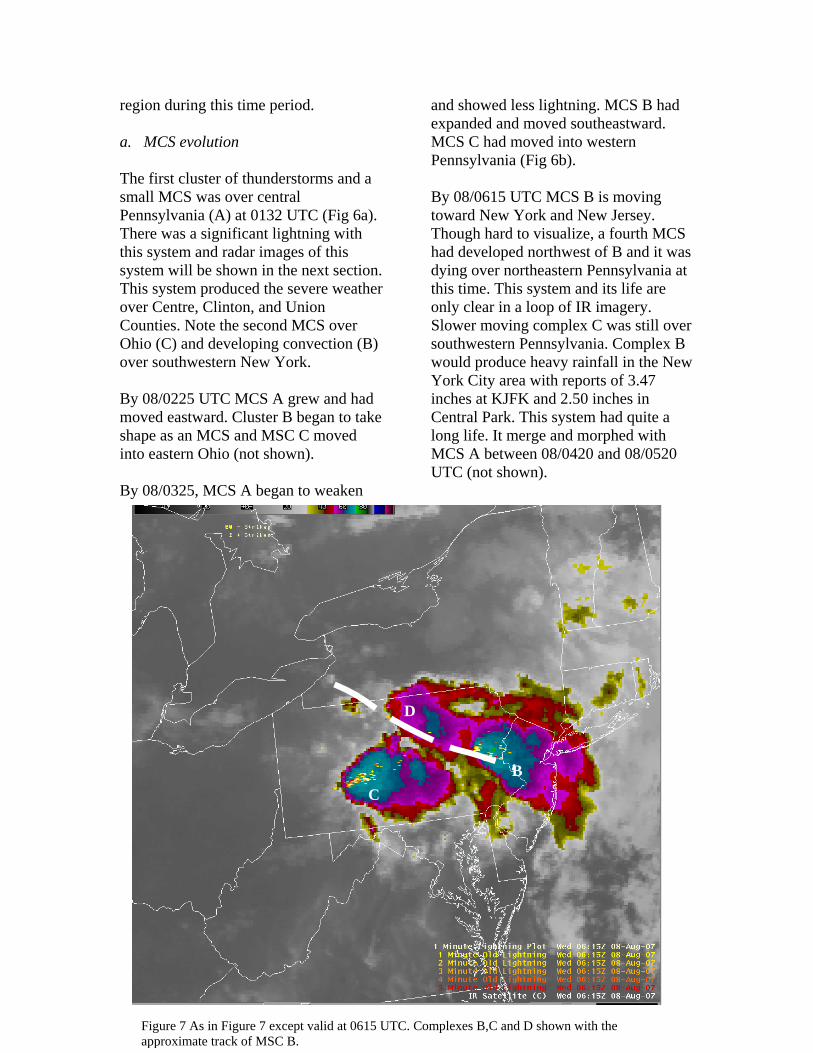
and showed less lightning. MCS B had expanded and moved southeastward. MCS C had moved into western Pennsylvania (Fig 6b). By 08/0615 UTC MCS B is moving toward New York and New Jersey. Though hard to visualize, a fourth MCS had developed northwest of B and it was dying over northeastern Pennsylvania at this time. This system and its life are only clear in a loop of IR imagery. Slower moving complex C was still over southwestern Pennsylvania. Complex B would produce heavy rainfall in the New York City area with reports of 3.47 inches at KJFK and 2.50 inches in Central Park. This system had quite a long life. It merge and morphed with MCS A between 08/0420 and 08/0520 UTC (not shown).
C
D
B
Figure 7 As in Figure 7 except valid at 0615 UTC. Complexes B,C and D shown with the approximate track of MSC B.

These few IR images and the description of the key systems shows that it was active night with at least 4 MCS’s affecting the region in the high PW air and the anomalously strong west-southwesterly jet as shown in Figures 3 & 5. b. Radar of severe storm Composite radar images in Figure 8 show the complexes over central and northern Pennsylvania labeled A and B in Figure 6. Complex A, the leading one took on more organization in time while complex B has a linear structure early in its life cycle. In Figure 8a, the leading edge of convection associated with complex C was present in western Pennsylvania. MCS C would not make its presence known until much later as it moved over central Pennsylvania and dominated the region as shown in the 0604 UTC composite image (Fig. 9). The storm of interest from a severe weather perspective was associated with
the initial convection noted as MCS A. Storms in this cluster of convection rapidly took on rotation and 2 distinct supercell thunderstorms were observed on the KCCX radar. Both storms were close enough to the radar to show hooks in the reflectivity data. Figure 10 shows the storm relative data at 08/0201 UTC. The arrow shows the storm of interest and points to the red outbounds. Note the main couplet of green-red is at and north of the arrow while a smaller circulation is south of the arrow. Clearly there were two distinct mesocyclones at this time, though the 0.5 degree slice only showed the inbounds. The mid-level slices suggested a larger mesocyclone with a smaller vortex. A tornado warning was issued on this storm. The hook in the reflectivity data was self-evident at 08/0144 UTC and other scans (not shown). This was one of the more impressive hooks close to the radar in many years. A memorable hook was visible closer to State College on 29 May 1995. That storm did not
a b
Figure 8 KCCX composite reflectivity valid at a) 0209 ) 0308 UTC.

Figure 9 As in Figure 8 except valid at 0604 UTC showing the echoes with MSC C in Figures 6 & 7 over west-central Pennsylvania.
observable damage on Memorial Day of that year. The storm in Figure 11, in addition to the hook had some elevated cores of 65-79 DBZ as shown in the lower left panel. This storm likely
produced hail, though it was over a rural area and it was after sunset suggesting hail would be difficult to verify.
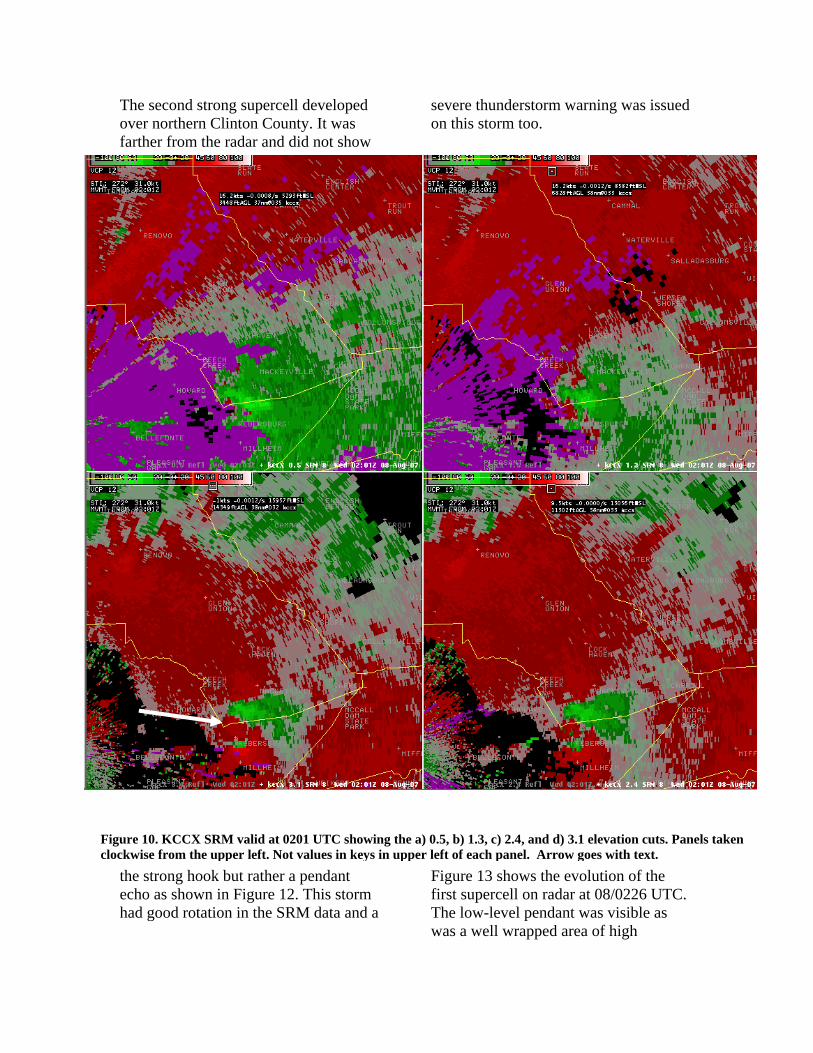
The second strong supercell developed over northern Clinton County. It was farther from the radar and did not show
the strong hook but rather a pendant echo as shown in Figure 12. This storm had good rotation in the SRM data and a
severe thunderstorm warning was issued on this storm too.
Figure 13 shows the evolution of the first supercell on radar at 08/0226 UTC. The low-level pendant was visible as was a well wrapped area of high
Figure 10. KCCX SRM valid at 0201 UTC showing the a) 0.5, b) 1.3, c) 2.4, and d) 3.1 elevation cuts. Panels taken clockwise from the upper left. Not values in keys in upper left of each panel. Arrow goes with text.

reflectivity about the updraft core with a dearth of reflectivity data on the northwest flank. Cross sections showed a BWER with this storm (not shown). The SRM data with this storm at this time is shown in Figure 14. Note the tight gate-to-gate winds in the 3.1 degree slice in eastern Centre County (lower left panel). The stronger circulation center was with the larger feature over Centre County. However, a smaller scale couplet was visible to the south of this feature. Figure 15 shows the SRM data with the more northern supercell shown in Figure 13. These data and storm structures are best viewed using a loop. 4. CONCLUSIONS A strong upper-level ridge produced hot weather over most of the southern and eastern United States on 7 and 8 August 2007. This heat wave had the classic closed 594DM counter at 500 hPa over the affected region. Like many heat waves, warm moist air, marked by anomalous PW values moved over the ridge. Unfortunately, the State of Pennsylvania was on the northern edge of the ridge and the warm moist air and a strong low-level jet produced a series of MCS’s over the State on the 7th and into the early morning hours of the 8th of August. These MCS’s produced locally heavy rains over northwestern portions of the
State and areas of severe weather. One of the earlier MCS produced severe weather in central Pennsylvania between 08/0220 and 08/0400 UTC. Two of the supercells associated with this MCS were presented. One of the supercells was close enough to the radar to produce an observable hook echo, not a common feature on the KCCX radar. The warm moist air, the strong low-level jet and the low LCL levels all contributed to producing the supercells and the MCS’s. The low LCL’s may have played a role in the tornado warnings issued on the first supercell thunderstorm in Clinton, Centre, and Union Counties. Though not shown, the storm persisted and moved into Union County. The first supercell of the night formed close to the KCCX radar. Based on the rotation northwest of Bellefonte, PA, and that it was only visible in the 1.3 and 2.4 degree slices, the timely severe thunderstorm warning impressive. It is a credit to those who operated the radar to have noted and taken action on the mesocyclone in the higher volume scans. The lower slice was slow to show the circulation center until it moved eastward as it was obscured by the clutter and may have developed at higher levels in the storm. 5. REFERENCES

Figure 11As in Figure 10 except KCCX base reflectivity data for the 4 slices at 0144 UTC. The hook is self-evident.

Figure 12 As in Figure 11 except focused over Clinton County at 0259 UTC showing reflectivity data. Note the pendant on the southwest flank of the echo.

Figure 13. As in Figure 12 except valid at 0226 UTC.

Figure 14 As in Figure 13 except SRM data at 0226 UTC. Figure 14 As in Figure 13 except SRM data at 0226 UTC.

Figure 15 SRM data at 0259 UTC associated with the storm shown in Figure 13.