upper mississippi river restoration science in … · upper mississippi river restoration . science...
TRANSCRIPT

i
UPPER MISSISSIPPI RIVER RESTORATION SCIENCE in SUPPORT of
RESTORATION AND MANAGEMENT SCOPES OF WORK FISCAL YEAR 2015

ii
Proposal Title PI UMESC
funding (gross)
State funding (gross)
USACE funding
TOTAL FUNDING
Seamless Elevation Data (remaining work) Dieck/Hanson $420,343 $420,343 Producing NED ready LiDAR products Nelson/Dieck $93,063 $93,063 Pool 12 AM Monitoring - pre-construction biological response monitoring (crappie telemetry) (Pool 12 AM)
Bierman $27,130 $23,571
$10,320 $61,021
Fish Indicators of Ecosystem Health McCain $12,913 $45,317 $15,680 $73,910
Plankton community dynamics in Lake Pepin, a natural riverine lake in the Upper Mississippi River
Burdis $13,143 $13,143
Estimating trends in UMRR fish and vegetation levels using state-space models
Gray $43,490 $43,490
Generating and serving presumptive habitat maps for 28 UMRS fish species
Hlavacek/Ickes $ 10,002 $ 10,002
Predictive Aquatic Cover Type Model – Phase II
Yin $59,722 + $7,814
$54,900 $122,436
Landscape Pattern Research on the Upper Mississippi River System: Synthesis and Significance, FY16-18
De Jager $589,018 $589,018
Developing and applying indicators of ecosystem resilience to the UMRS
Houser $483,171 $483,171
TOTAL $1,720,320 $109,161 $80,900 $1,910,381 These Scopes of Work (SOWs) describe science support tasks for the US Army Corps of Engineers’ Upper Mississippi River Restoration (UMRR) (formerly Environmental Management Program), authorized by Congress in the 1986 Water Resources Development Act, and as amended, to be performed by the USGS-Upper Midwest Environmental Sciences Center (UMESC) in La Crosse, Wisconsin; the five UMRS basin states of WI, MN, MO, IA, and IL; and the Corps of Engineers.
1
Seamless Elevation Data Previous UMRR LTRM project: Bathymetry and LiDAR are two of five high priority components identified in the UMRR LTRM 2010-2014 Strategic Plan as being needed to broaden the understanding of the relationships among ecosystem components and processes. Once complete, a systemic data collection will exist for bathymetric and floodplain topographic (LiDAR) that combined, will provide a seamless elevation data layer for the UMRS. Such information is vital to improve our scientific understanding of the river ecosystem, and the processes that drive habitat patterns, and ecological responses. This knowledge will increase the effectiveness of large river restoration efforts and help reduce costs for future project designs. Name of Principal Investigator(s): Jennifer Dieck, Jenny Hanson USGS – UMESC USGS-UMESC Collaborators : Jason Rohweder, Spatial Applications Biologist, Jim Rogala, Fishery Biologist, Joe Jakusz, GIS Specialist, JC Nelson, Geospatial Biologist, Jayme Stone, GIS Technician Introduction/Background: The UMRR has invested heavily in the data acquisition. Continuing the work towards usable LiDAR data sets and seamless LiDAR/Bathymetry integration is a high priority of the UMRR partnership. To date, all Tier 1 digital LiDAR derivatives have been completed, and can be found at: http://www.umesc.usgs.gov/data_library/gis_data/lidar.html. Tier 1 derivatives consist of quick “process and serve” of original LAS files into Digital Elevation Models (DEMs), Hillshades, and 1-meter contours. Pools 2-13, 20-24, and the St Croix River (LTRM portion) have Tier 2 derivatives complete. Tier 2 LiDAR further processes (and will replace) Tier 1 by reclassifying LAS data errors, masking or flattening the water surface, and smoothing the contours. Tier 3 – the seamless integration of LiDAR and Bathymetry – is in the process of being completed for Pools 3-5, 7-9, 13, and 21. Bathymetry data has been collected for the entire UMRS. To date, bathymetry point data has been processed into usable point coverages for Pools 3, 4, 7-10, 13, 21, 26, and the ILWW La Grange pool. Light Detection And Ranging (LiDAR) generates extremely accurate (vertical and horizontal) location information and has long been a desired product for the Upper Mississippi River System (UMRS). Previously, the best publicly available elevation data for the entire UMRS was at a resolution of 30 meters/cell, though 10 meter/cell data have been available for many areas. Now, UMRS LiDAR-derived elevation data are available at 1 meter /cell resolution. Many information needs can be met using individual LiDAR products, but integrated elevation data, combining LiDAR and bathymetry data, are required in some cases. For example, hydrodynamic models used to predict flow and inundation have until now been limited to predictions in low water conditions. Other examples are information on near-shore habitat use by water birds, fish spawning and marshland vegetation. A systemic seamless elevation data layer of the UMRS is essential in understanding the river ecosystem, as well as for habitat restoration planning, landscape modeling, and researching the ecology of floodplain communities. Relevance of research to UMRR: A systemic collection of LiDAR and Bathymetry has been completed for the LTRM monitoring reaches. Much of the technical work to convert raw LAS data and bathymetry points has been done on several UMRS pools. Completing the remaining work to produce the ultimate dataset of a systemic seamless elevation layer is essential for enhancing scientist’s knowledge about the UMRS system and trends, future implementation of ecosystem restoration programs and projects. Completing the remaining LiDAR and Bathymetry databases will fully complete the high priority components identified in the UMRR LTRM 2010-2014 Strategic Plan as well as subsequent years of LiDAR and bathymetric work. UMRR Long Term Resource Monitoring Program 2010-2014 Strategic and Operational Plan, dated 30 June 2009
UMRR LTRM LiDAR Data Acquisition Plan, dated 29 January 2009 UMRR LTRM Bathymetry Data Acquisition Plan, dated 22 May 2009
Methods: LiDAR Tier 2 methodology further processes the LiDAR by classifying data errors, flattening the water surface, smoothing contours, followed by a thorough Quality Assurance/Quality Control (QA/QC) assessment. The remaining pools that need Tier 2 processing are: 14-19, 25, 26, Open River, and the complete ILWW. The Bathymetry component processes bathymetry point data into point coverages of bathymetry. Remaining to process are Pools 2, 5a-6(p), 11-12, 14-15, 16-19(p), 22-25, Alt, Peo, Sta(p), Mar, and Dre. Tier 3 work consists of interpolating the water surface, merging of bathymetric and LiDAR Tier 2 datasets, and a final QA/QC. The remaining pools that need Tier 3 processing are: 2, 5a, 6, 10-12, St. Croix, Pool 14-20, 22-26, OR & Kaskaskia, and the ILWW. Budget:

2
Project is fully funded for both years FY 2015 - $297,145 FY 2016 - $123,198 See Science in Support of Management budget spreadsheets for details
Timeline: This work will take 2 years to complete in its entirety. All products will undergo formal USGS review.
Expected milestones and products [with completion dates]: Currently GIS data are downloadable through UMESC's Navigation Pool Data web pages. Similar GIS data can be produced upon request, as time allows, for specific areas needed for research studies or habitat project planning and assessment. Full implementation of this SOW will result in downloadable products for all remaining Tier 2 LiDAR, Bathymetry, and Seamless Elevation data sets (Tier 3) for a seamless systemic coverage of the UMRS floodplain and ILWW. Products and Milestones
Tracking number
Products Staff
Milestones
2015LB1 Tier 2 LiDAR for Pools 14-19 Dieck, Hanson 31 March 2015 2015LB2 Tier 2 LiDAR for Pool 25-OR & Kaskaskia Dieck, Hanson 30 June 2015
2015LB3 Tier 2 LiDAR for the Illinois River Dieck, Hanson 30 September 2015 2015LB4 All remaining Bathymetry Dieck, Hanson 30 September 2015
2015LB5 Seamless Elevation for Pools 2, 5a, 6, 10-12, St Croix, and Pool 14
Dieck, Hanson 31 December 2015
2015LB6 Seamless Elevation for Pools 15-19, 20, and 22-24
Dieck, Hanson 31 March 2016
2015LB7 Seamless Elevation for Pools 25-OR & Kaskaskia
Dieck, Hanson 30 June 2016
2015LB8 Seamless Elevation for the Illinois River Dieck, Hanson 30 September 2016

3
Producing NED ready LiDAR products Previous LTRM project: This project is an extension of the LiDAR work UMESC has been developing for the UMRR. Name of Principal Investigator(s): JC Nelson, Geospatial Biologist, Jennifer Dieck, Branch Chief, -USGS – UMESC Collaborators (Who else is involved in completing the project): Jenny Hanson, Biologist, Jayme Stone, GIS Technician, - USGS – UMESC Introduction/Background: Please address all of these questions: The UMRR has invested heavily in data acquisition. A large section of the Illinois/Mississippi River confluence and the middle Mississippi (Figure 1) has been designated for inclusion into the USGS’s National Elevation dataset. This work will expand current LiDAR processing to include areas away from the floodplain that were collected by the US Army Corps of Engineers.
Figure 1. Expanded LiDAR processing area
Relevance of research to UMRR: A systemic collection of LiDAR and bathymetry has been completed for the UMRR LTRM monitoring reaches. Much of the technical work to convert raw LAS data and bathymetry points has been done on several UMRS pools. Completing the remaining work to produce a systemic seamless elevation layer is essential for enhancing scientist’s knowledge about the UMRS system and trends, future implementation of ecosystem restoration programs and projects. Completing the remaining LiDAR and bathymetry databases will fully complete the high priority components identified in the UMRR LTRM 2010-2014 Strategic Plan as well as subsequent years of LiDAR and bathymetric work. Methods: UMESC will extend current Tier 2 processing to the new expanded area of interest, which includes: Development of Breakline Shapefiles Classification of Tiled LAS files Bare-earth DEM files XML Metadata for all products

4
UMESC will coordinate activities with other USGS personnel so that products best meet USGS standards (See NGTOC Data Delivery Checklist below) for inclusion into the NED. If UMESC is unable to recreate or reproduce any of the NGTOC Checklist items they will take all steps possible to get the information from the original vendor.
Special needs/considerations, if any: The seamless elevation scope of work needs to be funded and the timeline proposed in that scope needs to be accepted in order to meet the requirements set forth in this scope of work. Budget: $93,063 See Science in Support of Management budget spreadsheets for details Timeline: As to not disrupt other UMRR LiDAR and LCU efforts, UMESC proposes completing this process within 12 months after receiving funding. All products will be delivered to the National Geospatial Operations Center through a USGS Geospatial Liaison. Products and milestones:
Tracking number
Products Staff
Milestones
2015NED1 Perry County, MO Nelson, Dieck 31 July 2015 2015NED2 Remaining portions of the middle
Mississippi (OR1 & 2) Nelson, Dieck 31 July 2015
2015NED3 Area of the Upper Mississippi (Pool 25-26) Nelson, Dieck 30 September 2015 2015NED4 Illinois River area Nelson, Dieck 30 September 2015
5
Pool 12 Overwintering HREP Adaptive Management Fisheries Response Monitoring – Pre-construction Biological Response Monitoring (Crappie Telemetry)
Previous UMRR LTRM project: This project builds on several years of pre-project fisheries monitoring for the Pool 12 Overwintering HREP conducted by the Iowa DNR. (Note: A separate proposal for continued netting work in Pool 12 was submitted as an “Analysis Under Base” proposal for FY15). Name of Principal Investigator: Dave Bierman, Kirk Hansen and Mel Bowler (Iowa DNR); Chuck Theiling (USACE) Collaborators: All permanent staff at the Iowa DNR UMRR-LTRM Field Station (Bierman, Bowler, Travis Kueter, plus two seasonal workers) will perform the field work/data collection. Kirk Hansen with Iowa DNR Mississippi River Research Team in Bellevue ([email protected] 563-872-4976) is responsible for sample design and aids Mel Bowler in data analysis. Chuck Theiling with USACE ([email protected] 309-794-5636) helps direct and coordinate adaptive management analysis for USACE. Introduction/Background: The Iowa DNR has been studying centrarchid overwintering habits and habitat requirements in the Upper Mississippi River for over 30 years. This work has identified the physical conditions necessary for overwintering and ecological responses to fisheries habitat restoration in HREPs such as Brown’s Lake (Pool 13) and Mud and Sunfish Lakes (Pool 11). All of these projects considered fish movement into individual backwaters and habitat suitability in response to restoration. Centrarchid overwintering issues have long been important to river managers because much backwater habitat has been greatly altered or reduced by sedimentation since the 1930s. Centrarchids are also a key component of the sport fishery in the Upper Mississippi River, and public interest in the population dynamics of these species is high. As such, questions still exist as to the longitudinal spacing of fisheries overwintering HREP projects. The Pool 12 Overwintering HREP is unique because four backwater lakes (Sunfish, Stone, Tippy, and Kehough - in order of construction) are being rehabilitated in the same navigation pool (all within roughly eight river miles of each other), in the same window of time, and as part of the same HREP. Pre-construction fisheries monitoring is being conducted to establish a baseline for evaluating response of selected fish species to the HREP, for comparison with the results of post-construction monitoring efforts to be conducted following completion of construction. In anticipation of the construction of the Pool 12 Overwintering HREP, the Iowa DNR has been performing pool-wide electrofishing in Pool 12 since 2006. Iowa DNR has also been performing fyke netting since 2006 in the specific backwater lakes that will be rehabilitated, as well as other backwaters in Pool 12 that will not be rehabilitated (as a control). Additionally, Iowa DNR completed a previous pre-construction radiotelemetry project using white crappie Pomoxis annularis in Pool 12 in FY10. In this study, radio-tracking transmitters were attached to 200 white crappie in four overwintering backwaters in Pool 12 (Frentress, Green, Stone, and Fishtrap Lakes) to determine their spring movements out from backwaters. Fifty white crappie were transmittered in each backwater in November 2009, after water temperatures had fallen below 10oC following methods of Steuck (2006). After water temperature falls below 10oC, centrarchids begin moving into overwintering areas (Steuck 2006), and fish captured within a known overwintering backwater at this time will presumably reside there over the winter. Fish were tracked intensively for one year and every fish was located once every two weeks. Kernel methods in the Home Range Extension (HRE) for ArcView were used to construct utilization distributions (UD) around individual backwaters by pooling the points from all fish tagged in that backwater (Rogers and Carr 1998). The 80% utilization contour for each backwater was quantified and mapped. The relationship between the area of the 80% UD and the size of the overwintering backwater using correlation analysis was explored. The influence of backwater landscape features such as proximity to the main channel, position in the pool or side channel complex, or proximity to other overwintering backwaters and their effects on the UD were observed, but not tested. Changes in the UD through the wither season or in response to other environmental factors (dissolved oxygen sags, changes in temperature, water level fluctuations, etc.) were also explored. Specifically, the work included in this proposal will consist of another pre-construction radiotelemetry monitoring effort using white crappie in two backwater lakes proposed for rehabilitation as part of the HREP (Stone and Tippy Lakes), as well as one backwater lake in Pool 12 that is not included in planned rehabilitation efforts as a control (Greens Lake). Rehabilitation in Tippy Lake was not originally planned as part of the Pool 12 Overwintering HREP. Rehabilitation of Fishtrap Lake was dropped from the
6
construction plan due to contaminated sediment issues, and Tippy Lake was added to the HREP to replace it. Work in this proposal will replicate the telemetry work conducted in 2010, but will add Tippy Lake to the study design. Another year of pre-construction telemetry data is desired to validate and assess the information that was collected in 2010. At least two years of post-construction radio tracking of white crappie is planned to assess how the centrarchid fishery responds to the features of the completed HREP. Project funds will be used for purchase of telemetry tags, boat and truck fuel, and to hire two seasonal employees for tracking fish and data entry. Field work (capture fish and affix transmitters, then track the fish throughout the year) and annual summary reports are milestones and products of this work. Fieldwork and data collection will be conducted in the first year (November 2014 through September 2015). Data will be analyzed and a report written in FY16. Relevance of research to UMRR: The Pool 12 Overwintering HREP is being designed and implemented using active adaptive management principles to assess fisheries benefits beyond individual backwaters, whereas prior HREP monitoring considered centrarchid condition and behavior within specific backwaters. This work ultimately aims to answer long-standing questions related to the spacing of fish overwintering HREP projects, and this is an ideal case to attempt this assessment for the reasons mentioned in the Introduction. Through this work, along with annual pool-wide electrofishing and backwater netting, Iowa DNR will have several years of pre-HREP project and post-HREP project fisheries data that will inform the adaptive management process that many UMRR partners are interested in as the UMRR evolves. The pre- and post-dredging fisheries monitoring of this HREP will inform other river managers who are working on topics such as standardized HREP monitoring protocols (USACE and USGS), bluegill overwintering models (USACE), and research frameworks associated with aquatic overwintering issues in the Upper Mississippi River Basin (USGS). This work falls within the USACE’s priority research areas for FY15. Ultimately, the results of this project will aid mangers in identifying overwintering habitat needs within a pool. For example, managers could use the results to estimate the UD of existing overwintering sites within a pool, identify gaps where habitat is needed, and quantify restoration needs. Additionally, observations made on landscape feature effects upon UDs will aid in selecting sites of future overwintering rehabilitations to maximize project benefits. Lessons learned from this work will increase UMRR knowledge regarding fish movement in and among backwater lakes in a side-channel/backwater complex. Information learned here will be incorporated into regional planning for HREPs and other river management activities. Use of project features, such as dredge cuts, can be validated and the distance between project features will be formally evaluated for the first time. Methods: This proposal will provide another year of pre-project centrarchid telemetry in two lakes that will be rehabilitated. Many of the methods used in the FY2010 radio tracking study will be repeated; please note that these are covered in the Background discussion of this document. In this study, a total of 150 white crappie will be transmittered in three overwintering backwaters in Pool 12: Stone, Tippy, and Greens Lake. Stone and Tippy Lakes will be rehabilitated in the next phases of the Pool 12 Overwintering HREP, and Greens Lake will serve as a control (non-rehabilitated lake). Fifty fish will be transmittered in each backwater after water temperatures have fallen below 10oC. Fish will be tracked intensively for a period of one year and every fish will be located once every two weeks. By stratifying the year into two-week segments and locating every fish within each two-week period, issues of autocorrelation of animal locations will be avoided (Otis and White 1999, Fieberg 2007). For each crappie location, position will be recorded with a GPS unit and dissolved oxygen, temperature, depth, secchi, and flow will be measured. This design will potentially yield 50 locations per two-week sample period (1,300 annually) per backwater. The 80% UD utilization contour for each backwater will again be quantified and graphed, using Kernel methods in the Home Range Extension (HRE) for ArcView. We will also again explore how landscape features such as the main channel, position in the pool or side channel complex, or proximity to other overwintering backwaters affects the UD. Special needs/considerations, if any: Radio tags need to be purchased by October 15, 2014. The first seasonal worker would need to start by the end of October.

7
Budget: (See Science in Support of Management budget spreadsheets for details) Iowa DNR Bellevue Field Station: $49,224 USGS Pass Through: $ 1,477 USACE – Chuck Theiling: $10,320 TOTAL: $61,021 Milestones and products:
Tracking number
Products Staff
Milestones
2015AM1 Capture fish and affix radio tags to white crappies in study lakes
Bierman, Hansen, Bowler, Theiling
November 2014
2015AM2 Location of tagged fish and update in-house project database
Bierman, Hansen, Bowler, Theiling
Ongoing through FY
2015AM3 Complete tracking portion of study
Bierman, Hansen, Bowler, Theiling
30 September 2015
Note: Analysis of tracking data and quantification of 80% UDs, and summary reports would be completed in FY16. References: Fieberg, J. 2007. Kernel density estimators of home range: smoothing and the autocorrelation red
herring. Ecology 88:1059-1066. Otis, D. L., and G.C. White. 1999. Autocorrelation of location estimates and the analysis of radio
tracking data. Journal of Wildlife Management 63:1039-1044. Rogers, A.R., and A.P. Carr. 2002. HRE: The home range extension for ArcView user manual. Centre for
Northern Forest Ecosystem Research, Ontario Ministry of Natural Resources 27pp. Steuck, M.J. 2006. An evaluation of winter habitats used by bluegill, black crappie, and white crappie in
Pool 13 of the Upper Mississippi River. Iowa Department of Natural Resources, Federal aid to fish restoration annual performance report: Mississippi River investigations, Project F-160-R, Study 7021, Des Moines.
Detailed information on the adaptive management plan can be found in the Definite Project Report (DPR) for the Pool 12 Overwintering HREP at: http://www.mvr.usace.army.mil/Portals/48/docs/Environmental/EMP/HREP/MVR/Pool12Overwintering/18MAR2013%20-%20Pool%2012%20%20Final%20DPR%20-%20Main%20Report%20and%20APP%20and%20PLATES.pdf

8
Fish Indicators of Ecosystem Health Previous UMRR LTRM project: This effort will build upon the recommendations provided in the Analysis Team Indicators Ad Hoc Committee Special Committee on Fish Indicators for Status and Trends Assessments Final Report (Appendix C)1, of the Analysis Team Final Indicator Report (2013)2. These reports provided recommendations on advancement of fish indicators for status and trends assessment in the Upper Mississippi River System, and includes the A-Team’s priorities and recommendations for additional indicators (i.e., backwater assemblage). Name of Principal Investigator: Kat McCain, USACE Collaborators: Shane Simmons, USACE; Quinton Phelps, MDC – Big Rivers & Wetlands Field Station; Andrew F. Casper, INHS – IL River Biological Station; Brian Ickes, UMESC; Ben Schlifer, UMESC; Introduction/Background: The fish indicator subgroup report (Appendix C of the 2013 Indicator Report) addressed (1) defining what constitutes a healthy UMRS ecosystem (from a fisheries point of view); (2) providing recommendations for indicating fish community health attributes and for making data-informed judgments on their status and trends; and (3) making recommendations for additional indicators to consider and/or additional analytical work that may be needed in either selecting additional indicators or optimizing their implementation. The proposed activity for FY2015 would review the recommendations provided in the 2013 Indicator Report, and pursue the “high priority” recommendations of exploring assemblage-based indices, specifically for backwater (or off-channel) habitats, channel habitats, and migratory fishes. We propose to develop the 3 recommended fish assemblage indicators (backwater/off-channel; migratory; and channel), based on the existing LTRM fish database. Of these three the highest priority would be to focus on the backwater/off-channel assemblage indicator first. This will entail determining if any particular candidate specie(s) for an indicator assemblage are study reach-specific. Presence/absence/abundance of specific species would be evaluated throughout the last 20 years to capture/track changes in community composition annually for each assemblage in each study reach. After a set of species has been identified for the different assemblages, these assemblages would then be shared with the Analysis Team. The next step would be to conduct a pilot analysis of patterns and trends and whether any are linked to any UMRR sponsored activities (number, type, or density of HREPs), or to external factors (invasive species, flood/drought occurrences, climate regime3). Draft recommendations for the “best attainable” or target for each assemblage indicator from an ecosystem health perspective would be developed and shared with the Analysis Team. These draft targets will be based on best available data and current understandings. These targets will be flexible in terms of adjusting them as new data and understandings are gained in the future. The fish indicator subgroup defined a healthy fish community in the UMRS as diverse (containing a variety of species), not dominated by just a few species, containing representative of most of the functional groups, and comprised mostly of native species. Fish communities represent the habitats and conditions that exist in the river, which are now, and were historically, different among reaches. 1 Ickes, B.S., A. Bartels, M. Bowler, K. Cook, K. Hansen, D. Henry, L. Kring, J. Ridings, and K. Stauffer. 2010. Special Committee on Fish Indicators for Status and Trends Assessments Final Report 30 July 2010. UMRR LTRM Analysis Team Indicator Ad Hoc Committee. Appendix C of Hagerty & McCain 2013. Available online: http://www.umesc.usgs.gov/ltrmp/documents/Indicator_report_web.pdf 2 Hagerty, K.H., and K.N.S. McCain, eds. 2013. Indicators of Ecosystem Health for the Upper Mississippi River System. UMRR LTRM Analysis Team Indicator Ad Hoc Committee. Available online: http://www.umesc.usgs.gov/ltrmp/documents/Indicator_report_web.pdf 3 Additional data sources will come from partner data sources of demonstrable quality (e.g., Q/stage= USGS or USACE, Drought = NOAA drought monitor; Temperature = various state sources).

9
Therefore, what constitutes an appropriate fish community or assemblage may be different among reaches and may change over time if habitats or other conditions change within a reach. This pilot analysis could extend into a future fiscal year through an additional LTRM science in support management and restoration proposal. In the future, if funding is available, an attempt to compare/contrast the response of the different assemblages against the responses of more traditional approaches such as comparison to single species indicators. The ultimate goals for the future analysis would be:
• to test the validity of the indicators developed; • to provide final recommendations on what the best attainable assemblage looks like for the
study reaches and the system, if appropriate; and, • to provide final recommendations on a target condition for each indicator assemblage by study
reach based on our current understanding. These final recommendations would be presented and vetted with the partnership. To test the validity of the indicators developed in FY2015, a future proposal and budget would be submitted. This proposal would include separate scenarios for validations based on funding availability:
• Physically collect new data form HREPs from each USACE district (specific HREPs identified at a later time using LTRM standardized methods.
• If no appropriate HREP is available then a randomly selected location outside of a LTRM study reach could be used using LTRM standardized methods.
• Rather than additional field sampling, validation could be performed by using a representative sample of the LTRM data for each study reach
Relevance of research to UMRR: Identifying indicators of ecosystem health has been identified as a high priority within the partnership. The main objective of this project is to advance those the priorities identified in the 2013 Indicators Report and A-Team review: determine habitat based appropriate fish indicator assemblages(s) for ecosystem health. UMRR Strategic Plan (2015-2025) Objective 2.1 – Assess and detect changes in, the fundamental health and resilience of the Upper Mississippi River ecosystem by continuing to monitor and evaluate its key ecological components of aquatic vegetation, bathymetry, fish, land use/land cover, and water quality Strategy 1: Evaluate the Upper Mississippi River’s ecological status and trends through comprehensive, integrated analyses of key ecological indicators using UMRR’s long term data This investigation would be based on using LTRM long term datasets and research. The investigation would further our understanding of ecological indicators Methods: The FY2015 effort would include reviewing the 2013 Indicator Report and other related UMR indicator work, defining the best attainable fish community/assemblage composition by study reach, and conduct a pilot analysis of patterns and trends. Proposed indicators would consider the list of “essential indicator attributes” contained in the Fish Indicator subgroup report (2013 Indicator Report; Appendix C; Chap 1, p 11)… indicators “should seek to incorporate as many essential indicator attributes as possible (specific, targeted, explicit, measureable, relevant, responsive, and clear).” In addition, suggestions for target levels among the river reaches or focal locations for any indicators proposed or suggest methods for determining target levels (including collecting or analyzing additional data, if appropriate). This would likely involve applying a variety of statistical or other quantitative approaches in order to arrive at a consensus set of indicator assemblages and interpretation of their responses over time. This may include exploring the use of time series and non-metric multidimensional scaling and trajectory analysis to assess directional shifts in assemblages or communities. As this initial effort, we intend to use a multiple or potentially quantitative and statistical approaches to develop mathematically robust and still clearly interpretable set of indicators. The end product for FY2015 would be a Project Report discussing the three assemblage indicators, species make-up by indicator and study reach, and draft targets that were developed.

10
If funding is available, the future proposal would include the compare/contrast the response of the different assemblages against the responses of more traditional approaches as well as validating the indicators with standardized sampling of either HREPs or locations outside of LTRM study reaches. The end product for the future analysis would be a Project Report discussing how the indicators developed in FY2015 responded to in-field validation and finalize them for use in future Status & Trends reports. FY 2015 Budget: (See Science in Support of Management budget spreadsheets for details) USACE (Simmons & McCain) = $15,680 Big Rivers Wetland Field Station Request – work-in kind labor for Phelps (4 weeks) = $0 INHS Field Station Gross costs $45,317 USGS (Ickes & Schlifer) = $13,072 FY 15 TOTAL PROJECT BUDGET = $74,069 Milestones and products:
Tracking number
Products Staff
Milestones
2015FI1 Preliminary set of species identified for the different assemblages by study reach submitted to A-Team as status update and for review
McCain
30 August 2015
2015FI2 Draft recommendation for the best attainable or target for each assemblage by study reach submitted to A-Team for Review
McCain
1 October 2015
2015FI3 Initial draft Project Report submitted to A-Team for review
McCain 1 December 2015
2015FI4 Final draft Project Report submitted to A-Team for review and endorsement at April meeting
McCain 1 March 2016
2015FI5 Final draft Project Report submitted to UMRR CC for endorsement at August meeting
McCain 15 July 2016
2015FI6 Final Report McCain 1 June 2016 PI (McCain) will provide quarterly project status updates

11
Plankton community dynamics in Lake Pepin, a natural riverine lake in the Upper Mississippi River Previous LTRM project: This work would build on the previous work of Completion Report 2006D7, Summary of Zooplankton in Lake Pepin, Upper Mississippi River (1993-2006) and a manuscript in progress (2013D17) Zooplankton dynamics in a natural riverine lake, Upper Mississippi River. The project would also be completed in conjunction with the proposed analysis under base project titled ‘Analysis of Lake Pepin Rotifers’, which investigates rotifer abundance, species composition, and temporal and spatial distribution. Name of Principal Investigator: Rob Burdis, Minnesota Department of Natural Resources, Lake City Field Station Collaborators: Jodie Hirsch, Zooplankton/Aquatic Invertebrate Specialist Minnesota Department of Natural Resources 500 Lafayette Rd St Paul, MN 55155-4025 651-259-5105 [email protected] For processing/analysis of the LTRM collected phytoplankton samples: BSA Environmental Services, INC. 23400 Mercantile Road Beachwood, OH Introduction/Background: Phytoplankton constitute the foundation of the food web in aquatic ecosystems and are driven by available solar energy, nutrient availability, and hydrodynamic forces such as stratification, mixing and water residence time. Phytoplankton are ideally suited for ecosystem health assessment because they have rapid reproduction rates and very short life cycles, making them valuable indicators of short-term impacts and an import component of biological monitoring programs. As primary producers, phytoplankton are directly affected by physical and chemical factors. Nutrient enrichment is one of the most common anthropogenic stresses in lakes, reservoirs and rivers. Phytoplankton can grow in abundance to the extent that they can significantly impair the recreational use and ecological health of aquatic systems. Eutrophication is a fundamental concern in the management of all water bodies and limnologists have demonstrated the strong relationship between nutrient loading and phytoplankton biomass. Cyanobacteria (blue-green algae) in particular are strongly linked to eutrophic conditions and are an environmental hazard due to toxins contained within their cells. Lake Pepin had major cyanobacteria blooms in the low-flow year of 1988 that caused large fish kills. Late summer cyanobacteria blooms in lower Lake Pepin this past year have been some of the worst we’ve seen in more than a decade. There were in fact two cases of dog illnesses this past summer near Winona, MN that were confirmed to be the result of ingestion of cyanobacteria toxins from the Mississippi River. Phytoplankton are also an important prey item for higher trophic levels and the community composition of phytoplankton can have a direct impact on the zooplankton community and ultimately the fish community. Given its important role in the ecosystem very little information is available on the Upper Mississippi River (UMR). Baker & Baker (1981) in the early eighties and a PhD dissertation (Decker, 2012) are the only recent published works on phytoplankton on the UMR. Decker’s work was done on Pool 8 during a narrow temporal spring and summer window. John Manier and Shawn Giblin have projects in progress examining LTRM phytoplankton samples; however, Giblin’s work is also on Pool 8 and Manier’s effort is in Pools 8, 13 and 26. This project would not only expand the spatial coverage of phytoplankton by providing data for Pool 4, the only LTRM UMR study pool without any phytoplankton data, but would also provide better insight into seasonal dynamics by delivering more complete temporal coverage using fixed-site data. Relevance of research to UMRR: The objective of this project is to gain further insight into the spatial and temporal dynamics of phytoplankton communities and the variables driving them on the UMR. Understanding the drivers of phytoplankton community structure and temporal dynamics, particularly cyanobacteria, on the UMR would provide valuable information to better understand and manage the ecological health of the system. The late summer cyanobacteria blooms observed in Lake Pepin this past year would make 2014 an ideal year to analyze the phytoplankton community. Analysis of recent LTRM phytoplankton samples

12
in conjunction with water quality and hydrological variables would provide an opportunity to look in-depth at this impairment, providing valuable insight into nuisance algal blooms on the UMR. Because water temperatures above 25oC tend to favor the growth of cyanobacteria over other forms of phytoplankton, we can expect cyanobacteria nuisance blooms to become more prevalent in backwater areas of the river as water temperatures continue to rise in the future. Thus it is incumbent upon us to better understand what other variables drive cyanobacteria blooms and to seek habitat project designs that minimize these blooms. Recent analysis of crustacean zooplankton in Lake Pepin has shown that water residence time is the primary driver of zooplankton community structure and abundance. This proposed effort would allow similar analysis of the phytoplankton community, elucidating the variables driving that community. This information will be pertinent to the construction design of future habitat projects on the UMR. For example, if in fact water residence time is also a primary driver of phytoplankton, particularly cyanobacteria, consideration of this hydrological variable in the design of habitat projects will be warranted given its potential importance to phytoplankton community structure and abundance and the resulting water quality. Phytoplankton dominated systems often result in turbid, low clarity environments that inhibit submersed aquatic vegetation growth whereas the goal of many habitat projects is to increase water clarity and submersed vegetation. Information gained from this type of study could become the basis for a more thorough understanding of ecosystem function and process on the UMR, which in turn should help guide restoration designs. Phytoplankton communities in large rivers have also been shown to be structured biologically, further complicating the dynamics of plankton communities. For example, zooplankton can exert ‘top down’ controls on the phytoplankton community through grazing while the availability of quality phytoplankton can have a ‘bottom up’ effect on the zooplankton community. A long term crustacean data set and recent rotifer samples are available at LTRM sites in Lake Pepin providing a unique opportunity to examine the entire plankton community. Phytoplankton analysis would augment current research on crustacean zooplankton in Lake Pepin, which suggests some seasonal biological control of cladocerans, and may help to elucidate interactions that may be occurring at the different trophic levels of the plankton community. In addition, this effort would complement the phytoplankton analysis ongoing in Pools 8, 13, and 26 by allowing longitudinal comparisons of composition and abundance for all the key pools on the UMR. Multivariate analysis would provide a framework within which the patterns of phytoplankton communities could be interpreted. Furthermore, phytoplankton is the only water quality variable collected by the LTRM that does not have full spatial data coverage in the six study pools. This project would also provide a very comprehensive baseline of the plankton community prior to establishment of Asian carp, which has the potential to substantially alter plankton community structure in the system. Specific research framework citation: Strategic and Operational Plan for the Long Term Resource Monitoring Program on the Upper Mississippi River System, Fiscal Years 2010-2014 Outcome2: Enhanced knowledge about system process, function, structure, and composition. Output 2.1: Insights about river process, function, structure, and composition based on long-term data sets. Activities 2.1a: Conduct analyses of LTRM and other data sets. Methods: Phytoplankton samples have been collected at most LTRM fixed sites on approximately monthly cycles since 1993. Eighty-eight phytoplankton samples will be analyzed for species composition and biovolume estimates. Samples would be from the four fixed sites in Lake Pepin over a three year period (2012-2014). Samples collected from May to October would be analyzed and would be paired with simultaneously collected crustacean and rotifer zooplankton samples as well as LTRM water quality samples. Analysis will use Primer software to examine spatial and temporal patterns in the plankton community. Further analysis will utilize the existing LTRM water quality data set and a water residence time model to test environmental variables for their influence on plankton community structure. Phytoplankton samples would be counted by BSA Environmental Services using the membrane filter technique following methods outlined in the current version of Standard Methods for the Examination of Water and Wastewater 2012.

13
Staff time requirements: FY 2015: (1 week under LTRM base) Creation of phytoplankton data set from analyzed samples. FY 2016: (14 weeks under LTRM base) Data analysis and manuscript preparation. Budget: (See Science in Support of Management budget spreadsheets for details) Sample processing and analyses $13,143 Expected products: FY 2015: The initial product will be a three year (2012-2014) data set of Lake Pepin phytoplankton data.
Phytoplankton samples collected at four fixed sites in Lake Pepin will be processed to obtain species composition and biovolume estimates. (Completed by 09/30/15)
FY 2016: Analysis of the phytoplankton data would occur in FY 2016 and lead to a completion report or
manuscript. (Completed draft report by 09/30/16). Ideally the phytoplankton data would be analyzed in conjunction with rotifer data if previously collected rotifer samples from Lake Pepin were also processed (We have submitted an Analysis Under Base Proposal for the rotifer work for FY2015 ). Analysis of the rotifer along with phytoplankton data would result in a much higher probability of publication in a peer-reviewed journal.
Milestones and products:
Tracking number
Products Staff
Milestones
2015LPP1 Phytoplankton processing; species composition, biovolume
Burdis 30 Dec 2015
2015LPP2 draft manuscript: Plankton community dynamics in Lake Pepin
Burdis 30 Sept 2016
References: Baker, K.K. & A. L. Baker, 1981. Seasonal succession of phytoplankton in the Upper Mississippi River.
Hydrobiologia 83: 295-301. Decker, J.K., 2012 Nutrient controls on phytoplankton composition and ecological function among
hydrologically distinct habitats in the Upper Mississippi River. PhD Dissertation. Fordham University, NY.
14
Estimating Trends In UMRR Fish And Vegetation Levels Using State-Space Models Previous LTRM project: Builds on 2014E1 (Long-term trend reporting, water quality component) and 2014E2 (Water quality web
page: Depiction of trend estimates on water quality graphical browser pages). Names of Principal Investigators: Brian Gray, statistician, US Geological Survey, 608-781-6234, [email protected] Collaborator: Yao Yin, research ecologist, 608-781-6350, [email protected], advisor. Introduction/Background: The UMRR has traditionally not reported estimates of temporal trends for fish or vegetation. An exception is the depiction of trends in fish levels as part of the 2008 UMRR-LTRM Status and Trends report (http://pubs.usgs.gov/mis/LTRMP2008-T002/). Estimating trends in fish and vegetation levels using LTRM data will be challenging for three reasons: 1) Annual fish and vegetation population levels will typically be autocorrelated: This year’s level typically reflects previous years’ levels. Failure to address autocorrelation may produce confidence intervals that are too narrow and increase the chance of incorrectly reporting trends. 2) Annual variation in sample averages from fish and vegetation data reflects not only variation we’re interested in (population variation) but also variation of lesser interest (e.g., sampling variation). We are primarily interested in trends in population variation and, consequently, teasing apart these sources of variation is important. Small numbers of samples for some strata and, for fish, strata-gear combinations amplify this challenge. 3) Temporal trends require long time periods to estimate. The LTMRP data records are long for ecological data but only begin to reach the minimum time length needed for estimating time series trends in complicated data sets (22 years for fish and 17 years for vegetation). We propose to evaluate the use of a promising method, state-space models, to estimate trends in LTMRP’s fish and vegetation indices at pool, stratum and HREP scales. This method offers the opportunity to address both autocorrelation and the need to separately address population and sampling variation. The use of state-space models has become increasingly popular in applied ecology and natural resource management (Holmes et al 2012). Annual trend estimation methodologies exist for UMRR water quality data (Gray et al. In review). Gray et al. depict trends linearly over relatively short increments (e.g., 5 or 10 year increments) and over the period of record, and smoothly varying over the period of record. Gray proposed a similar but qualitative study for vegetation indices in a UMRR Analysis Under Base proposal currently under review. Gray’s proposal will qualitatively compare different methods of estimating trends using vegetation data while conducting minimal analysis of real data; the Gray proposal focuses on vegetation indices only. In contract, this proposed project will provide an in-depth evaluation of a promising method (state-space models) using real and simulated data, and do so for both LTRM fish and vegetation components. (Simulations allow the evaluation of complex methods because the trends and variances associated with simulated data can be known.) Trend estimation is one of four UMRR-LTRM goals. Despite this, the UMRR currently does not routinely report trend estimates for fish and vegetation components. Trend estimation allows managers to quantitatively estimate changes in ecological attributes and will potentially permit the comparison of management strategies, such as HREP implementations. For example, trend analyses may allow an investigator to estimate temporal trends in a HREP impact area using standard LTRM monitoring data. Standard trend estimation methods do not attempt to separate sampling error from process (or system) error. State-space models permit this separation. Separately addressing sampling error will be more important when sample sizes are small—as will occur when subsetting LTRM monitoring data to estimate any change in trend with HREP implementation. In fact, the role of small sample sizes on precision of HREP-related trend estimates will represent an important component of this project.

15
Relevance of research to UMRR: We will evaluate a promising method for estimating trend estimates at pool, stratum and HREP scales using LTMRP fish and vegetation sampling data. Specifically, we will use state-space models to estimate trends in UMRR fish and vegetation indices (see the Methods section for details). Strong trends may be easily observed with minimal statistical effort. However, when large amounts of variability exist due to sampling error, annual variability and autocorrelation, more powerful techniques, such as state-space models, are needed. These models can help managers by providing trend estimates by species, stratum, and so on. State-space models may also be used to examine which sampling areas (e.g., Pools) and sampling populations (e.g., submergent vegetation and emergent vegetation) follow similar trends. Our project will help both managers and scientists better estimate trends in the UMRR. Additionally, trend estimation helps scientists generate hypotheses for future research on the River. River managers and UMRR partners need to understand and quantitatively compare fish and vegetation trends. This project will help by evaluating and developing a methodology for doing so, and by then providing trend estimates for the fish and vegetation data browser pages. The proposed methodology proposes to also help managers evaluate trends before and after HREP activities. Project supports: Output 1.1, Strategic and Operational Plan for the LTRM on the UMRS, FY 2010-2014 (“Status and trends information based on long-term data sets for aquatic vegetation, water quality, fish, and land use/land cover”). Methods: We will estimate and present trends from actual LTRM fish and vegetation data using state-space models and, for comparison, using models that are simpler than state-space models. State-space models currently are used by agencies such as NOAA to detect trends in fisheries and marine mammal populations (data which are similar to LTRM data in complexity and variability); NOAA has published their tools and example data as a statistical package (http://cran.r-project.org/web/packages/MARSS/index.html). For example, NOAA was interested in estimating the trend of four harbor seal populations off the Washington coast (Figure 1). In addition to estimating population trends through time, NOAA estimated correlations between populations trends (Table 1). These results helped NOAA and managers because they indicated not only a general population trend (upwards and then stabilizing), but also the relationships between different populations (an important consideration for their management objectives).
Figure1 (left): Trend data for four populations of harbor seals estimated with a state-space model. Table 1 (right): Estimated correlations between harbor seal population trends. “nc” denotes the North Coastal population, “is” the Inland Straits population, “ps” the Puget Sound population, and “sc” the South Costal population. A correlation of 1 or -1 implies a perfect linear relationship between two populations while a correlation of 0 implies no correlation between two populations.
nc is ps sc
nc 1.00 0.60 0.64 0.92
is 0.60 1.00 1.00 0.23
ps 0.64 1.00 1.00 0.28

16
We also plan to simulate data similar to those collected by the LTRM fish and vegetation components. Sample sizes at the pool, stratum, gear and HREP island scales will approximate those associated with both components—as will number of years of sampling. Trend, temporal autocorrelation and annual variation values will be selected to bracket those thought to be reasonable for select species monitored by both components. Many such datasets—e.g., 500 or 1000—will be generated. We will then estimate trends from these datasets using state-space models (as did NOAA) and using other simpler models. Bias and precision of typical trend estimates will be presented by model (state-space or other), data type (fish counts, and vegetation categories), sample sizes, and values of trend, temporal autocorrelation and population variances. An optional portion of the proposed work would provide trend estimates for the fish and vegetation web browser pages. Trends would be estimated using the modeling method that yielded the best combination of accuracy and precision in the simulations described above. Trends would be presented either as visual overlays (with confidence bands), as text or both. Budget: (See Science in Support of Management budget spreadsheets for details) Base project $20,629 (gross) and an optional component, providing trend estimates for the fish and vegetation web browser pages, adds $23,801 (gross). Total budget = $43,490. Milestones and products:
Tracking number
Products Staff
Milestones
2015SST1 Draft completion report: Evaluation of trend estimation methods for LTRM fish and vegetation indices
Gray 30 Sept 2015
2015SST2 Final completion report: Evaluation of trend estimation methods for LTRM fish and vegetation indices
Gray 31 Dec 2015
2015SST3 Provide trend estimates for fish and vegetation web browser pages
Gray, Schlifer 30 Sept 2016
References Gray BR, JN Houser and JT Rogala. In review. Trend estimation methods for LTRM water data. UMRR
report to the US Army Corps of Engineers. Holmes EE, EJ Ward and K Wills. 2012. "Marss: Multivariate autoregressive state-space models for
analyzing time-series data." The R Journal 4: 11-19. Johnson BL and KH Hagerty, editors. 2008. Status and trends of selected resources of the Upper
Mississippi River System. U.S. Geological Survey, Upper Midwest Environmental Sciences Center, La Crosse, Wisconsin, December 2008. Technical Report LTRMP 2008-T002. 102 pp + Appendixes A–B.

17
Generating and serving presumptive habitat maps for 28 UMRS fish species Previous LTRM project: Ickes et al (2014) Name of Principal Investigator: Enrika Hlavacek, UMESC Collaborator: Brian S. Ickes, UMRR/USGS/UMESC/LTRM Introduction/Background: Environmental management actions in the Upper Mississippi River System (UMRS) typically require pre-project assessments of predicted benefits under a range of project scenarios. The U.S. Army Corps of Engineers (USACE) now requires certified and peer-reviewed models to conduct these assessments. Previously, habitat benefits were estimated for fish communities in the UMRS using the Aquatic Habitat Appraisal Guide (AHAG v.1.0; AHAG from hereon). This spreadsheet-based model used a habitat suitability index (HSI) approach that drew heavily upon Habitat Evaluation Procedures (HEP; USFWS 1980) by the United States Fish and Wildlife Service (USFWS). The HSI approach requires developing species response curves for different environmental variables that seek to broadly represent habitat. The AHAG v.1.0 model uses species-specific response curves assembled from literature values, data from other ecosystems, or best professional judgment. A recent scientific review of the AHAG indicated the model's effectiveness is reduced by its dated approach to large river ecosystems, uncertainty regarding its data inputs and rationale for habitat-species response relationships, and lack of field validation (Abt 2011). The reviewers made two major recommendations: (1) incorporate empirical data from the UMRS into defining the empirical response curves, and (2) conduct post-project biological evaluations to test pre-project benefits estimated by AHAG. The first of these recommendations has been addressed (Ickes et al. 2014). In 2014, Ickes et al. (2014) reported upon a new set of habitat models for 28 UMRS fish species. These models cover six long term study reaches representing 1200 miles of river and use data representing 20 years of standardized observation. Their report describes these models, the data used to generate them, and inherent assumptions that were made. The models themselves provide predictions of a species’ probability of occurrence as a function of up to 17 environmental variables measured at the LTRM fish component sample site scale. These predictions are georeferenced and “map able”. However, only example maps were provided in their report. Presumably, predictions provided by the modeling efforts of Ickes et al. (2014) can be used in both HREP project planning and evaluation. To be of greatest use in project planning, it would be beneficial if the predictions were mapped and widely available. While this work is not tied to any specific HREP, it arguably has great relevance to all future HREPs and their design criteria and evaluation. HREP’s, by their nature, modify space in ways and can be viewed as a selective force for particular species and groups of fishes that may have higher or lower social value (manage for or against assorted species). Often, HREP’s are justified, in part, by presumptive fisheries benefits. This work will provide predictive maps of species occurrence for each well-fit model, useful for these project planning and evaluation purposes. Relevance of research to UMRR: Our objective is to produce and serve maps of predictions arising from the models of Ickes et al. (2014). This is a technical support proposal, one that serves HREP planning and evaluation tasks. Having maps of fish species occurrence predictions would be useful for objectively siting a project and likely will prove useful in gauging prospective changes in response to HREP project emplacements as assorted design details are considered. These maps may in the future also form the basis of project evaluations (see conclusions in Ickes et al. 2014). This project builds upon the efforts of Ickes et al. (2014), enabling a step and task that could not be achieved in the 2014 annual program increment. Maps would be served on the UMRR LTRM Fish component homepage and made available to all and any interested parties with simple web access. As a habitat restoration and environmental monitoring program, the UMRR frequently seeks to incorporate multiple design criteria into its habitat projects and to bring unprecedented empirical

18
observations into design considerations. This work will provide visually-enhanced results (maps) that relate to and portray the habitat selection of 28 fish species across 1200 miles of river. Strategic and Operational Plan for the Long Term Resource Monitoring Program on the Upper Mississippi River System, Fiscal Years 2010-2014: Specifically Outcome 1: Enhanced knowledge about system status and trends; Output 1.1: Status and trends information based on long-term data sets for aquatic vegetation, water quality, fish, and land use/land cover. Outcome 2: Enhanced knowledge about system process, function, structure, and composition; Output 2.1: Insights about river process, function, structure, and composition based on long-term data sets. Enhancing Restoration and Advancing Knowledge of the Upper Mississippi River; A Strategic Plan for the Upper Mississippi River Restoration Program 2015 – 2025; specifically Goal 2 Advance knowledge for restoring and maintaining a healthier and more resilient Upper Mississippi River ecosystem; Objective 2.1 Assess, and detect changes in, the fundamental health and resilience of the Upper Mississippi River ecosystem by continuing to monitor and evaluate its key ecological components of aquatic vegetation, bathymetry, fish, land use/land cover, and water quality; Strategy 1 Determine the Upper Mississippi River’s ecological status and trends through comprehensive, integrated analyses of key ecological indicators using UMRR’s long term data and Strategy 2 Conduct scientific analysis, research, and modeling using UMRR’s long term data, and any necessary supplemental data, to gain knowledge about the Upper Mississippi River ecosystem status and trends and process, function, structure, and composition. Indicators of Ecosystem Health for the Upper Mississippi River System. Specifically Ickes et al. Special Committee on Fish Indicators for Status and Trends Assessments. Methods: Spatially-explicit model predictions will be mapped using a GIS for each regional model and species for which Ickes et al. (2014) could gain a certifiably good fit. Ickes et al. (2014) provided three examples of mapping approaches (see Figures 2, 3, and 4 therein). While the assumptions of the statistical models used to generate the predictions apply to the site-scale predictions, mapping these predictions requires adopting new assumptions associated with spatial interpolation of the statistical model predictions. For that reason, I propose generating maps as portrayed in Figure 4 in Ickes et al. (2104), using “splines with barriers (SWB)” interpolation algorithms. SWB interpolation is the most conservative interpolation method identified in Ickes et al. (2014), and requires adopting the fewest, yet most robust, assumptions as the predictions are mapped. Budget: (See Science in Support of Management budget spreadsheets for details) $10,786 Milestones and products:
Tracking number
Products Staff
Milestones
2015FI1 Assemble requisite data resources Ickes 28 Feb 2015 2015FI2 Generate “point” maps of predictions Hlavacek 30 March 2015 2015FI3 Generate “splines with barriers”
interpolated maps Hlavacek 15 May 2015
2015FI4 Post maps to the UMRR LTRM fish component homepage
Ickes 15 June 2015
2015FI5 Issue/publish a brief communication on their availability and prospective usage
Ickes 15 Sept 2015
References Ickes, B.S., Sauer, J.S., Richards, N., Bowler, M., and Schlifer, B., 2014, Spatially explicit habitat models
for 28 fishes from the Upper Mississippi River System (AHAG 2.0) (ver. 1.1, July 2014): A technical report submitted to the U.S. Army Corps of Engineers’ Upper Mississippi River Restoration-Environmental Management Program, Technical Report 2014–T002, 89 p., http://pubs.usgs.gov/mis/ltrmp2014-t002/.

19
Predictive Aquatic Cover Type Model – Phase II Previous LTRM project: The second phase of the predictive aquatic cover type model would be a continuation of efforts currently taking place. Investigators have developed empirical equations to predict the likelihood of occurrence for submersed aquatic, rooted floating-leaf, and emergent vegetation in Pool 8 of the Mississippi River. Work to apply the model in Pool 3 is underway and is expected to be complete this fall. It is anticipated that the model will be used to predict aquatic vegetation for the North and Sturgeon Lake HREP in Pool 3 and will be approved for one-time use for the project by the Eco-PCX. Name of Principal Investigator: Yao Yin, UMESC Collaborators (Who else is involved in completing the project): Name: Jim Rogala, UMESC; Derek Ingvalson, USACE Introduction/Background: Please address all of these questions: Fish and other wildlife on the Upper Mississippi River depend on aquatic vegetation for food and refuge. Aquatic vegetation can also enhance water quality by cycling nutrients and adding dissolved oxygen. Predicting the response of aquatic vegetation to proposed project features can be a slow and tedious process that involves a high level of uncertainty. Using mathematically based formulas to predict the occurrence of vegetation can lessen that uncertainty and provide spatial outputs of aquatic cover for habitat analysis. Incremental analysis of plan costs and benefits can be evaluated across alternatives to aid in the identification of a recommended plan. Predictive aquatic vegetation models have been used in the past on Pool 8 and are currently being developed for use on the North and Sturgeon Lake HREP in Pool 3. Relevance of research to UMRR: The main objective of the model is to provide biologists and planners with a tool that will improve and simplify the prediction of aquatic vegetation on the Upper Mississippi River. The outputs would be able to provide the user with spatial outputs for use in habitat analysis. Phase I involved the advancement of a Pool 8 submersed aquatic vegetation model to include additional vegetation types and the adjustment for use in Pool 3. The bulk of the work in phase II would involve the examination of data from other pools and making additional adjustments to increase the capabilities of the model to a regional scale. The LTRM Strategic Plan had identified a number of priorities that could be addressed by the proposed work to the predictive aquatic vegetation model:
• LTRM Strategic Plan Outcome 1 – Enhance knowledge about system status and trends o Output 1.1: Status and trends information based on long-term data sets for
aquatic vegetation, water quality, fish, and land use/land cover. The model would be based on the statistical analysis of LTRM datasets
and research. The model would predict vegetation trends using statistical analysis.
• LTRM Strategic Plan Outcome 3 – Enhanced use of scientific knowledge for implementation of ecosystem restoration programs and projects
o Output 3.1: Use of LTRM infrastructure, data sets, and expertise to help formulate, design, and evaluate ecological restoration projects Development of this model would use LTRM data, staff, and utilize tools
previously developed under LTRM (i.e., Wind Fetch/Wave Tool). The development of the model would utilize the scientific knowledge of
LTRM personnel and promote the use of their research. The model would be used to formulate, design, and evaluate HREP
projects.
• LTRM Strategic Plan Outcome 4 – Enhanced ecological understanding to inform decisions
20
o Output 4.1: Key decisions are informed by LTRM data, research, and decision support tools The model would be based on LTRM data and research. The model
outputs would be used support HREP plan selection. Methods: Phase I used Pool 8 data to develop empirical equations to predict the occurrence of vegetation types. Preliminary testing within the pool has produced outputs very similar to those captured by LTRM data. Since the model will be used to plan projects outside of Pool 8, Pool 13 was used to test if the equations held true in other pools. The testing revealed that the model was under-predicting in Pool 13. The cause appears to be the flow velocity influence. The coefficient developed using Pool 8 data results in too large of a negative effect on SAV when applied to Pool 13. In phase II, we would be looking for a solution to the flow velocity variable of the model. We hope to acquire standard output of flow velocity models for Pools 4, 8, and 13 at a variety of discharges to identify criteria for flow velocity. This would allow the same model to work at different river reaches. The standardization of Pool 8 flows would require the modification of existing hydraulic models, whereas the flow velocity models for upper Pool 4 and Pool 13 would require entirely new efforts. An optional third phase (FY16) would wrap-up the work completed in phases I and II of this project by making a user-friendly model interface for predicting the occurrence of aquatic vegetation. Along with the working model, model documentation and a user manual would be produced to assure proper use of the model. The documentation would also provide the majority of information required for submitting the model to the Eco-PCX for regional model certification. Budget: The budget for the project is dependent on the level of hydraulic modeling performed to gain information on velocities. Ideally, both Pool 13 and upper Pool 4 would be modeled in phase II. However, the 2 dimensional modeling is expensive and funding may not be available for both. Upper Pool 4 has been prioritized ahead of Pool 13 if only one pool were to be modeled. Below are the requested funding amounts broken down by level of 2D hydraulic modeling. Selected Option:
• Vegetation model analysis with 2D modeling of upper Pool 4 only - MVP $ 54,900 - UMESC $ 59,722 [added $7,814 to contract cost 4-6-15] TOTAL $116,348 [updated cost = $122,436]
Milestones and products:
Tracking number
Products Staff
Milestones
2015AQ1 Develop 2-D hydraulic model of upper Pool 4
Goodfellow (MVP H&H)
30 Sept 2015
2015AQ2 Apply model to Pool 4 and resolve discrepancies
Yin, Rogala 31 Dec 2015
2015AQ3 Detailed summary of work for Phases I & II Yin, Rogala, Ingvalson 31 Dec 2015

21
Landscape Pattern Research on the Upper Mississippi River System: Synthesis and Significance, FY 2016-2018
Previous LTRM Projects: 2008-2009: Landscape ecology indicators applied to the Upper Mississippi River System 2010-2012: Development of landscape pattern indices for the Upper Mississippi River System 2013-2015: Landscape pattern research and application on the Upper Mississippi River System Name of Principal Investigator: Nathan R. De Jager, USGS, 608-781-6232, [email protected] Collaborators (Who else is involved in completing the project): This proposal supports the continued work of N.R. De Jager on the landscape patterns research framework. Additional funds are requested to support student assistance conducting research on effects of local management actions. Funding to support student research assistants will be matched 100% by the University of Wisconsin-La Crosse. Introduction/Background: The Upper Mississippi River Restoration Program’s landscape patterns research framework (De Jager 2011) described research activities that would lead to the development of a suite of quantitative measures that can be used to: 1) track status and trends of landscape patterns that affect various ecological processes (e.g. community succession and nutrient cycling), 2) identify areas for restoration on a systemic basis, and 3) develop a better understanding of the ecological consequences of modifications to landscape patterns in the contexts of ecosystem restoration and climate change. The first objective of the research framework was to develop measures of landscape structure to capture general aspects of ecosystem function, for the purpose of identifying areas for ecosystem restoration and to track status and trends at broad scales. Research into four types of landscape patterns was proposed and has been conducted: 1) patterns of floodplain inundation (De Jager et al. 2012), 2) patterns of land cover composition (De Jager et al. 2011), 3) patterns of floodplain habitat connectivity (De Jager and Rohweder 2011a), and 4) patterns of aquatic area richness (De Jager and Rohweder 2011b). In addition, a landscape indicators web browser has been developed to provide resource managers and the public a way to view the maps and metrics developed during the above studies: http://umesc-gisdb03.er.usgs.gov/landscape_viewer/indicators.aspx. The second objective of the research framework was to link the measures of landscape structure developed through the first objective with local-scale ecological properties and processes. The purpose of the second objective was to better understand the ecological consequences of changes to landscape patterns due to restoration efforts and/or climate change. Research into four types of ecological properties/processes was proposed and has been conducted: 1) floodplain community composition and succession (De Jager et al. 2012, 2013), 2) floodplain soil nutrient dynamics (De Jager et al. In Review), 3) aquatic community composition (De Jager et al. In Prep), and 4) patterns of aquatic nutrient concentrations (De Jager and Houser 2012). In addition to developing landscape indicators for the UMRS and understanding the ecological causes and consequences of variation in those indicators, it was suggested that efforts be taken to apply this knowledge to forecast effects of climate change and restoration actions on the landscape ecology of the UMR. This is a task that has yet to be undertaken. Relevance of research to UMRR: The objective of the research proposed here is to synthesize the findings of all studies conducted under the umbrella of the landscape patterns research framework in the context of alternative management and climate change scenarios. This effort is focused on linking broad-scale management decisions about the restoration of floodplain and aquatic habitats with the objectives of local-scale restoration projects under current environmental conditions and those possible under future climate change scenarios. For example, it is a goal of the UMR management community to restore lost aquatic habitats (Theiling et al. 2000). De Jager and Rohweder (2011b) show where and how such efforts could improve the diversity
22
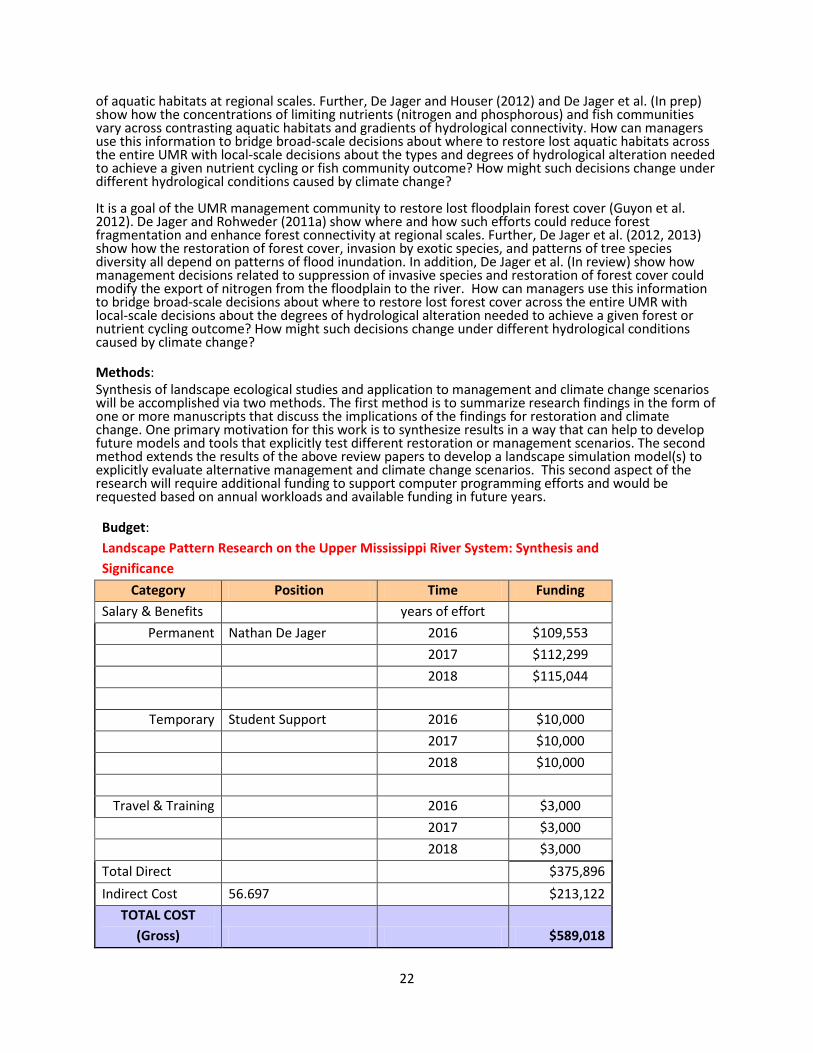
of aquatic habitats at regional scales. Further, De Jager and Houser (2012) and De Jager et al. (In prep) show how the concentrations of limiting nutrients (nitrogen and phosphorous) and fish communities vary across contrasting aquatic habitats and gradients of hydrological connectivity. How can managers use this information to bridge broad-scale decisions about where to restore lost aquatic habitats across the entire UMR with local-scale decisions about the types and degrees of hydrological alteration needed to achieve a given nutrient cycling or fish community outcome? How might such decisions change under different hydrological conditions caused by climate change? It is a goal of the UMR management community to restore lost floodplain forest cover (Guyon et al. 2012). De Jager and Rohweder (2011a) show where and how such efforts could reduce forest fragmentation and enhance forest connectivity at regional scales. Further, De Jager et al. (2012, 2013) show how the restoration of forest cover, invasion by exotic species, and patterns of tree species diversity all depend on patterns of flood inundation. In addition, De Jager et al. (In review) show how management decisions related to suppression of invasive species and restoration of forest cover could modify the export of nitrogen from the floodplain to the river. How can managers use this information to bridge broad-scale decisions about where to restore lost forest cover across the entire UMR with local-scale decisions about the degrees of hydrological alteration needed to achieve a given forest or nutrient cycling outcome? How might such decisions change under different hydrological conditions caused by climate change? Methods: Synthesis of landscape ecological studies and application to management and climate change scenarios will be accomplished via two methods. The first method is to summarize research findings in the form of one or more manuscripts that discuss the implications of the findings for restoration and climate change. One primary motivation for this work is to synthesize results in a way that can help to develop future models and tools that explicitly test different restoration or management scenarios. The second method extends the results of the above review papers to develop a landscape simulation model(s) to explicitly evaluate alternative management and climate change scenarios. This second aspect of the research will require additional funding to support computer programming efforts and would be requested based on annual workloads and available funding in future years. Budget: Landscape Pattern Research on the Upper Mississippi River System: Synthesis and Significance
Category Position Time Funding Salary & Benefits years of effort
Permanent Nathan De Jager 2016 $109,553 2017 $112,299 2018 $115,044
Temporary Student Support 2016 $10,000 2017 $10,000 2018 $10,000
Travel & Training 2016 $3,000 2017 $3,000 2018 $3,000 Total Direct $375,896 Indirect Cost 56.697 $213,122
TOTAL COST (Gross) $589,018
23
Timeline: 1 October 2016 – 30 September 2018 Expected milestones and products [with completion dates]: Manuscripts will be developed based on the proposed work. The specific form and number of manuscripts will be coordinated through the UMRR annual scope of work process. In addition to manuscripts, N.R. De Jager will present research findings at one regional UMR system forum each year, as well as one national scientific conference each year. Annual status reports will be provided each year. Literature Cited: De Jager, N.R. and Rohweder, J.J. 2011a. Spatial scaling of core and dominant forest cover in the Upper
Mississippi and Illinois River floodplains, USA. Landscape Ecology 26: 697-708. De Jager, N.R. and Rohweder, 2011b. Spatial Patterns of aquatic habitat richness in the Upper
Mississippi River floodplain, USA. Ecological Indicators 13:275-283. De Jager, N.R, Rohweder, J.J., and J.C. Nelson. 2011. Past and predicted future changes in the land cover
of the Upper Mississippi River floodplain, USA. River Research and Applications. 10.1002/rra.1615. De Jager, N.R. Thomsen, M.T., Yin, Y. 2012. Threshold effects of flood duration on the vegetation and
soils of the Upper Mississippi River floodplain, USA. Forest Ecology and Management 270:135-146. De Jager, N.R. and Houser, J.N. 2012. Variation in water mediated connectivity influences patch
distributions of total nitrogen (TN), total phosphorous (TP) and TN:TP ratios in the Upper Mississippi River, USA. Freshwater Science 31: 1254-1272.
De Jager, N.R., Cogger, B.J., and Thomsen, M.T. 2013. Interactive effects of flooding and deer browsing on floodplain forest recruitment. Forest Ecology and Management 303:11-19.
De Jager, N.R., Swanson, W., Strauss, E.A., Thomsen, M., Yin, Y. In review. Reed canarygrass invasion overrides flood-pulse effects on nitrification in an Upper Mississippi River floodplain forest. Ecosystems.
De Jager, N.R., et al. In Prep. Fish communities differ between patches of high and low total nitrogen : total phosphorous ratios in the Upper Mississippi River, USA: implications for the management of hydrological connectivity.
Guyon, L., Deutsch, C., Lundh, J., Urich, R. 2012. Upper Mississippi River Systemic Forest Stewardship Plan. U.S. Army Corps of Engineers. 124 pp.
Theiling, C.H., C. Korschgen, H. De Haan, T. Fox, J. Rohweder, and L. Robinson. 2000. Habitat Needs Assessment for the Upper Mississippi River System: Technical Report. U.S. Geological Survey, Upper Midwest Environmental Sciences Center, La Crosse, Wisconsin. Contract report prepared for U.S. Army Corps of Engineers, St. Louis District, St. Louis, Missouri. 248 pp. + Appendices A to AA.

24
DEVELOPING AND APPLYING INDICATORS OF ECOSYSTEM RESILIENCE TO THE UPPER MISSISSIPPI RIVER SYSTEM
INTRODUCTION Ecological resilience can be defined as the ability of an ecosystem to absorb disturbance and still maintain its fundamental ecological processes, relationships, and structure. The concept of ecological resilience is based on the understanding that most ecosystems can exist in multiple alternative states rather than exhibiting a single equilibrium state to which it is always capable of returning. For example, shallow lakes have been shown to exist in either a clear-water heavily vegetated condition, or a turbid condition with little or no vegetation. The magnitude of disturbance (e.g., change in nutrients or turbidity) a lake in either state could sustain and remain in that state is the ecological resilience of that system. Most management agencies are interested in quantifying the resilience of ecosystems because it can help them identify locations, scales, and degrees of management intervention needed to maintain healthy, productive ecosystems, or to shift ecosystems to more desirable states. In some cases, managers might be interested in reducing the resilience of an undesirable state (e.g., the turbid, unvegetated state above), whereas in other cases, managers might be interested in maintaining or increasing the resilience of a desirable state (e.g., the clear-water, vegetation state above). Although there exists a substantial theoretical and conceptual literature on ecological resilience and how it could inform ecosystem management, applied examples are less common. Very little work has been done to develop indicators of ecosystem resilience for large rivers. Nevertheless, many of these concepts are clearly relevant to the Upper Mississippi River System (UMRS) and the U.S. Army Corps of Engineers’ Upper Mississippi River Restoration program (UMRR). For example, the UMRS has experienced changes that have been associated with reduced resilience and shifts to undesirable states in other ecosystems. Examples of such changes include accumulation of nutrients and sediments, redirection of water flows, altered flow regimes and water elevations, changes in flood frequency and floodplain connectivity, and proliferation of non-native species. How have these changes influenced the health and resilience of the UMRS? The UMRS also exhibits characteristics that likely contribute to its resilience and which may be augmented by various management actions. The longitudinal orientation of the river provides a diversity of climatic and environmental conditions, which might maintain the resilience of, for example, fish communities in the face of interannual variability and long term changes in climate and other ecological drivers. Some portions of the UMRS maintain extensive lateral connections and hydrogeomorphic diversity across the floodplain, which allow fish species to persist through substantial seasonal and interannual fluctuations by seeking suitable habitat in various locations. How do these hydrogeomorphic characteristics and the diversity of fish, vegetation, invertebrates, and other biota they contribute to the health and resilience of the UMRS? It is likely that management actions could alter some of the features typically attributed to resilience. For example, if connections among contrasting aquatic areas substantially contribute to the resilience of the UMRS, then how and where could managers modify hydrological connectivity (e.g., dredging, altering channel-backwater connections, island construction) to improve the resilience of desired states or reduce the resilience of undesired states? OBJECTIVES This project will be the primary responsibility of a post-doctoral scientist collaborating with scientists at the U.S. Geological Survey, Upper Midwest Environmental Sciences Center (UMESC) and scientists and managers throughout the UMRR partnership. The objectives are: 1) Establish a resilience working group to capitalize on the diversity of expertise and perspectives that
comprise the UMRR partnership. The intention is that this group will include representatives from at least one UMRR field station (TBD), the US Fish and Wildlife Service (TBD), the US Army Corps of Engineers (TBD) and the USGS Upper Midwest Environmental Sciences Center (Jeff Houser, who will serve as the project lead; Nate De Jager; and the post-doctoral scientist). This working group will be substantially involved in the formulation and conduct of this project.

25
2) Develop a clear conceptual understanding and definition of ecological resilience as applied to the UMRS. a) Small working group will develop a draft (“strawman”) conceptual model of ecological resilience
in the UMRS. b) Convene workshop to discuss and refine this model. Participants will be determined by
resilience working group. c) Small working group will refine conceptual model based on input from workshop
3) Use the conceptual model to guide: a) Development of indices of resilience for the UMRS using data from the UMRR LTRM. b) Description of the current resilience of multiple reaches of the UMRS. c) Evaluation of the factors contributing to the resilience of the UMRS
i) Where the UMRS is in a desirable state, what contributes to the resilience of that state and what management actions might maintain or increase that resilience?
ii) Where the UMRS is in a less desirable state (e.g., lack of vegetation in the lower impounded reach), what contributes to the resilience of that state and how might management actions overcome that resilience?
4) Evaluate the potential effects of HREPs on resilience of the UMRS a) Conceptually: Expand conceptual model to specifically consider what aspects of resilience may
be affected by HREPs. b) Empirically: Use LTRM data and additional data collected at selected HREPs to evaluate actual
effects observed in the field. 5) Consider how understanding derived from addressing the above objectives could inform and
improve management of the UMRS. a) How do current management actions affect the resilience of the UMRS? b) Is there potential to improve current management actions, or develop new management
actions, as a result of considering the river’s resilience? 6) Suggest ways in which ecological experiments or natural variation can be used to test our
understanding of resilience within the UMRS, and consider the potential for managing resilience through HREPs.
WORKPLAN AND DELIVERABLES We will begin by identifying the factors that most likely affect the resilience of the UMRS, and actions that might contribute to increasing resilience. This will be done via a review of existing literature and discussions with scientists and managers across the UMRR partnership. We will then work to quantify various aspects of the resilience of the UMRS to the extent possible with existing UMRR-LTRMP data. Finally, we will begin to examine theoretical and empirical descriptions of the effects management actions on the resilience of the UMRS. Results of these efforts will be communicated to the partnership via a seminar or workshop and presentations at various UMRS meetings. We will communicate results to a national and international audience via presentations at scientific conferences and in peer-reviewed publications. Milestones will be coordinated through the UMRR annual scope of work process.

26
Expected Time Line:
Activity Fiscal year Hire Post-doctoral (P.D.) researcher (mid-year) FY15 P.D. & UMESC staff discuss resilience relative to UMRS FY15 P.D. discusses resilience concepts with river managers at workshop, and ongoing UMRS meetings
FY15-16
Develop ideas for defining and measuring resilience FY15-16 Apply measures of resilience to UMRS using LTRMP data, and evaluate factors affecting resilience within UMRS
FY16-17
Consider how resilience concepts can inform and improve management of the UMRS, and ways to test resulting predictions.
FY16-17
Communicate results to partnership, and write report and manuscript FY18 Budget: 2015 2016 2017 2018 Total Salary $35,841 $73,831 $76,046 $39,164 $224,882 Benefits 30% $10,752 $22,149 $22,814 $11,749 $ 67,465 Operations* $ 3,000 $ 5,000 $5,000 $ 3,000 $ 16,000 Total net $49,593 $100,981 $103,860 $ 53,913 $308,347 Indirect costs 57% $28,118 $57,253 $58,886 $30,567 $174,824 Total Cost $77,710 $158,234 $162,746 $84,480 $483,171 *Items could include: software, post doc travel to partnership and resilience meetings and workshops; post doc travel to one scientific conference per year; travel for working group members, other resilience workshop and meeting expenses; publication expenses.